31
March 31, 2018 Quarterly Report Royal Borough of Kensington and Chelsea Pension Fund

March 31, 2018 Quarterly Report
Royal Borough of Kensington and Chelsea Pension Fund

Table of Contents
Confidential Quarterly Report-Q1'18
Adams Street Partners has provided this report (the “Report”) to the recipient on a confidential basis for purposes of monitoring the recipient’s Adams Street Partners investments. This Report contains highly confidential information, including trade secret information, that is proprietary to Adams Street Partners and/or underlying funds and/or portfolio investments. In accepting the Report, the recipient agrees that it will (i) not copy, reproduce or distribute the Report, in whole or in part, to any person or party (including any employee of the recipient other than an employee or other representative directly involved in evaluating the recipient’s investments with, or monitored by, Adams Street Partners) without the prior written consent of Adams Street Partners, (ii) keep permanently confidential all information not already public contained herein, and (iii) use the Report solely for the purpose set forth above. Numbers in this report are based on Adams Street Partners’ calculations and have not been reviewed or approved by the relevant general partners.
Royal Borough of Kensington and Chelsea Pension Fund 1
Market Update 2
Summary 4
Diversification 5
Partnership Fund Program
Executive Summary 8
Performance and Portfolio Highlights 9
Detailed Schedule of Investments 17
Notes and Footnotes 30

Market Update
Confidential Quarterly Report-Q1'18
Royal Borough of Kensington and Chelsea Pension Fund 2
The first three months of 2018 were characterized by increased volatility. Global public equity markets softened after a strong start to the year, driven by investor concerns about rising interest rates, inflation pressures, and escalating trade tensions between the U.S. and China. Performance results were modestly positive for private markets overall in the first quarter. Fundraising activity remained strong by historical standards, though below the elevated levels of last year. Deal activity experienced its most active first quarter since 2007, but there was a decrease in liquidity generation via M&A activity and IPO proceeds - a trend that subsequently reversed itself in the second quarter.
While aggregate unspent capital in existing funds, particularly large/mega buyout funds, remains high, the level of new fundraising in the first quarter slowed in comparison to the previous quarter. Both buyout and venture capital totals experienced comparable declines in new funds raised. The number of buyout funds with a final close in the first quarter reached a five-year low, though the approximately $50 billion in buyout capital raised is on par with both Q1 2017 and Q1 2016 levels and well above the five-year historical average. This is evidence of a continued trend of larger buyout funds being raised in the current environment as many GPs take advantage of the healthy fundraising climate. Similarly, the number of venture funds raised was down significantly in Q1 2018, relative to the first quarters of the past four years. Unlike in buyouts, the aggregate capital raised in venture also experienced a decline.
Despite historically high valuations, the US small buyout market continues to provide attractive investment opportunities due to the depth of experienced managers and the numerous entrepreneur-owned companies in the US. So far this year, US small market managers have provided attractive exits by selling companies to larger sponsors as well as sponsor-backed strategic acquirers in search of growth. While high valuations have pushed up purchase price multiples, the use of leverage in these transactions remains modest compared to larger transactions. Economic indicators at the portfolio company level do not show any signs of a slowdown in the US economy, however our managers recognize we are likely late-cycle and are focused on investing in companies where their particular skill set can add the most value and endure an economic slowdown.
On the growth equity front, Adams Street’s funds continue to be buoyed by the strong deal flow and investment pace in Q1. Alongside our new investment activity,
we continue to seek liquidity where appropriate. While valuations remain below the extreme highs of mid-2015, significant fundraising from traditional venture firms and non-traditional groups has kept private company pricing at robust levels. Our focus remains on identifying and investing in the very best companies/teams where the risk-adjusted return profile is attractive and we believe we have good downside protection if markets turn more severely.
As always, Adams Street Partners appreciates the trust you place in our firm as we continue to employ a disciplined, integrated and long-term approach to investing in private markets. This approach has guided our investment philosophy for more than 45 years and has proven successful in an ever-changing global economy. We look forward to a continuing dialogue on future private market opportunities across geographies, strategies and subclasses. In the meantime, please don’t hesitate to contact your Adams Street investor relations representative with any questions or comments.
Source: Preqin

Confidential Quarterly Report-Q1'18
Market Update (Continued)
Royal Borough of Kensington and Chelsea Pension Fund 3
Summary of New Investments (Q2'18)
Primary Investments
Index Growth Fund IV — Index Growth Fund IV is an opportunity to invest with a leading venture franchise in Europe with a promising presence in the U.S. Index Growth is a growth stage focused venture capital fund targeting technology companies with validated business models that are located in Europe, the US and Israel. Index seeks to deploy $30-60 million per investment. The companies typically have a high growth profile, with the potential to achieve 50%+ annual growth over 5+ years.
Nordic Capital CV1 — Nordic Capital CV1 is an opportunity to invest in a highly experienced manager in the Nordic region with an impressive and stable track record both in the region and in the healthcare sector globally. Nordic Capital has consistently been a top performer in our portfolio and is one of our oldest non-U.S. relationships.
Thoma Bravo XIII — Thoma Bravo XIII is an opportunity to invest with a stable and proven U.S. technology buyout firm with a top franchise in the space. Thoma Bravo XIII will continue its strategy of investing in the U.S. mid-to-large market application/infrastructure software and technology enabled services industries. Thoma Bravo drives value by partnering with management to identify cost reduction opportunities at closing (improving margins), investing in profitable growth initiatives (including reorganizing companies into profit centers, investing in and refocusing sales, instituting industry best practices), and completing add-on acquisitions.
Secondary Investments
There were no new secondary investments made on behalf of Royal Borough of Kensington and Chelsea Pension Fund's portfolio this quarter.
Co-Investments
Mankind Pharma Ltd — Mankind Pharma is a leading domestically focused Indian pharma company selling branded generics in the acute, chronic, semi-chronic, and OTC market segments. The Company operates one of the largest distribution networks in India with access to 75%+ of India’s doctors, with particularly high penetration in rural geographies.
Direct Investments
There were no new direct investments made on behalf of Royal Borough of Kensington and Chelsea Pension Fund's portfolio this quarter.

Summary
Confidential Quarterly Report-Q1'18
Royal Borough of Kensington and Chelsea Pension Fund 4
Client Level — Key Program Metrics
Subscription Investment Amount Amount Market Value Distributions Total Value Gain Since Incep. Since Inception IRR
Program Amount Commitments Drawn1 Undrawn2 (NAV)3 Received (D) (NAV + D) 3 Inception 3 Date Gross3, 4 Net3, 5
Partnership Fund Program $120,000,000 $118,547,392 $92,197,178 $28,876,900 $76,938,131 $71,335,014 $148,273,145 $56,075,967 Jan-07 14.73% 11.58%
Grand Total $120,000,000 $118,547,392 $92,197,178 $28,876,900 $76,938,131 $71,335,014 $148,273,145 $56,075,967 Jan-07 14.73% 11.58%
Client Level — Key Subscription Ratios
Program
Committed /
Subscription
Drawn /
Subscription2
Drawn /
Committed2
Distributions /
Drawn3
Market Value /
Drawn 3
Total Value /
Drawn3, 6
Partnership Fund Program 99% 76% 77% 0.77x 0.83x 1.61x
Grand Total 99% 76% 77% 0.77x 0.83x 1.61x
Client Level — Q2'18 Activity
Transaction Type
Grand Total
Amount
Subsequent Quarter Draws1 $2,064,416
Cumulative Draws1 $94,261,594
Subsequent Quarter Distributions $2,398,380
Cumulative Distributions $73,733,394

Diversification
Confidential Quarterly Report-Q1'18
Royal Borough of Kensington and Chelsea Pension Fund 5
The following pie charts depict total portfolio exposure, for all portfolios managed or otherwise monitored by Adams Street Partners in aggregate, by subclass and geography. Exposures are shown as a percentage of investment commitments and of market value.
Partnership Subclass Partnership Geography Partnership Strategy
Partnership Subclass Partnership Geography Partnership Portfolio Company Status

Confidential Quarterly Report-Q1'18
Diversification (Continued)
Royal Borough of Kensington and Chelsea Pension Fund 6
The following chart depicts the time diversification of partnership investment commitments and partnership investment performance, both by vintage year. Also on the chart, the commitment bars are shaded to indicate the portion of the partnership investments that have been committed to each program.
Client Level — Partnership Time Diversification and Investment Performance, by Vintage Year and Program
Inve
stm
ent C
omm
itmen
ts (
in M
M)
Partnership IRR (%) 7

Royal Borough of Kensington and Chelsea Pension Fund 7
Partnership Fund Program –Royal Borough of Kensington and Chelsea Pension Fund

Executive Summary
Confidential Partnership Fund Program-Q1'18
Royal Borough of Kensington and Chelsea Pension Fund 8
Client Level — Key Fund Metrics
Since Inception IRRFund
Subscription Amount
Investment Commitments
Amount Drawn1
Amount Undrawn2
Market Value (NAV) 3
Distributions Received (D)
Total Value (NAV + D) 3
Gain Since Inception 3
InceptionDate Gross3, 4 Net3, 5
ASP 2007 US Fund $19,250,000 $19,138,401 $18,902,152 $895,125 $11,117,218 $21,108,825 $32,226,043 $13,323,891 Jan-07 14.15% 11.40%ASP 2007 Non-US Fund $12,250,000 $12,146,450 $11,703,396 $606,375 $7,171,414 $10,337,850 $17,509,264 $5,805,868 Jan-07 9.96% 7.82%ASP 2007 Direct Fund $3,500,000 $3,500,000 $3,423,822 $108,500 $2,432,058 $4,852,760 $7,284,818 $3,860,996 Jan-07 15.71% 11.40%Total 2007 ASP Subscription $35,000,000 $34,784,851 $34,029,370 $1,610,000 $20,720,690 $36,299,435 $57,020,125 $22,990,755 Jan-07 13.10% 10.25%
ASP 2008 US Fund $17,500,000 $17,490,705 $16,630,875 $1,212,750 $12,394,145 $17,982,501 $30,376,646 $13,745,771 Jan-08 18.20% 15.16%ASP 2008 Non-US Fund $14,000,000 $13,972,225 $12,832,684 $1,213,800 $11,103,071 $8,925,978 $20,029,049 $7,196,365 Jan-08 13.30% 10.72%ASP 2008 Direct Fund $3,500,000 $3,500,000 $3,430,636 $112,350 $2,926,574 $4,770,659 $7,697,233 $4,266,597 Jan-08 20.50% 15.02%Total 2008 ASP Subscription $35,000,000 $34,962,930 $32,894,194 $2,538,900 $26,423,790 $31,679,138 $58,102,928 $25,208,734 Jan-08 17.01% 13.64%
ASP 2012 Global Fund $30,000,000 $30,260,634 $21,643,614 $8,358,000 $25,452,880 $3,356,441 $28,809,321 $7,165,707 Feb-12 13.59% 10.11%
ASP 2016 Global Fund $20,000,000 $18,538,977 $3,630,000 $16,370,000 $4,340,771 $0 $4,340,771 $710,771 Dec-16 55.74% 31.69%
Partnership Fund Program Total $120,000,000 $118,547,392 $92,197,178 $28,876,900 $76,938,131 $71,335,014 $148,273,145 $56,075,967 Jan-07 14.73% 11.58%
Client Level — Key Subscription Ratios
Fund
Committed/
Subscription
Drawn/
Subscription2
Drawn/
Committed2
Distributions/
Drawn3
Market Value/
Drawn3
Total Value/
Drawn3, 6
2007 ASP Subscription 99% 95% 96% 1.07x 0.61x 1.68x
2008 ASP Subscription 100% 93% 93% 0.96x 0.80x 1.77x
2012 ASP Subscription 101% 72% 72% 0.16x 1.18x 1.33x
2016 ASP Subscription 93% 18% 20% 0.00x 1.20x 1.20x
Partnership Fund Program Total 99% 76% 77% 0.77x 0.83x 1.61x

Performance and Portfolio Highlights
Confidential Partnership Fund Program-Q1'18
Royal Borough of Kensington and Chelsea Pension Fund 9
The following chart depicts cash flows over time. Cash flows are at the client level, meaning they reflect transactions between Adams Street and Royal Borough of Kensington and Chelsea Pension Fund.
Client Level — Calendar Year Cash Flows and Net Cash Flows1
Cas
h Fl
ows
(in M
M)
Confidential Partnership Fund Program-Q1'18
Performance and Portfolio Highlights (Continued)
Royal Borough of Kensington and Chelsea Pension Fund 10
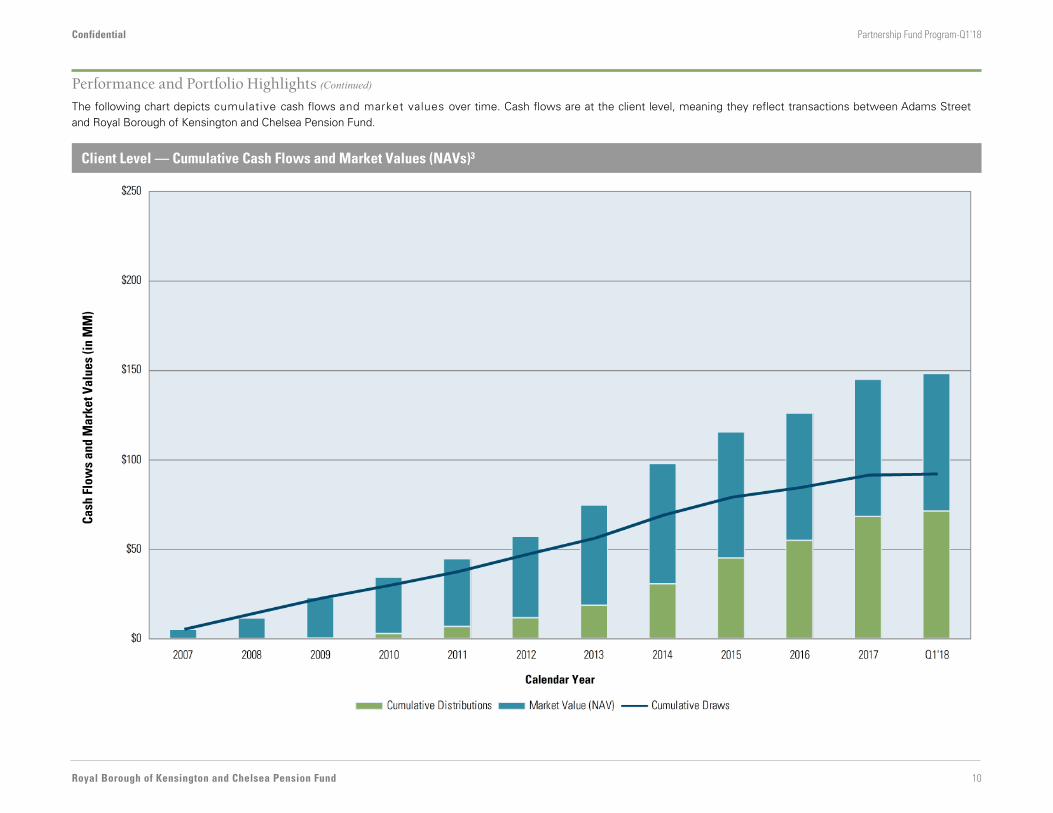
The following chart depicts cumulative cash flows and market values over time. Cash flows are at the client level, meaning they reflect transactions between Adams Street and Royal Borough of Kensington and Chelsea Pension Fund.
Client Level — Cumulative Cash Flows and Market Values (NAVs)3
Cas
h Fl
ows
and
Mar
ket V
alue
s (in
MM
)

Confidential Partnership Fund Program-Q1'18
Performance and Portfolio Highlights (Continued)
Royal Borough of Kensington and Chelsea Pension Fund 11
The following charts depict portfolio exposure by subclass, strategy, geography, industry, public or private status, and by ASP’s internal, subjective rating. For the strategy pie, if applicable, Adams Street’s Direct Funds are categorized as primary investments. Every type of investment (primary, secondary, co-investment, and direct, if applicable) is included for every chart except the partnership ratings chart, which only includes partnerships.
Partnership Subclass Partnership Strategy Partnership Geography
Partnership Portfolio Company Industry Partnership Portfolio Company Status Partnership Ratings
1 - Business Services2 - Consumer3 – Energy/Natural Resources
4 - Financial Services5 - Healthcare6 - Industrial
7 - IT8 - Other
N/A – Not Available0 - Too Early To Tell1 - Pleased With Performance
3 – Average4 - Concerned With Progress5 - Disappointed With Performance
2 - Pleased With Progress (Number of funds in bracket)

Confidential Partnership Fund Program-Q1'18
Performance and Portfolio Highlights (Continued)
Royal Borough of Kensington and Chelsea Pension Fund 12
The following chart depicts the time diversification of partnership investment commitments and partnership investment performance, both by vintage year. Regarding the latter, both the since inception IRR of partnership investments (below the chart) and total value/drawn multiple of partnership investments (on the chart), are included. Also on the chart, the commitment bars are shaded to indicate the portion of the partnership investments that have been funded versus those that have yet to be funded.
Client Level — Partnership Time Diversification and Investment Performance, by Vintage Year
Inve
stm
ent C
omm
itmen
ts (i
n M
M)
Vintage Year (IRR)7
Partnership Total Value/Draw
n8
Partnership Funded Partnership Unfunded Partnership Total Value/Drawn (TVPI)

Confidential Partnership Fund Program-Q1'18
Performance and Portfolio Highlights (Continued)
Royal Borough of Kensington and Chelsea Pension Fund 13
The following chart depicts intraperiod, annualized IRRs at the client level versus the MSCI All Country World Index (Total Return).
Client Level — Intraperiod IRRs and Public Market Equivalent (PME) Benchmark3, 9, 10
Confidential Partnership Fund Program-Q1'18
Performance and Portfolio Highlights (Continued)
Royal Borough of Kensington and Chelsea Pension Fund 14
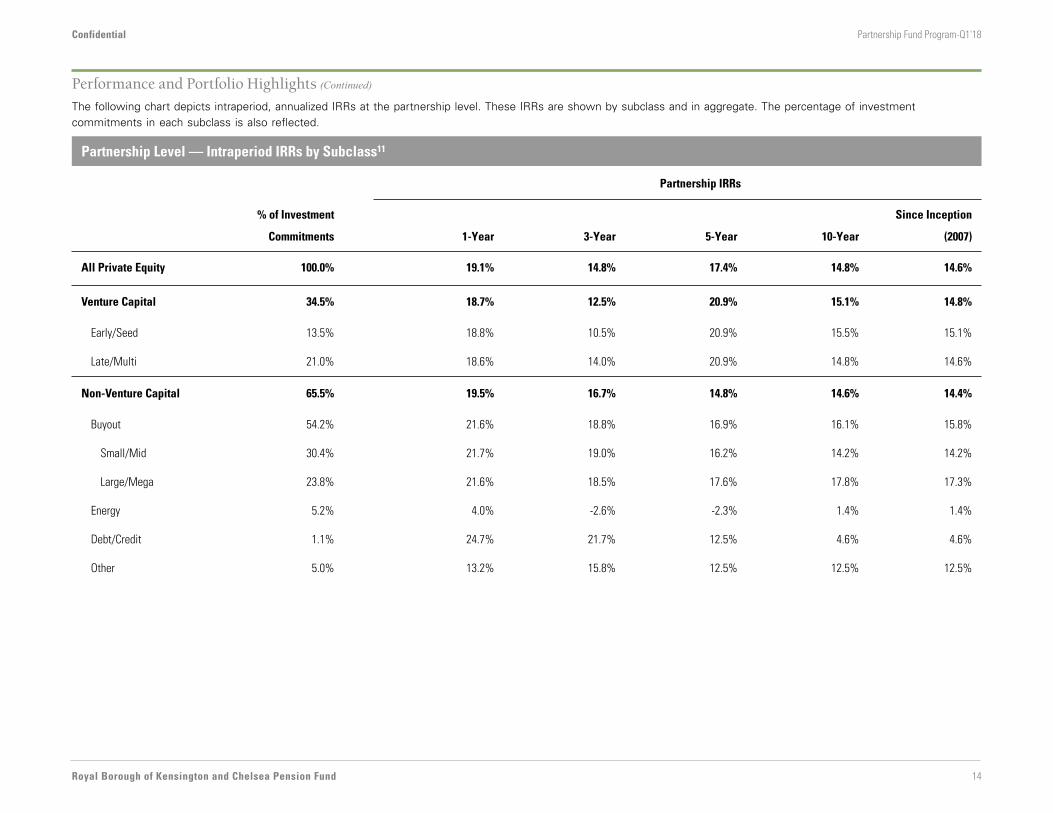
The following chart depicts intraperiod, annualized IRRs at the partnership level. These IRRs are shown by subclass and in aggregate. The percentage of investment commitments in each subclass is also reflected.
Partnership Level — Intraperiod IRRs by Subclass11
Partnership IRRs
% of Investment
Commitments 1-Year 3-Year 5-Year 10-Year
Since Inception
(2007)
All Private Equity 100.0% 19.1% 14.8% 17.4% 14.8% 14.6%
Venture Capital 34.5% 18.7% 12.5% 20.9% 15.1% 14.8%
Early/Seed 13.5% 18.8% 10.5% 20.9% 15.5% 15.1%
Late/Multi 21.0% 18.6% 14.0% 20.9% 14.8% 14.6%
Non-Venture Capital 65.5% 19.5% 16.7% 14.8% 14.6% 14.4%
Buyout 54.2% 21.6% 18.8% 16.9% 16.1% 15.8%
Small/Mid 30.4% 21.7% 19.0% 16.2% 14.2% 14.2%
Large/Mega 23.8% 21.6% 18.5% 17.6% 17.8% 17.3%
Energy 5.2% 4.0% -2.6% -2.3% 1.4% 1.4%
Debt/Credit 1.1% 24.7% 21.7% 12.5% 4.6% 4.6%
Other 5.0% 13.2% 15.8% 12.5% 12.5% 12.5%

Confidential Partnership Fund Program-Q1'18
Performance and Portfolio Highlights (Continued)
Royal Borough of Kensington and Chelsea Pension Fund 15
The following data depicts portfolio exposure by company. If applicable, Adams Street’s Direct Funds and co-investments are excluded from this analysis.
Client Level — Top 10 Company Exposures by Unrealized Value
Rank Company Unrealized Value % of Total Region Industry
1 Company A $1,828,743 2.1% United States Consumer
2 Company B $1,136,691 1.3% United States Financial Services
3 Company C $1,107,860 1.2% United States IT
4 Company D $895,580 1.0% United States Consumer
5 Company E $626,765 0.7% United States IT
6 Company F $386,899 0.4% Asia IT
7 Company G $381,144 0.4% United States IT
8 Company H $376,965 0.4% United States IT
9 Company I $375,573 0.4% Western Europe IT
10 Company J $365,452 0.4% United States IT
Total Top 10 $7,481,673 8.4%
The following chart lists the underlying partnerships that distributed the most, on behalf of Royal Borough of Kensington and Chelsea Pension Fund’s Partnership Fund Program portfolio, over the last twelve months (LTM). If applicable, Adams Street’s Direct Funds and co-investments are excluded from this analysis.
Client Level — Top 10 Distributing Funds (LTM)
Rank Partnership Distribution Amount % of Total Vintage Year Subclass
1 Partnership A $497,519 3.0% 2011 Venture
2 Partnership B $407,532 2.5% 2008 Buyout
3 Partnership C $383,655 2.3% 2008 Other
4 Partnership D $323,864 2.0% 2010 Buyout
5 Partnership E $310,831 1.9% 2010 Buyout
6 Partnership F $300,673 1.8% 2008 Buyout
7 Partnership G $287,025 1.7% 2008 Buyout
8 Partnership H $250,169 1.5% 2012 Buyout
9 Partnership I $231,952 1.4% 2007 Buyout
10 Partnership J $230,661 1.4% 2011 Buyout
Total Top 10 $3,223,880 19.6%

Confidential Partnership Fund Program-Q1'18
Performance and Portfolio Highlights (Continued)
Royal Borough of Kensington and Chelsea Pension Fund 16
The following data depicts the top 5 and bottom 5 partnership contributors to IRR, both since inception (SI) and over the last twelve months (LTM). If applicable, Adams Street’s Direct Funds and co-investments are excluded from this analysis.
Client Level — Top and Bottom Contributors to IRR (SI)12
Partnership
VintageYear Strategy Subclass
Contribution toIRR (SI)
Drawn/Committed
Distributions/Drawn (DPI)
Total Value/Drawn (TVPI) 1-Year IRR SI IRR Rating
Partnership A 2011 Primary Venture 0.69% 94% 4.04x 13.86x 18.2% 60.5% 1
Partnership B 2009 Secondary Buyout 0.67% 91% 2.00x 2.42x 31.7% 25.9% 1
Partnership C 2009 Secondary Buyout 0.33% 99% 2.23x 2.49x 10.3% 26.3% 1
Partnership D 2009 Secondary Venture 0.27% 87% 2.13x 2.44x 10.3% 33.5% 1
Top
5
Partnership E 2011 Primary Buyout 0.24% 102% 0.41x 3.70x -18.6% 37.3% 2
Partnership V 2008 Secondary Debt/Credit -0.02% 99% 0.81x 0.81x 57.8% -7.7% 5
Partnership W 2009 Primary Energy -0.03% 100% 0.27x 0.76x -7.2% -6.4% 4
Partnership X 2012 Secondary Energy -0.03% 88% 0.45x 0.62x -1.2% -16.7% 5
Partnership Y 2014 Secondary Energy -0.03% 101% 0.24x 0.47x -7.7% -25.1% 5Bot
tom
5
Partnership Z 2008 Primary Energy -0.07% 101% 0.46x 0.68x -6.4% -8.2% 5
Client Level — Top and Bottom Contributors to IRR (LTM)12
PartnershipVintageYear Strategy Subclass
Contribution toIRR (LTM)
Drawn/Committed
Distributions/Drawn (DPI)
Total Value/Drawn (TVPI) 1-Year IRR SI IRR Rating
Partnership A 2011 Primary Venture 0.62% 94% 4.04x 13.86x 18.2% 60.5% 1
Partnership B 2012 Primary Venture 0.50% 92% 0.40x 3.08x 108.5% 27.7% 2
Partnership C 2012 Primary Venture 0.41% 94% 0.79x 2.24x 57.8% 29.8% 2
Partnership D 2014 Primary Buyout 0.40% 64% 0.60x 2.31x 44.4% 40.8% 2
Top
5
Partnership E 2009 Secondary Buyout 0.40% 91% 2.00x 2.42x 31.7% 25.9% 1
Partnership V 2014 Primary Other -0.03% 46% 0.00x 0.77x -16.2% -8.7% 0
Partnership W 2014 Primary Buyout -0.04% 60% 0.00x 0.82x -12.8% -13.5% 3
Partnership X 2013 Secondary Buyout -0.08% 100% 0.00x 0.21x -79.1% -31.8% 4
Partnership Y 2009 Primary Venture -0.13% 98% 1.24x 2.66x -19.3% 19.5% 2Bot
tom
5
Partnership Z 2011 Primary Buyout -0.41% 102% 0.41x 3.70x -18.6% 37.3% 2

Detailed Schedule of Investments
Confidential Partnership Fund Program-Q1'18
Royal Borough of Kensington and Chelsea Pension Fund 17
Client Level Partnership Level
Partnership by Subclass and TypeInvestment
CommitmentsDate ofMoney Closing Subclass Type
Drawn/Committed
Distributions/Drawn
Total Value/Drawn8 IRR12 ASP Rating13
.04
Primary LBO Investments
Advantech Capital $74,863 Jan-16 LBO Emerging Markets Primary 69% 0.00x 1.97x 77.9% 2
ASP CIV (2015) (a/k/a Harwood Private Equity IV, LP Coinvestment Fund)
$158,459 Oct-15 LBO Non-US Developed Primary 10% 0.00x 2.58x 41.9% 0
TDR Capital III $669,837 Apr-14 LBO Non-US Developed Primary 64% 0.60x 2.31x 40.8% 2
Cortec Group Fund V $330,513 Apr-11 LBO US Primary 102% 0.41x 3.70x 37.3% 2
Waterland Private Equity Fund V $347,046 Aug-11 LBO Non-US Developed Primary 79% 1.49x 2.47x 36.7% 1
TA Atlantic and Pacific VII-A $535,867 Jan-14 LBO US Primary 88% 0.64x 1.86x 36.0% 2
Clearview Capital Fund III $138,783 Sep-13 LBO US Primary 56% 0.85x 2.26x 33.7% 2
Trivest V $355,813 May-13 LBO US Primary 85% 1.03x 1.85x 33.4% 2
Odyssey Investment Partners Fund IV $486,364 Dec-08 LBO US Primary 70% 3.22x 3.43x 33.4% 1
Quadrant Private Equity No.4 $170,476 Apr-14 LBO Non-US Developed Primary 98% 1.27x 1.79x 33.3% 2
G Square Capital II $161,329 Dec-16 LBO Non-US Developed Primary 56% 0.00x 1.13x 33.1% 0
Capitalworks Private Equity Fund II $108,175 Jul-13 LBO Emerging Markets Primary 78% 0.16x 1.64x 31.1% 2
TA XII-A $257,533 Feb-16 LBO US Primary 41% 0.24x 1.32x 27.6% 2
Clayton, Dubilier & Rice VIII $479,407 Jan-09 LBO US Primary 82% 2.54x 2.82x 26.9% 1
HCI Equity Partners IV $168,746 Mar-14 LBO US Primary 95% 0.07x 1.65x 26.4% 2
CMC Capital Partners $151,789 Mar-14 LBO Emerging Markets Primary 98% 0.50x 1.88x 25.0% 2
Adams Street 2012 Developed Markets Co-Investment $323,224 Mar-12 LBO Non-US Developed Primary 100% 1.34x 1.75x 25.0%14 N/A
Summit Partners Growth Equity Fund VIII-B $429,897 Jun-12 LBO US Primary 94% 0.82x 1.95x 24.5% 2
Ascendent Capital Partners II $152,802 Sep-15 LBO Emerging Markets Primary 50% 0.17x 1.29x 24.0% 2
Quadrant Private Equity III $199,798 Mar-11 LBO Non-US Developed Primary 96% 1.71x 2.09x 23.0% 2
Madison Dearborn Capital Partners VI $600,093 May-08 LBO US Primary 80% 1.58x 2.16x 22.8% 2
Eurazeo PME II $413,171 Mar-15 LBO Non-US Developed Primary 86% 0.67x 1.33x 22.6% 2
New Mountain Capital IV $599,339 Dec-14 LBO US Primary 89% 0.19x 1.43x 22.5% 2
Oakley Capital Private Equity III-B $159,604 Jun-16 LBO Non-US Developed Primary 38% 0.20x 1.08x 22.4% 2
TA Associates XI $548,615 Jul-10 LBO US Primary 98% 1.35x 2.16x 22.2% 2
Adams Street 2012 US Co-Investment $993,813 Jun-12 LBO US Primary 100% 0.67x 1.82x 21.4%14 N/A
New Horizon Capital IV $277,207 Feb-12 LBO Emerging Markets Primary 110% 0.77x 1.75x 21.2% 2
Adams Street 2016 Non-US Co-Investment $332,598 Apr-16 LBO Non-US Developed Primary 100% 0.00x 1.19x 19.9%14 N/A
ABRY Partners VI $326,868 Mar-08 LBO US Primary 89% 2.03x 2.09x 19.8% 1
Polish Enterprise Fund VII $428,896 Sep-12 LBO Non-US Developed Primary 78% 0.72x 1.70x 19.1% 2
Latour Capital I $151,998 Nov-12 LBO Non-US Developed Primary 100% 1.19x 1.67x 19.0% 1
ChrysCapital Fund VII $229,424 Aug-16 LBO Emerging Markets Primary 38% 0.00x 1.22x 18.9% 2
Advent International GPE VII-E $456,562 Aug-12 LBO Non-US Developed Primary 94% 0.49x 1.74x 18.9% 2
Renovo Capital II $149,460 Oct-14 LBO US Primary 43% 0.00x 1.20x 18.3% 0
J-Star No. 2 (Midwest Minato) $92,072 Aug-13 LBO Non-US Developed Primary 96% 1.10x 1.62x 18.1% 2

Confidential Partnership Fund Program-Q1'18
Detailed Schedule of Investments (Continued)
Royal Borough of Kensington and Chelsea Pension Fund 18
Client Level Partnership Level
Partnership by Subclass and TypeInvestment
CommitmentsDate ofMoney Closing Subclass Type
Drawn/Committed
Distributions/Drawn
Total Value/Drawn8 IRR12 ASP Rating13
.04
Mainsail Partners III $164,772 Dec-12 LBO US Primary 90% 0.71x 1.61x 17.4% 3
Advent Global Private Equity VI-A $357,332 Jul-08 LBO Non-US Developed Primary 100% 1.62x 2.10x 17.3% 1
WPEF VI Feeder $180,159 Jul-15 LBO Non-US Developed Primary 39% 0.00x 1.10x 17.1% 0
Altor Fund IV $395,646 Feb-15 LBO Non-US Developed Primary 43% 0.00x 1.20x 17.0% 0
ChrysCapital VI $254,403 Jun-12 LBO Emerging Markets Primary 97% 0.90x 1.76x 16.9% 2
Clayton, Dubilier & Rice Fund IX $424,576 Nov-13 LBO US Primary 89% 0.48x 1.35x 16.8% 2
Adams Street 2012 Emerging Markets Co-Investment $111,811 Feb-14 LBO Emerging Markets Primary 100% 0.00x 1.48x 16.8%14 N/A
Nordic Capital VIII Beta $364,858 Aug-13 LBO Non-US Developed Primary 101% 0.33x 1.37x 16.3% 3
Redview Capital $74,863 Jan-16 LBO Emerging Markets Primary 67% 0.00x 1.18x 16.2% 2
Olympus Growth Fund V $270,228 Jan-08 LBO US Primary 94% 1.67x 2.01x 15.9% 1
Summit Partners Europe Private Equity Fund $186,194 Jul-09 LBO Non-US Developed Primary 102% 0.94x 1.77x 15.4% 2
EQT VI $376,083 Jul-11 LBO Non-US Developed Primary 109% 0.95x 1.74x 15.3% 2
Altor Fund III $349,745 Jun-09 LBO Non-US Developed Primary 82% 1.34x 2.20x 15.2% 1
ABRY Partners VII $249,083 Aug-11 LBO US Primary 94% 1.37x 1.78x 15.2% 2
Genstar Capital Partners V $245,662 Jul-07 LBO US Primary 94% 1.99x 2.20x 15.1% 2
KV Asia Capital Fund I $255,528 Dec-12 LBO Emerging Markets Primary 78% 0.23x 1.40x 14.5% 2
CDH China Fund V $223,092 Nov-13 LBO Emerging Markets Primary 85% 0.20x 1.37x 14.5% 3
VIP II-B $362,485 Jan-14 LBO Non-US Developed Primary 82% 0.18x 1.46x 14.1% 2
Living Bridge 5 $366,256 Jul-12 LBO Non-US Developed Primary 87% 0.62x 1.53x 14.0% 2
Warburg Pincus Private Equity XI $535,446 May-12 LBO US Primary 97% 0.56x 1.51x 14.0% 2
STG IV $245,418 Apr-12 LBO US Primary 68% 0.25x 1.51x 13.9% 3
CVC Capital Partners Asia Pacific III $380,823 Mar-08 LBO Non-US Developed Primary 83% 1.54x 1.76x 13.7% 2
New Mountain Partners III $206,399 Aug-07 LBO US Primary 93% 1.30x 2.04x 13.5% 3
Crescent Capital Partners IV $202,447 Jan-12 LBO Non-US Developed Primary 95% 0.77x 1.78x 13.5% 2
CVC Capital Partners Asia Pacific IV $151,616 May-14 LBO Emerging Markets Primary 50% 0.13x 1.20x 13.2% 2
BC European Capital IX $396,856 Sep-11 LBO Non-US Developed Primary 104% 0.66x 1.52x 13.1% 2
Welsh, Carson, Anderson & Stowe XI $486,364 Feb-09 LBO US Primary 100% 1.11x 1.63x 12.9% 3
Adams Street 2016 US Co-Investment $662,437 Mar-16 LBO US Primary 100% 0.05x 1.15x 12.7%14 N/A
Symphony Technology Group III $183,777 Jul-07 LBO US Primary 108% 1.69x 2.01x 12.6% 4
Berkshire Partners VIII $433,022 Aug-11 LBO US Primary 96% 0.66x 1.44x 12.2% 4
Vitruvian Investment Partnership I $195,823 Apr-08 LBO Non-US Developed Primary 95% 1.33x 2.07x 11.7% 1
G Square Capital I $424,874 Jan-11 LBO Non-US Developed Primary 123% 1.27x 1.69x 11.7% 1
TPG Partners VI $598,223 Apr-08 LBO US Primary 95% 1.10x 1.61x 11.3% 3
L Capital 3 $442,516 Jul-10 LBO Non-US Developed Primary 97% 0.64x 1.49x 11.2% 2
Charterhouse Capital Partners IX $489,414 Jan-09 LBO Non-US Developed Primary 92% 1.22x 1.51x 11.2% 2
Quadrant Private Equity No. 5 $132,416 Oct-16 LBO Non-US Developed Primary 90% 0.00x 1.10x 10.8% 2
Atlantic and Pacific VI $122,831 May-08 LBO US Primary 99% 1.38x 1.66x 10.7% 3
Crescent Capital Partners III $195,791 Jul-07 LBO Non-US Developed Primary 100% 1.62x 1.68x 10.6% 2

Confidential Partnership Fund Program-Q1'18
Detailed Schedule of Investments (Continued)
Royal Borough of Kensington and Chelsea Pension Fund 19
Client Level Partnership Level
Partnership by Subclass and TypeInvestment
CommitmentsDate ofMoney Closing Subclass Type
Drawn/Committed
Distributions/Drawn
Total Value/Drawn8 IRR12 ASP Rating13
.04
Piper Private Equity Fund V $246,760 Aug-11 LBO Non-US Developed Primary 88% 0.72x 1.61x 10.3% 2
CDH China Fund IV $242,046 Jan-10 LBO Emerging Markets Primary 109% 1.11x 1.48x 9.5% 2
ABRY Partners VIII $196,304 May-15 LBO US Primary 87% 0.17x 1.19x 9.4% 2
Palamon European Equity III 'A' $359,871 Aug-14 LBO Non-US Developed Primary 68% 0.03x 1.19x 9.2% 0
CDH Supplementary Fund III $50,121 Mar-07 LBO Emerging Markets Primary 86% 1.65x 1.71x 9.0% 3
Phoenix Equity Partners 2010 Fund $359,038 Jun-10 LBO Non-US Developed Primary 94% 1.40x 1.62x 8.7% 3
ChrysCapital V $149,075 Aug-07 LBO Emerging Markets Primary 100% 1.50x 1.50x 8.4% 3
EQT V $215,844 Feb-07 LBO Non-US Developed Primary 99% 1.51x 1.64x 8.3% 3
Warburg Pincus Private Equity X $368,493 Oct-07 LBO US Primary 100% 1.07x 1.56x 8.3% 3
CX Partners Fund $239,820 Apr-09 LBO Emerging Markets Primary 111% 0.71x 1.42x 8.2% 2-
CDH China Fund III $150,363 Feb-07 LBO Emerging Markets Primary 94% 1.64x 1.71x 8.1% 2-
China Special Opportunities Fund III $101,543 Jan-11 LBO Emerging Markets Primary 100% 0.40x 1.41x 7.9% 2-
Navis Asia Fund V $194,027 Mar-07 LBO Non-US Developed Primary 100% 1.36x 1.66x 7.9% 3
Archer Capital 5 $254,390 Apr-12 LBO Non-US Developed Primary 95% 0.67x 1.39x 7.7% 2
Ascent India Fund III $357,660 May-10 LBO Emerging Markets Primary 102% 0.69x 1.37x 7.0% 2-
Baring Vostok Fund V Supplemental Fund $56,364 Aug-12 LBO Emerging Markets Primary 43% 0.01x 1.10x 6.6% 4
Kelso Investment Associates VIII $245,662 Nov-07 LBO US Primary 94% 0.86x 1.34x 6.6% 4
Baring Vostok Private Equity Fund IV $161,349 May-07 LBO Emerging Markets Primary 110% 0.77x 1.38x 6.4% 4
Pacific Equity Partners IV $116,339 Jan-08 LBO Non-US Developed Primary 99% 1.38x 1.46x 6.3% 3
Enterprise Venture Fund I $105,406 Jan-09 LBO Emerging Markets Primary 88% 0.91x 1.47x 6.3% 4
Providence Equity Partners VI $447,761 Mar-07 LBO US Primary 115% 1.01x 1.37x 6.1% 4
Advent Latin American Private Equity Fund V $258,414 May-10 LBO Emerging Markets Primary 96% 0.32x 1.25x 5.7% 3
Nordic Capital VII $579,660 Apr-08 LBO Non-US Developed Primary 95% 0.91x 1.64x 5.5% 3
Advent International GPE VIII-H $208,637 Sep-16 LBO Non-US Developed Primary 49% 0.00x 1.04x 5.4% 0
Sterling Capital Partners III $214,954 Aug-07 LBO US Primary 102% 1.10x 1.32x 5.3% 5
Segulah IV $219,076 Apr-08 LBO Non-US Developed Primary 107% 1.13x 1.46x 4.8% 3
Fortress Investment Fund V $389,519 Jul-07 LBO US Primary 98% 0.67x 1.47x 4.8% 4
Apax Europe VII - A $225,415 Jun-07 LBO Non-US Developed Primary 97% 1.32x 1.51x 4.7% 3
ABRY Heritage Partners $256,787 Jul-16 LBO US Primary 25% 0.01x 1.05x 4.7% 0
Turkish Private Equity Fund III $227,482 Jun-12 LBO Emerging Markets Primary 88% 0.18x 1.18x 4.5% 4
Silversmith Capital I $160,464 Oct-15 LBO US Primary 82% 0.00x 1.04x 4.3% 3
CMC Capital Partners II $182,894 Oct-16 LBO Emerging Markets Primary 62% 0.00x 1.03x 3.7% 0
Pacific Equity Partners Supplementary Fund IV $30,825 Jan-08 LBO Non-US Developed Primary 98% 1.32x 1.43x 3.4% 3
Northstar Equity Partners III $197,879 Jun-11 LBO Emerging Markets Primary 98% 0.09x 1.15x 3.1% 4
Harwood Private Equity IV $156,957 Jul-15 LBO Non-US Developed Primary 61% 0.43x 1.02x 2.0% 0
Parthenon Investors V $250,699 Jan-17 LBO US Primary 29% 0.00x 1.00x 1.1% 0
Tripod Capital China Fund II $262,783 Jan-10 LBO Emerging Markets Primary 86% 0.26x 1.03x 0.5% 4
Da Vinci Private Equity II $147,170 Dec-13 LBO Emerging Markets Primary 87% 0.00x 1.00x -0.1% 4

Confidential Partnership Fund Program-Q1'18
Detailed Schedule of Investments (Continued)
Royal Borough of Kensington and Chelsea Pension Fund 20
Client Level Partnership Level
Partnership by Subclass and TypeInvestment
CommitmentsDate ofMoney Closing Subclass Type
Drawn/Committed
Distributions/Drawn
Total Value/Drawn8 IRR12 ASP Rating13
.04
Baring Vostok Private Equity Fund V $88,069 Aug-12 LBO Emerging Markets Primary 82% 0.09x 1.00x -0.1% 4
Halder-GIMV Germany II $363,316 Jun-08 LBO Non-US Developed Primary 103% 1.06x 1.06x -0.4% 5
Victoria South American Partners II $66,489 Mar-12 LBO Emerging Markets Primary 76% 0.02x 0.98x -0.6% 4
Crescent Capital Partners V $348,581 May-15 LBO Non-US Developed Primary 74% 0.00x 0.97x -1.2% 2-
Sterling Capital Partners IV $245,418 Apr-12 LBO US Primary 98% 0.36x 0.97x -1.3% 5
Ethos Fund VI $211,548 Dec-11 LBO Emerging Markets Primary 87% 0.38x 0.96x -1.9% 4
Solix Co-Investment Scheme $286,723 Jan-15 LBO Non-US Developed Primary 95% 0.00x 0.87x -2.0% 3
Casrev Fund II $74,088 Nov-15 LBO Emerging Markets Primary 50% 0.00x 0.97x -2.6% 0
Clyde Blowers Capital Fund III $210,411 Feb-12 LBO Non-US Developed Primary 93% 0.00x 0.93x -4.0% 4
Latour Capital II $378,733 Oct-15 LBO Non-US Developed Primary 24% 0.00x 0.84x -4.2% 0
Baring Vostok IV - Supplementary Fund $64,540 Oct-07 LBO Emerging Markets Primary 91% 0.14x 0.75x -4.6% 5
New Mountain Partners V $436,527 Nov-17 LBO US Primary 15% 0.00x 0.95x -4.9%* 0
Gauge Capital II $256,787 Aug-17 LBO US Primary 8% 0.00x 0.91x -9.1%* 0
GC Equity Partners Fund III $94,395 Jan-16 LBO Emerging Markets Primary 39% 0.06x 0.84x -10.3% 0
Plemont Co-Investment No. 1 - Solix II $255,080 Jun-17 LBO Non-US Developed Primary 10% 0.00x 0.87x -10.4%* 0
Sterling Small Market Growth 2009 $219,446 Nov-10 LBO US Primary 120% 0.34x 0.73x -10.9% 5
Clayton, Dubilier & Rice Fund X $383,785 Mar-18 LBO US Primary 10% 0.00x 0.87x -12.7%* 0
Odyssey V $385,706 Jul-14 LBO US Primary 60% 0.00x 0.82x -13.5% 3
Accel-KKR Capital Partners III15 $497,418 Sep-08 LBO US Primary N/A N/A N/A N/A N/A
Accel-KKR Capital Partners IV15 $245,418 Jun-13 LBO US Primary N/A N/A N/A N/A N/A
Accel-KKR Capital Partners V15 $372,045 Jan-17 LBO US Primary N/A N/A N/A N/A N/A
Accel-KKR Growth Capital Partners II15 $121,114 Feb-15 LBO US Primary N/A N/A N/A N/A N/A
ACP Investment Fund15 $227,686 Sep-10 LBO US Primary N/A N/A N/A N/A N/A
ACP Investment Fund II15 $289,280 Jan-14 LBO US Primary N/A N/A N/A N/A N/A
ACP Investment Fund III15 $409,027 Apr-17 LBO US Primary N/A N/A N/A N/A N/A
Affinity Asia Pacific Fund IV15 $634,346 Mar-13 LBO Non-US Developed Primary N/A N/A N/A N/A N/A
Affinity Asia Pacific Fund V15 $259,731 N/A LBO Non-US Developed Primary N/A N/A N/A N/A N/A
Astorg IV15 $174,867 Oct-07 LBO Non-US Developed Primary N/A N/A N/A N/A N/A
Astorg V15 $425,458 Jan-11 LBO Non-US Developed Primary N/A N/A N/A N/A N/A
Bain Capital Asia Fund15 $64,540 Oct-07 LBO Non-US Developed Primary N/A N/A N/A N/A N/A
Bain Capital Asia Fund II15 $206,413 Jul-12 LBO Emerging Markets Primary N/A N/A N/A N/A N/A
Bain Capital Asia Fund III15 $149,283 May-16 LBO Emerging Markets Primary N/A N/A N/A N/A N/A
Bain Capital Europe Fund III15 $363,102 Jul-08 LBO Non-US Developed Primary N/A N/A N/A N/A N/A
Bain Capital Europe Fund III - GS15 $127,650 Jun-09 LBO Non-US Developed Primary N/A N/A N/A N/A N/A
Bain Capital Fund X15 $207,868 Jan-08 LBO US Primary N/A N/A N/A N/A N/A
Bain Capital X Coinvestment Fund15 $10,582 Jul-08 LBO US Primary N/A N/A N/A N/A N/A
Birch Hill Equity Partners IV15 $443,801 Nov-10 LBO US Primary N/A N/A N/A N/A N/A
Boyu Capital Fund II15 $134,818 Sep-14 LBO Emerging Markets Primary N/A N/A N/A N/A N/A

Confidential Partnership Fund Program-Q1'18
Detailed Schedule of Investments (Continued)
Royal Borough of Kensington and Chelsea Pension Fund 21
Client Level Partnership Level
Partnership by Subclass and TypeInvestment
CommitmentsDate ofMoney Closing Subclass Type
Drawn/Committed
Distributions/Drawn
Total Value/Drawn8 IRR12 ASP Rating13
.04
BOYU Capital Fund III15 $174,955 Apr-17 LBO Emerging Markets Primary N/A N/A N/A N/A N/A
DBAG Fund VI15 $383,195 Oct-13 LBO Non-US Developed Primary N/A N/A N/A N/A N/A
DBAG Fund VII15 $151,623 Mar-17 LBO Non-US Developed Primary N/A N/A N/A N/A N/A
DBAG Fund VII B15 $28,881 Mar-17 LBO Non-US Developed Primary N/A N/A N/A N/A N/A
Housatonic Equity Investors VI15 $320,928 Mar-16 LBO US Primary N/A N/A N/A N/A N/A
Housatonic Equity V15 $199,726 Jul-10 LBO US Primary N/A N/A N/A N/A N/A
IDG-Accel China Capital15 $237,031 Sep-08 LBO Emerging Markets Primary N/A N/A N/A N/A N/A
IDG-Accel China Capital II15 $59,657 Dec-11 LBO Emerging Markets Primary N/A N/A N/A N/A N/A
Industrial Opportunity II15 $246,102 Jul-12 LBO US Primary N/A N/A N/A N/A N/A
Industrial Opportunity Partners III15 $359,502 Oct-17 LBO US Primary N/A N/A N/A N/A N/A
InvestIndustrial III Build-Up15 $178,477 Jan-10 LBO Non-US Developed Primary N/A N/A N/A N/A N/A
InvestIndustrial IV15 $363,832 Mar-08 LBO Non-US Developed Primary N/A N/A N/A N/A N/A
Investindustrial V15 $456,733 May-12 LBO Non-US Developed Primary N/A N/A N/A N/A N/A
Marlin Equity III15 $274,307 Jul-10 LBO US Primary N/A N/A N/A N/A N/A
Oak HC/FT Partners15 $587,798 Oct-14 LBO US Primary N/A N/A N/A N/A N/A
RoundTable Healthcare Partners III15 $197,988 Oct-10 LBO US Primary N/A N/A N/A N/A N/A
RoundTable Healthcare Partners IV15 $145,740 Sep-15 LBO US Primary N/A N/A N/A N/A N/A
Serent Capital Fund I15 $276,400 Apr-08 LBO US Primary N/A N/A N/A N/A N/A
Serent Capital II15 $263,566 Jul-14 LBO US Primary N/A N/A N/A N/A N/A
SK Capital IV-A15 $320,928 Feb-15 LBO US Primary N/A N/A N/A N/A N/A
Sun Capital Partners V15 $161,554 May-07 LBO US Primary N/A N/A N/A N/A N/A
Water Street Healthcare Partners II15 $486,143 Sep-08 LBO US Primary N/A N/A N/A N/A N/A
Water Street Healthcare Partners III15 $242,481 Apr-13 LBO US Primary N/A N/A N/A N/A N/A
Water Street Healthcare Partners IV15 $256,787 Mar-18 LBO US Primary N/A N/A N/A N/A N/A
Advantech Capital II $259,731 Jun-18 LBO Emerging Markets Primary 0% 0.00x 0.00x N/A 0
Berkshire Fund IX Coinvestment Fund $253,857 May-18 LBO US Primary 0% 0.00x 0.00x N/A 0
HCI Equity Partners V $310,823 May-18 LBO US Primary 0% 0.00x 0.00x N/A 0
HgCapital Mercury 2 $203,476 Apr-18 LBO Non-US Developed Primary 0% 0.00x 0.00x N/A 0
Resolute Fund IV $333,823 N/A LBO US Primary 0% 0.00x 0.00x N/A 0
TDR Capital IV $315,694 N/A LBO Non-US Developed Primary 0% 0.00x 0.00x N/A 0
Trivest Fund VI $383,556 N/A LBO US Primary 0% 0.00x 0.00x N/A 0
WPEF VII Feeder $261,416 N/A LBO Non-US Developed Primary 0% 0.00x 0.00x N/A 0
Primary LBO Investments Total $50,178,365 77% 0.80x 1.59x 14.0%
Primary VC Investments
Adams Street 2016 Direct Venture/Growth (Pship) $2,000,000 May-16 VC US Primary 40% 0.00x 1.18x 75.9%16 N/A
Battery Ventures XI-A Side Fund $58,862 Jun-16 VC US Primary N/A N/A N/A 32.7% 0
Battery Ventures VIII Side Fund $58,441 Sep-08 VC US Primary 100% 2.57x 2.81x 30.4% 2

Confidential Partnership Fund Program-Q1'18
Detailed Schedule of Investments (Continued)
Royal Borough of Kensington and Chelsea Pension Fund 22
Client Level Partnership Level
Partnership by Subclass and TypeInvestment
CommitmentsDate ofMoney Closing Subclass Type
Drawn/Committed
Distributions/Drawn
Total Value/Drawn8 IRR12 ASP Rating13
.04
Abingworth Bioventures VI $418,665 Oct-12 VC Non-US Developed Primary 94% 0.79x 2.24x 29.8% 2
Battery Ventures IX $353,152 Jan-11 VC US Primary 98% 1.02x 2.65x 26.1% 2
New Enterprise Associates 15 $454,186 Mar-15 VC US Primary 78% 0.00x 1.51x 25.8% 2
Battery Ventures X Side Fund $66,844 Jul-13 VC US Primary 91% 0.45x 1.68x 19.9% 0
Trust Bridge Partners III $238,546 Apr-09 VC Emerging Markets Primary 98% 1.24x 2.66x 19.5% 2
Summit Partners Venture Capital Fund III-B $162,360 Jul-12 VC US Primary 100% 0.93x 1.90x 18.9% 2
New Enterprise Associates 14 $535,446 May-12 VC US Primary 94% 0.17x 1.89x 18.1% 2
Battery Ventures XI-A $127,018 Jun-16 VC US Primary 71% 0.00x 1.15x 17.8% 0
Battery Ventures VIII $233,142 Sep-07 VC US Primary 100% 1.86x 2.54x 17.6% 2
SBCVC Fund III $296,289 Jun-08 VC Emerging Markets Primary 99% 1.27x 2.26x 17.5% 2-
Trustbridge Partners IV $119,315 May-11 VC Emerging Markets Primary 104% 0.18x 2.17x 16.7% 2-
Adams Street 2008 Direct (Pship) $3,500,000 Jan-08 VC US Primary 97% 1.41x 2.27x 15.2%16 N/A
Prime Technology Ventures III $126,021 Sep-07 VC Non-US Developed Primary N/A N/A N/A 14.3% 2
New Enterprise Associates 13 $386,914 May-09 VC US Primary N/A N/A N/A 13.7% 2
Abingworth Bioventures V $243,094 Feb-07 VC Non-US Developed Primary N/A N/A N/A 12.3% 1
Abingworth Bioventures V Co-Invest Growth Equity Fund $80,592 Jul-08 VC Non-US Developed Primary N/A N/A N/A 12.2% 3
Adams Street 2012 Direct (Pship) $3,000,000 Feb-12 VC US Primary 87% 0.34x 1.23x 12.2%16 N/A
Monashees Capital VI $45,809 Aug-12 VC Emerging Markets Primary 100% 0.96x 2.10x 11.8% 3
Adams Street 2007 Direct (Pship) $3,500,000 Jan-07 VC US Primary 97% 1.43x 2.15x 11.5%16 N/A
SBCVC Fund IV $119,315 Jun-11 VC Emerging Markets Primary 87% 0.07x 1.57x 10.6% 2-
Austin Ventures X $309,238 Sep-08 VC US Primary N/A N/A N/A 9.1% 3
CDH China Venture Partners II $254,888 May-08 VC Emerging Markets Primary 104% 0.64x 1.65x 9.0% 3
Ignition Venture Partners IV $30,677 Sep-07 VC US Primary 95% 1.05x 1.48x 8.6% 3
Split Rock Partners II $333,736 Jan-09 VC US Primary 98% 0.65x 1.39x 7.7% 5
Keytone Ventures II $211,548 Jan-11 VC Emerging Markets Primary 94% 0.01x 1.39x 7.3% 2-
Kalaari Capital Partners II $99,733 Feb-12 VC Emerging Markets Primary N/A N/A N/A 7.0% 2
Battery Ventures X $155,970 Jun-13 VC US Primary 81% 0.16x 1.22x 6.7% 0
Foundation Capital VI $88,819 Jul-08 VC US Primary N/A N/A N/A 5.4% 4
Ignition Growth Capital I $30,677 Sep-07 VC US Primary N/A N/A N/A 3.2% 4
Prime Ventures IV $532,647 Feb-13 VC Non-US Developed Primary 92% 0.08x 1.01x 2.1% 0
Ignition Venture Partners V $210,923 Feb-13 VC US Primary N/A N/A N/A 1.2% 5
Keytone Ventures $177,773 Jul-08 VC Emerging Markets Primary 96% 0.34x 1.06x 0.8% 4
New Enterprise Associates 16 $329,847 May-17 VC US Primary N/A N/A N/A 0.5%* 0
Vision Plus Capital Fund II $181,812 Oct-17 VC Emerging Markets Primary 19% 0.00x 1.00x -0.4%* 0
Source Code Fund III $181,812 Aug-17 VC Emerging Markets Primary 30% 0.00x 0.94x -6.2%* 0
Accel Growth15 $276,367 Apr-09 VC US Primary N/A N/A N/A N/A N/A
Accel Growth Fund IV15 $265,004 Feb-17 VC US Primary N/A N/A N/A N/A N/A
Accel Growth II15 $126,369 Dec-11 VC US Primary N/A N/A N/A N/A N/A

Confidential Partnership Fund Program-Q1'18
Detailed Schedule of Investments (Continued)
Royal Borough of Kensington and Chelsea Pension Fund 23
Client Level Partnership Level
Partnership by Subclass and TypeInvestment
CommitmentsDate ofMoney Closing Subclass Type
Drawn/Committed
Distributions/Drawn
Total Value/Drawn8 IRR12 ASP Rating13
.04
Accel Growth III15 $329,120 Jun-14 VC US Primary N/A N/A N/A N/A N/A
Accel India Venture Fund II15 $59,637 Nov-08 VC Emerging Markets Primary N/A N/A N/A N/A N/A
Accel India Venture Fund III15 $33,244 Nov-11 VC Emerging Markets Primary N/A N/A N/A N/A N/A
Accel Leaders Fund15 $66,967 Mar-17 VC US Primary N/A N/A N/A N/A N/A
Accel London III15 $357,819 Aug-09 VC Non-US Developed Primary N/A N/A N/A N/A N/A
Accel London IV15 $102,026 Apr-14 VC Non-US Developed Primary N/A N/A N/A N/A N/A
Accel London V15 $129,547 Aug-16 VC Non-US Developed Primary N/A N/A N/A N/A N/A
Accel X15 $122,706 Jan-08 VC US Primary N/A N/A N/A N/A N/A
Accel XI15 $80,876 Sep-11 VC US Primary N/A N/A N/A N/A N/A
Accel XII15 $164,560 Apr-14 VC US Primary N/A N/A N/A N/A N/A
Accel XIII15 $111,620 Nov-16 VC US Primary N/A N/A N/A N/A N/A
AH Annex Fund15 $98,257 Apr-11 VC US Primary N/A N/A N/A N/A N/A
AH Bio Fund II15 $372,341 May-18 VC US Primary N/A N/A N/A N/A N/A
AH Parallel Fund III15 $66,056 Jul-12 VC US Primary N/A N/A N/A N/A N/A
AH Parallel Fund IV15 $146,276 May-14 VC US Primary N/A N/A N/A N/A N/A
AH Parallel Fund V15 $110,592 Jul-17 VC US Primary N/A N/A N/A N/A N/A
Aleph15 $90,147 Aug-13 VC Non-US Developed Primary N/A N/A N/A N/A N/A
Aleph II15 $175,059 Jun-17 VC Non-US Developed Primary N/A N/A N/A N/A N/A
Andreessen Horowitz Fund I15 $109,722 Jul-09 VC US Primary N/A N/A N/A N/A N/A
Andreessen Horowitz Fund II15 $245,642 Nov-10 VC US Primary N/A N/A N/A N/A N/A
Andreessen Horowitz Fund III15 $242,958 Feb-12 VC US Primary N/A N/A N/A N/A N/A
Andreessen Horowitz Fund IV15 $292,551 Apr-14 VC US Primary N/A N/A N/A N/A N/A
Andreessen Horowitz Fund V15 $222,016 Jun-17 VC US Primary N/A N/A N/A N/A N/A
August Capital V15 $209,560 Feb-09 VC US Primary N/A N/A N/A N/A N/A
August Capital V Special Opportunities15 $121,635 Mar-11 VC US Primary N/A N/A N/A N/A N/A
August Capital VI15 $131,162 Aug-12 VC US Primary N/A N/A N/A N/A N/A
August Capital VI Special Opportunities15 $109,302 Jul-13 VC US Primary N/A N/A N/A N/A N/A
Bain Capital Venture Coinvestment Fund15 $105,928 Apr-15 VC US Primary N/A N/A N/A N/A N/A
Bain Capital Venture Fund 200915 $274,256 Jul-09 VC US Primary N/A N/A N/A N/A N/A
Bain Capital Venture Fund 201215 $210,563 Sep-12 VC US Primary N/A N/A N/A N/A N/A
Bain Capital Venture Fund 201415 $325,933 Oct-14 VC US Primary N/A N/A N/A N/A N/A
Balderton Capital IV15 $357,819 Jan-09 VC Non-US Developed Primary N/A N/A N/A N/A N/A
Banyan Capital Fund II15 $49,909 Apr-15 VC Emerging Markets Primary N/A N/A N/A N/A N/A
Benchmark Capital Partners VI15 $207,192 Jan-08 VC US Primary N/A N/A N/A N/A N/A
Benchmark Capital Partners VII15 $219,022 Feb-11 VC US Primary N/A N/A N/A N/A N/A
Benchmark Capital Partners VIII15 $119,556 Feb-14 VC US Primary N/A N/A N/A N/A N/A
Charles River Partnership XVI15 $408,038 May-15 VC US Primary N/A N/A N/A N/A N/A
Charles River Ventures XIII15 $26,919 Jun-07 VC US Primary N/A N/A N/A N/A N/A
Confidential Partnership Fund Program-Q1'18
Detailed Schedule of Investments (Continued)
Royal Borough of Kensington and Chelsea Pension Fund 24
Client Level Partnership Level
Partnership by Subclass and TypeInvestment
CommitmentsDate ofMoney Closing Subclass Type
Drawn/Committed
Distributions/Drawn
Total Value/Drawn8 IRR12 ASP Rating13
.04
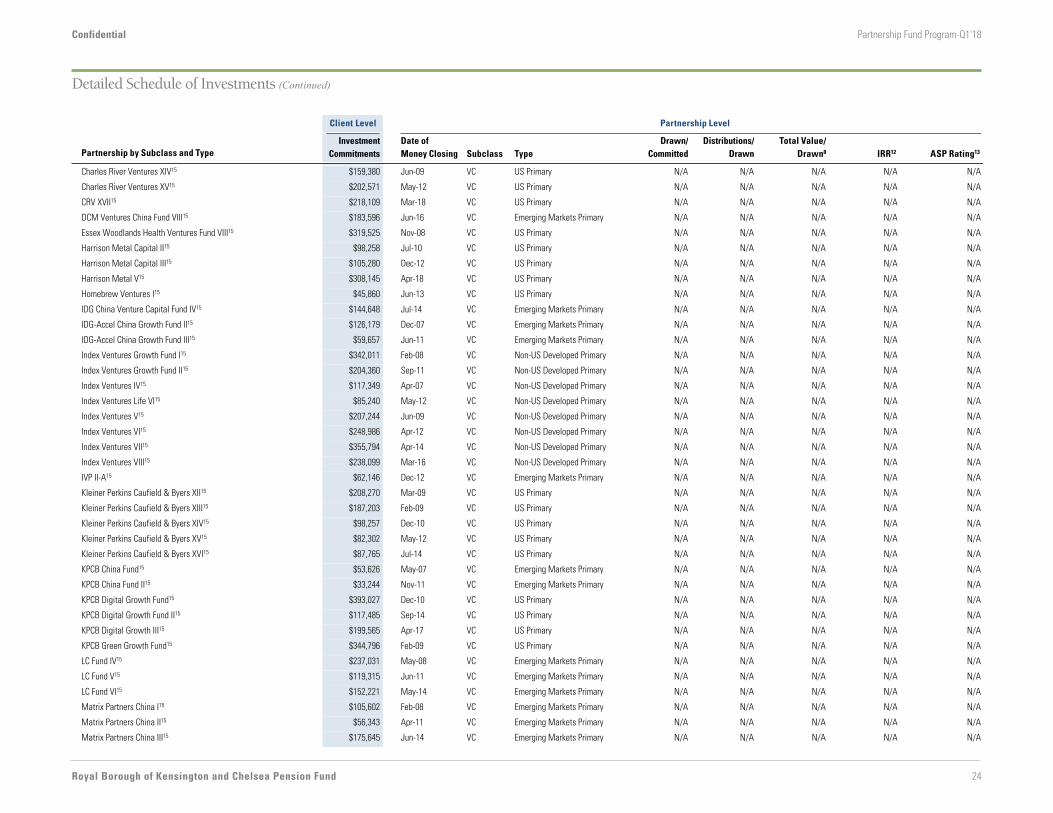
Charles River Ventures XIV15 $159,380 Jun-09 VC US Primary N/A N/A N/A N/A N/A
Charles River Ventures XV15 $202,571 May-12 VC US Primary N/A N/A N/A N/A N/A
CRV XVII15 $218,109 Mar-18 VC US Primary N/A N/A N/A N/A N/A
DCM Ventures China Fund VIII15 $183,596 Jun-16 VC Emerging Markets Primary N/A N/A N/A N/A N/A
Essex Woodlands Health Ventures Fund VIII15 $319,525 Nov-08 VC US Primary N/A N/A N/A N/A N/A
Harrison Metal Capital II15 $98,258 Jul-10 VC US Primary N/A N/A N/A N/A N/A
Harrison Metal Capital III15 $105,280 Dec-12 VC US Primary N/A N/A N/A N/A N/A
Harrison Metal V15 $308,145 Apr-18 VC US Primary N/A N/A N/A N/A N/A
Homebrew Ventures I15 $45,860 Jun-13 VC US Primary N/A N/A N/A N/A N/A
IDG China Venture Capital Fund IV15 $144,648 Jul-14 VC Emerging Markets Primary N/A N/A N/A N/A N/A
IDG-Accel China Growth Fund II15 $126,179 Dec-07 VC Emerging Markets Primary N/A N/A N/A N/A N/A
IDG-Accel China Growth Fund III15 $59,657 Jun-11 VC Emerging Markets Primary N/A N/A N/A N/A N/A
Index Ventures Growth Fund I15 $342,011 Feb-08 VC Non-US Developed Primary N/A N/A N/A N/A N/A
Index Ventures Growth Fund II15 $204,360 Sep-11 VC Non-US Developed Primary N/A N/A N/A N/A N/A
Index Ventures IV15 $117,349 Apr-07 VC Non-US Developed Primary N/A N/A N/A N/A N/A
Index Ventures Life VI15 $85,240 May-12 VC Non-US Developed Primary N/A N/A N/A N/A N/A
Index Ventures V15 $207,244 Jun-09 VC Non-US Developed Primary N/A N/A N/A N/A N/A
Index Ventures VI15 $248,986 Apr-12 VC Non-US Developed Primary N/A N/A N/A N/A N/A
Index Ventures VII15 $355,794 Apr-14 VC Non-US Developed Primary N/A N/A N/A N/A N/A
Index Ventures VIII15 $238,099 Mar-16 VC Non-US Developed Primary N/A N/A N/A N/A N/A
IVP II-A15 $62,146 Dec-12 VC Emerging Markets Primary N/A N/A N/A N/A N/A
Kleiner Perkins Caufield & Byers XII15 $208,270 Mar-09 VC US Primary N/A N/A N/A N/A N/A
Kleiner Perkins Caufield & Byers XIII15 $187,203 Feb-09 VC US Primary N/A N/A N/A N/A N/A
Kleiner Perkins Caufield & Byers XIV15 $98,257 Dec-10 VC US Primary N/A N/A N/A N/A N/A
Kleiner Perkins Caufield & Byers XV15 $82,302 May-12 VC US Primary N/A N/A N/A N/A N/A
Kleiner Perkins Caufield & Byers XVI15 $87,765 Jul-14 VC US Primary N/A N/A N/A N/A N/A
KPCB China Fund15 $53,626 May-07 VC Emerging Markets Primary N/A N/A N/A N/A N/A
KPCB China Fund II15 $33,244 Nov-11 VC Emerging Markets Primary N/A N/A N/A N/A N/A
KPCB Digital Growth Fund15 $393,027 Dec-10 VC US Primary N/A N/A N/A N/A N/A
KPCB Digital Growth Fund II15 $117,485 Sep-14 VC US Primary N/A N/A N/A N/A N/A
KPCB Digital Growth III15 $199,565 Apr-17 VC US Primary N/A N/A N/A N/A N/A
KPCB Green Growth Fund15 $344,796 Feb-09 VC US Primary N/A N/A N/A N/A N/A
LC Fund IV15 $237,031 May-08 VC Emerging Markets Primary N/A N/A N/A N/A N/A
LC Fund V15 $119,315 Jun-11 VC Emerging Markets Primary N/A N/A N/A N/A N/A
LC Fund VI15 $152,221 May-14 VC Emerging Markets Primary N/A N/A N/A N/A N/A
Matrix Partners China I15 $105,602 Feb-08 VC Emerging Markets Primary N/A N/A N/A N/A N/A
Matrix Partners China II15 $56,343 Apr-11 VC Emerging Markets Primary N/A N/A N/A N/A N/A
Matrix Partners China III15 $175,645 Jun-14 VC Emerging Markets Primary N/A N/A N/A N/A N/A

Confidential Partnership Fund Program-Q1'18
Detailed Schedule of Investments (Continued)
Royal Borough of Kensington and Chelsea Pension Fund 25
Client Level Partnership Level
Partnership by Subclass and TypeInvestment
CommitmentsDate ofMoney Closing Subclass Type
Drawn/Committed
Distributions/Drawn
Total Value/Drawn8 IRR12 ASP Rating13
.04
Matrix Partners India II15 $49,714 Oct-11 VC Emerging Markets Primary N/A N/A N/A N/A N/A
Matrix Partners India II Extension15 $19,886 Jul-16 VC Emerging Markets Primary N/A N/A N/A N/A N/A
Matrix Partners IX15 $296,000 Oct-10 VC US Primary N/A N/A N/A N/A N/A
Matrix Partners X15 $142,150 Nov-13 VC US Primary N/A N/A N/A N/A N/A
Pitango Venture Capital Fund V15 $157,723 Aug-07 VC Non-US Developed Primary N/A N/A N/A N/A N/A
Pitango Venture Capital Fund VI15 $385,126 Oct-12 VC Non-US Developed Primary N/A N/A N/A N/A N/A
Redpoint Omega Fund15 $122,400 Feb-07 VC US Primary N/A N/A N/A N/A N/A
Redpoint Omega II15 $153,266 Aug-12 VC US Primary N/A N/A N/A N/A N/A
Redpoint Ventures IV15 $287,647 Jul-10 VC US Primary N/A N/A N/A N/A N/A
Redpoint Ventures V15 $171,375 Apr-13 VC US Primary N/A N/A N/A N/A N/A
RPEV I-B15 $70,455 Aug-12 VC Emerging Markets Primary N/A N/A N/A N/A N/A
U.S. Venture Partners X15 $276,105 Sep-08 VC US Primary N/A N/A N/A N/A N/A
Venrock Associates VII15 $268,378 Jan-15 VC US Primary N/A N/A N/A N/A N/A
Venrock V15 $98,736 Apr-07 VC US Primary N/A N/A N/A N/A N/A
Venrock VI15 $246,523 Jan-11 VC US Primary N/A N/A N/A N/A N/A
Versant Venture Capital IV15 $386,914 Oct-08 VC US Primary N/A N/A N/A N/A N/A
Wing Ventures15 $38,258 Aug-13 VC US Primary N/A N/A N/A N/A N/A
Primary VC Investments Total $36,183,171 83% 0.80x 1.93x 15.5%
Primary ENR Investments
NGP Natural Resources XI $306,135 Nov-14 ENR US Primary 84% 0.15x 1.29x 24.0% 2
Energy & Minerals Group Fund IV $335,406 Mar-16 ENR US Primary 61% 0.17x 1.41x 20.9% 2
EMG Ascent 2016 Equity $14,945 Mar-16 ENR US Primary 100% 0.00x 1.43x 19.4% 3
Energy & Minerals Group Fund II $358,461 Jun-11 ENR US Primary 97% 0.66x 1.80x 15.8% 2
NGP Midstream and Resources $161,704 Jun-07 ENR US Primary 100% 1.28x 1.88x 14.5% 2
HitecVision V $295,636 Apr-08 ENR Non-US Developed Primary 105% 1.04x 1.48x 12.9% 3
Natural Gas Partners IX $245,717 Oct-07 ENR US Primary 99% 1.39x 1.45x 10.6% 3
NGP Natural Resources X $252,533 Jan-12 ENR US Primary 96% 0.67x 1.18x 5.8% 4
Warburg Pincus Energy $527,937 Jul-14 ENR US Primary 63% 0.09x 1.08x 5.7% 4
HitecVision Assets Solutions $119,025 Mar-10 ENR Non-US Developed Primary 91% 0.30x 1.27x 5.4% 4
HitecVision VII $352,294 May-14 ENR Non-US Developed Primary 56% 0.00x 1.08x 4.9% 0
Energy & Minerals Group Fund III $451,095 Jan-14 ENR US Primary 94% 0.06x 0.91x -3.1% 4
HitecVision VI $350,043 Dec-11 ENR Non-US Developed Primary 83% 0.00x 0.88x -3.7% 4
First Reserve Fund XII $844,024 Aug-08 ENR US Primary 101% 0.46x 0.68x -8.2% 5
Resource Capital V15 $438,980 Nov-09 ENR US Primary N/A N/A N/A N/A N/A
Resource Capital VI15 $230,428 Jun-13 ENR US Primary N/A N/A N/A N/A N/A
Primary ENR Investments Total $5,284,363 88% 0.42x 1.12x 3.4%
Primary DC Investments
Confidential Partnership Fund Program-Q1'18
Detailed Schedule of Investments (Continued)
Royal Borough of Kensington and Chelsea Pension Fund 26
Client Level Partnership Level
Partnership by Subclass and TypeInvestment
CommitmentsDate ofMoney Closing Subclass Type
Drawn/Committed
Distributions/Drawn
Total Value/Drawn8 IRR12 ASP Rating13
.04
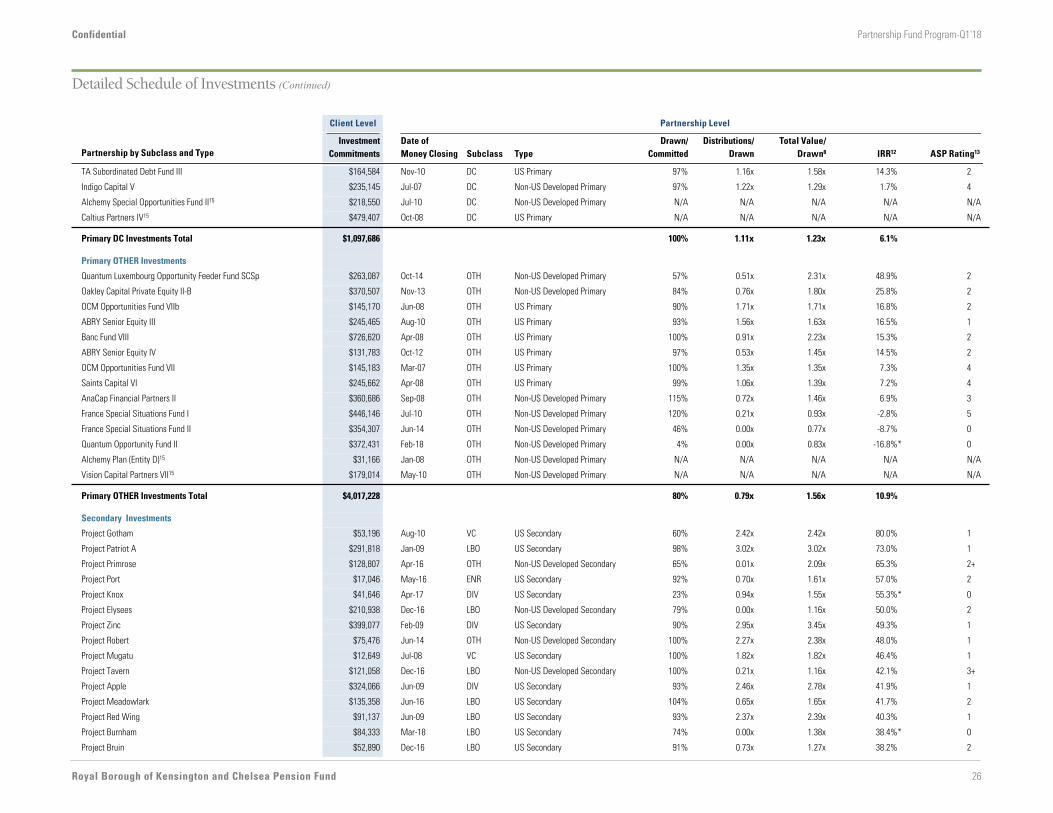
TA Subordinated Debt Fund III $164,584 Nov-10 DC US Primary 97% 1.16x 1.58x 14.3% 2
Indigo Capital V $235,145 Jul-07 DC Non-US Developed Primary 97% 1.22x 1.29x 1.7% 4
Alchemy Special Opportunities Fund II15 $218,550 Jul-10 DC Non-US Developed Primary N/A N/A N/A N/A N/A
Caltius Partners IV15 $479,407 Oct-08 DC US Primary N/A N/A N/A N/A N/A
Primary DC Investments Total $1,097,686 100% 1.11x 1.23x 6.1%
Primary OTHER Investments
Quantum Luxembourg Opportunity Feeder Fund SCSp $263,087 Oct-14 OTH Non-US Developed Primary 57% 0.51x 2.31x 48.9% 2
Oakley Capital Private Equity II-B $370,507 Nov-13 OTH Non-US Developed Primary 84% 0.76x 1.80x 25.8% 2
OCM Opportunities Fund VIIb $145,170 Jun-08 OTH US Primary 90% 1.71x 1.71x 16.8% 2
ABRY Senior Equity III $245,465 Aug-10 OTH US Primary 93% 1.56x 1.63x 16.5% 1
Banc Fund VIII $726,620 Apr-08 OTH US Primary 100% 0.91x 2.23x 15.3% 2
ABRY Senior Equity IV $131,783 Oct-12 OTH US Primary 97% 0.53x 1.45x 14.5% 2
OCM Opportunities Fund VII $145,183 Mar-07 OTH US Primary 100% 1.35x 1.35x 7.3% 4
Saints Capital VI $245,662 Apr-08 OTH US Primary 99% 1.06x 1.39x 7.2% 4
AnaCap Financial Partners II $360,686 Sep-08 OTH Non-US Developed Primary 115% 0.72x 1.46x 6.9% 3
France Special Situations Fund I $446,146 Jul-10 OTH Non-US Developed Primary 120% 0.21x 0.93x -2.8% 5
France Special Situations Fund II $354,307 Jun-14 OTH Non-US Developed Primary 46% 0.00x 0.77x -8.7% 0
Quantum Opportunity Fund II $372,431 Feb-18 OTH Non-US Developed Primary 4% 0.00x 0.83x -16.8%* 0
Alchemy Plan (Entity D)15 $31,166 Jan-08 OTH Non-US Developed Primary N/A N/A N/A N/A N/A
Vision Capital Partners VII15 $179,014 May-10 OTH Non-US Developed Primary N/A N/A N/A N/A N/A
Primary OTHER Investments Total $4,017,228 80% 0.79x 1.56x 10.9%
Secondary Investments
Project Gotham $53,196 Aug-10 VC US Secondary 60% 2.42x 2.42x 80.0% 1
Project Patriot A $291,818 Jan-09 LBO US Secondary 98% 3.02x 3.02x 73.0% 1
Project Primrose $128,807 Apr-16 OTH Non-US Developed Secondary 65% 0.01x 2.09x 65.3% 2+
Project Port $17,046 May-16 ENR US Secondary 92% 0.70x 1.61x 57.0% 2
Project Knox $41,646 Apr-17 DIV US Secondary 23% 0.94x 1.55x 55.3%* 0
Project Elysees $210,938 Dec-16 LBO Non-US Developed Secondary 79% 0.00x 1.16x 50.0% 2
Project Zinc $399,077 Feb-09 DIV US Secondary 90% 2.95x 3.45x 49.3% 1
Project Robert $75,476 Jun-14 OTH Non-US Developed Secondary 100% 2.27x 2.38x 48.0% 1
Project Mugatu $12,649 Jul-08 VC US Secondary 100% 1.82x 1.82x 46.4% 1
Project Tavern $121,058 Dec-16 LBO Non-US Developed Secondary 100% 0.21x 1.16x 42.1% 3+
Project Apple $324,066 Jun-09 DIV US Secondary 93% 2.46x 2.78x 41.9% 1
Project Meadowlark $135,358 Jun-16 LBO US Secondary 104% 0.65x 1.65x 41.7% 2
Project Red Wing $91,137 Jun-09 LBO US Secondary 93% 2.37x 2.39x 40.3% 1
Project Burnham $84,333 Mar-18 LBO US Secondary 74% 0.00x 1.38x 38.4%* 0
Project Bruin $52,890 Dec-16 LBO US Secondary 91% 0.73x 1.27x 38.2% 2

Confidential Partnership Fund Program-Q1'18
Detailed Schedule of Investments (Continued)
Royal Borough of Kensington and Chelsea Pension Fund 27
Client Level Partnership Level
Partnership by Subclass and TypeInvestment
CommitmentsDate ofMoney Closing Subclass Type
Drawn/Committed
Distributions/Drawn
Total Value/Drawn8 IRR12 ASP Rating13
.04
Project Mountain $110,794 Mar-17 LBO US Secondary 67% 0.01x 1.32x 34.8% 2
Project Benz $90,917 Jan-17 LBO Non-US Developed Secondary 81% 0.05x 1.20x 34.4% 3
Project Rapids $167,647 Dec-14 DIV Non-US Developed Secondary 77% 1.29x 1.75x 34.0% 1
Project Noble $825,162 Jan-09 DIV US Secondary 87% 2.13x 2.44x 33.5% 1
Project Nature $118,933 Jul-12 LBO Non-US Developed Secondary 94% 1.51x 2.37x 31.2% 1
Project Runner $44,619 Mar-16 LBO US Secondary 81% 0.42x 1.49x 29.0% 2
Project Dynamite $44,207 Dec-14 LBO US Secondary 78% 1.42x 1.53x 28.7% 1
Project Lighthouse $837,937 Jan-09 DIV US Secondary 99% 2.23x 2.49x 26.3% 1
Project Tango $1,979,590 Jan-09 DIV US Secondary 91% 2.00x 2.42x 25.9% 1
Project Cascade $121,889 Sep-12 LBO US Secondary 89% 1.63x 1.74x 25.7% 1
Project Lantern $7,159 Jun-17 ENR US Secondary 99% 0.26x 1.24x 24.0%* 0
Project Patriot B $130,682 Jan-09 DIV US Secondary 99% 2.05x 2.62x 23.1% 1
Project Advent $258,039 Aug-09 LBO Non-US Developed Secondary 100% 2.05x 2.62x 22.5% 1
Project Octavian $190,193 Jan-09 DIV US Secondary 93% 2.41x 2.48x 22.0% 1
Project Salsa II $62,941 Mar-07 DIV US Secondary 97% 1.50x 1.50x 22.0% 1
Project Preakness $62,453 Dec-14 LBO US Secondary 89% 0.95x 1.61x 21.9% 2
Project Western $699,765 Dec-16 DIV US Secondary 89% 0.46x 1.20x 21.4% 2
Project Eiffel $18,043 Apr-14 LBO Non-US Developed Secondary 99% 1.25x 1.36x 20.9% 1
Project Plutus $136,731 Jul-17 DIV Non-US Developed Secondary 84% 0.00x 1.21x 20.8%* 0
Project Sherman $709,926 Jan-09 LBO US Secondary 87% 1.61x 2.03x 20.8% 1
Project Peregrina $203,264 Jun-16 OTH US Secondary 101% 0.32x 1.30x 20.8% 2
Project Amsterdam $331,404 Nov-08 LBO Non-US Developed Secondary 93% 2.02x 2.18x 20.6% 1
Project Tape $94,447 Apr-13 LBO Non-US Developed Secondary 101% 1.05x 1.62x 19.3% 2
Project Dock $207,630 Apr-16 DIV US Secondary 84% 0.22x 1.22x 18.5% 2
Project Skipjack $328,396 Dec-10 LBO US Secondary 100% 1.42x 1.54x 18.5% 1
Project Patriot II $145,724 Jul-09 VC US Secondary 97% 1.14x 2.44x 18.5% 2
Project Hickory $160,761 Mar-14 LBO US Secondary 105% 0.85x 1.57x 17.0% 2
Project Everest $873,284 Sep-08 VC US Secondary 99% 1.79x 1.97x 16.6% 1
Project Warhol $184,063 Apr-08 LBO US Secondary 100% 1.52x 1.52x 15.5% 1
Project Apax $203,016 Jul-09 LBO Non-US Developed Secondary 96% 1.87x 2.15x 15.4% 1
Project Lafayette $14,259 Jul-14 LBO Emerging Markets Secondary 107% 0.78x 1.46x 15.0% 3
Project Iniesta $84,532 Apr-17 LBO Non-US Developed Secondary 89% 0.11x 1.02x 13.6%* 2
Project Centurion $935,555 Jun-08 LBO US Secondary 94% 1.36x 1.71x 12.9% 1
Project Sunshine $349,334 Oct-16 DIV US Secondary 76% 0.16x 1.16x 12.1% 0
Project Twin Cities $1,045,143 May-07 VC US Secondary 99% 1.49x 1.60x 11.9% 1
Project Sand $18,224 Mar-17 LBO US Secondary 80% 0.11x 1.11x 11.3%* 3
Project Anagram $197,205 Dec-17 LBO US Secondary 67% 0.00x 1.10x 10.3%* 0
Project Cavendish $823,378 Feb-18 OTH US Secondary 50% 0.02x 1.10x 10.0%* 0

Confidential Partnership Fund Program-Q1'18
Detailed Schedule of Investments (Continued)
Royal Borough of Kensington and Chelsea Pension Fund 28
Client Level Partnership Level
Partnership by Subclass and TypeInvestment
CommitmentsDate ofMoney Closing Subclass Type
Drawn/Committed
Distributions/Drawn
Total Value/Drawn8 IRR12 ASP Rating13
.04
Project Nico $82,888 Jul-12 LBO Emerging Markets Secondary 63% 1.19x 1.30x 9.0% 3
Project Pinctada $131,382 Feb-15 OTH US Secondary 100% 0.46x 1.22x 8.8% 3
Project Habanero $130,935 Sep-17 LBO US Secondary 90% 0.18x 1.09x 8.6%* 0
Project Persian $168,721 Sep-14 OTH US Secondary 100% 0.49x 1.22x 8.0% 3-
Project Mallet $625,376 Sep-16 LBO US Secondary 67% 0.28x 1.11x 7.9% 3
Project Sundial $41,485 Jun-09 LBO Emerging Markets Secondary 107% 0.74x 1.42x 7.5% 4
Project Paddington $46,350 Dec-17 LBO US Secondary 101% 0.05x 1.07x 7.1%* 0
Project Winnebago $200,127 Jul-14 LBO Non-US Developed Secondary 91% 0.96x 1.26x 6.9% 4
Project Kane $47,195 Jul-17 LBO Non-US Developed Secondary 63% 0.62x 1.06x 6.0%* 0
Project Symphony $72,460 Nov-13 LBO Non-US Developed Secondary 95% 0.87x 1.08x 5.8% 4
Project Treble $580,241 Oct-08 DIV US Secondary 96% 1.20x 1.25x 5.5% 5
Project Tycoon $209,967 Aug-08 LBO US Secondary 97% 1.16x 1.20x 5.0% 5
Project Heinz $118,208 Dec-13 LBO Non-US Developed Secondary 95% 0.57x 1.27x 4.7% 3-
Project Crimson II $1,254,636 Mar-08 DIV US Secondary 92% 1.11x 1.24x 4.6% 5
Project Warring $287,164 Oct-17 LBO Emerging Markets Secondary 97% 0.06x 1.04x 4.5%* 0
Project Engineer $163,993 Apr-07 DIV US Secondary 96% 1.11x 1.22x 4.5% 5
Project Barley $310,237 May-08 LBO US Secondary 97% 1.13x 1.17x 4.0% 5
Project Masterpiece $110,528 Mar-08 DIV US Secondary 99% 1.11x 1.16x 3.8% 5
Project Tiger $81,485 Apr-08 VC US Secondary 100% 1.11x 1.11x 3.5% 5
Project Waban $75,876 Jun-08 VC US Secondary 95% 0.83x 1.23x 3.1% 5
Project Meiji $209,041 Aug-13 LBO Non-US Developed Secondary 95% 0.85x 1.05x 3.1% 4
Project Great Lakes $145,158 Dec-07 DIV US Secondary 100% 1.07x 1.07x 2.1% 5
Project Cyprus $129,750 Aug-17 ENR US Secondary 93% 0.01x 1.01x 0.8%* 0
Project Ball $72,129 Jan-18 DIV Non-US Developed Secondary 63% 0.00x 0.97x -3.1%* 0
Project Racer $218,695 May-14 DIV US Secondary 93% 0.46x 0.91x -4.2% 4
Project Athena $121,498 Aug-07 LBO Non-US Developed Secondary 99% 0.67x 0.75x -6.4% 5
Project Blackhawk $22,016 Sep-07 VC US Secondary 100% 0.72x 0.79x -6.5% 5
Project Harald $17,739 Sep-16 ENR Non-US Developed Secondary 53% 0.01x 0.89x -7.5% 3
Project Silver $382,542 Jun-08 DIV Emerging Markets Secondary 99% 0.81x 0.81x -7.7% 5
Project Shell 2 $47,428 Oct-07 OTH Non-US Developed Secondary 97% 0.53x 0.70x -8.1% 5
Project Interstate $168,127 Sep-13 LBO US Secondary 100% 0.35x 0.71x -10.3% 4
Project Next Steps $103,602 Jun-07 VC Non-US Developed Secondary 100% 0.55x 0.63x -11.2% 5
Project Emerald $40,870 Jan-08 VC US Secondary 100% 0.61x 0.61x -12.0% 5
Project Tiger II $127,364 Aug-07 LBO Emerging Markets Secondary 99% 0.50x 0.63x -13.1% 5
Project Harbor $348,108 Sep-12 ENR US Secondary 88% 0.45x 0.62x -16.7% 5
Project Bergen $26,436 Oct-14 ENR Non-US Developed Secondary 102% 0.07x 0.49x -21.3% 4
Project Revival $230,492 Aug-14 ENR US Secondary 101% 0.24x 0.47x -25.1% 5
Project Moose $111,255 May-14 ENR US Secondary 101% 0.22x 0.40x -26.7% 5

Confidential Partnership Fund Program-Q1'18
Detailed Schedule of Investments (Continued)
Royal Borough of Kensington and Chelsea Pension Fund 29
Client Level Partnership Level
Partnership by Subclass and TypeInvestment
CommitmentsDate ofMoney Closing Subclass Type
Drawn/Committed
Distributions/Drawn
Total Value/Drawn8 IRR12 ASP Rating13
.04
Project Tartan $64,190 Dec-13 LBO Non-US Developed Secondary 100% 0.00x 0.21x -31.8% 4
Project Basalt $15,828 Mar-17 VC US Secondary 88% 0.34x 1.41x N/A 2
Secondary Investments Total $22,198,268 90% 1.24x 1.65x 16.5%
Total $118,959,081 82% 0.88x 1.68x 14.6%
Notes and Footnotes
Confidential Quarterly Report-Q1'18
Royal Borough of Kensington and Chelsea Pension Fund 30
Important Notes, Footnotes, and Definitions1Includes offshore feeder expense draws.2Excludes offshore feeder expense draws.3Includes impact of expense draws and reflects offshore feeder value.4Client Gross IRR is the since inception IRR of the Adams Street Partners fund to the client, which is net of fees, carried interest and expenses charged by the fund’s underlying general partners and gross of Adams Street Partners’ fees, carried interest and expenses.
5Client Net IRR is the since inception IRR of the Adams Street Partners fund to the client, which is net of fees, carried interest and expenses charged by the fund’s underlying general partners and net of Adams Street Partners’ fees, carried interest and expenses.
6Client Total Value to Drawn is defined as (market value of the client’s interest in the Adams Street Partners fund + distributions to the client from the Adams Street Partners fund) / amount drawn from the client by the Adams Street Partners fund.
7Partnership level vintage year composite IRRs are net of fees, carried interest and expenses charged to the underlying private equity funds, but are gross of Adams Street Partners’ fees, carried interest and expenses, which reduce returns to investors. There can be no guarantee that unrealized investments will ultimately be liquidated at the values reflected in this return data. These returns may not be linked. Performance for vintage years later than 2015 is not shown because performance early in a fund’s life is not generally meaningful due to fee drag and immature investments.
8Partnership Total Value to Drawn is defined as (market value of the partnership(s) + distributions from the partnership(s) to the investing Adams Street Partners fund) / amount drawn by the partnership(s) from the investing Adams Street Partners fund.
9Client IRR is net of fees, carried interest and expenses charged by Adams Street Partners as well as underlying general partners.10Public Market Equivalent (PME) is calculated using the MSCI All Country World Index (Total Return) and is based on the cash flows from the Adams Street Partners fund to the client. During some periods in which Adams Street Partners investments outperformed the benchmark by a substantial margin, PME could not be calculated because the tracking position in the underlying benchmark index would have resulted in a short position. In these cases, the PME is calculated using the "Direct Alpha" PME methodology (Gredil, Griffiths, Stucke, "Benchmarking Private Equity: The Direct Alpha Method," 2014). Mathematically, Direct Alpha PME is equal to the IRR of the future value of the cash flows underlying the IRR calculation, where future value is based on the return of the benchmark index, less the IRR of the actual value of the cash flows.
11This is an aggregate IRR of the fund’s portfolio investments, which is net of fees, carried interest and expenses charged to the portfolio investments by the applicable general partners, and is gross of Adams Street Partners’ fees, carried interest and expenses, which reduce returns to investors. The aggregate IRR includes unrealized investments that may not ultimately be liquidated at the values reflected therein. The aggregate IRR of the fund’s portfolio investments is not to be confused with the gross or net IRR of the fund.
12IRRs are provided for individual partnerships and, if applicable, secondary investments that consist of one or more partnerships. IRRs are since inception and are net of general partner fees, carried interest and expenses, but are gross of Adams Street Partners’ fees, carried interest and expenses.
13ASP Rating Key: 0 Too early to tell 1 Pleased with performance 2 Pleased with progress 3 Average 4 Concerned with progress 5 Disappointed with performance + Positive trend - Negative trendN/A Not Applicable
14Aggregate portfolio company performance of co-investments in the indicated Adams Street fund.15Please note, partnership performance information is not provided due to confidentiality agreements with the relevant general partner.16Aggregate portfolio company performance of direct investments in the indicated Adams Street fund.
* Change in value over amount invested. Internal rates of return are not calculated for investments less than one year old.


