Department of Finance Pension Funds: Performance, Benchmarks and Costs Rob Bauer (Maastricht University) Co-authors: Martijn Cremers (Yale University) and Rik Frehen (Tilburg University) October 20 th 2009, Q-Group Fall 2009 Dana Point, California
Transcript
Department of Finance
Pension Funds: Performance, Benchmarks and Costs
Rob Bauer (Maastricht University)
Co-authors: Martijn Cremers (Yale University) and Rik Frehen (Tilburg University)
October 20th 2009, Q-Group Fall 2009 Dana Point, California
Department of Finance 2
Our Objective Measure the domestic equity performance of US
pension funds on a total plan level
For a variety of fund types and arrangements
Including information on reported benchmarks and cost levels
Investigate the cross-sectional differences in performance between pension funds
Department of Finance 3
Pension Fund Performance? Pension fund performance literature less developed
− Quality of data bases is often poor
− Data focused on managed accounts (not plan level)
− Data biases (no reporting obligation)
− Lack of cost data (often assumed)
− No information on benchmarks of the funds
Department of Finance 4
Performance Literature Risk-adjusted alpha before costs
Risk-adjusted alpha after costs
Mutual Funds 0 negative
Pension Funds ? ?
Department of Finance 5
Performance Literature (after costs)
Pension fund (mixed results)
− Beebower and Bergstrom (1977), DB portfolios + − Busse et al. (2006), DB portfolios + − Brinson, Hood and Beebower (1986), Plans - − Lakonishok et al. (1992), DB and DC Plans - − Elton, Gruber and Blake (2006), DC Plans -
Mutual Funds (consensus: minus)
− Jensen (1968), Malkiel (1995, 2005), Gruber (1996), Carhart (1997), Mahoney (2003), Chen et al. (2004), James and Karceski (2006) and many others.
Department of Finance 6
Our Main Results Pension fund domestic equity performance at total
plan level is zero after costs in most cases or slightly positive in some (small cap)
Cost levels in the pension fund industry are significantly lower than in the mutual fund industry
Size of collective not-for-profit vehicle (pension fund) creates economies of scale in costs: these are transferred directly to end-consumers (beneficiaries)
Department of Finance 7
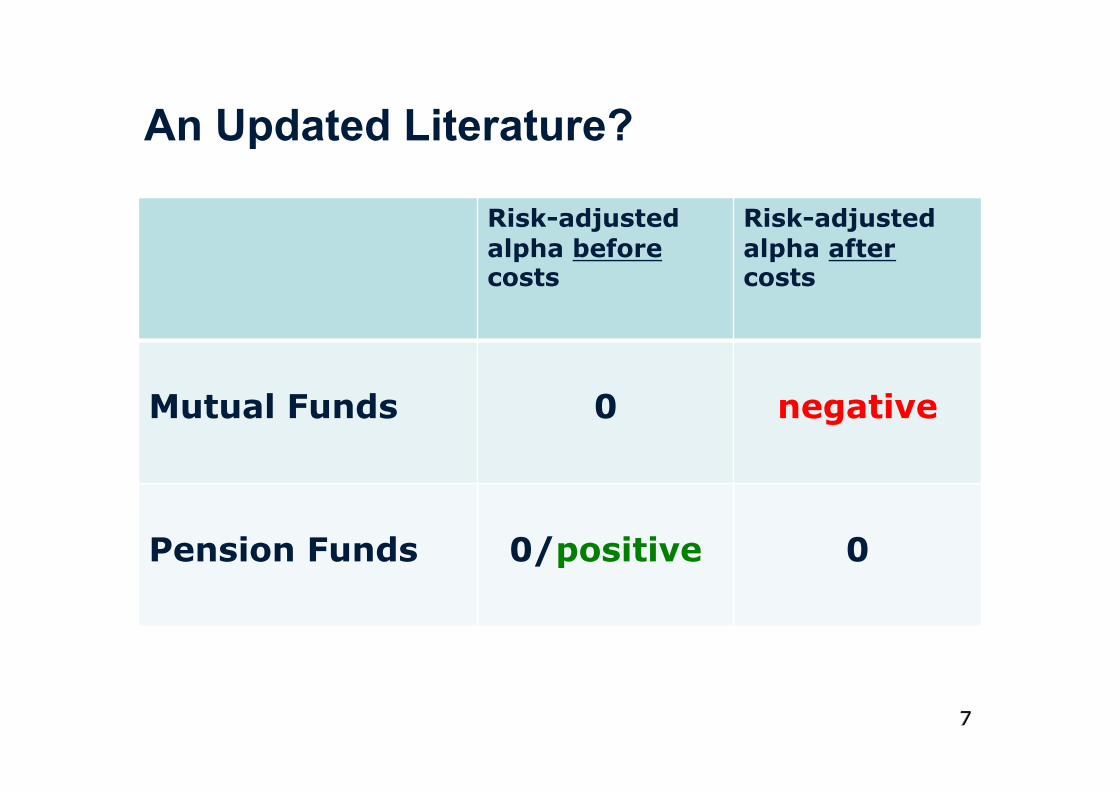
An Updated Literature?
Risk-adjusted alpha before costs
Risk-adjusted alpha after costs
Mutual Funds 0 negative
Pension Funds 0/positive 0
Department of Finance 8
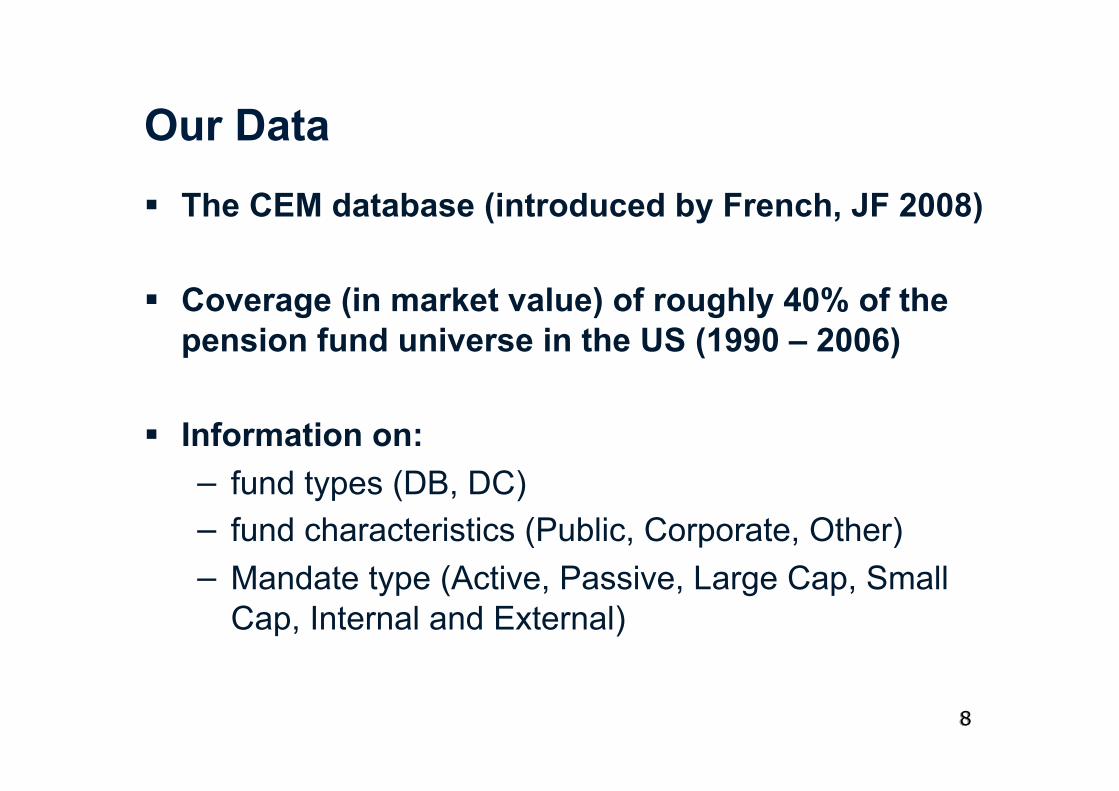
Our Data The CEM database (introduced by French, JF 2008)
Coverage (in market value) of roughly 40% of the pension fund universe in the US (1990 – 2006)
Information on: − fund types (DB, DC) − fund characteristics (Public, Corporate, Other) − Mandate type (Active, Passive, Large Cap, Small
Cap, Internal and External)
Department of Finance 9
CEM (Cost Effective Measurement) CEM Benchmarking collects yearly questionnaires
and provides annual fund-specific returns, benchmarks and cost data
Data is available at low aggregation level (portfolio) and can be aggregated to a total plan level
CEM has information on 463 DB funds (1990-2006) and 248 DC funds (1997-2006)
No evidence of a performance-related bias
Department of Finance
Passively Managed “Pas”
Actively Managed “Act”
Small Cap “SC”
Large Cap “LC”
Passively Large Cap “Pas LC”
Actively Large Cap “Act LC”
Actively Small Cap “Act SC”
Passively Small Cap “Pas SC”
Aggregation Level 2
Complete Sample “All”
Internally Actively Large Cap “Int Act LC”
Aggregation Level 1 (Only for DB Funds)
Aggregation Level 3
Aggregation Level 4
Externally Actively Large Cap “Ext Act LC”
Internally Passively Large Cap “Int Pas LC”
Externally Passively Large Cap “Ext Pas LC”
Internally Actively Small Cap “Int Act SC”
Externally Actively Small Cap “Ext Act SC”
Externally Passively Small Cap “Ext Pas SC”
Internally Passively Small Cap “Int Pas SC”
Data Structure
Department of Finance 11
Bias Tests Exit (Entry) Means Logit
Match CEM data with Compustat SFAS 158
Match CEM data with Compustat SFAS 158
Split yearly Compustat “Return on (Pension) Assets” into two groups:
Create 0-1 variable indicating fund presence in the CEM data set
1. Funds in years that they leave (enter) the data base
2. Funds in remaining years
Regress “presence dummy” on Compustat ROA
Perform a t-test on the mean difference
Perform a t-test on slope coefficient
Department of Finance 12
No Evidence of a Bias DB DC
Exit
Mean (p-value)
0.80% (0.31)
2.10% (0.09)
Entry
Mean (p-value)
0.10% (0.40)
-0.10% (0.40)
Logit
ROA (p-value)
0.36 (0.53)
0.49 (0.43)
Department of Finance 13
Costs and Size of Equity Holdings Costs Size (million $)
DB DC DB DC
Total 28.75 51.09 4,138 1,186
Largest 30% 16.09 42.47 10,759 3,023
Smallest 30% 39.92 61.30 389 192
Corporate 32.63 48.45 2,269 1,190
Largest 30% 24.42 39.16 5,860 2,695
Smallest 30% 40.22 56.90 370 219
Public 21.33 58.68 6,964 1,629
Largest 30% 9.32 55.26 17,313 4,387
Smallest 30% 34.05 73.15 661 234
Other 29.46 - 2,863 -
Largest 30% 14.75 - 6,275 -
Smallest 30% 42.75 - 291 -
Department of Finance 14
Analysis of Cost and Size Differences
Cost difference between DB and DC of approximately 20 basis points
Size seems to be a driver of cost differences across fund types and characteristics
Larger funds have lower cost levels
Generally: pension fund cost levels are lower than those observed in the mutual fund universe
Department of Finance 15
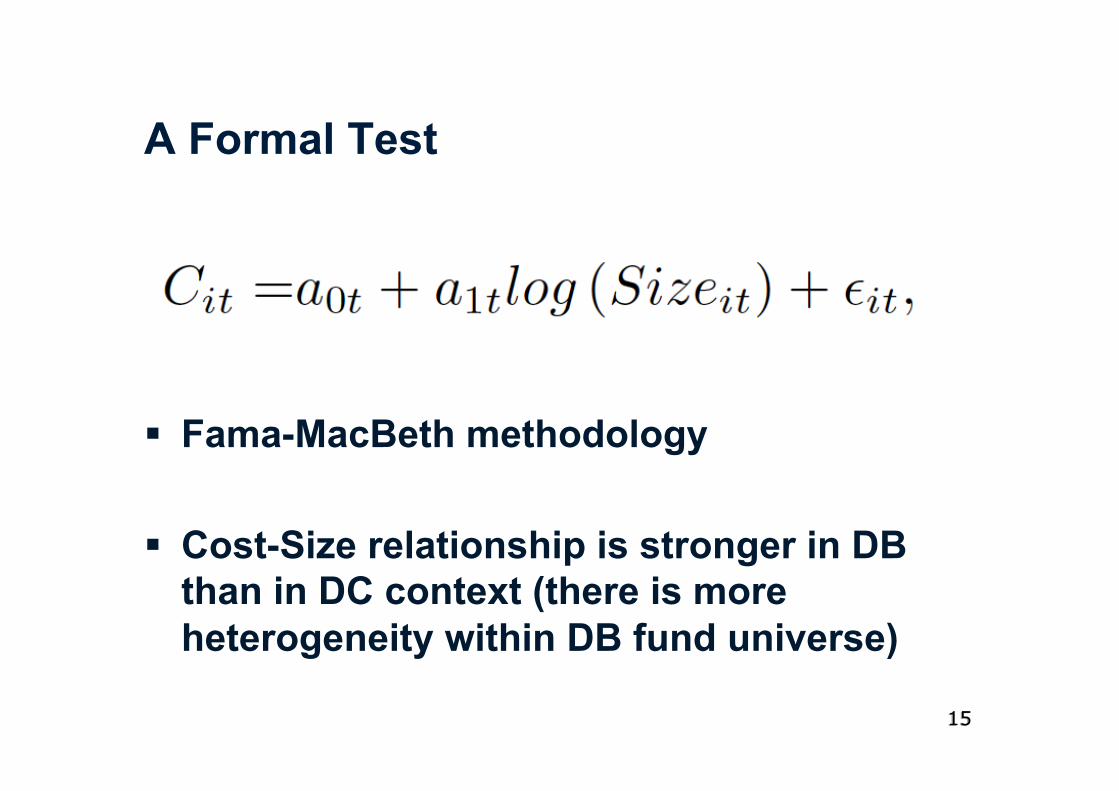
A Formal Test
Fama-MacBeth methodology
Cost-Size relationship is stronger in DB than in DC context (there is more heterogeneity within DB fund universe)
Department of Finance
Costs Explained by Size DB
a0 a1
Total 112.22 -9.24
(p-value) (0.00) (0.00)
Large Cap 93.15 -7.89
(p-value) (0.00) (0.00)
Small Cap 87.80 -8.42
(p-value) (0.00) (0.00)
Active 114.64 -5.78
(p-value) (0.00) (0.00)
Passive 28.67 -2.53
(p-value) (0.00) (0.00)
External 102.65 -7.69
(p-value) (0.00) (0.00)
Internal 23.73 -1.78
(p-value) (0.00) (0.00)
Department of Finance 17
Size is not the Only Driver
Internal management is cheaper than external management (may be indirectly size related)
Passive is cheaper than active (related to the lack of promise of delivering alpha)
Department of Finance 18
Equity Holdings (DB) Total Cor Pub Oth L30% S30%
Large Cap 90.49 90.90 89.87 90.26 93.01 88.30
Small Cap 9.51 9.10 10.13 9.74 6.99 11.70
Active 69.41 73.66 63.30 68.61 57.24 78.87
Passive 30.59 26.34 36.70 31.39 42.76 21.13
Internal 13.84 9.62 20.15 7.13 27.74 2.86
External 87.16 90.38 79.85 92.87 72.26 97.14
Department of Finance 19
Analysis of Equity Holdings Allocation within equities does not vary a lot
between different funds (Corporate, Public and Other)
One exception: public funds invest more internally (size related)
Large funds have less invested in small cap portfolios, less active portfolios and more internally managed portfolios (size related) than smaller funds
Less heterogeneity in DC fund universe
Department of Finance 20
What About Benchmarks?
0.00%
10.00%
20.00%
30.00%
40.00%
50.00%
60.00% P
erc
en
tag
e o
f Fu
nd
s u
sin
g B
en
chm
ark
Market Share of Large Cap Benchmarks
S&P 500
Russell 3000
Russell 1000
Wilshire 5000
Department of Finance 21
What About Benchmarks?
0.00%
10.00%
20.00%
30.00%
40.00%
50.00%
60.00%
70.00%
Perc
en
tag
e o
f Fu
nd
s u
sin
g B
en
chm
ark
Market Share of Small Cap Benchmarks
Russell 2000
Russell 2500
Russell 3000
Wilshire 4500
Wilshire 5000
S&P 400
S&P 500
S&P 600
Department of Finance 22
Analysis of Benchmarks
Large cap portfolios: three benchmarks are competing (S&P 500, Russell 3000 and Russell 1000)
For small cap portfolios the Russell 2000 is the dominant benchmark
In performance measurement benchmarks matter, see Cremers, Petajisto and Zitzewitz (2009)
Department of Finance 23
Risk-adjustment Procedure
Regress net excess returns on Fama-French Factors:
We assume that α and β are drawn independently from distributions with constant means and variances:
Ωβ is a diagonal matrix and β a vector with factor loadings to Fama-French factors. In addition we regress:
Department of Finance 24
Benchmarks Matter
Choice of benchmark matters, consistent with Cremers, Petajisto and Zitzewitz (2009)
S&P 500 is most conservative choice
Department of Finance
Bold = statistically significant
α (benchmark-adjusted net
returns)
α (net returns)
Total 0.43% 0.41%
Large Cap 0.18% -0.07%
Small Cap 3.43% 5.09%
Active 0.45% 0.64%
Passive 0.43% 0.10%
Internal 1.56% 1.22%
External 0.45% 0.53%
Risk-adjusted Net Performance DB
Department of Finance 26
Analysis of Results
Risk-adjusted returns for DB fund domestic equity performance at total plan level on average are zero after costs
Exception is small cap segment, but the interpretation of this result might be influenced by the choice of the market factor
DC analysis provides similar results: all risk-adjusted returns are zero after costs
Department of Finance 27
Cross-sectional Analysis Inspired by Brennan et al. (1998):
First: risk correction per fund (times series) Then: cross-sectional regression of alpha’s
on constant and characteristics Times series regression constant and
characteristics of stage 2 on constant (“c”) and FF-factors
Characteristics: Log (Size), % Internal (more to follow)
Department of Finance 28
Cross-sectional Analysis Results (DB) I Constant (without
characteristics)
Total 0.35%
Large Cap 0.76%
Small Cap 4.00%
Active 1.39%
Passive 1.21%
External 1.44%
Internal 0.61%
Department of Finance 29
Impact Characteristics on Alpha (DB) I Constant Log (Size) % Internal
Total 13.88 -1.22 1.88
Large Cap 10.10 -1.06 2.89
Small Cap 1.31 -15.70 29.73
Active 3.40 -1.34 1.59
Passive 5.06 -0.63 1.89
External 2.54 -0.73 -
Internal 55.19 -1.30 -
Department of Finance 30
Analysis of Cross-sectional Results
Constant can be interpreted as alpha: alphas are robust with previous risk-adjustment procedure
Size does lead to lower alphas in all categories, especially small cap (diseconomies of scale?)
Size results imply that selection bias of CEM data base is less relevant
% Internal management is positively related to alpha
Department of Finance 31
Discussion (I) Why do pension funds have zero returns after
costs?
The majority of funds outsources asset management to the financial services industry that also provides similar (mutual) funds to individual investors
Are reduced agency costs a driving force behind the relative outperformance of (not-for-profit) pension funds versus mutual funds?
Difficult hypothesis to test directly (TBC)
Department of Finance 32
Discussion (II) Pension funds (boards) can
− Demand separate accounts with clear and client-oriented investment guidelines
− Monitor external managers with more capacity than individuals
− Negotiate costs in a more stringent way − Transfer benefits directly to plan participants
The larger the fund size, the lower the cost levels
However, some evidence of diseconomies of scale (e.g. in small cap segment)
Department of Finance 33
Discussion (III) Organizational structure of pension funds is
distinct from the mutual fund industry
In a corporate pension fund, the employees of a corporation delegate investment choices to a corporate treasurer
Our results provide evidence that the agency costs in the pension fund industry linked to this additional layer of delegation are less material than shown by Lakonishok et al. (1992)
Department of Finance
“In a world where the clients of (….) financial services organizations are millions of remote, faceless individuals, will the boards and managers (….) they hire serve the financial interests of the beneficiaries? Or will they use their power to serve their own interests? ”
Keith Ambachtsheer (2005, FAJ)
Department of Finance 35
Concluding Comments Pension fund domestic equity performance at total
plan level is zero after costs in most cases or positive in some (small cap)
Cost levels in the pension fund industry are significantly lower than in the mutual fund industry
Apparently, these cost advantages are transferred directly to end-consumers (beneficiaries): reduced agency costs outweigh possible agency costs in the pension industry


![arXiv:2005.12873v3 [cs.DC] 7 Jun 2020processing benchmarks [12]. They studied about distributed and parallel benchmarks for graph analyzers, graph database benchmarks, benchmarks for](https://static.documents.pub/doc/80x56/60c4e778df2cd14e603091d9/arxiv200512873v3-csdc-7-jun-2020-processing-benchmarks-12-they-studied-about.jpg)


![Benchmarks - June, 2013 | Benchmarks Onlineit.unt.edu/sites/default/files/benchmarks-06-2013.pdf · Benchmarks - June, 2013 | Benchmarks Online 4/26/16, 8:52:25 AM] Skip to content](https://static.documents.pub/doc/80x56/5f9d6dd4a6e586755376b37d/benchmarks-june-2013-benchmarks-benchmarks-june-2013-benchmarks-online.jpg)