108
PENSION MARKETS IN FOCUS 2019

PENSION MARKETS IN FOCUS 2019


Pension Markets in Focus 2019

PENSION MARKETS IN FOCUS 2019 © OECD 2019
This work is published under the responsibility of the Secretary-General of the OECD. The opinions expressed and arguments
employed herein do not necessarily reflect the official views of OECD member countries. This document and any map included herein
are without prejudice to the status of or sovereignty over any territory, to the delimitation of international frontiers and boundaries and
to the name of any territory, city or area.
The statistical data for Israel are supplied by and under the responsibility of the relevant Israeli authorities. The use of such data by
the OECD is without prejudice to the status of the Golan Heights, East Jerusalem and Israeli settlements in the West Bank under
the terms of international law.
Please cite this publication as: OECD (2019), Pension Markets in Focus,
www.oecd.org/daf/fin/private-pensions/pensionmarketsinfocus.htm

3
PENSION MARKETS IN FOCUS 2019 © OECD 2019
The 2019 edition of Pension Markets in Focus provides an overview of the funded and private components of pension systems in 88 jurisdictions and outlines latest developments in the markets worldwide. It exhibits an extensive range of indicators relevant to funded and private pension arrangements, harmonised and standardised across jurisdictions. It monitors the key financial aspects of these arrangements, such as the amount of accumulated assets, the way these assets are invested and their investment performance, both over the past year and over the longer term. The report also examines the proportion of the population covered by pension plans, the amount of contributions paid into these plans and the benefits that members receive at retirement.
The special feature in this year’s edition examines the gender pension gap from the angle of funded and private pensions.
The data used to prepare this report have been collected from national authorities within the framework of the OECD’s Global Pension Statistics project first initiated in 2002 by the OECD Working Party on Private Pensions. The OECD’s partnership with the International Organisation of Pension Supervisors (IOPS) and the World Bank in more recent years has broadened the geographical coverage well beyond the 36 OECD countries to encompass a total of 88 jurisdictions.
The OECD is grateful to the national authorities for providing data and comments, the IOPS and the World Bank who made the preparation of this report possible.
This report was prepared by Romain Despalins under the supervision of Pablo Antolin and Stéphanie Payet from the Private Pension Unit of the OECD Directorate for Financial and Enterprise Affairs. Comments and inputs from Boele Bonthuis, Elsa Favre-Baron, Diana Hourani, Maciej Lis, Jessica Mosher on the special feature of this report are gratefully acknowledged. Karen Castillo, Pamela Duffin and Arianna Ingle provided editorial assistance.
Foreword


5
PENSION MARKETS IN FOCUS 2019 © OECD 2019
Table of contents
Foreword 3
Main findings 7
1 Overview and latest developments in funded and private pension systems 9 1.1. Importance of the funded and private pension systems 9 1.2. Investment performance and allocation of pension assets 27 1.3. Specificities and challenges of defined benefit and defined contribution plans 35
2 Gender and private pensions 45 2.1. Measuring the gender gap in total pensions and in funded and private pensions 45 2.2. Current gender gaps during the accumulation phase in funded and private pension plans 56 References 62
Annex A. Features of pension plans and coverage of this report 63
Annex B. Statistical tables 67
Methodological notes 93 General notes 93 Specific notes 94
FIGURES
Figure 1.1. Size of assets in funded and private pension plans in reporting jurisdictions, 2018 or latest year available 10 Figure 1.2. Geographical distribution of pension assets in the OECD area, 2018 12 Figure 1.3. Total assets in funded and private pension arrangements, in 2008 (or first year available) and 2018 (or latest year available) 13 Figure 1.4. Annual nominal growth rates of assets in pension plans between end-2017 and end-2018 and between end-2008 and end-2018 (or longest period available) in selected OECD and other jurisdictions 14 Figure 1.5. Total amount of assets in funded and private pension plans in the OECD and in other jurisdictions, 2008-2018 15 Figure 1.6. Coverage of funded and private pension plans in selected OECD and other jurisdictions, by type of plan, latest year available 17 Figure 1.7. Evolution of the coverage of pension plans in a selection of countries between 2008 (or the first year available) and 2018 (or the latest year available), by type of plan 19 Figure 1.8. Proportions of individuals owning assets and individuals contributing to their individual accounts in selected Latin American countries, 2018 20 Figure 1.9. Minimum or mandatory contribution rates (for an average earner) in mandatory and auto-enrolment plans (unless specified otherwise) 21

6
PENSION MARKETS IN FOCUS 2019 © OECD 2019
Figure 1.10. Employer, employee and state contributions paid into funded and private pension plans, in selected OECD and other jurisdictions, 2008 (or first year available) and 2018 (or latest year available) 23 Figure 1.11. Average annual contribution per active account or member in selected OECD and other jurisdictions, latest year available 24 Figure 1.12. Total benefits paid by funded and private pension plans and assets transferred to an insurance company or another third party, 2018 or latest year available 26 Figure 1.13. Annual real investment rates of return of funded and private pension plans, net of investment expenses, 2018 27 Figure 1.14. Allocation of assets in funded and private pension plans in selected asset classes and investment vehicles, 2018 or latest year available 30 Figure 1.15. Variations in the proportion of assets in pension plans invested in equities and bills and bonds between 2017 and 2018 and over the longest time period possible in selected countries 32 Figure 1.16. Average allocation of assets in pension plans in selected asset classes in the OECD area, 2008 (or first year available) and 2018 (or latest year available) 33 Figure 1.17. Assets in funded and private pension plans invested abroad and in foreign currencies, in 2008 (or first year available) and 2018 (or latest year available) 34 Figure 1.18. Split of pension assets by type of plan, 2008 (or first year available) and 2018 (or latest year available) 36 Figure 1.19. Assets and liabilities of DB plans (in billions of national currency) and their ratio (in per cent) in selected jurisdictions, 2008-2018 38 Figure 1.20. Annual fees or commissions charged to members, 2018 or latest year available 43 Figure 2.1. Gender gap in pensions in the OECD, latest year available 48 Figure 2.2. Gender pension gap in OECD countries according to different sources, latest year available 49 Figure 2.3. Evolution of the gender pension gap in selected OECD countries 50 Figure 2.4. Factors potentially affecting the gender pension gap 52 Figure 2.5. Proportion of individuals aged 65+ receiving a regular private pension income, 2014 54 Figure 2.6. Differences in occupational pension plan coverage of men and women, in selected countries, 2014 57 Figure 2.7. Proportion of women working by sector and overall coverage of occupational plans by sector, 2014 59 Figure 2.8. Gender gap in assets (or entitlements) in all pension plans, 2014 60 Figure 2.9. Average amount of assets in pension plans by gender and age group in selected countries, 2014 61
Figure A A.1. Features of pension plans 63
TABLES
Table 1.1. Nominal and real geometric average annual investment rates of return of funded and private pension plans over the last 5, 10 and 15 years 29 Table 1.2. Fee structure and caps in selected OECD countries and other jurisdictions 40 Table 2.1. Impact of gender differences in labour markets on rights and savings in different pension designs 53 Table 2.2. Gender gap in private pension income in selected OECD countries, latest year available 55 Table 2.3. Coverage of private pension plans in selected OECD countries, by gender, 2014 56
Table A A.1. Existing types of plans by country and data coverage 66 Table A B.1. Total assets in funded and private pension plans, in millions of national currency, 2008-2018 68 Table A B.2. Total assets in funded and private pension plans, in millions of USD, 2008-2018 70 Table A B.3. Total assets in funded and private pension plans, as % of GDP, 2008-2018 72 Table A B.4. Contributions into funded and private pension plans, 2008-2018 74 Table A B.5. Total benefits paid by funded and private pension plans, 2008-2018 76 Table A B.6. Annual nominal investment rates of return of all funded and private pension plans, 2008-2018 78 Table A B.7. Annual real investment rates of return of all funded and private pension plans, 2008-2018 80 Table A B.8. Allocation of assets in funded and private pension plans in equities 82 Table A B.9. Allocation of assets in funded and private pension plans in bills and bonds 84 Table A B.10. Allocation of assets in funded and private pension plans in cash and deposits 86 Table A B.11. Allocation of assets in funded and private pension plans in the "other" category 88 Table A B.12. Share of assets in funded and private pension plans invested abroad, 2008-2018 90 Table A B.13. Share of assets issued in foreign currencies of funded and pension plans, 2008-2018 92

7
PENSION MARKETS IN FOCUS 2019 © OECD 2019
Pension assets have grown over the last decade despite declining in 2018 compared to 2017
Pension assets accumulated through pension funds, pension insurance contracts and other retirement savings products amounted to USD 44.1 trillion at the end of 2018 (USD 42.5 trillion in the OECD area and USD 1.6 trillion in other reporting jurisdictions), down from USD 45.6 trillion in 2017. Over the last decade however, pension assets have increased in nominal terms in almost all reporting countries.
The asset growth over the last decade may be partly attributable to an increase in the proportion of working-age people covered by a pension plan. This increase in coverage was especially strong in countries with relatively recent mandatory (e.g. Israel, Latvia, Bulgaria, Colombia, North Macedonia) or auto-enrolment (e.g. New Zealand) programmes. The increased proportion of individuals with a pension plan, coupled with an increase in contribution rates in some countries (e.g. New Zealand), probably accounts for the increase in total contributions and then in assets.
Benefit payments also affect the trend in pension assets as they lower the overall amount of assets. The size of benefit payments remained limited in countries with relatively recent funded pension systems (e.g. Estonia, North Macedonia).
Pension assets were hit by the downturn on equity markets in 2018, but are still generating positive investment income over the longer term
Real investment rates of return (net of investment expenses) of pension plans were negative in 2018 on average in the OECD area (-3.2%) and just below 0% in other jurisdictions. The average real investment rate of return, net of investment expenses, weighted by the assets managed at the end 2018, was even lower, at -4.5% in the OECD area and -0.7% in other jurisdictions, reflecting that some of the largest pension markets suffered larger losses than others (e.g. the United States with -6.7%). The downturn on equity markets in the last quarter of 2018 is the most probable reason for the poor financial results of pension plans in 2018.
Viewed over a longer period, pension assets have achieved positive real investment rates of return (net of investment expenses) in most reporting countries. Over the last 15 years, Colombia recorded the strongest average annual real return (6.2%), followed by Canada (4.8%) and Australia (4.7%) among the 22 reporting jurisdictions. By contrast, the annual average return of funded and private pension plans was close to 0% in the Czech Republic and slightly negative in Estonia (-0.7%) and Latvia (-1.0%).
A transition from defined benefit to defined contribution plans continues
Occupational defined contribution (DC) plans and personal plans have been gaining prominence at the expense of defined benefit (DB) plans even in countries with a historically high proportion of assets in DB plans. Over the last decade, the proportion of assets in DB plans has declined in 17 out of the 22 reporting countries with DB plans, including the United States (33% in 2018 compared to 39% in 2008). The fastest
Main findings

8
PENSION MARKETS IN FOCUS 2019 © OECD 2019
shift away from DB plans happened in Israel where DB plans have been closed to new members since 1995. Assets in DB plans, however, continued to increase in most reporting countries, but were not enough to cover the liabilities in a few of them in 2018 (e.g. the United Kingdom, the United States).
Providers of DC plans charge fees to members to cover the cost of running these plans. These fees reduce the overall amount of pension assets that individuals accumulate for their retirement. Fees were highest relative to the size of assets under management in Albania, Pakistan and Turkey.
A gender pension gap exists in all OECD countries
Complementing administrative sources, multinational household surveys confirmed the well-documented gap in retirement income that men and women receive (the gender pension gap) in reporting OECD countries. This gap may be the result of past differences in labour market outcomes, such as the lower share of women employed, the shorter careers and lower wages of women compared to men.
Men and women do not receive the same amount of pensions from funded and private pension plans in some countries. Fewer women receive a regular private pension income. When they do, this income is generally lower than men’s incomes. This difference could come from lower entitlements or assets at the end of the accumulation phase and the type of retirement products for the pay-out phase. Annuities in some countries take into account that women will live longer than men, offering lower pension income payments for women compared to men for the same amount of accumulated assets. However, the overall pension wealth is not affected.
Women accrue fewer assets or rights during the accumulation phase
Women accrue fewer entitlements (in DB plans) or assets (in DC plans) than men during the accumulation phase. Women are less likely to participate in a pension plan. This difference is not only due to the lower share of women employed, but because women in some countries work in areas where workers are less likely to be covered by a pension plan. Women are also likely to accumulate a lower balance than men during their working lives. The gap in pension assets appears and widens when women are aged 25 to 44, when they are most likely to take a career break for parenting. Differences in pension assets are likely to compound over time as these assets are invested in financial markets and yield investment returns.

9
PENSION MARKETS IN FOCUS 2019 © OECD 2019
Monitoring pension systems closely is key to identify the main strengths and challenges they face. Monitoring requires detailed statistics. All countries track and follow the developments in their pension systems through regular data collections. This report intends to provide a regular source of detailed and up-to-date statistics on funded and private pension plans, comparable across countries. The report also shows the latest developments in the sector and the main drivers.
This report covers all funded pension plans regardless of whether assets are accumulated for retirement in pension funds, through pension insurance contracts or other vehicles. These assets may be administered by a public or private entity and may cover public or private sector workers, the unemployed and even children in some countries. Employers’ book reserves - that are private (unfunded) plans - are also included in this report. Annex A describes the features of funded and private pension plans in more detail. This annex also specifies which types of plan exist in all reporting countries and whether data in this chapter cover these plans.
This chapter first provides an overview of the importance of the funded and private pension plans around the globe along four aspects: i) the amount of accumulated pension assets; ii) the proportion of individuals covered by a pension plan; iii) the contributions paid into these plans; and iv) the benefits that these plans pay to retirees. Secondly, it examines the investment performance of pension assets and the way these assets are invested. The last part of this chapter shows the size of defined benefit (DB) and defined contribution (DC) plans (in terms of assets) and the evolution of the pension landscape, before looking further into some specificities of these plans (i.e. funding ratios for DB plans, fees charged to members for DC plans).
1.1. Importance of the funded and private pension systems
1.1.1. Assets
Substantial assets have been provisioned in pension plans around the world to finance future pension benefits. Pension assets exceeded USD 40 trillion worldwide in 2018.1 Pension assets were overwhelmingly accumulated through pension funds, gathering alone over USD 28 trillion of assets at the 1 This estimate for 2018 is based on data collected through the joint OECD, IOPS and World Bank Global Pension Statistics exercise. This statistical exercise collects the total amount of investments related to funded and private pension plans. This amount is used as an estimate of total assets in funded and private pension plans. While in general, the difference between assets and investments would be minimal, this difference may be more substantial in some cases, such as the United States, where claims of pension funds on the plan sponsors are considered as asset of the (defined benefit) plan but not as an investment.
1 Overview and latest developments
in funded and private pension
systems

10
PENSION MARKETS IN FOCUS 2019 © OECD 2019
end of 2018. Some countries also use other vehicles to save for retirement such as pension insurance contracts sold by insurance companies (e.g. Denmark, France) or products offered and managed by banks and investment companies (e.g. individual retirement accounts, IRAs, in the United States).
Pension assets were of varying importance across countries. In absolute terms, the largest amounts were recorded in North America (in Canada and the United States), Western Europe (in the Netherlands and the United Kingdom) and in Australia and Japan, exceeding USD 1 trillion in these six countries (Figure 1.1, Panel A). By contrast, pension assets represented less than USD 0.2 trillion in 70 reporting jurisdictions.2
In relative terms, large differences also exist across countries. Within the OECD area, 8 out of 36 countries had assets at the end of 2018 above 100% of their economy (Figure 1.1, Panel B). In small countries like Iceland, assets accumulated are small worldwide but high in respect to their economy (161% of GDP). Pension assets in Switzerland were below USD 1 trillion at the end of 2018, but they represented over 100% of GDP (142% of GDP). By contrast, the amount of pension assets was lower than 20% of GDP in 54 out of 87 reporting jurisdictions, including some fast developing countries (e.g. China, India).3
Figure 1.1. Size of assets in funded and private pension plans in reporting jurisdictions, 2018 or latest year available
A. In USD trillion
2 The total amount of assets in funded and private pension plans is available in millions of national currency in Table A B.1, in USD million in Table A B.2and as a percentage of GDP in Table A B.3 in Annex B. 3 Statistics for China and India only cover a part of their funded and private pension system. Please see the methodological notes and Annex A for more information about the data coverage of China, India and all the reporting countries participating in the OECD, IOPS and World Bank statistical exercise.

11
PENSION MARKETS IN FOCUS 2019 © OECD 2019
B. As a percentage of GDP
Note: Please see the methodological notes at the end of the report.
Source: OECD Global Pension Statistics.
Pension assets were also unevenly distributed within regions. South Africa had the largest amount of pension assets in Africa, exceeding USD 0.2 trillion, and was one of the two African countries, together with Namibia, to have assets accounting for more than 50% of GDP. Brazil and Chile also stood out in Latin America, where Brazil held the largest amount of pension assets in USD terms, while Chile held the largest amount relative to the size of its economy. This may be the result of the relative seniority of the funded pension system in these two countries. Regulations on closed pension funds – sponsored by employers, trade unions and associations in Brazil – were issued in 1977. In Chile, the funded pension system was introduced almost 40 years ago (in 1981).
Within the OECD area, 7 out of the 36 OECD countries held more than 90% of the total pension assets of the OECD area. The United States had the largest pension market within the OECD, with assets worth USD 27.5 trillion, representing 64.8% of the OECD total (Figure 1.2). The United Kingdom recorded the second largest amount (USD 2.8 trillion, i.e. 6.6% of OECD pension assets), followed by Canada (USD 2.5 trillion, 5.9% of OECD pension assets), Australia (USD 1.9 trillion, 4.5% of OECD pension assets), the Netherlands (USD 1.5 trillion, 3.6% of OECD pension assets), Japan (USD 1.4 trillion, 3.3% of OECD total pension assets) and Switzerland (just below USD 1.0 trillion, 2.3% of OECD pension assets). The 29 other OECD countries held the remaining 8.9% of the OECD pension assets.

12
PENSION MARKETS IN FOCUS 2019 © OECD 2019
Figure 1.2. Geographical distribution of pension assets in the OECD area, 2018
As a percentage of total pension assets
Note: Please see the methodological notes at the end of the report.
Source: OECD Global Pension Statistics.
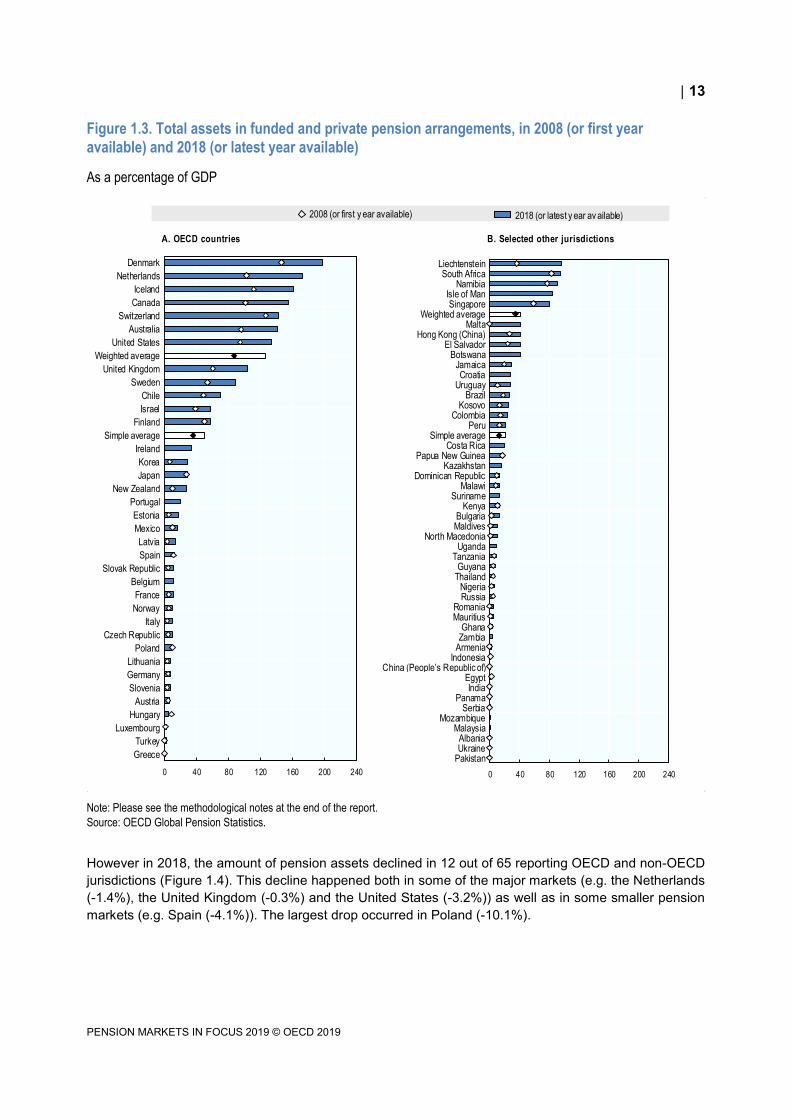
The role of funded and private plans has been growing in almost all countries over time. The ratio of assets to GDP has increased in 68 out of 71 reporting countries over the last decade (Figure 1.3). The number of countries with pension assets exceeding GDP increased from five in 2008 to eight in 2018. The OECD average ratio of assets to GDP, weighted according to the pension assets in each country, was 126% in 2018, compared to 49.7% in 2008. Like in 2008, Denmark topped the ranking in 2018, with assets worth 198.6% of GDP, followed by the Netherlands (173.3%) and Iceland (161%). By contrast, pension assets still represented less than 1% of the GDP in Greece in 2018. Asset-to-GDP ratios also rose outside the OECD area (with a weighted average of 41.5% in 2018 compared to 35.2% in 2008). Pension assets almost reached the level of the GDP in some non-OECD jurisdictions in 2018, such as in Liechtenstein (95.6%) and South Africa (95.1%).
United States
64.8%
United Kingdom
6.6%
Canada
5.9%
Australia
4.5%
Netherlands
3.6%
Japan
3.3%
Switzerland
2.3%
Other OECD
countries8.9%
13
PENSION MARKETS IN FOCUS 2019 © OECD 2019
Figure 1.3. Total assets in funded and private pension arrangements, in 2008 (or first year available) and 2018 (or latest year available)
As a percentage of GDP
Note: Please see the methodological notes at the end of the report.
Source: OECD Global Pension Statistics.
However in 2018, the amount of pension assets declined in 12 out of 65 reporting OECD and non-OECD jurisdictions (Figure 1.4). This decline happened both in some of the major markets (e.g. the Netherlands (-1.4%), the United Kingdom (-0.3%) and the United States (-3.2%)) as well as in some smaller pension markets (e.g. Spain (-4.1%)). The largest drop occurred in Poland (-10.1%).
A. OECD countries B. Selected other jurisdictions
Denmark
Netherlands
Iceland
Canada
Switzerland
Australia
United States
Weighted average
United Kingdom
Sweden
Chile
Israel
Finland
Simple average
Ireland
Korea
Japan
New Zealand
Portugal
Estonia
Mexico
Latvia
Spain
Slovak Republic
Belgium
France
Norway
Italy
Czech Republic
Poland
Lithuania
Germany
Slovenia
Austria
Hungary
Luxembourg
Turkey
Greece
0 40 80 120 160 200 240
LiechtensteinSouth Africa
NamibiaIsle of ManSingapore
Weighted averageMalta
Hong Kong (China)El Salvador
BotswanaJamaicaCroatia
UruguayBrazil
KosovoColombia
PeruSimple average
Costa RicaPapua New Guinea
KazakhstanDominican Republic
MalawiSuriname
KenyaBulgariaMaldives
North MacedoniaUganda
TanzaniaGuyana
ThailandNigeriaRussia
RomaniaMauritius
GhanaZambia
ArmeniaIndonesia
China (People’s Republic of)EgyptIndia
PanamaSerbia
MozambiqueMalaysia
AlbaniaUkraine
Pakistan
0 40 80 120 160 200 240
2018 (or latest y ear av ailable)2008 (or first y ear available)

14
PENSION MARKETS IN FOCUS 2019 © OECD 2019
Figure 1.4. Annual nominal growth rates of assets in pension plans between end-2017 and end-2018 and between end-2008 and end-2018 (or longest period available) in selected OECD and other jurisdictions
In per cent
Note: Please see the methodological notes at the end of the report.
Source: OECD Global Pension Statistics.
Over the last ten years, all reporting jurisdictions but Hungary experienced a positive average nominal growth rate in pension assets. The largest increases were observed in countries with relatively recent and small amount of pension assets relative to the size of their economy (e.g. Armenia, Albania and Malawi). Armenia phased in mandatory participation in funded pension plans recently (in 2014). By contrast, the size of pension assets was lower in 2018 than in 2008 in Hungary, following a major overhaul of the funded and private pension system in 2011.
Some other European countries also transferred some pension assets back to the public system (e.g. Poland in 2014). The Czech Republic also terminated and wound up retirement funds with savings from the second pension pillar by the end of 2016. Assets in these funds were either paid in cash or transferred to voluntary pension plans. Despite these reversals or reforms affecting savings in funded and private pension plans, pension assets in these countries still exceeded in 2018 their 2008 levels.
The overall amount of pension assets in 2018 was therefore well above the 2008 level both in the OECD area and in other jurisdictions, despite a recent decline in 2018 compared to 2017. Pension assets amounted to USD 42.5 trillion in the OECD area and USD 1.6 trillion in other jurisdictions in 2018,
POL
ESP
AUTUSA
FIN
PER
CHE
DNK
NLD
HUN
JPN
GBR
LUX
FRA
HKGNOR
CAN
RUSSWE
ISR
XKO
IDN
COL
ITA
GRC
DEU
PAN
CHLMEX
THA
SVN
SVK
BGR
SLV
KOR
URY
NZL
PNGISL
EST
BRA
KEN
NAMLTU
SGP
AUS
LVA
CZE
SRB
UKR
EGY
PAK
MKD
JAM
CHN NGA
TUR
GHA
ROU
MDV
GUY
DOM
MWI
ALB
-20
-10
0
10
20
30
40
50
60
-20 -10 0 10 20 30 40
Grow th rate betw een end-2017 and end-2018
Annual grow th rate betw een end-2008 and end-2018 (or longest period available)
Increase in assets in 2018 and over the last years
Decrease in assets in 2018 but increase over the last years
Decrease in assets in 2018 and over the last years
Increase in assets in 2018 but decrease over the last years

15
PENSION MARKETS IN FOCUS 2019 © OECD 2019
compared to USD 23.0 trillion in the OECD area and USD 0.6 trillion in other jurisdictions in 2008 (Figure 1.5).
Figure 1.5. Total amount of assets in funded and private pension plans in the OECD and in other jurisdictions, 2008-2018
in USD trillion
Note: Please see the methodological notes at the end of the report.
Source: OECD Global Pension Statistics.
A combination of factors may have driven these trends in pension assets, such as the evolution of members having a pension plan, their contributions into their plans, the benefits that these plans paid to retirees and the financial performance of pension assets mainly. The subsequent sections of this report examine these different factors in detail.
1.1.2. Coverage
The proportion of individuals participating in funded and private pension plans is a useful indicator to assess how widespread pension plans in a country are and how many people accumulate additional savings for their retirement, on top of what they can expect from the public pension system. The coverage of funded and private pension plans also has an impact on the overall level of pension assets of the country.
A. OECD countries
B. Other jurisdictions
23.026.2
29.2 30.233.0
36.5 37.6 37.1 38.7
44.0 42.5
0.0
10.0
20.0
30.0
40.0
50.0
2008 2009 2010 2011 2012 2013 2014 2015 2016 2017 2018
0.6 0.8 1.0 1.1 1.2 1.4 1.5 1.41.7 1.6 1.6
0.0
1.0
2.0
3.0
4.0
5.0
2008 2009 2010 2011 2012 2013 2014 2015 2016 2017 2018

16
PENSION MARKETS IN FOCUS 2019 © OECD 2019
Participation in a pension plan may be mandatory, voluntary or encouraged through automatic enrolment. Employers may be obliged by law to set up a pension plan for their employees who then have to join the plan (e.g. Finland, Norway, Switzerland). In Denmark, Netherlands and Sweden, the legislation does not require employers to set up a plan for their employees. However, participation in a plan in these countries is quasi-mandatory as the decision is made at the industry or branch level through collective bargaining agreements. Some Latin American and European countries do not require employers to set up a plan for their employees but require employees to join a private pension fund of their choice (e.g. Chile, Colombia, Mexico) or a state funded pension plan (e.g. Denmark). By contrast, in a number of other countries (e.g. Austria, Czech Republic, France, Portugal), there is no compulsion for employers to set up an occupational plan nor for employees to open an individual pension account. In-between, some countries use soft compulsion and encourage employees to participate in a plan through automatic enrolment (e.g. Italy, New Zealand, Turkey and the United Kingdom). In these countries, employers have to enrol their employees in a pension plan under certain conditions. Employees, however, have the option to opt out of the plan within a certain timeframe.
Individuals may participate in several different types of plans. They may have to participate in mandatory plans accessed through their work and may also contribute voluntarily in a pension plan that they opened on their own. In some countries, they could be members of several voluntary plans, contributing in the occupational plan of their current employer while retaining rights in the plans of their former employers.
Mandatory pension plans cover more than 70% of the working-age population in 17 out of the 31 reporting jurisdictions where such plans exist (Figure 1.6). Finland and Iceland recorded some of the highest coverage rates, at respectively 93% and 88% of the working-age population in 2018. The coverage of occupational plans in the Netherlands was quasi-universal and close to 90% of the working-age population. In Turkey by contrast, participation in a plan was mandatory only for certain employees (e.g. OYAK for military personnel in Turkey), accounting for the relatively low proportion of people in a mandatory plan.
The coverage rate of mandatory individual accounts was nearly universal in Chile (87%) but this was not the case in several other Latin American countries. The high rate of informality in some Latin American countries, over 50% in Colombia, Mexico and Peru (ILO, 2016[1]), may account for relatively lower coverage rate of mandatory plans covering formal workers (45% in Colombia, 65% in Mexico, 33% in Peru). Additionally, in some Latin American countries, people have the possibility to choose to participate either in the public pay-as-you-go or private funded pension systems (e.g. Colombia, Peru). This competition between systems may result in lower coverage rate in funded pension plans compared to countries where such choice is not available.

17
PENSION MARKETS IN FOCUS 2019 © OECD 2019
Figure 1.6. Coverage of funded and private pension plans in selected OECD and other jurisdictions, by type of plan, latest year available
As a percentage of the working-age population
Note: Please see the methodological notes at the end of the report.
Source: OECD Global Pension Statistics; ABS Household Income and Wealth 2017-18 (Australia); FSMA Annual Report 2018 (Belgium);
Statistics Canada; ATP Annual Report 2018 and Danish Insurance Association (Denmark); DREES "Les retraités et les retraites - Edition 2019"
(France); Survey on Pension Provision 2015 of the Federal Ministry of Labour and Social Affairs (Germany); Quarterly National Household
Survey, Module on Pensions Q4 2015 (Ireland); Ministry of Health, Labour and Welfare (Japan); OECD Pensions Outlook 2012 (Netherlands);
Finance Norway; 2013 edition of the survey “Inquérito à Situação Financeira das Famílias (ISFF)” (Portugal); Spanish Survey of Household
Finances (EFF) 2014 of the Bank of Spain; Statistics Sweden for voluntary personal plans; DWP's Family Resources Survey 2017/18 (United
Kingdom); 2016 National Compensation Survey and 2016 Statistics of Income (United States).
A. OECD countries B. Selected other jurisdictions
0 20 40 60 80 100
LatviaSweden - PPS
FinlandSweden - QMO
NetherlandsIceland
ChileEstonia
Denmark - ATPNew Zealand
IsraelLithuaniaAustralia
SwitzerlandPoland - OFE
MexicoCzech Republic
Denmark - QMONorway - pension funds
GermanyBelgium
JapanUnited Kingdom
IcelandUnited States
SloveniaSlovak Republic - 2nd pillar
IrelandGermany - Riester
NetherlandsCanada - RPP
SpainFrance
Canada - RRSP and PRPPSwedenNorway
Austria - PZV contractsUnited States
LatviaHungary - pension funds
DenmarkFinland
PortugalKoreaJapan
Austria - PensionskassenIrelandTurkey
ItalyEstonia
ItalyFranceFinland
New ZealandTurkey
United KingdomLuxembourg - pension funds
Mexico - vol. occ.Poland - PPE
Turkey - VASA + OyakLatvia - vol. occ.
Mandatory / Quasi-mandatory Auto-enrolment Voluntary occupationalVoluntary personal Voluntary (occ and pers)
0 20 40 60 80 100
Bulgaria
Hong Kong (China)
Russia
Costa Rica - ROP
Kazakhstan
Croatia
Uruguay
Romania
Dominican Republic - personal
Colombia
Maldives
North Macedonia
Peru
Armenia
Namibia
Bulgaria
Croatia
Brazil - PGBL and VGBL
Nigeria - CPS
Hong Kong (China)
Malta
Russia
Namibia
Costa Rica
Malawi
Serbia
Romania
Jamaica - vol. occ.
Guyana - vol. occ.
Jamaica - vol. pers.
Brazil - closed pension funds
Indonesia - FIPF
Croatia - vol. occ.
North Macedonia - vol. occ.
Albania - vol. occ.
North Macedonia - vol. pers.
Albania - vol. pers.
Indonesia - EPF
Kazakhstan - vol. pers.
Bulgaria - VPFOS
Malta - vol. occ.
Pakistan - vol. pers

18
PENSION MARKETS IN FOCUS 2019 © OECD 2019
The participation in voluntary plans varied widely across countries. More than half of the working-age population was covered by a voluntary plan in six OECD countries: Belgium (51%), the Czech Republic (64%), Germany (57%), Japan (just over 50%), Lithuania (75%) and Poland (66%). Participation in open pension funds used to be mandatory in Poland before 2014. The proportion of people still having a plan in open pension funds was still high in 2018. None of the five other countries had mandatory plans where all the working-age population had to contribute. Saving for retirement was therefore only possible through voluntary participation in these countries. The participation in voluntary plans was much lower in some other countries, especially in Bulgaria and Pakistan. In Bulgaria however, many individuals are already participating in mandatory funded plans (UPF and PPF), covering 82% of the working-age population respectively. The low take-up of voluntary plans in Pakistan might be due to a lack of awareness of these plans according to the Securities and Exchange Commission of Pakistan.
The proportion of people in pension plans has generally increased over the last decade, especially in auto-enrolment and mandatory plans (Figure 1.7). New Zealand recorded the largest increase (by 48 percentage points) as the proportion of working-age people with a KiwiSaver plan soared from 32% of the working-age population in 2009 to 80% in 2018. In the United Kingdom, the Family Resources Surveys of the Department for Work and Pensions show a rapid increase in the proportion of working-age adults having an employer-sponsored plan from 38% in 2015 to 46% in 2018.4 In Bulgaria and Israel where it became mandatory for all employees to participate in pension plans in 2002 and in 2008 respectively, the coverage rate increased by almost 40 percentage points in ten years. Estonia, Latvia and North Macedonia also observed a large increase in the participation of mandatory plans. This trend might however slow down in North Macedonia as the conditions to join mandatory plans changed in 2019 and some members could or had to leave the plans in 2019 following amendments to the Law on Mandatory Fully Funded Insurance at the end of 2018 (MAPAS, 2019[2]). The growth in coverage was more limited in countries where most of the working-age population was already in a plan in 2008 (e.g. in ATP in Denmark) and also at the other extreme in countries where the coverage rate was relatively low (e.g. Italy and Nigeria). In Italy, automatic enrolment into a pension fund has been competing with a previously existing severance system. Employees valued their severance system often opted out from auto-enrolment, preferring to keep the new accruals of severance pay in the system and not to divert them into a pension plan. The overwhelming majority of those who actually enrolled in a pension plan made the explicit choice to pay in them additional contributions, in order to get as well the matching contributions by the employer – therefore they are not counted as auto-enrolled.
4 Figure 1.7 does not show this increase as the figure covers a longer period, minimum of five years.

19
PENSION MARKETS IN FOCUS 2019 © OECD 2019
Figure 1.7. Evolution of the coverage of pension plans in a selection of countries between 2008 (or the first year available) and 2018 (or the latest year available), by type of plan
In percentage points of the working-age population
Note: Please see the methodological notes at the end of the report.
Source: OECD Global Pension Statistics and other sources.
Coverage rates of voluntary plans remained more or less similar over the last ten years despite some notable exceptions. The coverage rate in Hungary dropped as participation in a plan (mandatory before 2011) became voluntary. By contrast, the participation rate in open pension funds in Poland was higher in 2018 than in 2008 although participation was no longer compulsory. The largest increase in coverage of
A. Selected OECD countries
B. Selected other jurisdictions
-50
-40
-30
-20
-10
0
10
20
30
40
50
New
Zea
land
Isra
el
Latv
ia
Lith
uani
a
Est
onia
Pol
and
- O
FE
Chi
le
Mex
ico
Latv
ia
Fra
nce
Fin
land
Spa
in
Cze
ch R
epub
lic
Nor
way
- p
ensi
on fu
nds
Italy
Aus
tria
- P
ensi
onsk
asse
n
Aus
tral
ia
Slo
vak
Rep
ublic
- 2
nd p
illar
Sw
itzer
land
- m
and
ator
y
Slo
veni
a -
volu
ntar
y
Italy
- v
ol. o
cc.
Luxe
mbo
urg
- pen
sion
fund
s
Den
mar
k -
AT
P
Kor
ea -
QM
O
Nor
way
- v
ol. p
ers.
Pol
and
- P
PE
Den
mar
k -
QM
O
Mex
ico
- vol
. occ
.
Latv
ia -
vol
. occ
.
Fra
nce
- vo
l. pe
rs.
Can
ada
- R
PP
Uni
ted
Sta
tes
- IR
As
Aus
tria
- P
ZV
con
tract
s
Fin
land
- v
ol. o
cc.
New
Zea
land
- v
ol. o
cc.
Can
ada
- R
RS
P a
nd P
RP
P
Fin
land
- v
ol. p
ers.
Est
onia
Irel
and
Den
mar
k
Hun
gary
- p
ensi
on fu
nds
Mandatory / Quasi-mandatory Auto-enrolment Voluntary occupational
Voluntary personal Voluntary (occ and pers)
-10
0
10
20
30
40
50
Bul
garia
Nor
th M
ace
doni
a
Col
ombi
a
Mal
dive
s
Hon
g K
ong
(Chi
na)
- MP
F
sche
mes
Per
u
Bra
zil -
PG
BL
and
VG
BL
Mal
ta
Nig
eria
- C
PS
Bul
garia
- V
PF
Jam
aica
- vo
l. p
ers.
Nor
th M
ace
doni
a -
vol.
occ.
Rus
sia
- m
anda
tory
Ser
bia
- vol
unta
ry
Nor
th M
ace
doni
a -
vol.
pers
.
Alb
ania
- v
ol. o
cc.
Alb
ania
- v
ol. p
ers.
Bra
zil -
clo
sed
pens
ion
fund
s
Bul
garia
- V
PF
OS
Jam
aica
- vo
l. o
cc.
Rus
sia
- vo
lunt
ary
Hon
g K
ong
(Chi
na)
- OR
SO
sche
mes

20
PENSION MARKETS IN FOCUS 2019 © OECD 2019
voluntary plans happened in Lithuania, from 50% in 2010 to 75% in 2018. The proportion of voluntary occupational plans also increased significantly in France between 2008 and 2018. By contrast, in Austria, the coverage rate of PZV contracts was slightly lower in 2018 than in 2008. The number of PZV contracts was increasing until 2012. However, from 2012 onwards, the number of contracts has been declining following a cut in government subsidies and a low return outlook given the low interest rate environment.
A substitution effect may exist between plans. Occupational Retirement Schemes (ORSO) in Hong Kong (China) have been losing prominence in terms of members as all employees and self-employed aged 18 to 64 have had to join Mandatory Provident Funds (MPF) since 2000 unless they meet certain exemption criteria.
Saving for retirement implies having access to a pension plan and contributing to this plan. The proportion of individuals actively saving for retirement and paying contributions to the plan may be lower than the proportion of individuals having a pension plan. Individuals holding a plan may not necessarily contribute. They may simply hold rights in their former employers’ plan or may have assets in their personal plans but may not contribute in a regular manner.
The difference between individuals covered by a plan and individuals contributing to a plan can be large such as in some Latin American countries (Figure 1.8). Latin American pension supervisors track the proportion of people contributing each month to the different pension funds. Around half of the individuals having an individual account in Chile, Colombia, the Dominican Republic and Peru contributed within the last month in December 2018. In some cases such as Peru, individuals may not contribute throughout their career because of high rates of informality and transitions between formal and informal employment (OECD, 2019[3]).
Figure 1.8. Proportions of individuals owning assets and individuals contributing to their individual accounts in selected Latin American countries, 2018
As a percentage of the working-age population
Note: Please see the methodological notes at the end of the report.
Source: OECD Global Pension Statistics and websites of national pension supervisors.
0
20
40
60
80
100
Chile Dominican Republic Colombia Peru
Asset owners Contributors

21
PENSION MARKETS IN FOCUS 2019 © OECD 2019
1.1.3. Contributions
The role that funded and private pensions can play at retirement depends on the amount of assets accumulated in pension plans, which in turn hinges on the amount of contributions paid into these plans during the accumulation phase.
Regulation defines a contribution rate in countries with mandatory and auto-enrolment plans. The responsibility to pay the contributions may fall on the employees (e.g. in Chile, Croatia, Ghana, Kazakhstan, Peru and Romania), on the employers (e.g. in Australia, Norway, the Slovak Republic) or on both (e.g. in Estonia, Iceland, Switzerland). This obligation may only apply to certain employees or under certain conditions (e.g. mandatory employer contributions only for employees earning at least AUD 450 a month in Australia). Contributions may be complemented by state matching contributions (e.g. New Zealand) or subsidies (e.g. social quota in Mexico).
Mandatory contribution rates are fixed at different levels across countries. Iceland sets the highest mandatory contribution rate at 15.5% of salary, split between employers (11.5%) and employees (4%) (Figure 1.9). Mandatory contribution rates also represent over 10% of the salary in five other countries: Colombia, Denmark, Israel, Nigeria and Maldives. In Switzerland, the contribution credits to pay vary by age group, from 7% between 25 and 34 years old up to 18% beyond 55 years old. By contrast, Norway has the lowest mandatory rate among the reporting countries (2% paid by the employer). Employers and employees can however agree on whether employees have to contribute on top of employer contributions. These mandatory contribution rates sometimes vary by income (e.g. Denmark) or sector in which employees work (e.g. public or private in Mexico).
Figure 1.9. Minimum or mandatory contribution rates (for an average earner) in mandatory and auto-enrolment plans (unless specified otherwise)
As a percentage of earnings
Note: Please see the methodological notes at the end of the report.
Source: ISSA Social Security Country Profiles.
A. Selected OECD countries B. Selected other jurisdictions
0
2
4
6
8
10
12
14
16
18
20
Employ ee Employ er State Total
0
2
4
6
8
10
12
14
16
18
20

22
PENSION MARKETS IN FOCUS 2019 © OECD 2019
A number of countries have adjusted their mandatory or minimum rates over the last decade. In New Zealand, the minimum contribution rates to KiwiSaver plans rose from 2% to 3% of gross salary for both the employee and the employer in April 2013. The United Kingdom increased the minimum contribution rates from 1% to 2% of qualifying earnings for employers and from 1% to 3% for employees in April 2018, and then to 3% for employers and 5% for employees in April 2019. The contribution rate in the Slovak Republic decreased between 2012 and 2014 (from 9% to 4% of the salary) but has been recently increasing since 2016 by 0.25 percentage point a year with the goal of reaching 6% in 2024. By contrast, the contribution rate has declined in Romania from 5.1% in 2017 to 3.75% in 2018. Lithuania changed minimum contribution rates in 2019 with the introduction of automatic enrolment. Before 2019, workers participating in the second pillar had 2% of their salary diverted from social contributions and could contribute an additional 2% of their salary to benefit from the state contribution of 2% of the average salary. Since 2019, social contributions are not diverted any longer. Workers enrolled in a plan have to contribute at least 3% of their income, and receive an additional contribution from the state of 1.5% of the average salary.5
Individuals or their employers may have the possibility to contribute above the mandatory or minimum rate and make additional voluntary contributions. In New Zealand, the minimum contribution rate for KiwiSaver plans has been 6% equally split between the employer and employee since 1 April 2013. Members can however select a higher personal contribution rate of 4%, 6% (from April 2019), 8% or 10% (from April 2019) of salary. In Poland where automatic enrolment in Employee Capital Plans (PPK) is in place since 2019, the minimum contribution rate is 2% for employees and 1.5% for employers if employees do not opt out from PPK. Employers and employees have the possibility to make additional contributions of up to 2.5% (for employers) and 2% (for employees). In Australia, employees have no obligation to contribute to a plan but can make voluntary contributions on top of their employer contributions. This is the other way around in Peru. Employers are not required to contribute but can make voluntary contributions on behalf of their employees. This is however not possible in all countries. In Ghana, employers do not contribute to mandatory workplace arrangements and only have an administrative role.
In voluntary plans, instead of a required or minimum amount of contributions expected, there may be a ceiling to benefit from tax advantages. Most OECD countries set a ceiling on the amount of contributions attracting tax relief. For instance, employee contributions to voluntary occupational plans in Finland are deductible from the employee’s income up to 5% of salary or EUR 5 000 per year (whichever the lesser) (OECD, 2018[4]). Occupational plans may define the contribution rates for employees and employers in the plan rules. The contribution rates may also vary according to the funding of the plan in case of DB plans.
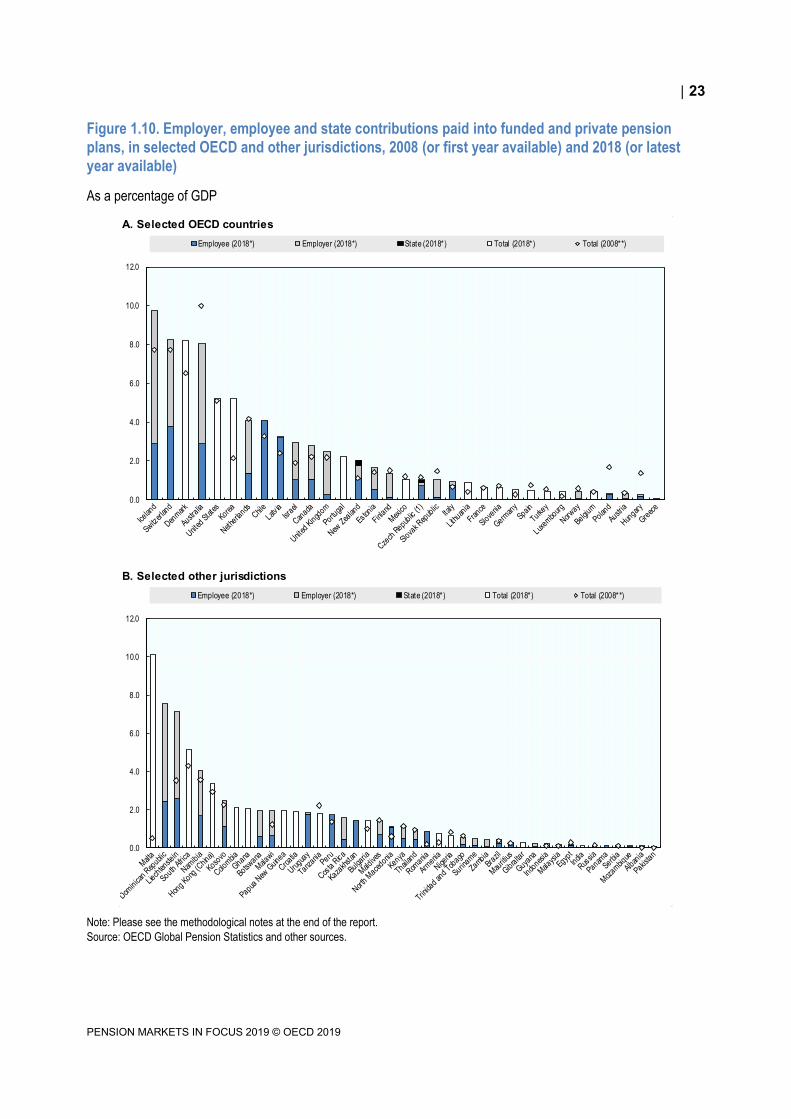
The overall amount of contributions paid into funded and private pension plans ranged from less than 0.1% of GDP in Albania and Pakistan to 10% of GDP in Malta (Figure 1.10). The largest amounts of contributions paid in funded and private pensions – relative to the size of the economy - in the OECD were observed in countries with mandatory pension plans, namely Iceland (9.8% of GDP), Switzerland (8.3%), Denmark (8.2%) and Australia (8.0%). These four countries all had a relatively high proportion of the working-age population covered by a mandatory plan (over 70%) and a relatively high mandatory contribution rate in Denmark and Iceland compared to other countries with mandatory plans. Contributions are split between employers and employees in these four countries.
5 The default contribution rate for new members and those already in the supplementary pension scheme before 2019 who were not making voluntary contributions is lower, at 1.8%. This rate will gradually rise to 3% between 2019 and 2023, with a growing state contribution (from 0.3% to 1.5% of the average salary in the country).
23
PENSION MARKETS IN FOCUS 2019 © OECD 2019
Figure 1.10. Employer, employee and state contributions paid into funded and private pension plans, in selected OECD and other jurisdictions, 2008 (or first year available) and 2018 (or latest year available)
As a percentage of GDP
Note: Please see the methodological notes at the end of the report.
Source: OECD Global Pension Statistics and other sources.
A. Selected OECD countries
B. Selected other jurisdictions
less than 3 years between the two values
0.0
2.0
4.0
6.0
8.0
10.0
12.0
Employee (2018*) Employer (2018*) State (2018*) Total (2018*) Total (2008**)
0.0
2.0
4.0
6.0
8.0
10.0
12.0
Employee (2018*) Employer (2018*) State (2018*) Total (2018*) Total (2008**)

24
PENSION MARKETS IN FOCUS 2019 © OECD 2019
The evolution of contributions paid into funded and private pension plans (relative to GDP) is heterogeneous across countries.6 The largest increase occurred in Malta where contributions rose from 0.5% of the GDP in 2011 to 10.1% in 2017. The amount of contributions increased in New Zealand and the United Kingdom where both the proportion of working-age people and the minimum contribution rates have increased. Australia, Hungary and Poland experienced the largest drop in contributions (probably because of the reform of the funded pension component in 2011 and 2014 for the last two countries respectively). In Australia, contributions did not grow as fast as GDP, but remained among the largest in the OECD area.
The high level of contributions (relative to GDP) in Australia may be due to the relatively high average contribution per member, representing 14.8% of the average annual wages in Australia in 2018 (Figure 1.11). Additional voluntary contributions into superannuation schemes may account for this rate, above the mandatory 9.5% contribution rate.
Figure 1.11. Average annual contribution per active account or member in selected OECD and
other jurisdictions, latest year available
As a percentage of average annual wages
Note: Please see the methodological notes at the end of the report.
Source: OECD Global Pension Statistics.
Some of the highest average contributions per member (relative to average annual wages) can be found in mandatory systems with relatively high mandatory contribution rates (e.g. Australia and Iceland).7 The
6 Contributions into funded and private pension plans (as a percentage of GDP) are available for each reporting country and each year between 2008 and 2018 in Table A B.4 in Annex B. 7 This ratio is not an effective contribution rate. In some cases, contributions are expressed per account instead of per member, as the exact number of members holding one (or several) pension plans is unknown. This is the case for instance in France where individuals can have an occupational (e.g. PERCO) and personal plans (e.g. PERP) at the same time. Additionally, the population holding a pension plan may not be representative of the population on which the average wages are calculated.
A. Selected OECD countries B. Selected other jurisdictions
0.0
2.0
4.0
6.0
8.0
10.0
12.0
14.0
16.0
18.0
20.0
0.0
2.0
4.0
6.0
8.0
10.0
12.0
14.0
16.0
18.0
20.0

25
PENSION MARKETS IN FOCUS 2019 © OECD 2019
ratio was, however, lower than the mandatory contribution rate in some countries (such as in some Latin American countries). Average contributions per member amounted to 5.8% of the average salary in Chile and 8.6% in Peru in 2018, while the mandatory contribution rate was at 10% of salary. This difference in Chile and Peru may potentially reflect irregular contributions to pension plans when workers move from formal jobs to informal jobs or unemployment. Among voluntary systems, the ratio was below 10% of the average salary per member except in Canada and Luxembourg.
1.1.4. Benefit payments
The amount of pension payments from funded and private pension plans represents an outflow from pension plans, reducing the amount of assets. They depend on the seniority of the system.
Payments from funded and private pension plans can take several forms depending on the country, such as lump sum payments, a regular stream of income in retirement (e.g. pensions) or a combination of the two. Benefit payments can be paid as a full or partial lump sum under certain conditions in some countries. In Switzerland for instance, members can claim a payment of a quarter of their retirement assets as a lump sum benefit. Some countries allow full lump sum payments if the accumulated amount is lower than a given threshold (e.g. below EUR 12 600 for Pensionskassen in Austria since 1 January 2019). A part of the lump sum payments may however be reinvested in alternative savings vehicles after the lump sums were taken out.
Individuals may have the option of receiving a pension from the entity managing their assets or from another entity. They could for instance purchase an annuity from a life insurance company such as in Chile. In this case, assets are transferred from the entity in charge of the asset accumulation phase (i.e. AFPs in Chile) to the ones in charge of paying benefits to retirees.
The entity in charge of the pay-out phase may be a public entity such as in Latvia or Poland. Individuals in Latvia can choose to transfer their assets to the State Social Insurance Agency, which then combines these assets with the ones accumulated in their notional account from the pay-as-you-go system in order to pay overall benefits. In Poland, open pension funds became only accumulation vehicles since the pension reform in 2014. The accumulated assets of members with ten or fewer years to retirement are incrementally transferred to the Social Insurance Institution for benefit payments (which is the so-called “slider”).
In 2018, payments from pension providers to retirees or to entities in charge of the pay-out phase were the largest in Australia (6.9% of GDP), Denmark (6.1%), Iceland (5.8%), Switzerland (6.9%) and the United States (7.8%) among OECD countries, and Liechtenstein (6.3%) and South Africa (4.0%) among non-OECD jurisdictions (Figure 1.12). These countries tend to have mature pension systems with large amount of pension assets accumulated (over 95% of the GDP in all of them). In some countries where the funded pension system was introduced recently, the size of pension payments remained relatively limited (e.g. Estonia, North Macedonia) (Table A B.5). The largest transfers of assets to a third party were observed in Chile (1.5% of GDP), Latvia (0.8%) and Switzerland (1.6%) in 2018 among OECD countries.

26
PENSION MARKETS IN FOCUS 2019 © OECD 2019
Figure 1.12. Total benefits paid by funded and private pension plans and assets transferred to an insurance company or another third party, 2018 or latest year available
As a percentage of GDP
Note: Please see the methodological notes at the end of the report.
Source: OECD Global Pension Statistics.
A. Selected OECD countries
B. Selected other jurisdictions
0.0
1.0
2.0
3.0
4.0
5.0
6.0
7.0
8.0
9.0
Lump sum + Pension Lump sum Pension Amount transferred to an insurance company or another party for the pay-out
0.0
1.0
2.0
3.0
4.0
5.0
6.0
7.0
Lump sum + Pension Lump sum Pension Amount transferred to an insurance company or another party for the pay-out

27
PENSION MARKETS IN FOCUS 2019 © OECD 2019
1.2. Investment performance and allocation of pension assets
The performance of portfolio investment drives the evolution of assets in pension plans together with contributions and benefit payments.
1.2.1. Investment rates of return
The decline in pension assets in 2018 (Figure 1.5) was probably attributable to the investment performance of funded and private plans in 2018. Real investment rates of return (net of investment expenses) of pension plans were negative on average in the OECD (-3.2%) and just below 0% in other jurisdictions (Figure 1.13). The average real rate of return, net of investment expenses, weighted by the assets managed at the end 2018 was even lower, at -4.5% in the OECD and -0.7% in other jurisdictions, reflecting that some of the largest pension markets suffered larger losses than others (e.g. the United States (-6.7%)).
Figure 1.13. Annual real investment rates of return of funded and private pension plans, net of investment expenses, 2018
In per cent
Note: Please see the methodological notes at the end of the report.
Source: OECD Global Pension Statistics.
A. Selected OECD countries B. Selected other jurisdictions
5.62.01.8
0.70.4
-0.2-1.0-1.3-1.4-1.6-1.8-1.9-2.0
-2.6-2.8-3.1-3.2-3.4-3.6
-4.3-4.3-4.5-4.9-5.2-5.4-5.5-5.9-6.0
-6.7-6.7-7.1
-9.4-11.1
-15 -10 -5 0 5 10
AustraliaKorea
IcelandCanada
GermanyIsraelChile
DenmarkGreece
Czech RepublicPortugalSlovenia
Slovak RepublicFinland
ItalyNetherlands
Simple averageNorway
SwitzerlandSpain
HungaryWeighted average
MexicoLuxembourg
BelgiumEstoniaIreland
LithuaniaUnited States
LatviaAustriaTurkeyPoland
9.8
6.5
6.2
4.5
4.1
3.7
3.6
2.7
2.2
2.1
2.0
0.6
0.5
0.3
0.2
-0.1
-0.1
-0.2
-0.7
-1.4
-1.7
-1.8
-1.9
-2.9
-3.0
-4.5
-4.9
-6.0
-6.5
-6.7
-11.6
-15 -10 -5 0 5 10 15
Malawi
Dominican Republic
Maldives
Serbia
Ukraine
El Salvador
Costa Rica
Guyana
Armenia
Brazil
Albania
Indonesia
South Africa
North Macedonia
Croatia
Simple average
Uruguay
Papua New Guinea
Weighted average
Russia
Thailand
Romania
Nigeria
Colombia
Egypt
Peru
Liechtenstein
Bulgaria
Pakistan
Kosovo
Hong Kong (China)

28
PENSION MARKETS IN FOCUS 2019 © OECD 2019
Overall, in 2018, pension plans suffered investment losses in 26 out of 31 reporting OECD countries and in 14 out of 29 other reporting jurisdictions. The largest losses in 2018 were recorded in Hong Kong (China) (-11.6%), Poland (-11.1%) and Turkey (-9.4%). The year 2018 was the worst on record in terms of financial performance for pension plans in 20 out of 38 reporting jurisdictions since the 2008 financial crisis (see Annex B for annual returns over the period 2008-2018). However, some countries managed to observe positive real investment returns in 2018 such as Malawi exhibiting the strongest real investment rate of return (net of investment expenses) at 9.8%. Australian superannuation funds also achieved a strong real investment rate of return (5.6%), calculated however over the financial year (June 2017-June 2018) instead of the calendar year.
As the real net investment return is the combination of the nominal performance of the plans and inflation, a low figure could be accounted for by either low gains or inflation. Among OECD countries, funded and private pension plans experienced positive returns in nominal terms in Chile (1.5%), the Czech Republic (0.4%), Turkey (9.0%), but lower than inflation (2.6% in Chile, 2.0% in the Czech Republic and 20.3% in Turkey).
Poor financial results of pension plans in 2018 may be the result of the downturn on equity markets in the last quarter of 2018. Some of the major stocks indices fell sharply in 2018 compared to 2017, suffering sometimes one of the worst declines since the 2008 financial crisis (e.g. S&P500, down by 6.2% in 2018). The positive return in the case of Australia (5.6% June 17 to June 18) before mentioned, may reflect the fact that the equity downturn at the end of 2018 is not covered in the calculations.
Several jurisdictions (e.g. Denmark, Latvia, the Netherlands) however reported a better investment performance for the first part of 2019 with a recovery of stock markets. This upturn could enable pension plans to recoup the losses in 2018.
Average annual returns were all positive in nominal terms over the last 5, 10 and 15 years among reporting countries (Table 1.1) and remained positive in most countries after adjusting for inflation. The long-term nature of retirement savings means one needs to look at long-term returns. The long-term performance of funded and private pension plans shows to which extent they achieved to generate positive investment income over a given period to finance retirement. Despite the relatively low and often negative investment performance in 2018, pension plans achieved a positive real investment return over the last five years in 45 out of 51 reporting countries. Out of 51 jurisdictions, it was possible to calculate an average return over the last ten years for 40 jurisdictions, positive in all except the Czech Republic. Over the last 15 years, the annual average returns of pension plans were positive in 19 out of 22 reporting jurisdictions for which such calculation was possible. Colombia recorded the strongest average annual return (6.2%), followed by Canada (4.8%) and Australia (4.7%). By contrast, the annual average return of funded and private pension plans was close to 0% in the Czech Republic and slightly negative in Estonia (-0.7%) and Latvia (-1.0%) in real terms.8
8 The annual nominal and real investment rates of return are available for each reporting country and each year between 2008 and 2018 in Table A B.6 and in Table A B.7 in Annex B.

29
PENSION MARKETS IN FOCUS 2019 © OECD 2019
Table 1.1. Nominal and real geometric average annual investment rates of return of funded and private pension plans over the last 5, 10 and 15 years
In per cent
Note: Please see the methodological notes at the end of the report.
Source: OECD Global Pension Statistics.
1.2.2. Asset allocation
In most countries, bonds and equities are the two main asset classes in which pension assets were invested at the end of 2018, accounting for more than half of investments in 32 out of 36 OECD countries, and 39 out of 46 other reporting jurisdictions (Figure 1.14). Therefore, developments in bond and equity markets played a major role in the financial performance of pension plans. The combined proportion of bonds and equities was the highest (relatively to the size of the portfolio) in Chile (99.4%), the Dominican Republic (99.2%), Estonia (96.7%), Nigeria (96.4%), Mexico (96.3%), Albania (96.0%), Maldives (95.9%) and India (95.7%).
Pension assets may have been invested in bonds and equities either directly or indirectly through collective investment schemes. For some countries, the look-through of the investments of collective investment schemes was not available, such as for Sweden (in which 63.4% of assets were invested) and the United Kingdom (26.6% of investments). Only the direct investments in bonds and equities were known for these countries (e.g. 30% for Sweden, 39.2% for the United Kingdom). The overall exposure of pension assets to fixed income securities and equities was probably higher in these countries.
5-year annual average
10-year annual average
15-year annual average
5-year annual average
10-year annual average
15-year annual average
5-year annual average
10-year annual average
15-year annual average
5-year annual average
10-year annual average
15-year annual average
Australia 8.7 6.6 7.3 6.7 4.4 4.7 Albania 4.7 5.7 .. 3.0 3.5 ..Austria 2.7 3.8 3.1 1.2 1.9 1.2 Armenia 6.3 .. .. 4.7 .. ..Belgium 4.3 6.0 5.3 2.8 4.1 3.3 Bulgaria 3.1 4.0 3.6 2.2 2.5 0.2Canada 6.5 7.5 6.6 4.7 5.7 4.8 Colombia 7.1 10.2 10.7 2.3 6.3 6.2Chile 6.5 7.4 6.7 3.1 4.7 3.3 Costa Rica 7.6 8.6 .. 5.6 5.2 ..Czech Republic 0.8 1.4 2.1 -0.5 -0.1 0.0 Croatia 6.2 .. .. 5.9 .. ..Denmark 4.9 5.9 5.8 4.2 4.6 4.2 Dominican Republic 10.4 11.7 .. 8.0 7.5 ..Estonia 2.3 4.2 2.6 0.7 2.2 -0.7 El Salvador 3.4 3.7 .. 2.7 2.5 ..Finland 4.5 .. .. 3.9 .. .. Hong Kong (China) 1.8 4.8 .. -0.7 1.7 ..Germany 3.5 3.9 4.0 2.5 2.7 2.5 Indonesia 9.5 .. .. 5.0 .. ..Greece 3.8 .. .. 4.1 .. .. Kosovo 2.6 .. .. 2.1 .. ..Hungary 5.0 .. .. 3.6 .. .. Liechtenstein 3.3 3.2 .. 3.3 3.2 ..Iceland 6.4 7.2 7.6 4.2 3.7 2.7 Malawi 20.0 .. .. 2.6 .. ..Israel 4.1 7.1 .. 4.2 5.8 .. Nigeria 10.7 .. .. -1.6 .. ..Italy 2.2 3.2 3.2 1.7 2.0 1.7 North Macedonia 4.8 6.3 .. 4.4 5.0 ..Korea 3.6 4.1 4.0 2.3 2.2 1.7 Peru 4.8 6.9 6.6 1.9 4.1 3.6Latvia 1.5 3.6 2.8 0.0 2.2 -1.0 Romania 4.6 7.7 .. 3.4 4.8 ..Lithuania 3.1 .. .. 1.7 .. .. Russia 6.4 .. .. -0.7 .. ..Luxembourg 2.5 3.7 .. 1.5 2.0 .. Serbia 9.2 9.5 .. 7.1 4.6 ..Mexico 4.2 6.4 .. 0.0 2.3 .. South Africa 8.1 9.2 9.5 2.6 3.6 4.0Netherlands 6.1 7.7 6.1 4.9 6.0 4.4 Thailand 3.0 3.6 .. 2.6 1.8 ..Norway 4.9 6.2 5.9 2.3 4.0 3.7 Uruguay 12.2 17.1 .. 3.8 8.6 ..Portugal 2.8 3.3 3.7 2.2 2.2 2.2Slovak Republic 1.8 1.7 .. 1.1 0.4 ..Slovenia 5.0 5.1 .. 4.3 3.8 ..Spain 2.2 3.4 .. 1.6 2.1 ..Switzerland 3.1 4.2 3.3 3.1 4.2 2.9Turkey 9.8 9.5 .. -1.5 0.1 ..United States 2.3 4.8 2.6 0.8 3.0 0.5
Nominal Real Nominal RealSelected OECD countries
Selected other jurisdictions

30
PENSION MARKETS IN FOCUS 2019 © OECD 2019
Figure 1.14. Allocation of assets in funded and private pension plans in selected asset classes and investment vehicles, 2018 or latest year available
As a percentage of total investment
Note: Please see the methodological notes at the end of the report.
Source: OECD Global Pension Statistics.
The relative importance of equities and bonds varied considerably across countries in 2018. Although there was in general a greater preference for bonds, the reverse was true in some countries where equities outweighed bonds in 7 OECD countries and 12 other jurisdictions, by 43.7% to 14.6% in Australia, by 57.5% to 24.3% in Hong Kong (China), and by 57.8% to 23.7% in Namibia for instance.
Public sector bonds, as opposed to corporate bonds, represented a larger share of the combined direct bond holdings (i.e. excluding investment via collective investment schemes) in a number of countries. For example, public sector bonds accounted for 100% of total direct bond holdings in Albania and North Macedonia, 99.6% in Serbia, 96.9% in Hungary and 87.6% in the Czech Republic, but only 24.8% in Norway and 10.5% in New Zealand.
A. Selected OECD countries B. Selected other jurisdictions
0 20 40 60 80 100
Poland
Belgium
Australia
Lithuania
Chile
Finland
France
Norway
Estonia
Austria
New Zealand
United States
Iceland
Canada
Netherlands
Ireland
Switzerland
Latvia
Denmark
Luxembourg
Israel
Mexico
Italy
Sweden
Turkey
Spain
Portugal
Greece
United Kingdom
Japan
Hungary
Germany
Korea
Slovak Republic
Slovenia
Czech Republic
0 20 40 60 80 100
BotswanaNamibia
Hong Kong (China)Mauritius
MalawiMozambique
PakistanPapua New Guinea
PeruJamaicaGuyana
GibraltarSouth Africa
ColombiaTrinidad and Tobago
North MacedoniaLiechtenstein
ZambiaCroatia
RomaniaBrazil
UkraineKenya
BulgariaThailand
IndonesiaUganda
MaltaIndia
SerbiaNigeriaRussia
TanzaniaCosta Rica
SurinameMaldives
KazakhstanGhanaEgypt
Dominican RepublicPanamaKosovo
UruguaySingapore
AlbaniaArmenia
Equities Bills and bonds Cash and depositsCIS (no look-through) Other

31
PENSION MARKETS IN FOCUS 2019 © OECD 2019
Several reasons may account for the high proportion of investments in government bonds in some countries. One of them may be a lack of other investment opportunities domestically, as reported by some national authorities (e.g. Albania, Serbia). Albania created a stock exchange recently (the Albanian Stock Exchange) that may enable a greater diversification of pension assets, currently almost fully invested in domestic government bonds. Another reason may be the search of a fixed and guaranteed income (e.g. the Czech Republic). Transformed pension funds offering a non-negative nominal guarantee to plan members in the Czech Republic invested in bills and bonds to receive a fixed income and be sure to meet their promise. Investment regulations in some countries may require pension providers to invest a certain proportion of their assets in certain instruments (e.g. at least 30% of assets of old and new pension funds in earmarked bonds in Israel) (OECD, 2019[5]).
Cash and deposits also accounted for a significant share of pension assets in some OECD and non-OECD jurisdictions. For example, the proportion of cash and deposits was as high as 19.7% of pension assets for the Czech Republic in 2018, 34.5% for France (PERCO plans in 2017) and 43.4% for Panama in 2016.
In most reporting countries, loans, real estate (land and buildings), unallocated insurance contracts and private investment funds (shown as “other” in Figure 1.14) only accounted for relatively small proportions of the investments of pension assets despite some exceptions. In a few countries, the share of assets invested in “other”, which may include mainly alternative investments, is relatively high: 32% in the United Kingdom, 35% in Switzerland, 36% in Canada and 39% in Denmark. This relative large share may deserve monitoring from the supervisory authorities. Real estate was a significant component of pension providers’ portfolios (directly or indirectly through collective investment schemes) in some countries such as Canada (just over 10% of total assets) for instance.
Most countries set limit on investments of pension assets in less traditional asset classes such as real estate (at least directly) at the end of 2018 (OECD, 2019[5]). Some countries have loosened investment limits over the last years and encouraged investments in long-term projects or in companies adhering to ESG projects (e.g. Mexico). In Croatia, the Mandatory Pension Funds Act from 2014 expanded investment opportunities for mandatory pension funds, allowing them to invest in infrastructure projects directly and in alternative investment funds.
While the allocation of assets remained more or less the same in 2018 compared to 2017, a reallocation seems to have happened over the last decade in some countries.9 Compared to 2017, the proportion of pension assets invested in bonds and equities changed by less than 5 percentage points in 55 out of 66 reporting countries (Figure 1.15, Panel A). The proportion of equities in the portfolio tended to be slightly lower in 2018 than 2017 in 42 jurisdictions (to different extents). The drop in equity prices at the end of 2018 might have contributed to this decline unless a rebalancing occurred through equity purchase. Over the last decade, the proportion of investments in bonds declined by more than 5 percentage points in 20 out of 55 reporting jurisdictions (Figure 1.15, Panel B, bottom left and rights quadrants). This decline was not always offset by an increase in equity investments to the same extent. In Denmark with one of the largest declines in the proportion invested in bonds (22 percentages points less in 2018 than in 2008), only 8 percentage points were directed to equities. The largest reallocation went to other investments.
9 The allocation of pension assets in selected investment categories is available for each reporting country and each year in Table A B.8 (for equities), Table A B.9 (for bills and bonds), Table A B.10 (for cash and deposits) and Table A B.11 (for the “other” category) in Annex B.

32
PENSION MARKETS IN FOCUS 2019 © OECD 2019
Figure 1.15. Variations in the proportion of assets in pension plans invested in equities and bills and bonds between 2017 and 2018 and over the longest time period possible in selected countries
In percentage points
Note: Please see the methodological notes at the end of the report.
Source: OECD Global Pension Statistics.
Investments in alternative investments, i.e. investments other than equities, bills, bonds, cash and deposits, have increased in absolute terms, but in relative terms to the size of the portfolio, the increase is less worrying. Figure 1.16 shows the average relative allocation of pension assets on all reporting OECD jurisdictions in 2008 and 2018, while Figure 1.14 above showed the asset allocation for each reporting country in 2018. In some countries, the proportion of other investments has increased significantly, such as Denmark (from 20% in 2008 to 39% in 2018). Adjustments of the portfolio of pension providers, potentially as a search for yield to meet the pension promise, is not intrinsically bad as long as it does not imply an excessive increase in the risk profile of the portfolio. Nevertheless, pension regulators and supervisors need to continue monitoring these developments closely to avoid damaging increases in the risk portfolio of pension funds in their search for yield.
A. Between 2017 and 2018
-30
-20
-10
0
10
20
30
-20 -15 -10 -5 0 5 10 15 20
Variation in bond investments (pp)
Variation in equity investments (pp)
More in bonds and equities
More in bonds and less in equities
Less in bonds and equities
Less in bonds and more in equities
B. Between 2008 and 2018 (or the longest time period possible)
-30
-20
-10
0
10
20
30
40
-20 -15 -10 -5 0 5 10 15 20
Variation in bond investments (pp)
Variation in equity investments (pp)
More in bonds and equities
More in bonds and less in equities
Less in bonds and equities
Less in bonds and more in equities

33
PENSION MARKETS IN FOCUS 2019 © OECD 2019
Figure 1.16. Average allocation of assets in pension plans in selected asset classes in the OECD area, 2008 (or first year available) and 2018 (or latest year available)
As a percentage of total investment
A. 2008 (or first year available) Over 29 reporting OECD jurisdictions
B. 2018 (or latest year available) Over 36 reporting OECD jurisdictions
Source: OECD Global Pension Statistics.
In some cases, changes in asset allocation may be driven by the preferences of plan members (when they can select the investment strategy) or the age structure of the population. In Hong Kong (China), the Mandatory Provident Fund Schemes Authority noted a preference of members for growth funds. This may account for the relatively high proportion of assets invested in equities in 2018, 12 percentage points higher than in 2008. In life-cycle investment policies, assets of plan members are more exposed to more conservative and less risky investments as they age. These policies are in place in several countries such as Chile and Mexico. Over the last decade, a number of countries introduced life-cycle investment policies, such as Croatia (2014), Slovenia (2016), Nigeria (2018), Lithuania (2019).
The proportion of pension assets invested abroad increased during the last decade for 28 out of 37 reporting countries (Figure 1.17).10 This increase may be related to the uplift of the investment restriction on foreign investments (such as in Peru) and the potential search for higher yields or risk diversification.
10 The share of pension assets invested abroad is available for each reporting country and for each year between 2008 and 2018 in Table A B.12 in Annex B.
Equities, 17.9
Bills and bonds, 51.5
Cash and deposits, 9.1
CIS (no look-
through), 7.0
Other, 14.4 Equities, 24.4
Bills and bonds, 44.9
Cash and deposits, 7.6
CIS (no look-through), 8.0
Other, 15.1

34
PENSION MARKETS IN FOCUS 2019 © OECD 2019
Figure 1.17. Assets in funded and private pension plans invested abroad and in foreign currencies, in 2008 (or first year available) and 2018 (or latest year available)
As a percentage of total investment
Note: Please see the methodological notes at the end of the report.
Source: OECD Global Pension Statistics.
Countries with the highest proportion of pension assets invested abroad were Eurozone members with small capital markets. Among the ten countries with the largest proportion of assets invested abroad, nine were from the euro area or were using the euro as their main currency in 2018: Kosovo (92% of assets invested abroad), the Netherlands (87%), Estonia (84%), Latvia (81%), Lithuania (75%), the Slovak
A. Share of assets invested abroad B. Share of assets in foreign currencies
KosovoNetherlands
EstoniaLatvia
LithuaniaSlovak Republic
PortugalSlovenia
ItalyBulgariaNamibia
New ZealandHong Kong (China)
PeruChile
SwitzerlandCanada
ColombiaDenmark
BotswanaSuriname
ArmeniaIcelandNorway
JapanNorth MacedoniaUnited Kingdom
South AfricaKazakhstan
GuyanaIsrael
NigeriaMauritiusSweden
Czech RepublicPapua New Guinea
KoreaCroatia
Costa RicaTrinidad and Tobago
ZambiaMexico
UruguayRomania
PolandTurkey
ThailandSerbiaBrazil
0 20 40 60 80 100
North Macedonia
Botswana
Bulgaria
Croatia
Netherlands
Peru
Namibia
Chile
Switzerland
Colombia
Suriname
Costa Rica
Austria
Israel
Kazakhstan
Estonia
Hungary
Turkey
Sweden
Norway
Jamaica
Czech Republic
Slovak Republic
Portugal
Poland
Lithuania
Nigeria
Romania
Slovenia
Trinidad and Tobago
Mexico
Panama
Thailand
0 20 40 60 80 100
2018 (or latest year available)2008 (or first year available)

35
PENSION MARKETS IN FOCUS 2019 © OECD 2019
Republic (74%), Portugal (65%), Slovenia (63%) and Italy (63%). The domestic capital markets of these countries may be too small to absorb the savings from pension plans (Stewart, Despalins and Remizova, 2017[6]). A significant share of pension assets may have been invested in other countries within the euro area, as the share of pension assets exposed to foreign currency was much lower than the share of assets abroad for Estonia (18%), Lithuania (6%) and the Slovak Republic (7%). The share of pension assets exposed to foreign currencies dropped between 2010 and 2018 in Lithuania, which adopted the euro in 2015.11
Other countries with small domestic capital markets opted for domestic investment options instead of investments abroad. Pension funds from Albania and the Maldives did not invest abroad at all. These funds mainly invest in domestic bonds instead, even if regulation in Albania for instance did not prevent them from investing abroad. Investing abroad was completely forbidden only in a few non-OECD jurisdictions at the end of 2018, including the Dominican Republic, Egypt, India and Nigeria (OECD, 2019[5]).
1.3. Specificities and challenges of defined benefit and defined contribution plans
The pension landscape includes various types of funded and private pension plans worldwide (see Annex A). The features of the plans may entail different risks that may impede the sustainability of the pension promise or pension adequacy.
1.3.1. Changes in the pension landscape
Individuals may be accumulating savings for retirement through various types of funded and private pension plans. They may be members of occupational pension plans, accessed through employment and established by employers or social partners on behalf of their employees. Depending on how pension benefits are calculated and who bears the risks, occupational plans can be either defined benefit (DB) or defined contribution (DC). In DC plans, participants bear most of the risk, while in DB plans, sponsoring employers assume some of the risks if assets do not cover pension liabilities. In most countries, individuals may have the possibility to open personal plans, not necessarily linked to an employment relationship and established directly by a pension fund or a financial institution without any intervention of employers. As there is no legal or constructive obligation for employers to pay further contributions in a personal plan to ensure a given benefit level or investment return, personal plans are also considered as DC in this report.
In almost all OECD countries, some employers set up occupational plans for their employees (Table A A.1). In other OECD countries where such plans do not exist (i.e. the Czech Republic, Lithuania, the Slovak Republic), individuals can however have access to personal plans through employment and choose the fund they would like to join. All OECD countries and almost all the other jurisdictions in this report offer personal plans.
Most countries - 26 OECD countries and 25 out of the 43 other reporting jurisdictions – had DB plans in 2018, but the size of these plans varied worldwide. DB plans had a relatively large prominence, in terms of assets, in some large pension markets in 2018 such as Canada (60% of all pension assets) and Switzerland (90%) (Figure 1.18). The proportion of pension assets in DB plans was lower than in occupational DC and in personal plans combined in most reporting countries. Less than 50% of pension assets was held in DB plans in 32 out of 38 reporting jurisdictions. Some countries had no occupational DB plan at all, especially in Latin America and Central and Eastern Europe.
11 The share of assets issued in foreign currency is available for each reporting country and for each year between 2008 and 2018 in Table A B.12 in Annex B.

36
PENSION MARKETS IN FOCUS 2019 © OECD 2019
Figure 1.18. Split of pension assets by type of plan, 2008 (or first year available) and 2018 (or latest year available)
As a percentage of total assets
Note: Please see the methodological notes at the end of the report.
Source: OECD Global Pension Statistics.
Occupational DC plans and personal plans have been gaining prominence at the expense of DB plans even in countries with a historically high proportion of assets in DB plans such as the United States. The proportion of assets in DB plans was lower in 2018 than before in 17 out of the 22 reporting countries with
A. 2008 (or first year available) B. 2018 (or latest year available)
0 20 40 60 80 100
Switzerland
Finland
Guyana
Namibia
Canada
Israel
Turkey
Brazil
Spain
United States
Korea
Nigeria
France
New Zealand
Dominican Republic
Mexico
Liechtenstein
Costa Rica
Australia
Iceland
Italy
Denmark
Albania
Poland
Latvia
Croatia
Bulgaria
Armenia
Chile (1)
Colombia
Czech Republic
Estonia
Hungary (2)
Lithuania
Maldives
Peru
Romania
Slovak Republic
Occupational DB Occupational DC Personal
020406080100
Switzerland
Finland
Guyana
Namibia
Canada
Israel
Turkey
Brazil
Spain
United States
Korea
Nigeria
France
New Zealand
Dominican Republic
Mexico
Liechtenstein
Costa Rica
Australia
Iceland
Italy
Denmark
Albania
Poland
Latvia
Croatia
Bulgaria
Armenia
Chile (1)
Colombia
Czech Republic
Estonia
Hungary (2)
Lithuania
Maldives
Peru
Romania
Slovak Republic

37
PENSION MARKETS IN FOCUS 2019 © OECD 2019
DB plans, including the United States (33% in 2018 compared to 39% in 2008). The fastest shift away from DB plans happened in Israel (from 84% in 2008 to 56% of in 2018) where DB plans have been closed to new members since 1995. Some other countries also closed the access to DB plans to new members, such as Italy since 1993. New members had the possibility (in Italy) or the obligation (in Israel) to join DC plans instead. More recently, Iceland reformed a pension plan for state and municipal employees at the end of 2016, converting it from DB to DC.
A transformation of the characteristics of pension plans also occurred in some countries, not visible at the broad category level of DB, DC and personal plans. The change may relate to the formula used to calculate benefit payments in DB plans. In the Netherlands, many pension funds changed the benefit calculations from a final salary to a career-average salary basis (Pensions Policy Institute, 2014[7]). The proportion of pension funds offering career average rather than final salary schemes rose from 16% in 1998 to 57% in 2014 in the Netherlands according to the Pensions Policy Institute. Among DC plans, some authorities noted a change in the guarantees offered to plan members. Denmark noticed a shift away from DC guaranteed plans to DC unguaranteed plans. Slovenia also reported a move away from the industry from DC plans guaranteeing an investment return.
There is nowadays a full range of plans between traditional DB plans where plan sponsors bear all the risks (e.g. investment, inflation and longevity risks) and individual DC plans where individuals bear all the risks. The features of these plans may be closer to DB or DC plans but all have some risk sharing components between the different parties.
1.3.2. Funding ratio of defined benefit plans
Funding ratios measure the amount of liabilities that assets available cover. When the value of assets in DB plans is less than the value of liabilities arising from the pension promise, or in other words, when the funding ratio is below 100%, the plan is underfunded. DB plan sponsors are usually responsible for guaranteeing the funding of the plan.12
The funding ratio of DB plans evolved differently over the last decade across countries (Figure 1.19). The funding position of DB plans improved by 18 percentage points in Germany (from 105% in 2008 to 123% in 2018), 11 percentage points in Switzerland (from 95% in 2008 to 105% in 2018), 9 percentage points in Liechtenstein (from 97% in 2008 to 106% in 2018) and 6 percentage points in Finland (from 118% in 2011 to 125% in 2018). The opposite trend was observed in Iceland, Mexico and the Netherlands among OECD countries and in Hong Kong (China) and Indonesia among other jurisdictions, where the funding ratio deteriorated between 6 percentage points (in Indonesia and the Netherlands) up to 30 in percentage points (in Hong Kong (China)) over the last decade. It was observed that although the funding ratio of Hong Kong (China) fluctuated during the period, investments had always exceeded net technical provisions, resulting in its funding ratio consistently higher than 100% during the period. The funding ratio remained more or less the same (within a -5 /+5 percentage point range) in 2018 compared to the first year available since 2008 in Luxembourg, Norway, the United Kingdom and the United States.
12 The funding position of DB plans is assessed in this report as the ratio between the investments and the technical provisions (net of reinsurance) of DB plans. Calculations are based on data provided by national authorities participating in the joint OECD, IOPS and World Bank Global Pension Statistics exercise. Investments of DB plans may be a low estimate of assets of DB plans as they would not include receivables and claims against the plan sponsor to cover the funding shortfall. Technical provisions represent the amount that needs to be held to pay the actuarial valuation of benefits that members are entitled to. This is the minimum obligation (liability) for all DB pension plans.

38
PENSION MARKETS IN FOCUS 2019 © OECD 2019
Figure 1.19. Assets and liabilities of DB plans (in billions of national currency) and their ratio (in per cent) in selected jurisdictions, 2008-2018
Note: Please see the methodological notes at the end of the report.
Source: OECD Global Pension Statistics.
Funding ratio (RHS) Total investment (LHS) Net technical provisions (LHS)
80
100
120
140
0
20
40
60
80
100
120
140
2011 2013 2015 2017
Finland
80
100
120
140
0
50
100
150
200
250
2008 2010 2012 2014 2016 2018
Germany
0
20
40
60
80
0
500
1,000
1,500
2,000
2008 2010 2012 2014 2016 2018
Iceland
80
100
120
0.0
0.2
0.4
0.6
0.8
1.0
1.2
2009 2011 2013 2015 2017
Luxembourg
0
20
40
60
80
100
0
100
200
300
400
500
2008 2010 2012 2014 2016 2018
Mexico
80
100
120
0
500
1,000
1,500
2008 2010 2012 2014 2016 2018
Netherlands
100
110
120
0
100
200
300
400
2008 2010 2012 2014 2016 2018
Norway
80
100
120
0
200
400
600
800
1,000
2008 2010 2012 2014 2016 2018
Switzerland
0
20
40
60
80
100
120
0
500
1,000
1,500
2,000
2008 2010 2012 2014 2016 2018
United Kingdom
40
60
80
0
5,000
10,000
15,000
20,000
2008 2010 2012 2014 2016 2018
United States
80
100
120
140
160
0
20
40
60
80
100
120
140
2008 2010 2012 2014 2016 2018
Hong Kong (China)
80
100
120
0
50,000
100,000
150,000
200,000
2012 2014 2016 2018
Indonesia
80
100
120
0.0
0.5
1.0
1.5
2.0
2.5
2008 2010 2012 2014 2016 2018
Liechtenstein

39
PENSION MARKETS IN FOCUS 2019 © OECD 2019
The evolution of the number of DB plans over which an aggregated funding ratio was calculated may influence the trends. Liechtenstein reported that many DB plans were converted into DC plans, leaving a single well-funded DB plan in the market. This probably accounts for the drop of assets and liabilities of DB plans in Liechtenstein between 2012 and 2014, as well as the improvement of the aggregated funding ratio. In Iceland, the funding ratio dropped between 2016 and 2017 as a public-sector scheme for state and municipal employees (one of the most funded) was converted into a DC plan and therefore not included anymore in the funding ratio from 2017 onwards.
Funding levels of DB plans were above 100% at the end of 2018 in all reporting countries but five: Iceland (32%), Mexico (67%), the United Kingdom (96%), the United States (57%) among OECD countries, and Indonesia (96%). Assets in DB plans in these five countries would not be able to cover the pension liabilities (the way they are calculated).
Funding ratios are not strictly comparable across countries given the different national valuation methods of liabilities. Some countries like Germany used fixed discount rates while others like the Netherlands used market rates as a discount rate. In Germany, the maximum discount rate for the calculation of technical reserves was set at 0.9% by regulation. The discount rate for Pensionskassen and Pensionsfonds offering insurance-like guarantees becomes fixed for the term of the contract. In the Netherlands, pension funds use an Ultimate Forward Rate (UFR) for the valuation of liabilities. The UFR is an extrapolation of the observable term structure to take into account the very long duration of pension liabilities. The choice of the discount rate that is used to express in today’s terms the stream of future benefit payments can have a major impact on funding levels.
1.3.3. Fees charged to members of defined contribution plans
Fees charged by pension providers for the cost of running pension plans reduce the overall amount of assets in those plans, lowering the retirement benefit payments that members may get.
Pension providers charged fees in different ways at the end of 2018 depending on the country. Fees could be charged on contributions or on salaries directly in some Latin American countries (e.g. Chile, Colombia), on assets (e.g. Estonia, Spain), on performance, or a combination (e.g. the Czech Republic where pension funds could charge fees on assets and profits, Bulgaria where supplementary voluntary pension funds could charge fees on contributions and returns). On top of regular fees, members in some countries could be charged fees when they joined, switched or left a pension provider (e.g. Albania, the Czech Republic).
Most countries - 26 out of 36 reporting countries - capped some of the fees that pension providers could charge to members (Table 1.2). Most of them capped fees on assets (23 out of 26), which was one of the most widespread way for pension providers to charge members. Armenia (for voluntary plans) and Albania had some of the highest caps on assets among those setting one, at 5% and 3% of the net value of the assets annually. By contrast, Croatia sets one of the lowest caps on assets for mandatory pension funds (at 0.363% of assets under management), expected to continue to further decline by 7% annually until it reaches 0.3% of assets under management.

40
PENSION MARKETS IN FOCUS 2019 © OECD 2019
Table 1.2. Fee structure and caps in selected OECD countries and other jurisdictions
Fees on salaries Fees on
contributions
Fees on assets Fees on returns / performance Other fees (e.g. exit fees, entry fees,
switching fees)
Selected OECD countries
Australia (except MySuper) No cap No cap No cap No cap No cap
Chile No cap x x x x
Czech Republic -
transformed funds
x x 0.8% of the average
annual value of the funds
10% of profit CZK 800 per switch
Czech Republic -
participation funds
x x 1% of the average annual value of the
fund (0.4% for conservative funds)
15% (10% for conservative funds) of
(average value of the pension unit in t
– highest annual average value of the
pension unit since t0) × the average
number of pension units in t, where t
is the current period and t0 is the time
since the creation of the fund
CZK 800 per switch
Denmark No cap No cap No cap No cap No cap
Estonia - mandatory
schemes
x x 2% (1.2% for conservative funds)
before 2 Sept 2019. Management fee
must decline by 10% after each EUR
100 million of assets under
management
x Redemption fee: up to 0.1% of the net
value of a unit (0.05% for
conservative funds)
Estonia - voluntary schemes x x No cap x No cap (redemption fee and unit
issue fee)
Ireland No cap No cap No cap No cap No cap
Israel x 6% 0.5% x x
Italy x No cap No cap Possible but rare No cap
Korea - occupational DC x x No cap x x
Latvia - state funded
scheme
x 2.5% (SSIA) Up to 0.8% of average value of
assets for assets up to EUR 300
million (0.6% as of 2019) and 0.6%
for the part of assets above EUR 300
million (0.4% as of 2019)
Total fixed fee plus performance fee:
Up to 1.3% of average value of
assets for active and balanced plans
(1.1% as of 2019) and 1.05% for
conservative plans.(0.85% as of
2019).
x
Latvia - private pension
funds
x No cap No cap No cap x
Lithuania - 2nd pillar x x 0.8% for life-cycle funds; 0.2% for
asset preservation fund
x Switching fee up to 0.05% of assets
Lithuania - 3rd pillar x No cap No cap x Switching fee up to 0.5 percent of
assets. No cap for other fees
Mexico x x No cap x x
Poland - open pension funds x 1.75% 0.54% of net assets annually
(regressive fee algorithm, bigger
funds charge smaller percentage), no
more than PLN 186 million annually
0.06% of net assets annually
multiplied by the percentage premium
ratio = (Ri-Rmin)/(Rmax-Rmin)
x
Poland - PPK x x 0.5% of AUM annually, with assets
capped at 15% of PPK market assets
0.1% of AUM when positive rate of
return above the benchmark in
secondary legislation
No cap
Portugal No cap No cap No cap No cap Capped
Slovak Republic - 2nd pillar x 0.25% (SIA) + 1%
(maintaining the
account)
0.3% annually of the average annual
net asset value
10% of net asset value × (value of the
pension point/highest value of the
point - 1). The highest value of the
point is calculated over a defined
period.
x
Slovak Republic - 3rd pillar x x - Supplementary pension funds: up to
0.7% annually of the average annual
net asset value
- Contributory pension funds: up to
1.4% annually of the average annual
net asset value
10% of net asset value × (value of the
pension point/highest value of the
point - 1). The highest value of the
point is calculated over a defined
period.
- Switching fee: 5% of the member's
account balance in the first year after
concluding a contract
- Termination settlement fee: 20% of
the member's account balance (only
for old contracts)

41
PENSION MARKETS IN FOCUS 2019 © OECD 2019
Fees on salaries Fees on
contributions
Fees on assets Fees on returns / performance Other fees (e.g. exit fees, entry fees,
switching fees)
Spain x x 1.5% for management fees for equity
funds (1.30% for mixed funds and
0.85% for fixed income funds) and
0.20% for custodian fees (calculated
daily).
x x
Sweden - Premium pension x x - Equity funds: up to 0.89%
- Mixed funds: up to 0.62%
- Fixed income funds: up to 0.42%
x x
Turkey - auto-enrolment
plans
x x 0.85% 0.2% of return in excess of 2% +
index (repo and banking account)
x
United Kingdom - default
funds
x x 0.75% x x
United States No cap No cap No cap No cap No cap
Selected other jurisdictions
Albania x x 3% of the net value of the pension
fund annually
x - Switching fee up to 0.5% of the
amount transferred
- Early withdrawal fee from 2% to
20% of the net asset value withdrawn
depending on the length of
membership
Armenia - mandatory plans x x 1.5% of the average annual net asset
value
x Redemption fee up to 1% of NAV of
redeemed units
Armenia - voluntary plans x x 5% of the average annual net asset
value
x No cap
Bulgaria - VPFOS and VPF
funds
x 7% x 10% of the return (in any)
accumulated from the start of the
year, calculated daily
- Entry fee: up to BGN 10
- Switching fee: up to BGN 20
- Other fees: up to BGN 20
Bulgaria - UPF and PPF x 4% 0.8% of the net assets calculated
daily
x Up to BGN 10 when transferring
funds from UPF/PPF to a pension
scheme of the EU, ECB or EIB
Colombia 3% (including
insurance)
x x x x
Costa Rica - ROP x x Up to 0.5% of assets (going down to
0.35% by 2020)
x x
Croatia - mandatory pension
funds
x x 0.363% x - Entry fee: up to 0.8% of
contributions
- Switching fee: up to 0.8% of the
member's assets
Croatia - voluntary pension
funds
x x No cap x No cap
Ghana x x 2.5% x x
Liechtenstein x No cap No cap x No cap
Maldives x x 0.8% of assets monthly x x
Nigeria x NGN 100 monthly
per contribution
2.025% for Fund I; 1.79% for Fund II
and 1.65% for Fund III (on 1 Jan
2019)
7.5%
North Macedonia -
mandatory pension funds
x 2.5% 0.035% of assets monthly x Switching fee up to EUR 15 per
member if membership is less than
720 days, otherwise is free of charge
North Macedonia - voluntary
pension funds
x 7% 0.15% of assets monthly x Switching fee up to EUR 10 per
member if membership is less than
360 days, otherwise is free of charge
Pakistan - voluntary pension
funds
x x 1.5% x 3% of contribution
Peru No cap x No cap x x
Romania - 2nd pillar x 2.5% 0.05% of net assets monthly x Switching fee for transfers taking
place earlier than 2 years after joining
the plan, no cap

42
PENSION MARKETS IN FOCUS 2019 © OECD 2019
Fees on salaries Fees on
contributions
Fees on assets Fees on returns / performance Other fees (e.g. exit fees, entry fees,
switching fees)
Romania - 3rd pillar x 5% 0.2% of net assets monthly x Switching fee for transfers taking
place earlier than 2 years after joining
the plan, no cap
Serbia x No cap 1.25% x No cap (switching fee)
Uruguay x 1.5 times the
lowest fee
available in the
market
x x x
Note: Please see the methodological notes at the end of the report.
Source: OECD Reviews of Pension Systems: Latvia; and OECD Global Pension Statistics.
Like Croatia, other jurisdictions have also been lowering their cap on fees recently (e.g. Bulgaria, Costa Rica, Estonia, Serbia, the Slovak Republic, Spain). Bulgaria reduced the maximum fees that supplementary mandatory universal pension funds (UPF) and supplementary mandatory professional pension funds (PPF) could charge on contributions (from 4.5% to 4% in 2018) and on assets (from 0.9% to 0.8%). Costa Rica has been reducing the maximum fees on assets for the mandatory ROP system, targeting to reach 0.35% in 2020. In Estonia, the cap for management fees of mandatory pension funds dropped to 1.2% for all pension funds as of 2 September 2019 (while before, the cap was 1.2% for conservative funds only, 2% for the other funds). Serbia also lowered the asset management fee from 2% to 1.25% as of January 2018 (but also removed the cap on contributions of 3%).
Other initiatives to reduce the fees charged by the industry include auction mechanisms based on fees such as in Chile, New Zealand (along with other criteria) and Peru. In Chile and Peru, pension providers bid on fees charged to members. The winning pension provider receives all new eligible entrants. In New Zealand, default providers are selected based on a range of selection criteria that include fees. These mechanisms intend to drive the fees down.
The amount of fees charged to members was heterogeneous across countries at the end of 2018 (Figure 1.20). Regardless of the fee structure, the highest fees charged to members relatively to the amount of assets under management were recorded in Albania (2.6%), followed by Turkey (2.0%) and Pakistan (1.4%). By contrast, members paid the lowest amount of fees in Australia, Costa Rica and the Dominican Republic (0.5% of assets or less).13
13 Data may underestimate the actual charges on the pension pot paid by members in some countries through indirect costs reducing investment returns for instance. The Productivity Commission (2018[19]) in Australia estimated that the total costs paid by members of APRA-regulated funds exceeded 1% of assets in 2017 for instance.

43
PENSION MARKETS IN FOCUS 2019 © OECD 2019
Figure 1.20. Annual fees or commissions charged to members, 2018 or latest year available
As a percentage of total assets
Note: Please see the methodological notes at the end of the report.
Source: OECD Global Pension Statistics.
Due to the low investment returns in 2018 in various countries, the fee on performance was nil or low in 2018 in Bulgaria, the Czech Republic and Poland where this type of fee existed.
A. Selected OECD countries B. Selected other jurisdictions
0.0
0.5
1.0
1.5
2.0
2.5
3.0
0.0
0.5
1.0
1.5
2.0
2.5
3.0


45
PENSION MARKETS IN FOCUS 2019 © OECD 2019
Women receive lower pensions than men worldwide. This chapter aims to assess the extent to which the gap in pension income that men and women receive in retirement may be attributed to the funded and private pension system. This analysis aims at uncovering any evidence of a gap in pension income that men and women receive from funded and private pension plans in retirement and touching upon some of the underlying drivers of this gap.
The analysis shows the size of the gap in pension income between men and women across countries. Women receive less than men from pension systems because, overall, they tend to have earned less and had shorter careers than men during their working lives. The pension system reflects past differences in careers of those that are already retired, although the transmission mechanism varies across the different layers of the pension system. This analysis identifies a gap in pension income that women receive from their funded and private pension plans (occupational and personal plans) compared to men. This analysis focuses on the differences of pension income between men and women and does not touch upon the overall level and adequacy of the pension income of men and women.
Differences in men and women’s labour market outcomes have been narrowing, which one would expect to narrow the private pension income gap between men and women over time, but other factors may continue to widen this gap. There is still a gap in private pension plan coverage for men and women in many OECD countries. Additionally, women enrolled in any type of plan have lower savings than men, and this gap compounds over their career. Women are therefore likely to continue receiving less income from private pension plans than men when they retire.
This chapter has the following structure. Its first section defines and measures the gender gap in pension income and looks for factors explaining the current gap. It then examines where differences between men and women arise during the accumulation phase of the funded and private pension system.
2.1. Measuring the gender gap in total pensions and in funded and private pensions
This section examines the extent to which men and women receive a different pension income (from private or public sources) in retirement, before focusing on the size of the gap coming from funded and private pensions.
2.1.1. Defining and assessing a gender pension gap
Individuals may receive income from several sources at retirement. Retirees may get a public (old-age) pension following entitlements in the public pension system, and they may also draw on savings from funded and private pension plans. Widow(er)s benefit from survivor’s pensions in most OECD countries (OECD, 2018[8]). Some retirees may simply continue to work during retirement and earn some income from that work.
2 Gender and private pensions

46
PENSION MARKETS IN FOCUS 2019 © OECD 2019
Men and women may not be on an equal footing in retirement if they receive different benefit payments from the overall (public and private) pension system. The differences could relate to the amounts received from the pension system in a given year (gap in pension income).14
A gap in pension income – referred hereafter as a gender pension gap – is measured in this report as the difference between the average pension income of men and women in the latest year available. It is expressed as a percentage of men’s average pension income and is calculated over the population of pension beneficiaries aged 65+ for comparability purposes across countries.15 Calculations exclude those with no pension at all. Work-related earnings for people aged 65+ are excluded from the calculations, as they do not represent a pension income. One-off payments (i.e. lump sums) that can be received from pension plans are not taken into account in the calculations of the gender pension gap, unless they are re-used to purchase an annuity product.
The analysis of the gender pension gap relies on multinational household survey data. Multinational household surveys contain information about streams of income from both the public and private pension systems for the elderly, and are harmonised across countries.16 Some other sources (e.g. focus group analyses) can also provide insights and complement the analysis of the gender pension gap and its drivers (Box 2.1).
14 Differences between men and women could also relate to the cumulative amounts received by men and women over the whole retirement period (gap in pension wealth). 15 There are differences in life expectancy between men and women across countries, If older cohorts tend to have less pension income and women live longer than men, this cohort effect will be captured within the measure. In that case, differences across countries in the gender gap in life expectancy could explain some of the differences in the gender pension gap across countries (on top of other factors). 16 The elderly population is defined as people aged 65 and over. Some household surveys – especially those based on the whole population - may exclude people living in collective households and in institutions, such as the elderly in nursing homes or old people’s homes. These collective homes (excluding hospitals) host more women than men aged 65+ in all OECD countries except Latvia and Portugal. Excluding these residents may marginally distort the gender pension gap as these residents represent between 0% and 9% of all individuals aged 65+ across OECD countries according to the OECD Long-Term Care Resources and Utilisation database. Belgium had the largest proportion of individuals in collective homes (excluding hospitals) in 2014, with women representing 11% of all women aged 65+ in these institutions.

47
PENSION MARKETS IN FOCUS 2019 © OECD 2019
Box 2.1. Different sources for analysing the gender pension gap
The calculation of a gender pension gap requires knowing all the sources of income that men and women receive from the public and private pension systems.
Several sources provide information on the income of the elderly. These sources include supervisory data, tax data, and survey data. Supervisory authorities compile information on benefit payments to retirees from private pension providers and the type of payments (e.g. lump sum payments, pensions). Tax and survey data can provide extensive information on the source of income for individuals by gender, taking into account all the income flows (from the public and the private systems) and the different providers (pension funds, insurance companies) of private pension income. Some other studies, such as focus group analyses, can also provide detailed information on the pension benefits retirees receive. Industry groups may also carry out studies on their clients for a better understanding of their preferences and behaviours.
The analysis of the gender pension gap in this report is mainly based on household data as they include information on public and private pension income (unlike supervisory data), they are representative of the whole population through their sampling and weighting procedures (unlike focus group studies) and are easily available to the research community. This report favours multinational household surveys as they cover multiple countries and compile information on pension income in a standardised fashion (which may not be the case for tax data). Unfortunately, lump sum payments may not be considered as a (regular) pension income in households surveys unless individuals purchase an annuity product with the lump sum payments. Household surveys are therefore useful for assessing a gender gap in regular pension income but less appropriate for measuring a gender gap in pension wealth (that would take into account one-off payments as well as how long the regular payments are carried out).
Household data however contain useful demographic information about individuals (marital status, age, type of job). This information can be relevant to any analysis of drivers of the gender pension gap during individuals’ working lives.
All reporting OECD countries have a gender pension gap. The gap ranges from 5% in Estonia to 47% (of men’s average pension income) in Japan (Figure 2.1). On average, women aged 65+ receive 26% less income than men from the pension system in the OECD. In other words, women aged 65 or more receive around 74% of the pension income of men from public and private pension arrangements on average in the OECD. These results are overall in line with previous work from the OECD on this subject using other sources (OECD, 2017[9]), although the size of the gap may vary to some extent for some countries (Box 2.2).

48
PENSION MARKETS IN FOCUS 2019 © OECD 2019
Figure 2.1. Gender gap in pensions in the OECD, latest year available
Relative difference between men and women aged 65+ (among pension beneficiaries)
Note: Please see the methodological notes at the end of the report.
Source: OECD calculations based on LIS and HFCS.
0%
10%
20%
30%
40%
50%

49
PENSION MARKETS IN FOCUS 2019 © OECD 2019
Box 2.2. Gender pension gaps according to several multinational household surveys
The extent of the gap may vary across different household surveys. Several multinational household surveys gather standardised information on the pension income of men and women in a number of countries. These surveys include the Household Finance and Consumption Survey (HFCS), the Luxembourg Income Study (LIS), the Luxembourg Wealth Study (LWS) and the European Union Statistics on Income and Living Conditions (SILC). Altogether, these surveys cover all OECD countries but Israel, Korea, New Zealand and Turkey.
These multinational surveys follow different approaches to standardise survey responses across countries. The HFCS and SILC define a common framework ex ante that participating national bodies use to design a survey tailored to their own country. The underlying national surveys allow for the production of harmonised outputs across countries following the HFCS and SILC frameworks. By contrast, LIS and LWS harmonise the outputs of national surveys ex post to create international databases.
All the selected surveys consistently show a gender pension gap in reporting OECD countries (Figure 2.2). However, the extent of this gap differs across surveys. Some of the largest discrepancies can be found in Germany with a gender pension gap varying between 33% and 46% depending on the survey, Estonia with a gap between 3% and 15%, Luxembourg with a gap between 39% and 50%, and the United Kingdom with a gap between 38% and 48%.
Figure 2.2. Gender pension gap in OECD countries according to different sources, latest year available
Relative difference between men and women aged 65+ (among pension beneficiaries)
Note: Please see the methodological notes at the end of the report.
Source: OECD calculations based on HFCS, LIS, LWS; OECD (2017) for SILC.
0%
10%
20%
30%
40%
50%
60%
HFCS LIS LWS SILC

50
PENSION MARKETS IN FOCUS 2019 © OECD 2019
Discrepancies across surveys may be the result of a combination of factors. These multinational surveys rely on different underlying national surveys. For instance, LIS and LWS data for Germany come from the German Socio-Economic Panel (GSOEP) while HFCS data are based on the Panel on Household Finances. The definition of pension income may potentially be different across surveys. The HFCS questionnaire explicitly requests gross income from pensions (before tax). The LIS and LWS databases do not specify whether the income is gross or net. Finally, the reference year may vary across surveys. For instance, data on the gender pension gap for the United Kingdom refer to 2009 in the LWS and 2016 in the LIS.
The gender pension gap assessed in Figure 2.1 is based on the LIS and complemented by data from the HFCS. The LIS already covers a large number of OECD countries and compiles data over several decades through several waves of data collection, allowing for an analysis of the trends (over different samples though).
The gender pension gap has shown a downward trend over the years in a number of countries. Figure 2.3 shows that the gender pension gap declined over two decades by 11 percentage points in Chile and Denmark, by 10 percentage points in Canada, by 8 percentage points in Germany and by 6 percentage points in the United Kingdom and the United States. By contrast, the gender pension gap remained more or less stable in Italy and the Netherlands.
Figure 2.3. Evolution of the gender pension gap in selected OECD countries
Relative difference between men and women aged 65+ (among pension beneficiaries)
Source: OECD calculations based on LIS.
0%
10%
20%
30%
40%
50%
60%
~ 1990 ~ 1995 ~ 2000 ~ 2004 ~ 2007 ~ 2010 ~ 2013
Canada Chile Denmark
Germany Italy Netherlands
United Kingdom United States

51
PENSION MARKETS IN FOCUS 2019 © OECD 2019
2.1.2. The current gender pension gap as a result of past differences in work histories carried over in retirement
The gender pension gap today is the result of different work histories between men and women and the way these differences are transferred through the different components of the pension system.
The gender pension gap is likely partially due to the lower proportion of women having a job compared to men in the past. In the early 1990s, 46% of women aged between 15 and 64 were working on average in the OECD, compared to 68% of men (Figure 2.4, Panel A.1). The decline in the gender pension gap may be related to the narrowing of the employment gap between men and women over the last decades. A larger share of women has a job in 2017 compared to the early 1990s while the proportion of men with a job has declined since that time. The share of women employed is, however, still below the share of employed men on average in the OECD (52% of women compared to 65% of men). The increasing proportion of women working has probably helped to build up pension entitlements to levels that are more comparable to those of men.
The gender pension gap may also be the result of a historically larger proportion of women in part-time work compared to men. On average, 22% of women in the working age population had a part-time job in 2000, compared to 6% of men in the OECD. The largest difference between men and women in part-time jobs was recorded in the Netherlands in 2000 (57% of women working part-time compared to 13% of men). The Netherlands also has one of the largest gender pension gaps (40% compared to 26% in the OECD on average), which may come from the difference in the shares of men and women in part-time jobs. Working part-time may exclude the worker from participation in pension systems in some countries. When it does not, working part-time still implies lower wages than in full-time jobs and therefore lower contributions (when contribution rates are set as a percentage of salary). These lower contributions result in lower pension payments at retirement. Differences between the proportion of women and men in part-time jobs remain in 2017 (Figure 2.4, Panel A.2), which could limit the decline of the gender pension gap in the future.
The current gender pension gap is also probably related to the past gender wage gap. Among full-time workers, women were earning less than men on average in 2000 (Figure 2.4, Panel A.3). This gender wage gap is declining on average in the OECD, from 18% in 2000 to 14% in 2017. This decline could be expected to lead to a decline in the gender pension gap in the future. Lower differences in wages turn into lower differences in pension income (with a time lag) if women are able to build up similar rights and save similar amounts as men during their working lives.
Other factors may contribute to the gender pension gap, such as women having shorter careers. Women’s careers are one third shorter than those of men on average (OECD, 2017[10]). These shorter careers may be the consequence of interruptions following childbirth and caring activities (children, elderly).

52
PENSION MARKETS IN FOCUS 2019 © OECD 2019
Figure 2.4. Factors potentially affecting the gender pension gap
Note: Please see the methodological notes at the end of the report.
Source: OECD Employment database
As a percentage of the working age population of men and women
In per cent
Relative difference between men and women
A.1. Employment rates of men and women in the OECD, in 1990 (or first year available) and 2017 (or last year available)
A.2. Share of men and women in part-time employment, 2017
A.3. Gender wage gap in OECD countries, in 2000 (or first year available) and 2017 (or last year available)
0%
10%
20%
30%
40%
50%
60%
70%
Men Women
20%
30%
40%
50%
60%
70%
80%
90%
100%
20% 30% 40% 50% 60% 70% 80% 90% 100%
1990 or first year available 2017 or last year available
Men
Women
0%
5%
10%
15%
20%
25%
30%
35%
40%
45%
2017 (or last year available) 2000 (or first year available)

53
PENSION MARKETS IN FOCUS 2019 © OECD 2019
The way all these differences during working lives turn into different pension income streams for men and women depends on the design of the pension system. The pension system is usually a combination of public and private programmes (OECD, 2017[11]). These programmes react differently to differences during working lives (Table 2.1). The overall effect of the different factors on the gender pension gap depends on the importance of each component of the pension system.
Table 2.1. Impact of gender differences in labour markets on rights and savings in different pension designs
Public non-
contributory
Public contributory Funded/Private
Occupational DB
Funded/Private
Occupational DC
Personal
(employment-
related)
Other
personal
Unemployment Higher odds to rely on it if
eligibility
criteria met
Reduced or no
entitlement
No access. Rights retained if already
member.
No access. Assets retained if already
member.
No access. Assets retained if already
member.
No automatic
impact
Part-time compared to full
time
Higher odds to rely on it if
eligibility
criteria met
Depends on access criteria.
Impact through
lower wages
Depends on access criteria. Impact
through lower wages
Depends on access criteria. Impact
through lower wages
Depends on access criteria.
Impact through
lower wages
No automatic
impact
Lower wages Higher odds to rely on it if eligibility
criteria met
Lower entitlements, smoothed in the
DB case depending
on the formula
Lower entitlements, smoothed depending
on the salary of reference in the
formula
Lower amount of assets accumulated
for similar
contribution rates
Lower amount of assets
accumulated for similar contribution
rates
No automatic
impact
Shorter careers Higher odds to rely on it if eligibility
criteria met
Lower entitlements (if not
compensated)
Lower entitlements (if not compensated). May be smoothed
with the accrual rate
Lower amount of assets accumulated
if not compensated.
Lower amount of assets
accumulated if not
compensated.
No automatic
impact
Unemployment affects individuals’ entitlements from contributory public pension arrangements and savings in occupational and employment-related personal plans. Working grants pension rights to workers through contributions. Unemployment years may be counted in the formula for public pension payments (such as in France) up to a certain extent, but benefit entitlements may be lower than for people who have worked. In the funded and private pension system, access to occupational pension plans (and some personal plans) is restricted to those working. If individuals lose or quit their job (after the vesting period of pension rights), they will retain rights in defined benefit (DB) plans or assets in defined contribution (DC) plans unless they transfer these assets to another vehicle. The accrual of rights or assets in these plans may not keep up with the rights of members still working and paying contributions.
Part-time work, lower wages, and shorter careers reduce the entitlements from the contributory system, although these effects could be smoothed depending on the formula of DB plans (if a certain number of years and average salaries are used in the formula of DB plans) or partly offset if career breaks are compensated.
All these labour market factors might also limit the propensity of individuals to save and the extent of savings in personal pension plans.
By contrast, differences in careers between men and women increase the odds of women falling into poverty in retirement and relying on the protection of non-contributory programmes relative to men. Eligibility to these programmes may be subject to some criteria in some countries (such as a certain number of years of residency, a certain number of contribution years to the public system). Some of these programmes may assess all income sources (such as social assistance that may be reduced depending on other pension incomes) and may sometimes depend on other assets too.

54
PENSION MARKETS IN FOCUS 2019 © OECD 2019
2.1.3. Gender gap in private pension income
Women tend to receive lower pension income than men in retirement. The extent to which this difference is explained by the funded and private pension system depends on both: i) the prominence of funded and private pension arrangements in the overall design of the pension system; and ii) the difference in the private pension income that men and women receive during retirement.
The funded and private pension system currently provides a regular stream of income to a small proportion of old-age people in a number of European countries where private pensions are still maturing (e.g. Slovak Republic) or where benefits from funded and private pensions are paid, fully or partially, as a lump sum (e.g. Belgium). The proportion of men and women currently receiving a regular private pension income is below 5% of the population aged 65+ in 9 out of 16 reporting European countries (Figure 2.5).
Figure 2.5. Proportion of individuals aged 65+ receiving a regular private pension income, 2014
In per cent
Note: Please see the methodological notes at the end of the report.
Source: OECD calculations based on HFCS.
The overall (public and private) gender pension gap may partly reflect a difference in the proportion of men and women receiving private pension income in some countries. The proportion of women aged 65+ receiving private pension income is relatively large in the Netherlands (55%) - one of the largest among a selection of European countries - but still much smaller than the proportion of men receiving private pension income (83%). The difference is also particularly large in Ireland (27% for women compared to 50% for men), Germany (16% for women, 29% for men) and Luxembourg (3% for women, 11% of men). More men receive private pension income than women and therefore benefit from another stream of income to complement public pension income than women in these countries, which may contribute to the overall gender pension gap.
Additionally, when women get a pension from a private pension plan, their private pension income may be lower than men’s, such as in Germany, Ireland and the Netherlands. Table 2.2 shows the average private pension income of men and women in selected European countries with the highest proportion of women aged 65+ receiving a regular private pension income. This average is calculated only over individuals receiving a private pension income (zeros and lump sum payments are therefore excluded). Women in the
0%
10%
20%
30%
40%
50%
60%
70%
80%
90%
100%
Men Women

55
PENSION MARKETS IN FOCUS 2019 © OECD 2019
selected countries receive between 22% (Ireland) and 54% (in the Netherlands) less income from their private pension plans (occupational and personal) than men.
Table 2.2. Gender gap in private pension income in selected OECD countries, latest year available
Relative difference between men and women aged 65+
Country Year Total
Germany 2014 45%
Ireland 2013 22%
Netherlands 2014 54%
Note: Please see the methodological notes at the end of the report.
Source: OECD calculations based on HFCS.
The amount of pension income of men and women may depend on their choices for the pay-out phase. The public pension system usually guarantees a monthly income. In the case of funded and private pensions, individuals may be able to choose the way to draw down their savings depending on the country. Individuals can receive different types of payments from private pension plans, such as lump sum payments, life annuities, programmed withdrawals, deferred life annuities or a combination of several options. Individuals can receive lump sums in several countries (e.g. Belgium, Switzerland, the United Kingdom). Private pension income in household surveys only reflects regular payments. Lump sums would not be included among regular pension income unless these lump sums are used to purchase an annuity. If men and women select different drawdown products, this could have an impact on the calculated difference between men’s and women’s income from private pension plans based on these surveys.
Some drawdown products protect retirees against the risk of outliving their assets (e.g. life annuity), which is higher for women given their higher life expectancy. Women may be expected to receive pension payments from life annuity products for a longer period than men. If the price of an annuity policy takes into account this difference in life expectancies and varies by gender, women will receive smaller pension payments than men for the same amount of accumulated assets in private pension plans, although the same pension wealth.17
Women may be less likely to receive a regular private pension income – thus increasing the risk of a gap in pension income between men and women - when annuity payments are conditional on eligibility criteria, such as in Lithuania and Mexico. Individuals in Lithuania have to purchase an annuity upon retirement if their assets in second pillar pension plans exceed the minimum level set in the law. If their assets are below this legal threshold, individuals receive their benefits as a lump sum payment. In Mexico, individuals who have contributed less than 1,250 weeks when they are 65 can only withdraw their assets from their individual retirement accounts as a lump sum. Otherwise, they have the choice between a life annuity and programmed withdrawals. Men are more likely to meet the criterion on the number of contribution weeks than women (Herrerías et al., 2017[12]), as women have lower employment rates and shorter careers than men.
Differences in the pay-out phase between men and women could be expected to shrink as some gaps between men and women in the labour market (e.g. gender employment gap, gender wage gap) are slowly fading. Women may be more likely to reach the retirement age with similar private pension entitlements as men in the long run if funded and private pension systems enable women to save for retirement during their working lives to the same extent as men. The next section explores the current trends in differences
17 Since 2012, the European Court of Justice has forbidden insurance companies from taking into account gender when pricing their annuity products. This rule implies that differences in life expectancy will not lead to lower benefit payments for women than for men for the same amount of accumulated assets in European countries.
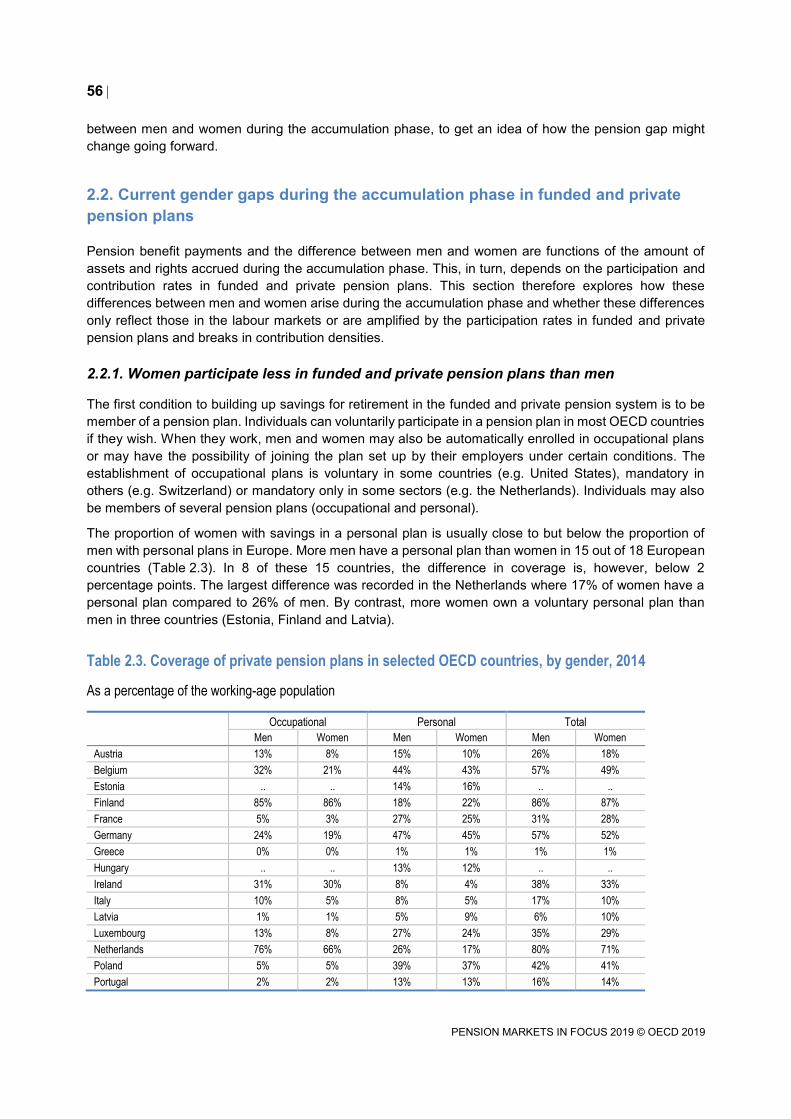
56
PENSION MARKETS IN FOCUS 2019 © OECD 2019
between men and women during the accumulation phase, to get an idea of how the pension gap might change going forward.
2.2. Current gender gaps during the accumulation phase in funded and private pension plans
Pension benefit payments and the difference between men and women are functions of the amount of assets and rights accrued during the accumulation phase. This, in turn, depends on the participation and contribution rates in funded and private pension plans. This section therefore explores how these differences between men and women arise during the accumulation phase and whether these differences only reflect those in the labour markets or are amplified by the participation rates in funded and private pension plans and breaks in contribution densities.
2.2.1. Women participate less in funded and private pension plans than men
The first condition to building up savings for retirement in the funded and private pension system is to be member of a pension plan. Individuals can voluntarily participate in a pension plan in most OECD countries if they wish. When they work, men and women may also be automatically enrolled in occupational plans or may have the possibility of joining the plan set up by their employers under certain conditions. The establishment of occupational plans is voluntary in some countries (e.g. United States), mandatory in others (e.g. Switzerland) or mandatory only in some sectors (e.g. the Netherlands). Individuals may also be members of several pension plans (occupational and personal).
The proportion of women with savings in a personal plan is usually close to but below the proportion of men with personal plans in Europe. More men have a personal plan than women in 15 out of 18 European countries (Table 2.3). In 8 of these 15 countries, the difference in coverage is, however, below 2 percentage points. The largest difference was recorded in the Netherlands where 17% of women have a personal plan compared to 26% of men. By contrast, more women own a voluntary personal plan than men in three countries (Estonia, Finland and Latvia).
Table 2.3. Coverage of private pension plans in selected OECD countries, by gender, 2014
As a percentage of the working-age population
Occupational Personal Total
Men Women Men Women Men Women
Austria 13% 8% 15% 10% 26% 18%
Belgium 32% 21% 44% 43% 57% 49%
Estonia .. .. 14% 16% .. ..
Finland 85% 86% 18% 22% 86% 87%
France 5% 3% 27% 25% 31% 28%
Germany 24% 19% 47% 45% 57% 52%
Greece 0% 0% 1% 1% 1% 1%
Hungary .. .. 13% 12% .. ..
Ireland 31% 30% 8% 4% 38% 33%
Italy 10% 5% 8% 5% 17% 10%
Latvia 1% 1% 5% 9% 6% 10%
Luxembourg 13% 8% 27% 24% 35% 29%
Netherlands 76% 66% 26% 17% 80% 71%
Poland 5% 5% 39% 37% 42% 41%
Portugal 2% 2% 13% 13% 16% 14%

57
PENSION MARKETS IN FOCUS 2019 © OECD 2019
Occupational Personal Total
Men Women Men Women Men Women
Slovak Republic .. .. 14% 10% .. ..
Slovenia .. .. 10% 10% .. ..
Spain 3% 2% 19% 17% 22% 19%
Note: Please see the methodological notes at the end of the report.
Source: OECD calculations based on HFCS.
The proportion of women covered by an occupational plan is lower than men in most reporting European countries, with Finland being one of the exceptions. The coverage of women in occupational plans is comparable to men in Finland (around 85%), as participation in earnings-related pension plans (TyEL and other plans) is mandatory for public and private sector workers, farmers and self-employed individuals. Additionally, the employment gap between men and women is smaller in Finland (5 percentage points) than in the OECD on average (13 percentage points).
The employment gap, which is relatively large in some countries, may not explain alone the difference in the proportion of men and women covered by an occupational plan in Europe. Calculating the proportion of men (respectively women) having an occupational pension plan over the employed population (instead of the working-age population) allows seeing whether the gender employment gap has a differentiated impact. The difference between the proportion of men and women covered by occupational plans remains almost the same in Austria, Belgium, Italy, and the Netherlands for instance, even after controlling for the gender employment gap in these countries (Figure 2.6). However, the difference in coverage declines in Germany (from 5 to 4 percentage points) and especially in Ireland where the gender gap in occupational plan coverage reverses with more women covered than men over the employed population after controlling for the gender employment gap.
Figure 2.6. Differences in occupational pension plan coverage of men and women, in selected countries, 2014
In percentage points
Note: Please see the methodological notes at the end of the report.
Source: OECD calculations based on HFCS.
The participation of individuals in a plan may vary across sectors when the legislation does not require all employers to establish a plan on behalf of their employees. Access to an occupational plan then depends
-6
-4
-2
0
2
4
6
8
10
12
14
Over working-age pop Over the employed pop

58
PENSION MARKETS IN FOCUS 2019 © OECD 2019
on the willingness of employers to set up a plan for their employees. A study from the Pew Charitable Trusts (2017[13]) found that full-time workers in some sectors (e.g. material moving) in the United States were more likely to have access to occupational plans than full-time workers in other sectors (e.g. wholesale and retail trade). Some employers may voluntarily set up occupational plans as part of a remuneration package to attract and retain skilled people.
In some countries, the difference in coverage of occupational plans between men and women probably results from the underrepresentation of women in sectors providing access to occupational plans the most. The proportion of women working in a given sector is inversely correlated with the coverage rate of occupational plans in this sector in Austria, Belgium, Germany, Italy, Luxembourg and the Netherlands (Figure 2.7). Women tend to work in sectors where fewer individuals are covered by an occupational plan such as education (code “P” in the NACE Rev. 2 Classification) or human health and social work activities (code “Q”). Women are underrepresented in manufacturing activities (code “C”) where employers provide wider access to occupational plans.
Women may face more barriers to joining occupational or employment-related plans when the access is subject to employment or earning conditions. In the United States, if employers decide to set up an occupational plan for their employees, they must provide access to this plan at least to all employees aged 21 and over and having 1 year or more of service (1 000 hours of work during the year). It may be more difficult for part-time workers – more often women - to qualify unless employers set wider access conditions. In other countries where participation in a plan is mandatory, access to the plan may be limited to those working in a formal job. Women who are more likely to be in informal work than men in Latin America (ILO, 2018[14]) could be left out from these mandatory plans (e.g. in Chile). Minimum earning requirements for joining a plan might also exclude women more than men from occupational plans. In Australia for instance, employers of individuals have to contribute to a plan on behalf of employees earning at least AUD 450 per month before tax. There is also an earnings floor in the United Kingdom to qualify for automatic enrolment in a plan. Women might be more penalised than men as they earn less than men on average.
The current difference in the proportion of men and women having a pension plan is likely to lead to differences in the proportion of retired men and women benefitting from private pension income.

59
PENSION MARKETS IN FOCUS 2019 © OECD 2019
Figure 2.7. Proportion of women working by sector and overall coverage of occupational plans by sector, 2014
In per cent
Note: Please see the methodological notes at the end of the report.
Source: OECD calculations based on HFCS.
A B
CD
EF GH
I
J
K
LM
N
O
P
Q
R
S
T0%
5%
10%
15%
20%
25%
30%
35%
0% 20% 40% 60% 80% 100%
Coverage
Proportion of women
Austria
A
B
C D
E
F
G
H
I
J
K
LM
N
O
P
Q
R
ST
U
0%
10%
20%
30%
40%
50%
60%
70%
80%
0% 20% 40% 60% 80% 100%
Coverage
Proportion of women
Belgium
A
B
CD
E F
G
H
I
J
K
L M
N
O P
Q
RS
T
0%
20%
40%
60%
80%
100%
0% 20% 40% 60% 80% 100%
Coverage
Proportion of women
Germany
A
BC
D
E
F
GH
I
J
K
L
M
NOPQ
R
S
T
U
0%
10%
20%
30%
40%
50%
60%
0% 20% 40% 60% 80% 100%
Coverage
Proportion of women
Italy
A
B
C
D
E
F
G
H
I
J
K
L
MN
O P Q
R
ST
U
0%
10%
20%
30%
40%
50%
60%
0% 20% 40% 60% 80% 100%
Coverage
Proportion of women
LuxembourgA
B
CDEF
GH
I
J
K
L
M
N
OP
Q
R
STU
0%
20%
40%
60%
80%
100%
0% 20% 40% 60% 80% 100%
Coverage
Proportion of women
Netherlands

60
PENSION MARKETS IN FOCUS 2019 © OECD 2019
2.2.2. The widening gap in pension assets over the accumulation phase
Women with a private pension plan have not historically accrued as much as men in their plans in almost all European countries. Figure 2.8 shows that men hold twice the pension assets of women in Austria and Luxembourg. By contrast, women have larger voluntary pension plan savings in Greece and in the Slovak Republic.
Figure 2.8. Gender gap in assets (or entitlements) in all pension plans, 2014
Relative difference between men and women
Note: Please see the methodological notes at the end of the report.
Source: OECD calculations based on HFCS.
This gap between the pension assets and entitlements that men and women accumulate first emerges in the 25-34 year group and continues to widen from that point onwards. At the early stages of their careers, women and men have almost the same amount of assets (with a 1% difference in favour of men’s pension assets) on average in a selection of European countries (Figure 2.9). The value of women’s pension plans starts falling behind when they are between 25 and 34 years old. Women aged between 25 and 34 have 16% less than men in their pension plans. This gap widens between 35 and 44 year-old when women have 29% less in their pension accounts than men. This analysis is carried out based on the pension assets of different cohorts in 2014. An analysis of the gap in pension assets over time for the same cohort would help to confirm the findings based on different cohorts.18
18 Figure 2.9 probably includes both an age effect (i.e. the gap in pension assets grows as people age) and a generational effect (i.e. men and women in the last age group were born at a different time than those in the first age group). Further analysis would be needed to disentangle the age and generational effects.
-20%
-10%
0%
10%
20%
30%
40%
50%
60%

61
PENSION MARKETS IN FOCUS 2019 © OECD 2019
Figure 2.9. Average amount of assets in pension plans by gender and age group in selected countries, 2014
Note: Please see the methodological notes at the end of the report.
Source: OECD calculations based on HFCS.
This gap may be due to differences in careers. Career breaks for parenting purposes between 25 and 44 probably explain the emergence of the gap in the amounts saved in pension assets (Mcguinness and Pyper, 2018[15]).19 The same contribution rates for men and women would lead to lower savings overall for women compared to men given the gender wage gap.20
The gap in pension assets reaches its peak at the eldest ages (33% between men and women aged between 45 and 54 years old, 36% between 55 and 64 years old). This gap is the result of past differences in assets accumulated. The difference in asset values – in absolute monetary terms - widens over time as the value of assets compounds. Contributions are invested and generate investment income. Larger pension pots would earn more (in absolute terms) than smaller pots for similar investment rates of return.
Men and women may not earn the same investment rates of return in DC plans when they have different investment strategies. Women tend to be more risk averse than men and may invest their assets differently. Women tend to hold more cash and money market funds – relatively lower risk investment – than men who hold rather stocks and shares in mutual funds that are riskier, when looking at investment allocations of both men and women outside retirement assets (Garnick, 2016[16]). Further work could look into the differences in investment strategies between men and women. A potential difference in investment strategy may contribute to differences in pension outcome, especially in a context of a growing prominence of DC plans where plan members make investment choices.
19 McGuinness and Pyper (2018[16]) show that the gender pay gap between men and women grows after the birth of a first child in the United Kingdom. 20 Different effective contribution rates by men and women could affect the gender gap in pension assets or entitlements. This dimension is left aside from this analysis due to lack of available data.
0%
5%
10%
15%
20%
25%
30%
35%
40%
0
10,000
20,000
30,000
40,000
50,000
60,000
70,000
80,000
16-24 25-34 35-44 45-54 55-64
Men (LHS) Women (LHS) Gender gap in pension assets (RHS)
EURRelative diff between men and women

62
PENSION MARKETS IN FOCUS 2019 © OECD 2019
References
Garnick, D. (2016), Income Insights: Gender Retirement Gap. [16]
Herrerías, R. et al. (2017), DETERMINANTS OF DENSITY OF CONTRIBUTION FOR THE MEXICAN PENSION SYSTEM.
[12]
ILO (2018), Women and men in the informal economy: a statistical picture. [14]
ILO (2016), What works : Active labour market policies in Latin America and the Caribbean. [1]
MAPAS (2019), Report on the Development in the Fully Funded Pension Insurance in 2018. [2]
Mcguinness, F. and D. Pyper (2018), The Gender Pay Gap, http://www.parliament.uk/commons-library|intranet.parliament.uk/commons-library|[email protected]|@commonslibrary.
[15]
OECD (2019), Annual Survey of Investment Regulation of Pension Funds. [5]
OECD (2019), Financial Markets, Insurance and Pensions Inclusiveness and Finance, http://www.oecd.org/daf/fin/financial-markets.
[18]
OECD (2019), OECD Reviews of Pension Systems: Peru, OECD Reviews of Pension Systems, OECD Publishing, Paris, https://dx.doi.org/10.1787/e80b4071-en.
[3]
OECD (2018), Financial Incentives and Retirement Savings, OECD Publishing, Paris, https://dx.doi.org/10.1787/9789264306929-en.
[4]
OECD (2018), OECD Pensions Outlook 2018, OECD Publishing, Paris, https://dx.doi.org/10.1787/pens_outlook-2018-en.
[8]
OECD (2017), Pensions at a Glance 2017: OECD and G20 Indicators, OECD Publishing, Paris, https://dx.doi.org/10.1787/pension_glance-2017-en.
[11]
OECD (2017), Preventing Ageing Unequally, OECD Publishing. [9]
OECD (2017), The Pursuit of Gender Equality: An Uphill Battle, OECD Publishing. [10]
Pensions Policy Institute (2014), Risk Sharing Pension Plans: The Dutch Experience. [7]
Productivity Commission (2018), Superannuation : assessing efficiency and competitiveness. [19]
Stewart, F., R. Despalins and I. Remizova (2017), Pension Funds, Capital Markets, and the Power of Diversification, http://econ.worldbank.org.
[6]
Stewart, F. and J. Yermo (2008), “Pension Fund Governance: Challenges and Potential Solutions”, OECD Working Papers on Insurance and Private Pensions, No. 18, OECD Publishing, Paris, https://dx.doi.org/10.1787/241402256531.
[17]
The Pew Charitable Trusts (2017), Survey Highlights Worker Perspectives on Barriers to Retirement Saving.
[13]
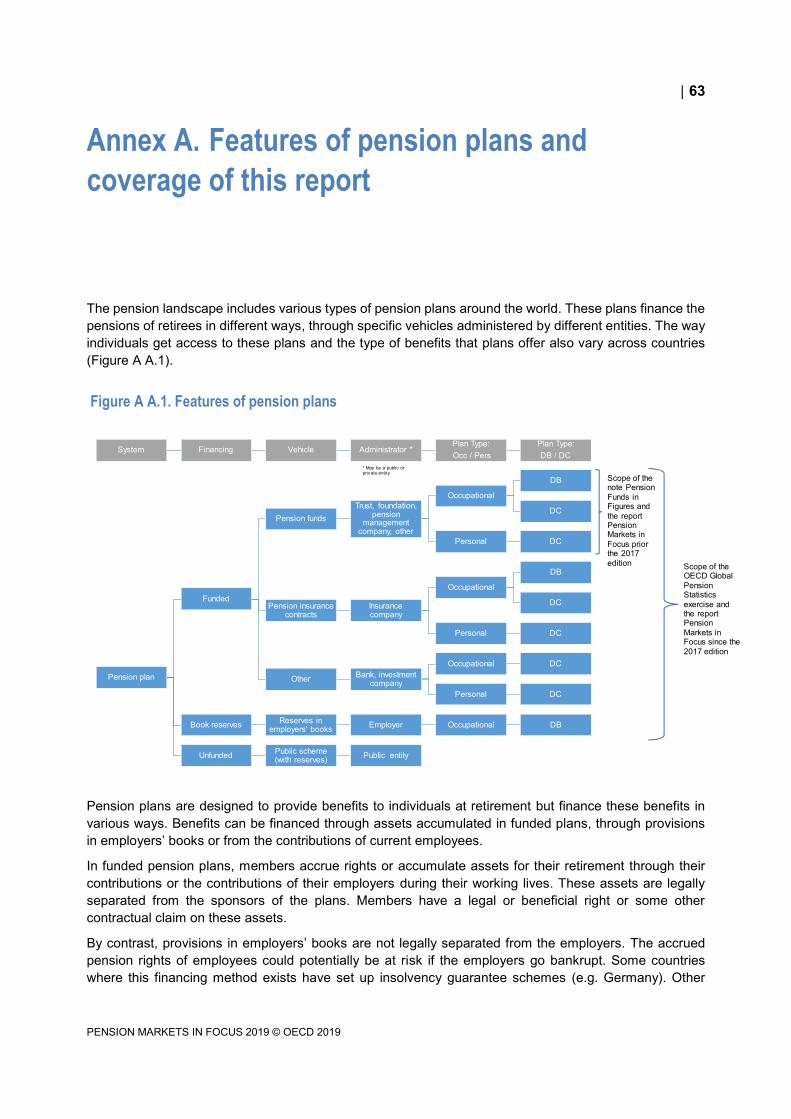
63
PENSION MARKETS IN FOCUS 2019 © OECD 2019
Annex A. Features of pension plans and
coverage of this report
The pension landscape includes various types of pension plans around the world. These plans finance the pensions of retirees in different ways, through specific vehicles administered by different entities. The way individuals get access to these plans and the type of benefits that plans offer also vary across countries (Figure A A.1).
Figure A A.1. Features of pension plans
Pension plans are designed to provide benefits to individuals at retirement but finance these benefits in various ways. Benefits can be financed through assets accumulated in funded plans, through provisions in employers’ books or from the contributions of current employees.
In funded pension plans, members accrue rights or accumulate assets for their retirement through their contributions or the contributions of their employers during their working lives. These assets are legally separated from the sponsors of the plans. Members have a legal or beneficial right or some other contractual claim on these assets.
By contrast, provisions in employers’ books are not legally separated from the employers. The accrued pension rights of employees could potentially be at risk if the employers go bankrupt. Some countries where this financing method exists have set up insolvency guarantee schemes (e.g. Germany). Other
System Financing Vehicle Administrator *Plan Type:Occ / Pers
Plan Type: DB / DC
Pension plan
Funded
Pension fundsTrust, foundation,
pension management
company, other
Occupational
DB
DC
Personal DC
Pension insurance contracts
Insurance company
Occupational
DB
DC
Personal DC
Other Bank, investment company
Occupational DC
Personal DC
Book reserves Reserves in employers' books Employer Occupational DB
Unfunded Public scheme (with reserves) Public entity
Scope of the OECD Global Pension Statistics exercise and the report Pension Markets in Focus since the 2017 edition
Scope of the note Pension Funds in Figures and the report Pension Markets in Focus prior the 2017 edition
* May be a public or priv ate entity

64
PENSION MARKETS IN FOCUS 2019 © OECD 2019
countries encourage or require employers to purchase credit insurance or arrange equivalent guarantees (e.g. Sweden) to protect the pension rights of the employees in the event of employer insolvency.
Pension plans are considered as unfunded when benefits of retirees are paid on a pay-as-you-go basis from the contributions of current workers for instance. These unfunded plans may however build up reserves to cover immediate expenses and smooth benefit payments over time. These reserves may come from the excess of contributions over benefit payments in certain years. They may also be the result of fiscal transfers.
Some plans have both a funded and unfunded component, such as in Finland. The earning-related pensions paid by plans regulated by the Employees’ Pension Act (TyEL) and the Seafarer’s Pensions Act (MEL) are financed through a funded and a pay-as-you-go mechanism. The main part of the pensions in a given year is paid by the contributions received that year. The remaining part is financed by accumulated assets.
Pension plans may be funded through the establishment of pension funds, pension insurance contracts or the purchase of other authorised retirement savings products. Pension funds represent a pool of ring-fenced assets forming an independent legal entity. When pension insurance contracts are used for retirement saving, individuals or their employers pay premiums to insurance companies. Insurance companies manage assets coming from these premiums (or contributions) together with those coming from their other insurance activities. While the amount of premiums paid for these policies is usually known, it is more difficult to assess the size of assets that insurance companies hold as a result of their pension activities. Individuals or their employers may also open or purchase other retirement savings products offered and administered by banks or investment companies (such as individual retirement accounts (IRAs) in the United States).
Pension funds take different forms around the world (Stewart and Yermo, 2008[17]). Pension funds may have a legal personality and capacity in some countries (e.g. Pensionkassen in Austria and Germany, contractual pension funds in Italy, pension funds in the Netherlands and Switzerland). Pension funds in these countries have their own governing board. In some other countries, pension funds are a segregated pool of assets without legal personality and capacity. In this case, pension funds are governed and administered by a separate entity. This entity may be a pension fund management company (e.g. in the Czech Republic, Chile, Mexico, the Slovak Republic), a bank or an insurance company for instance. In some other countries (e.g. Ireland), the legal form of the pension fund is the trust. The trustees legally own and administer the assets of the trust in the interest of plan members. The trustees are however not legally part of the trust. Irrespective of the legal form of the pension funds, some of the activities, such as those related to the investment of assets or the collection of contributions, may be outsourced to third parties (e.g. asset managers).
Employers may set up funded plans on behalf of their employees. In such case, the plans are considered as occupational in the OECD taxonomy.21 Access to the plans is linked to employment. The sponsor may be a public institution and the members of the plan may be public-sector workers (e.g. in the United Kingdom, in the United States). When individuals choose and set up themselves plans with a dedicated provider, the plans are personal. Access to certain plans may however be limited to individuals in a professional activity but open to both public and private sector workers (e.g. Mexico). These plans are still considered as personal as individuals independently select material aspects of the plan such as the investment strategy, the fund or the administrator of the fund.
The OECD considers plans where the employer is responsible for guaranteeing a benefit or return promise to plan members as defined benefit (DB) plans. The benefit promise may be a pension calculated on a
21 The definitions of pension plans by the OECD’s Working Party on Private Pensions are available in the publication Private Pensions: OECD Classification and Glossary, available at www.oecd.org/daf/pensions.

65
PENSION MARKETS IN FOCUS 2019 © OECD 2019
number of parameters (e.g. salary, length of employment) or an investment rate of return. In the first case, the plans are considered as DB traditional, while the plans are considered as DB hybrid in the second case. When another party offers a guarantee (e.g. the pension fund directly, an insurance company), the plans are considered as DC protected. Otherwise, if there is no (fixed) guarantee, the plans are DC unprotected.
The Global Pension Statistics (GPS) that the OECD carries out in cooperation with the IOPS and the World Bank cover employers’ book reserves (which are private pension plans) and all funded pension plans regardless of the financing vehicle and its administrator (public or private institution), the type of plans (occupational, personal, DB or DC) and the type of people covered (public sector workers, private sector workers). Unfunded schemes and their reserves are out of the scope of this exercise.
This publication relies on the data collected through this statistical exercise. While the previous issues of Pension Markets in Focus were focusing on pension funds only, since the 2017 edition the reports have tried to show data for all funded and private pension plans, i.e. all plans where assets are accumulated to back future pension promises and employers’ book reserves. This change may account for the potential differences between the results in this report and results in earlier editions of this report (before the 2017 edition).
Data in the GPS exercise - and therefore in this report – may not always achieve to cover all the funded and private pension plans that exist in each country, due to data unavailability. Data may be sometimes fully unavailable (“missing”) for a given type of plan in a country (e.g. book reserves in Austria). In other cases, data may be “partially” missing only for a given type of plans. In Ireland for example, two plans qualify as pension insurance contracts according to the OECD taxonomy: retirement annuity contracts and personal retirement savings accounts (PRSAs). Data in the GPS exercise only cover PRSAs. Table A A.1 shows the types of plan that exist in all countries participating in the OECD, IOPS and World Bank statistical exercise. The Table also specifies the coverage of the OECD data by type of plan. More information of the different funded and private pension systems is available online.22
22 See https://www.oecd.org/pensions/private-pensions/pensionmarketsinfocus.htm

66
PENSION MARKETS IN FOCUS 2019 © OECD 2019
Table A A.1. Existing types of plans by country and data coverage
Note: Please see the methodological notes at the end of the report.
Pers. Pers. Occ. Pers. Occ.
DB DC DC DB DC DC DC DC DB
OECD countriesAustralia Fully Fully Fully PartiallyAustria Partially Fully Fully Partially Missing MissingBelgium Fully Fully Missing Missing Missing Missing PartiallyCanada Fully Fully Partially Fully Fully Fully Partially FullyChile Fully Fully Missing Missing Missing MissingCzech Republic FullyDenmark Fully Fully Fully Fully Fully FullyEstonia Fully FullyFinland Fully Fully Fully MissingFrance Fully Fully Fully FullyGermany Fully Missing Missing Missing Missing MissingGreece Fully MissingHungary Missing Fully Fully FullyIceland Fully Fully Fully Fully FullyIreland Fully Fully Partially FullyIsrael Fully Fully Missing PartiallyItaly Fully Fully Fully Fully FullyJapan Fully Fully Fully Fully FullyKorea Fully Fully Fully Fully Fully Fully FullyLatvia Fully Fully FullyLithuania FullyLuxembourg Fully Fully Missing Missing Missing MissingMexico Fully Fully Partially Fully Fully Missing Fully MissingNetherlands Fully Fully Missing Missing MissingNew Zealand Fully Fully Fully FullyNorway Fully Fully Fully FullyPoland Fully Fully Fully Fully Fully FullyPortugal Fully Fully Fully Missing Missing Fully FullySlovak Republic FullySlovenia Fully Fully Fully FullySpain Fully Fully Fully Fully Fully Fully FullySweden Fully Fully Fully Fully Fully Partially Fully PartiallySwitzerland Fully Fully FullyTurkey Partially Fully Fully FullyUnited Kingdom Fully Fully Missing Missing MissingUnited States Fully Fully Fully FullyOther jurisdictionsAlbania Fully FullyArmenia PartiallyBrazil Fully Fully FullyBulgaria Fully FullyColombia FullyCosta Rica Fully Fully FullyCroatia Fully FullyDominican Republic Fully Partially FullyEgypt FullyGhana Fully FullyGibraltar Fully Fully Missing FullyGuernsey Missing Missing MissingGuyana Fully FullyHong Kong (China) Fully Fully Fully FullyIndia Missing Fully FullyIndonesia Fully Fully PartiallyIsle of Man Fully Fully FullyJamaica Fully Fully FullyKazakhstan FullyKenya Fully Fully FullyKosovo FullyLiechtenstein Fully FullyMalawi Fully FullyMalaysia Fully FullyMaldives FullyMalta Fully FullyMauritius Fully Fully Missing MissingMozambique Fully FullyNamibia Fully Fully Fully FullyNigeria Fully FullyNorth Macedonia Fully FullyPakistan Missing Missing FullyPeru FullyRomania FullyRussia Fully Fully FullySerbia Fully FullySouth Africa Fully Fully Fully Fully FullySuriname Fully Fully Missing MissingTanzania Partially FullyThailand Partially MissingUkraine FullyUruguay FullyZambia Partially Fully Missing Missing
Funded
Missing
Occ. Occ.Pension funds Pension insurance contracts Other
Book reserves

67
PENSION MARKETS IN FOCUS 2019 © OECD 2019
Annex B. Statistical tables

68
PENSION MARKETS IN FOCUS 2019 © OECD 2019
Table A B.1. Total assets in funded and private pension plans, in millions of national currency, 2008-2018
2008 2009 2010 2011 2012 2013 2014 2015 2016 2017 2018
OECD countries
Australia 1,137,897 1,069,052 1,193,337 1,338,843 1,399,298 1,599,898 1,785,336 1,976,058 2,064,166 2,390,620 2,600,130
Austria (1) 12,546 14,063 15,217 14,764 16,306 18,253 19,171 20,569 20,852 22,323 21,426
Belgium (2) 11,407 13,799 13,308 15,631 17,245 19,732 22,701 24,191 29,041 53,729 48,942
Canada 1,695,338 1,798,780 2,057,715 2,194,566 2,312,776 2,558,780 2,837,836 3,080,413 3,192,968 3,414,719 3,443,410
Chile 46,750,900 59,785,152 69,523,450 70,377,419 77,543,241 85,366,585 100,479,815 109,433,421 116,428,629 129,511,362 134,344,716
Czech Republic 191,705 215,871 232,422 247,509 273,198 297,428 339,175 373,066 402,119 445,405 488,719
Denmark 2,647,974 2,744,949 3,104,432 3,341,040 3,600,384 3,578,733 4,014,761 4,088,260 4,315,576 4,479,933 4,414,208
Estonia 921 1,171 1,326 1,396 1,763 2,062 2,542 2,963 3,468 4,035 4,347
Finland (3) 131,609 148,962 164,091 99,484 107,277 115,520 122,605 122,077 127,946 135,395 132,705
France (4) 121,359 154,494 169,088 173,288 183,264 196,764 186,453 194,961 230,141 244,505 245,134
Germany 119,016 130,458 140,158 149,094 167,585 171,802 194,551 202,239 215,645 225,902 233,674
Greece (5) 34 45 53 73 86 979 1,089 1,135 1,190 1,338 1,384
Hungary (6) 2,567,247 3,412,000 3,964,528 1,060,484 1,111,079 1,187,403 1,306,716 1,381,292 2,067,519 2,269,810 2,238,570
Iceland 1,770,047 1,930,934 2,093,851 2,279,803 2,565,906 2,836,386 3,076,521 3,453,653 3,650,780 4,203,483 4,513,134
Ireland (7) 63,519 72,200 75,500 72,300 80,500 91,500 112,458 112,358 102,249 106,537 109,822
Israel 307,014 357,410 398,990 431,160 485,643 533,191 600,091 644,720 681,692 745,507 761,682
Italy (8) 63,535 74,754 84,944 92,656 106,894 118,453 134,164 142,363 156,757 167,473 172,766
Japan 145,320,700 144,509,300 142,913,700 143,302,000 147,516,400 151,860,300 160,292,700 162,629,000 156,933,900 156,872,000 155,177,900
Korea 78,508,318 102,070,391 183,224,206 221,428,750 267,016,396 308,971,434 359,370,815 402,537,382 440,368,061 477,033,829 508,742,853
Latvia 765 1,141 1,336 1,411 1,661 1,922 2,317 2,679 3,168 3,709 4,070
Lithuania .. .. 1,134 1,209 1,430 1,611 1,919 2,182 2,574 3,012 3,266
Luxembourg 390 844 799 832 902 959 1,484 1,444 1,574 1,619 1,618
Mexico 1,328,442 1,527,142 1,804,905 1,995,736 2,362,296 2,546,915 2,877,673 3,027,296 3,244,518 3,673,166 3,819,089
Netherlands 670,244 679,856 760,115 815,868 931,525 968,089 1,055,934 1,163,253 1,290,793 1,360,152 1,341,720
New Zealand 19,388 22,008 27,158 31,374 34,756 40,426 51,725 58,016 65,111 76,051 81,155
Norway (9) 153,541 175,191 194,170 201,427 219,759 248,723 277,737 301,388 318,069 345,665 347,717
Poland (10) 140,664 182,808 224,816 230,981 276,620 309,969 165,020 157,878 171,512 200,668 180,416
Portugal (11) 21,859 23,384 21,151 14,334 15,487 16,147 18,506 19,553 20,009 38,023 38,903
Slovak Republic 3,174 3,966 4,882 5,798 6,817 7,198 7,944 8,037 9,034 9,976 10,514
Slovenia 1,441 1,792 2,117 2,227 2,270 2,327 2,561 2,688 2,811 2,994 3,139
Spain 126,324 133,534 134,398 133,428 136,757 144,754 151,223 154,353 155,811 157,893 151,341
Sweden 1,849,722 1,723,061 1,878,842 2,219,149 2,454,476 2,566,420 2,968,332 3,158,088 3,527,589 4,148,846 4,214,482
Switzerland (12) 538,524 598,930 621,234 625,295 672,785 809,246 871,103 885,534 924,236 997,378 982,162
Turkey (13) 6,384 9,015 11,794 13,805 19,610 25,371 36,424 46,231 58,283 79,558 92,367
United Kingdom 968,752 1,124,262 1,289,071 1,444,019 1,603,292 1,706,682 1,784,104 1,850,276 2,119,834 2,218,985 2,212,683
United States 13,939,060 16,196,135 17,939,210 18,110,746 19,954,891 22,753,702 23,957,984 24,005,591 25,339,850 28,453,792 27,549,363
Selected other jurisdictions
Albania (14) 102 209 311 155 284 436 632 930 1,325 1,733 2,303
Armenia .. .. .. .. .. .. 12,145 31,540 63,323 105,831 158,965
Bolivia 26,255 31,278 37,657 .. .. .. .. .. .. .. ..
Botswana .. .. .. .. .. 58,700 .. .. .. 82,004 78,972
Brazil (15) 412,506 485,678 539,093 573,018 645,527 644,860 1,093,798 1,213,636 1,432,133 1,612,748 1,740,738
Bulgaria 2,303 3,173 3,996 4,598 5,709 6,821 8,185 9,394 10,824 12,742 13,463
China (People’s Republic
of)
191,100 253,300 280,900 357,000 482,100 603,500 768,900 952,600 1,107,500 1,288,000 1,477,000
Colombia 69,025,803 67,015,269 87,911,524 104,916,828 120,856,919 128,639,830 152,499,223 163,672,394 193,781,053 230,725,931 236,546,801
Costa Rica (16) 1,120,971 1,339,188 1,453,484 1,795,276 2,213,151 2,734,179 3,153,594 4,854,558 5,518,666 6,153,393 7,009,412
Croatia (17) 23,539 30,628 38,088 43,036 53,563 60,940 70,312 78,941 89,092 97,380 104,219
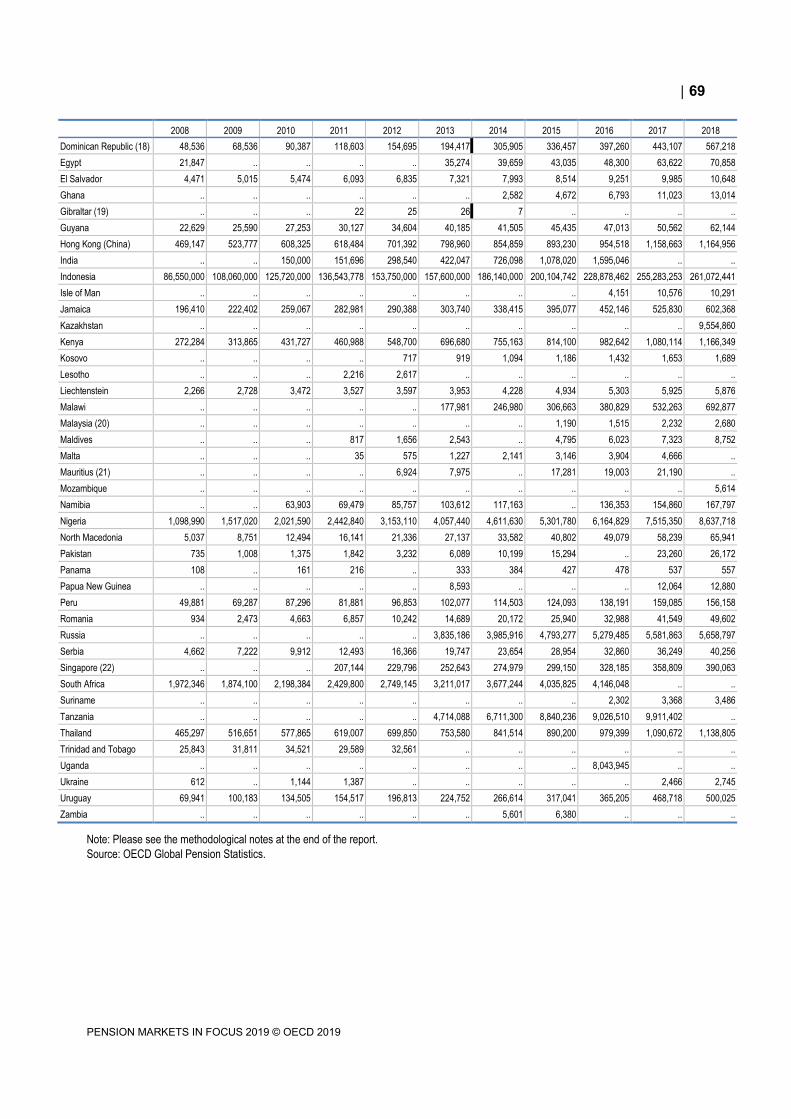
69
PENSION MARKETS IN FOCUS 2019 © OECD 2019
2008 2009 2010 2011 2012 2013 2014 2015 2016 2017 2018
Dominican Republic (18) 48,536 68,536 90,387 118,603 154,695 194,417 305,905 336,457 397,260 443,107 567,218
Egypt 21,847 .. .. .. .. 35,274 39,659 43,035 48,300 63,622 70,858
El Salvador 4,471 5,015 5,474 6,093 6,835 7,321 7,993 8,514 9,251 9,985 10,648
Ghana .. .. .. .. .. .. 2,582 4,672 6,793 11,023 13,014
Gibraltar (19) .. .. .. 22 25 26 7 .. .. .. ..
Guyana 22,629 25,590 27,253 30,127 34,604 40,185 41,505 45,435 47,013 50,562 62,144
Hong Kong (China) 469,147 523,777 608,325 618,484 701,392 798,960 854,859 893,230 954,518 1,158,663 1,164,956
India .. .. 150,000 151,696 298,540 422,047 726,098 1,078,020 1,595,046 .. ..
Indonesia 86,550,000 108,060,000 125,720,000 136,543,778 153,750,000 157,600,000 186,140,000 200,104,742 228,878,462 255,283,253 261,072,441
Isle of Man .. .. .. .. .. .. .. .. 4,151 10,576 10,291
Jamaica 196,410 222,402 259,067 282,981 290,388 303,740 338,415 395,077 452,146 525,830 602,368
Kazakhstan .. .. .. .. .. .. .. .. .. .. 9,554,860
Kenya 272,284 313,865 431,727 460,988 548,700 696,680 755,163 814,100 982,642 1,080,114 1,166,349
Kosovo .. .. .. .. 717 919 1,094 1,186 1,432 1,653 1,689
Lesotho .. .. .. 2,216 2,617 .. .. .. .. .. ..
Liechtenstein 2,266 2,728 3,472 3,527 3,597 3,953 4,228 4,934 5,303 5,925 5,876
Malawi .. .. .. .. .. 177,981 246,980 306,663 380,829 532,263 692,877
Malaysia (20) .. .. .. .. .. .. .. 1,190 1,515 2,232 2,680
Maldives .. .. .. 817 1,656 2,543 .. 4,795 6,023 7,323 8,752
Malta .. .. .. 35 575 1,227 2,141 3,146 3,904 4,666 ..
Mauritius (21) .. .. .. .. 6,924 7,975 .. 17,281 19,003 21,190 ..
Mozambique .. .. .. .. .. .. .. .. .. .. 5,614
Namibia .. .. 63,903 69,479 85,757 103,612 117,163 .. 136,353 154,860 167,797
Nigeria 1,098,990 1,517,020 2,021,590 2,442,840 3,153,110 4,057,440 4,611,630 5,301,780 6,164,829 7,515,350 8,637,718
North Macedonia 5,037 8,751 12,494 16,141 21,336 27,137 33,582 40,802 49,079 58,239 65,941
Pakistan 735 1,008 1,375 1,842 3,232 6,089 10,199 15,294 .. 23,260 26,172
Panama 108 .. 161 216 .. 333 384 427 478 537 557
Papua New Guinea .. .. .. .. .. 8,593 .. .. .. 12,064 12,880
Peru 49,881 69,287 87,296 81,881 96,853 102,077 114,503 124,093 138,191 159,085 156,158
Romania 934 2,473 4,663 6,857 10,242 14,689 20,172 25,940 32,988 41,549 49,602
Russia .. .. .. .. .. 3,835,186 3,985,916 4,793,277 5,279,485 5,581,863 5,658,797
Serbia 4,662 7,222 9,912 12,493 16,366 19,747 23,654 28,954 32,860 36,249 40,256
Singapore (22) .. .. .. 207,144 229,796 252,643 274,979 299,150 328,185 358,809 390,063
South Africa 1,972,346 1,874,100 2,198,384 2,429,800 2,749,145 3,211,017 3,677,244 4,035,825 4,146,048 .. ..
Suriname .. .. .. .. .. .. .. .. 2,302 3,368 3,486
Tanzania .. .. .. .. .. 4,714,088 6,711,300 8,840,236 9,026,510 9,911,402 ..
Thailand 465,297 516,651 577,865 619,007 699,850 753,580 841,514 890,200 979,399 1,090,672 1,138,805
Trinidad and Tobago 25,843 31,811 34,521 29,589 32,561 .. .. .. .. .. ..
Uganda .. .. .. .. .. .. .. .. 8,043,945 .. ..
Ukraine 612 .. 1,144 1,387 .. .. .. .. .. 2,466 2,745
Uruguay 69,941 100,183 134,505 154,517 196,813 224,752 266,614 317,041 365,205 468,718 500,025
Zambia .. .. .. .. .. .. 5,601 6,380 .. .. ..
Note: Please see the methodological notes at the end of the report.
Source: OECD Global Pension Statistics.

70
PENSION MARKETS IN FOCUS 2019 © OECD 2019
Table A B.2. Total assets in funded and private pension plans, in millions of USD, 2008-2018
2008 2009 2010 2011 2012 2013 2014 2015 2016 2017 2018
OECD countries
Australia 1,095,339 867,429 1,017,082 1,437,784 1,426,024 1,482,946 1,681,786 1,517,613 1,532,849 1,838,865 1,921,756
Austria (1) 17,460 20,259 20,333 19,103 21,514 25,173 23,276 22,393 21,980 26,772 24,533
Belgium (2) 15,875 19,879 17,783 20,225 22,753 27,213 27,561 26,337 30,612 64,437 56,038
Canada 1,391,903 1,711,494 2,068,887 2,157,882 2,324,632 2,405,772 2,446,199 2,225,732 2,378,020 2,721,976 2,524,309
Chile 74,313 118,052 148,437 134,962 162,021 162,988 165,432 154,711 174,480 210,512 193,110
Czech Republic 9,909 11,753 12,395 12,413 14,337 14,951 14,854 15,028 15,684 20,920 21,754
Denmark 501,045 528,882 553,049 581,495 636,211 661,173 655,857 598,574 611,895 721,674 677,088
Estonia 1,282 1,687 1,772 1,806 2,326 2,843 3,087 3,226 3,656 4,839 4,978
Finland (3) 183,160 214,595 219,258 128,723 141,541 159,314 148,855 132,905 134,867 162,380 151,947
France (4) 168,895 222,564 225,935 224,217 241,799 271,357 226,372 212,254 242,592 293,235 280,678
Germany 165,634 187,938 187,280 192,912 221,112 236,932 236,204 220,177 227,312 270,925 267,557
Greece (5) 47 65 71 95 113 1,350 1,322 1,236 1,254 1,605 1,584
Hungary (6) 13,662 18,142 19,001 4,406 5,029 5,506 5,043 4,819 7,040 8,770 7,968
Iceland 14,679 15,460 18,199 18,579 19,892 24,547 24,244 26,651 32,359 40,256 38,796
Ireland (7) 88,399 104,011 100,883 93,549 106,212 126,188 136,535 122,324 107,781 127,770 125,746
Israel 80,751 94,678 112,423 112,840 130,095 153,613 154,305 165,228 177,293 215,030 203,224
Italy (8) 88,422 107,690 113,502 119,887 141,035 163,359 162,889 154,991 165,238 200,850 197,817
Japan 1,601,330 1,569,730 1,754,619 1,843,824 1,704,407 1,442,168 1,328,686 1,349,618 1,343,612 1,389,477 1,400,143
Korea 62,333 87,652 161,459 192,246 249,408 292,753 326,909 343,315 364,634 445,618 455,985
Latvia 1,065 1,643 1,785 1,826 2,192 2,650 2,813 2,917 3,340 4,448 4,660
Lithuania .. .. 1,515 1,564 1,887 2,221 2,330 2,376 2,713 3,613 3,739
Luxembourg 542 1,215 1,067 1,076 1,190 1,323 1,801 1,572 1,659 1,941 1,853
Mexico 98,125 116,944 146,062 142,650 181,574 194,770 195,521 175,939 156,503 185,638 194,031
Netherlands 932,779 979,401 1,015,666 1,055,652 1,229,054 1,335,092 1,282,009 1,266,434 1,360,625 1,631,230 1,536,269
New Zealand 15,384 12,371 19,275 23,929 28,406 33,831 40,496 39,729 45,370 53,975 54,481
Norway (9) 21,934 30,310 33,135 33,627 39,454 40,908 37,380 34,210 36,899 42,103 40,013
Poland (10) 47,493 64,137 75,846 67,590 89,244 102,911 47,052 40,470 41,038 57,642 47,987
Portugal (11) 30,421 33,686 28,262 18,546 20,433 22,268 22,469 21,288 21,092 45,601 44,543
Slovak Republic 4,417 5,713 6,523 7,503 8,994 9,926 9,645 8,750 9,523 11,965 12,038
Slovenia 2,006 2,582 2,828 2,882 2,995 3,209 3,110 2,927 2,963 3,591 3,595
Spain 175,805 192,369 179,583 172,642 180,437 199,630 183,600 168,044 164,241 189,361 173,285
Sweden 236,822 242,122 280,019 322,190 377,350 399,517 383,674 374,146 389,264 505,464 470,566
Switzerland (12) 506,274 581,203 661,168 664,571 734,001 907,735 880,703 892,586 909,681 1,022,637 997,422
Turkey (13) 4,185 6,047 7,652 7,291 11,005 11,877 15,694 15,886 16,547 21,073 17,541
United Kingdom 1,412,247 1,820,742 2,018,041 2,232,598 2,529,995 2,810,564 2,784,630 2,741,924 2,607,820 2,998,182 2,809,112
United States 13,939,060 16,196,135 17,939,210 18,110,746 19,954,891 22,753,702 23,957,984 24,005,591 25,339,850 28,453,792 27,549,363
Selected other jurisdictions
Albania (14) 1 2 3 1 3 4 5 7 10 16 21
Armenia .. .. .. .. .. .. 26 65 131 219 329
Bolivia 3,740 4,456 5,387 .. .. .. .. .. .. .. ..
Botswana .. .. .. .. .. 6,731 .. .. .. 8,310 7,358
Brazil (15) 176,571 279,061 319,785 308,273 315,153 273,965 411,790 310,806 439,507 487,618 449,315
Bulgaria 1,660 2,326 2,714 3,042 3,848 4,807 5,089 5,248 5,834 7,813 7,881
China (People’s Republic
of)
27,961 37,096 42,413 56,659 76,650 98,896 125,658 146,746 159,357 197,801 215,526
Colombia 31,403 32,783 44,179 54,006 68,221 66,911 63,742 51,968 64,578 77,643 72,228
Costa Rica (16) 2,018 2,369 2,833 3,507 4,355 5,453 5,846 9,017 9,950 10,805 11,527
Croatia (17) 4,566 6,018 6,840 7,395 9,353 10,982 11,157 11,291 12,428 15,532 16,110
Dominican Republic (18) 1,371 1,897 2,408 3,055 3,829 4,543 6,897 7,386 8,505 9,174 11,282

71
PENSION MARKETS IN FOCUS 2019 © OECD 2019
2008 2009 2010 2011 2012 2013 2014 2015 2016 2017 2018
Egypt 3,969 .. .. .. .. 5,081 5,552 5,512 2,665 3,598 3,965
El Salvador 4,471 5,015 5,474 6,093 6,835 7,321 7,993 8,514 9,251 9,985 10,648
Ghana .. .. .. .. .. .. 808 1,231 1,617 2,496 2,700
Gibraltar (19) .. .. .. 35 39 42 11 .. .. .. ..
Guyana 110 126 134 148 169 195 201 220 228 245 298
Hong Kong (China) 60,531 67,536 78,246 79,645 90,496 103,045 110,226 115,248 123,100 148,280 148,705
India .. .. 3,347 2,848 5,450 6,819 11,465 16,253 23,472 .. ..
Indonesia 7,904 11,496 13,983 15,058 15,900 12,930 14,963 14,506 17,035 18,843 18,029
Isle of Man .. .. .. .. .. .. .. .. 5,106 14,290 13,065
Jamaica 2,448 2,490 3,026 3,276 3,137 2,864 2,958 3,292 3,537 4,230 4,750
Kazakhstan .. .. .. .. .. .. .. .. .. .. 24,869
Kenya 3,504 4,140 5,346 5,419 6,380 8,072 8,344 7,957 9,588 10,463 11,452
Kosovo .. .. .. .. 946 1,267 1,328 1,291 1,510 1,982 1,934
Lesotho .. .. .. 272 308 .. .. .. .. .. ..
Liechtenstein 2,131 2,647 3,696 3,748 3,925 4,434 4,275 4,974 5,219 6,075 5,968
Malawi .. .. .. .. .. 409 525 456 523 727 944
Malaysia (20) .. .. .. .. .. .. .. 277 338 549 648
Maldives .. .. .. 53 108 165 .. 311 392 475 568
Malta .. .. .. 45 759 1,692 2,599 3,425 4,116 5,596 ..
Mauritius (21) .. .. .. .. 227 265 .. 482 528 633 ..
Mozambique .. .. .. .. .. .. .. .. .. .. 91
Namibia .. .. 9,636 8,532 10,088 9,877 10,117 .. 10,008 12,496 11,628
Nigeria 8,290 10,142 13,418 15,435 20,042 25,801 27,178 26,913 20,213 24,560 28,136
North Macedonia 116 205 270 340 457 608 664 724 841 1,136 1,228
Pakistan 9 12 16 20 33 58 102 146 .. 211 189
Panama 108 .. 161 216 .. 333 384 427 478 537 557
Papua New Guinea .. .. .. .. .. 3,549 .. .. .. 3,734 3,825
Peru 15,888 23,979 31,083 30,371 37,982 36,521 38,360 36,386 41,177 49,078 46,283
Romania 330 842 1,455 2,053 3,051 4,513 5,471 6,254 7,666 10,677 12,176
Russia .. .. .. .. .. 117,179 70,850 65,767 87,038 96,907 81,456
Serbia 74 108 125 154 190 238 238 260 281 366 389
Singapore (22) .. .. .. 159,255 187,819 199,671 208,113 211,578 226,914 268,449 285,802
South Africa 211,966 253,943 331,501 298,395 323,385 306,107 317,525 259,622 302,975 .. ..
Suriname .. .. .. .. .. .. .. .. 310 452 467
Tanzania .. .. .. .. .. 2,986 3,889 4,115 4,155 4,444 ..
Thailand 13,333 15,506 19,165 19,532 22,847 22,965 25,529 24,667 27,334 33,373 35,094
Trinidad and Tobago 4,103 4,991 5,374 4,612 5,062 .. .. .. .. .. ..
Uganda .. .. .. .. .. .. .. .. 2,228 .. ..
Ukraine 80 .. 144 174 .. .. .. .. .. 88 98
Uruguay 2,872 5,104 6,694 7,765 10,146 10,508 10,957 10,613 12,483 16,295 15,438
Zambia .. .. .. .. .. .. 876 581 .. .. ..
Regional indicators (23)
Total OECD 23,002,998 26,188,578 29,170,007 30,163,830 32,963,563 36,492,279 37,620,322 37,091,919 38,682,285 43,998,164 42,515,512
Total selected non-OECD 591,529 774,291 958,858 1,099,435 1,237,192 1,367,807 1,521,711 1,374,533 1,652,626 1,566,202 1,562,979
Note: Please see the methodological notes at the end of the report.
Source: OECD Global Pension Statistics.

72
PENSION MARKETS IN FOCUS 2019 © OECD 2019
Table A B.3. Total assets in funded and private pension plans, as % of GDP, 2008-2018
2008 2009 2010 2011 2012 2013 2014 2015 2016 2017 2018
OECD countries
Australia 96.7 84.8 91.7 94.5 93.3 104.1 111.7 121.6 124.2 135.5 140.7
Austria (1) 4.3 4.9 5.1 4.8 5.1 5.6 5.8 6.0 5.9 6.0 5.5
Belgium (2) 3.2 4.0 3.6 4.1 4.5 5.0 5.7 5.9 6.8 12.2 10.9
Canada 102.3 114.5 123.5 123.7 126.6 134.5 142.3 154.8 157.4 159.5 155.2
Chile 49.8 61.8 62.3 57.7 59.7 61.9 67.6 68.6 68.7 71.9 70.2
Czech Republic 4.8 5.5 5.9 6.1 6.7 7.3 7.9 8.1 8.4 8.8 9.2
Denmark 147.0 159.4 171.4 180.9 190.0 185.5 202.6 200.8 205.5 205.7 198.6
Estonia 5.6 8.3 9.0 8.4 9.8 10.9 12.7 14.3 16.0 17.1 16.9
Finland (3) 67.9 82.3 87.7 50.5 53.7 56.8 59.7 58.1 59.2 60.5 57.2
France (4) 6.1 8.0 8.5 8.4 8.8 9.3 8.7 8.9 10.3 10.7 10.4
Germany 4.6 5.3 5.4 5.5 6.1 6.1 6.6 6.6 6.8 6.9 6.9
Greece (5) 0.0 0.0 0.0 0.0 0.0 0.5 0.6 0.6 0.7 0.7 0.7
Hungary (6) 9.4 12.9 14.6 3.7 3.9 3.9 4.0 4.0 5.8 5.9 5.3
Iceland 112.4 118.6 125.2 129.7 139.3 144.8 148.4 150.6 146.6 160.6 161.0
Ireland (7) 33.8 42.4 45.0 42.3 46.0 50.9 57.7 42.7 37.6 35.9 33.9
Israel 39.6 43.8 45.7 46.0 48.9 50.4 54.1 55.2 55.6 58.6 57.4
Italy (8) 3.9 4.8 5.3 5.7 6.6 7.4 8.3 8.6 9.3 9.7 9.8
Japan 27.9 29.5 28.6 29.2 29.8 30.2 31.2 30.6 29.3 28.8 28.3
Korea 7.1 8.9 14.5 16.6 19.4 21.6 24.2 25.7 26.8 27.6 28.5
Latvia 3.1 6.1 7.4 6.9 7.6 8.4 9.8 11.0 12.7 13.7 13.8
Lithuania .. .. 4.0 3.9 4.3 4.6 5.2 5.8 6.6 7.1 7.2
Luxembourg 1.0 2.3 2.0 1.9 2.0 2.1 3.0 2.8 3.0 2.9 2.7
Mexico 10.8 12.6 13.5 13.6 14.9 15.6 16.5 16.3 16.1 16.8 16.2
Netherlands 103.6 108.8 118.9 125.4 142.7 146.6 157.2 168.6 182.2 184.3 173.3
New Zealand 10.4 11.6 14.0 15.4 16.3 18.6 21.4 22.8 24.1 26.7 27.4
Norway (9) 5.9 7.2 7.5 7.2 7.4 8.1 8.8 9.7 10.2 10.5 9.8
Poland (10) 10.9 13.3 15.6 14.7 17.0 18.7 9.6 8.8 9.2 10.1 8.5
Portugal (11) 12.2 13.3 11.8 8.1 9.2 9.5 10.7 10.9 10.7 19.5 19.3
Slovak Republic 4.6 6.2 7.2 8.2 9.4 9.7 10.4 10.2 11.1 11.8 11.7
Slovenia 3.8 5.0 5.8 6.0 6.3 6.4 6.8 6.9 7.0 7.0 6.8
Spain 11.3 12.4 12.4 12.5 13.2 14.1 14.6 14.3 13.9 13.5 12.5
Sweden 54.5 52.3 53.3 60.6 66.5 68.0 75.3 75.2 80.4 90.6 88.0
Switzerland (12) 89.7 101.6 102.0 100.7 107.4 126.8 134.1 135.3 140.0 149.2 142.4
Turkey (13) 0.6 0.9 1.0 1.0 1.2 1.4 1.8 2.0 2.2 2.6 2.5
United Kingdom 61.3 73.1 81.2 87.8 94.6 96.9 96.7 97.6 107.6 108.3 104.5
United States 94.7 112.1 119.7 116.5 123.2 135.6 136.7 131.8 135.5 146.0 134.4
Selected other jurisdictions
Albania (14) 0.0 0.0 0.0 0.0 0.0 0.0 0.0 0.1 0.1 0.1 0.1
Armenia .. .. .. .. .. .. 0.3 0.6 1.2 1.9 2.6
Bolivia 22.4 26.9 28.7 .. .. .. .. .. .. .. ..
Botswana .. .. .. .. .. 46.9 .. .. .. 45.5 40.8
Brazil (15) 13.3 14.6 13.9 13.1 13.4 12.1 18.9 20.2 22.9 24.6 25.5
Bulgaria 3.2 4.3 5.3 5.7 7.0 8.3 9.8 10.6 11.5 12.6 12.5
China (People’s Republic of) 0.6 0.7 0.7 0.7 0.9 1.0 1.2 1.4 1.5 1.6 1.7
Colombia 14.5 13.4 16.2 17.0 18.1 18.0 20.0 20.3 22.4 25.1 24.0
Costa Rica (16) 7.0 7.6 7.4 8.4 9.5 11.0 11.6 16.6 17.7 18.6 20.2
Croatia (17) 6.8 9.2 11.6 12.9 16.2 18.4 21.2 23.2 25.4 26.6 27.3
Dominican Republic (18) 2.9 3.9 4.6 5.4 6.5 7.4 10.6 10.9 11.9 12.3 14.2
Egypt 2.3 .. .. .. .. 1.9 1.9 1.8 1.8 1.8 1.6

73
PENSION MARKETS IN FOCUS 2019 © OECD 2019
2008 2009 2010 2011 2012 2013 2014 2015 2016 2017 2018
El Salvador 24.9 28.5 29.7 30.0 32.0 33.3 35.4 36.3 38.3 40.1 40.9
Ghana .. .. .. .. .. .. 1.7 2.6 3.2 4.3 4.4
Gibraltar (19) .. .. .. 1.9 1.9 1.7 0.4 .. .. .. ..
Guyana 5.8 6.2 5.9 5.7 5.9 6.5 6.5 6.9 6.5 6.8 8.0
Hong Kong (China) 27.5 31.6 34.2 32.0 34.4 37.4 37.8 37.2 38.3 43.5 40.9
India .. .. 0.2 0.2 0.3 0.4 0.6 0.8 1.0 .. ..
Indonesia 1.6 1.8 1.8 1.7 1.8 1.7 1.8 1.7 1.8 1.9 1.8
Isle of Man .. .. .. .. .. .. .. .. 85.0 .. ..
Jamaica 19.7 20.9 22.5 22.8 22.1 21.2 22.0 23.8 25.7 27.7 30.2
Kazakhstan .. .. .. .. .. .. .. .. .. .. 16.3
Kenya 11.0 11.0 13.6 12.4 12.9 14.7 14.0 13.0 13.7 13.2 12.9
Kosovo .. .. .. .. 14.2 17.2 19.6 20.4 23.6 25.8 25.0
Lesotho .. .. .. 10.7 11.6 .. .. .. .. .. ..
Liechtenstein 37.2 50.3 59.2 62.6 63.6 66.7 69.3 81.8 86.6 95.6 ..
Malawi .. .. .. .. .. 8.8 9.6 9.6 9.7 11.7 13.7
Malaysia (20) .. .. .. .. .. .. .. 0.1 0.1 0.2 0.2
Maldives .. .. .. 2.0 3.7 5.0 .. 7.6 8.9 9.8 10.7
Malta .. .. .. 0.5 8.0 16.0 25.2 32.6 37.7 41.3 ..
Mauritius (21) .. .. .. .. 2.0 2.1 .. 4.2 4.4 4.6 ..
Mozambique .. .. .. .. .. .. .. .. .. .. 0.6
Namibia .. .. 77.4 77.1 80.2 84.4 84.4 .. 82.2 87.8 91.3
Nigeria 2.8 3.4 3.6 3.8 4.3 5.0 5.1 5.6 6.0 6.5 6.7
North Macedonia 1.2 2.1 2.9 3.5 4.6 5.4 6.4 7.3 8.3 9.4 10.0
Pakistan 0.0 0.0 0.0 0.0 0.0 0.0 0.0 0.1 .. 0.1 0.1
Panama 0.4 .. 0.5 0.6 .. 0.7 0.8 0.8 0.8 0.9 0.9
Papua New Guinea .. .. .. .. .. 18.0 .. .. .. 18.4 18.2
Peru 14.0 19.0 20.8 17.4 19.0 18.7 19.9 20.3 21.1 22.8 21.1
Romania 0.2 0.5 0.9 1.2 1.7 2.3 3.0 3.6 4.3 4.8 5.2
Russia .. .. .. .. .. 5.3 5.1 5.8 6.1 6.1 5.5
Serbia 0.2 0.2 0.3 0.3 0.4 0.5 0.6 0.7 0.7 0.8 0.8
Singapore (22) .. .. .. 59.5 63.1 66.2 69.3 71.0 75.0 77.2 80.1
South Africa 83.3 74.7 80.0 80.4 84.5 90.7 96.6 99.7 95.1 .. ..
Suriname .. .. .. .. .. .. .. .. 11.7 14.7 13.6
Tanzania .. .. .. .. .. 6.5 8.1 9.4 8.3 8.3 ..
Thailand 4.8 5.3 5.3 5.5 5.7 5.8 6.4 6.5 6.7 7.1 7.0
Trinidad and Tobago 14.6 25.8 24.0 17.9 19.7 .. .. .. .. .. ..
Uganda .. .. .. .. .. .. .. .. 9.2 .. ..
Ukraine 0.1 .. 0.1 0.1 .. .. .. .. .. 0.1 0.1
Uruguay 11.0 14.0 16.6 16.7 18.9 19.1 20.0 21.8 23.0 27.6 27.1
Zambia .. .. .. .. .. .. 3.4 3.5 .. .. ..
Note: Please see the methodological notes at the end of the report.
Source: OECD Global Pension Statistics.

74
PENSION MARKETS IN FOCUS 2019 © OECD 2019
Table A B.4. Contributions into funded and private pension plans, 2008-2018
As a percentage of GDP
2008 2009 2010 2011 2012 2013 2014 2015 2016 2017 2018
Selected OECD countries
Australia 10.0 8.4 7.7 7.5 7.9 7.2 7.5 8.4 8.1 8.9 8.0
Austria (1) 0.4 0.4 0.4 .. .. 0.5 0.6 0.3 0.3 0.3 0.3
Belgium (2) 0.4 0.4 0.4 0.4 0.3 0.3 0.3 0.3 0.3 0.4 0.4
Canada (3) 2.2 3.1 2.9 2.8 3.1 2.9 2.8 2.9 2.9 2.8 2.8
Chile (4) 3.3 3.7 3.6 3.6 3.7 3.9 3.9 4.0 4.0 4.0 4.1
Czech Republic (5) .. .. .. .. .. 1.2 1.1 1.1 1.1 1.0 1.0
Denmark (6) 6.5 6.5 6.7 6.9 7.0 7.1 7.0 7.2 7.7 8.0 8.2
Estonia (7) 1.4 0.8 0.3 0.7 1.3 1.4 1.8 1.9 1.9 1.9 1.7
Finland .. .. .. 1.5 1.5 1.4 1.4 1.3 1.3 1.4 1.4
France (8) 0.6 0.7 0.5 0.5 0.6 0.6 0.6 0.6 0.6 0.6 ..
Germany 0.3 0.4 0.5 0.3 0.3 0.3 0.3 0.3 0.3 0.3 0.5
Greece (9) 0.0 0.0 0.0 0.0 0.0 0.1 0.1 .. .. .. ..
Hungary (10) 1.4 1.7 1.3 0.3 0.3 0.3 0.3 0.3 0.3 0.3 0.3
Iceland (11) 7.7 7.3 7.4 6.8 6.7 6.6 6.6 6.9 7.4 11.5 9.8
Israel 1.9 2.0 2.1 2.3 2.4 2.7 2.9 3.0 .. .. ..
Italy 0.7 0.7 0.7 0.7 0.7 0.8 0.8 0.8 0.8 0.9 0.9
Korea (12) .. .. .. 2.1 3.7 3.9 5.3 5.3 5.3 5.0 5.2
Latvia .. 2.4 2.0 1.9 1.7 1.9 2.3 2.7 3.1 3.8 3.2
Lithuania .. .. 0.4 0.4 0.3 0.4 0.5 0.6 0.8 0.8 0.9
Luxembourg 0.2 1.2 0.9 0.2 0.2 0.3 0.9 0.3 0.3 0.3 0.4
Mexico 1.2 1.0 1.0 1.0 1.0 1.0 1.1 1.1 1.0 1.0 1.0
Netherlands 4.2 4.8 4.5 4.7 5.0 5.2 5.0 4.1 4.1 4.4 4.1
New Zealand (13) .. 1.1 1.4 1.4 1.5 1.4 1.7 1.9 1.9 2.0 2.0
Norway (14) 0.6 0.5 0.4 0.4 0.5 0.4 0.5 0.5 0.5 0.4 0.4
Poland (15) 1.7 1.6 1.7 1.1 0.5 0.8 0.6 0.3 0.3 0.3 0.3
Portugal (16) 1.5 0.7 0.5 0.7 0.6 0.4 1.2 0.8 0.7 2.1 2.2
Slovak Republic (17) .. .. 1.5 1.3 1.3 0.8 0.8 0.8 0.9 0.9 1.0
Slovenia 0.7 0.8 0.8 0.8 0.8 0.6 0.5 0.5 0.5 0.6 0.6
Spain (18) 0.7 0.7 0.8 0.5 0.5 0.5 0.5 0.5 0.5 0.5 0.5
Switzerland (19) 7.7 7.6 7.7 7.6 7.7 8.5 8.3 8.2 8.2 8.2 8.3
Turkey (20) 0.5 0.7 0.8 .. 1.0 0.4 0.4 .. .. .. ..
United Kingdom 2.2 2.5 2.9 2.7 2.9 2.7 2.2 2.1 2.4 2.5 ..
United States (21) 5.1 5.1 5.2 5.0 5.0 5.2 5.2 5.2 5.3 .. ..
Selected other jurisdictions
Albania 0.0 0.0 0.0 0.0 0.0 0.0 0.0 0.0 0.0 0.0 0.0
Armenia .. .. .. .. .. .. 0.3 0.4 0.4 0.6 0.8
Botswana .. .. .. .. .. 2.0 .. .. .. .. ..
Brazil (22) 0.3 0.3 0.4 0.4 .. 0.4 0.4 0.4 0.4 0.4 ..
Bulgaria 1.0 1.0 0.9 1.0 1.0 1.1 1.2 1.4 1.4 1.4 1.4
Colombia .. .. .. .. .. .. .. .. .. .. 2.1
Costa Rica (23) 1.2 1.2 1.2 1.1 1.2 1.2 1.2 1.6 1.4 1.4 1.6
Croatia (24) .. .. .. .. .. .. 1.6 1.6 1.8 1.7 1.9
Dominican Republic .. .. .. .. .. .. .. .. .. 7.1 7.5
Egypt 0.3 .. .. .. .. .. .. .. 0.2 0.2 0.2
Ghana .. .. .. .. .. .. 1.3 2.0 .. .. ..
Gibraltar (25) .. .. .. 0.2 0.2 0.2 0.0 .. .. .. ..
Guyana .. .. .. .. .. .. .. 0.4 0.2 0.2 ..

75
PENSION MARKETS IN FOCUS 2019 © OECD 2019
2008 2009 2010 2011 2012 2013 2014 2015 2016 2017 2018
Hong Kong (China) 2.9 3.6 3.1 3.0 3.2 3.4 3.4 3.6 3.9 3.4 3.3
India .. .. .. 0.2 0.1 .. .. .. .. .. ..
Indonesia .. .. .. 0.1 .. .. .. 0.2 0.2 0.2 0.2
Kazakhstan .. .. .. .. .. .. .. .. .. .. 1.4
Kenya 1.1 1.0 1.2 1.2 .. 1.3 1.2 .. 1.1 .. ..
Kosovo .. .. .. .. 2.3 2.2 2.4 .. 2.5 .. ..
Liechtenstein 3.5 3.9 5.5 6.2 6.3 6.5 5.9 9.2 6.3 7.1 ..
Malawi .. .. .. .. .. .. 1.2 1.3 1.2 1.4 1.9
Malaysia (26) .. .. .. .. .. .. .. 0.1 0.1 0.2 0.2
Maldives .. .. .. 1.5 1.6 1.5 .. 1.4 1.4 .. ..
Malta .. .. .. 0.5 7.9 10.1 12.1 11.8 11.5 10.1 ..
Mauritius (27) .. .. .. .. 0.2 0.3 .. .. 0.6 0.3 ..
Mozambique .. .. .. .. .. .. .. .. .. .. 0.1
Namibia .. .. 3.6 3.5 3.6 3.6 4.1 .. 4.1 .. ..
Nigeria 0.8 0.7 1.6 0.6 0.7 0.6 .. 0.8 0.6 0.6 0.6
North Macedonia 0.6 0.7 0.7 0.8 0.8 0.8 0.9 1.0 1.0 1.1 1.1
Pakistan 0.0 0.0 0.0 0.0 0.0 0.0 0.0 .. .. .. 0.0
Panama .. .. .. .. .. .. .. .. 0.1 .. ..
Papua New Guinea .. .. .. .. .. 1.9 .. .. .. .. ..
Peru 1.3 1.3 1.2 1.2 1.3 1.4 1.4 1.5 1.4 1.4 1.7
Romania 0.2 0.3 0.3 0.4 0.5 0.5 0.6 0.7 0.8 0.9 0.8
Russia .. .. .. 0.1 .. 0.1 .. 0.1 0.1 0.1 0.1
Serbia .. 0.1 0.1 0.1 0.1 0.1 0.1 0.1 0.1 0.1 0.1
South Africa (28) 4.3 4.5 4.7 4.7 4.9 4.9 5.1 5.3 5.2 5.1 ..
Suriname .. .. .. .. .. .. .. .. 0.5 .. ..
Tanzania .. .. .. .. .. 2.2 2.4 1.7 2.2 1.8 ..
Thailand 0.9 0.7 0.6 0.7 0.7 0.7 0.8 0.8 0.9 0.9 0.9
Trinidad and Tobago .. 0.6 .. 0.5 0.6 .. .. .. .. .. ..
Ukraine 0.1 .. 0.1 0.0 .. .. .. .. .. .. ..
Uruguay .. .. .. .. .. .. .. .. 1.9 1.4 1.9
Zambia .. .. .. .. .. .. 0.4 0.4 .. .. ..
Note: Please see the methodological notes at the end of the report.
Source: OECD Global Pension Statistics.

76
PENSION MARKETS IN FOCUS 2019 © OECD 2019
Table A B.5. Total benefits paid by funded and private pension plans, 2008-2018
As a percentage of GDP
2008 2009 2010 2011 2012 2013 2014 2015 2016 2017 2018
Selected OECD countries
Australia 5.6 4.6 4.5 4.5 4.7 5.0 5.3 5.9 6.0 6.8 6.4
Austria (1) 0.2 0.2 0.2 .. .. 0.3 0.3 0.3 0.2 0.2 0.2
Belgium (2) 0.3 0.3 0.2 0.3 0.2 0.2 0.2 0.2 0.2 0.2 0.2
Canada (3) 2.6 2.9 2.8 2.8 2.9 3.0 3.1 3.5 3.8 3.4 3.4
Chile (4) 0.9 0.8 0.9 1.1 1.0 1.0 0.9 1.0 1.1 1.1 1.1
Czech Republic 0.3 0.4 0.4 0.5 0.6 0.3 0.3 0.3 0.4 0.5 0.4
Denmark (5) 4.4 4.7 4.9 5.4 5.5 6.4 7.1 5.5 4.8 5.4 6.1
Estonia (6) .. 0.0 0.0 0.0 0.0 0.0 0.0 0.0 0.0 0.0 0.0
Finland (7) .. .. .. 1.3 1.3 1.4 1.4 1.3 1.5 1.5 1.5
France (8) 0.3 0.3 0.3 0.2 0.3 0.3 0.3 0.3 0.3 0.3 ..
Germany 0.1 0.3 0.2 0.2 0.2 0.2 0.2 0.2 0.2 0.2 0.2
Greece (9) 0.0 0.0 0.0 0.0 0.0 0.0 0.1 .. .. .. ..
Hungary (7) 0.2 0.2 0.2 0.2 0.2 0.1 0.1 0.1 0.1 0.1 0.1
Iceland (10) 3.6 5.9 5.0 5.8 5.2 5.0 5.4 5.1 7.2 5.7 5.8
Israel 1.6 1.6 1.6 1.6 1.6 1.6 1.7 1.7 .. .. ..
Italy (11) 0.3 0.2 0.2 0.2 0.3 0.3 0.3 0.4 0.3 0.4 0.4
Korea (5) 0.7 1.0 1.3 1.3 1.7 2.3 2.9 3.2 3.3 3.3 3.7
Latvia .. 0.1 0.0 0.0 0.1 0.1 0.1 0.1 0.1 0.1 0.1
Lithuania .. .. 0.0 0.0 0.0 0.0 0.0 0.1 0.1 0.1 0.1
Luxembourg 0.0 0.1 0.1 0.1 0.1 0.1 0.2 0.2 0.2 0.2 0.2
Mexico 0.2 0.3 0.3 0.3 0.3 0.4 0.5 0.5 0.4 0.4 0.5
Netherlands 3.3 3.6 3.7 3.9 4.0 4.0 4.1 4.0 4.1 4.0 ..
New Zealand 1.4 1.9 1.3 1.3 1.4 1.7 .. .. .. .. ..
Norway (7) 0.2 0.3 0.2 0.1 0.1 0.2 0.2 0.2 0.2 0.2 0.2
Poland .. 0.0 0.0 0.0 0.0 0.0 0.0 0.0 0.0 0.0 0.0
Portugal (12) 1.3 1.0 0.7 0.8 0.4 0.4 0.4 0.4 0.5 1.4 1.3
Slovak Republic .. .. 0.2 0.2 0.2 0.2 0.2 0.1 0.1 0.1 0.1
Slovenia 0.0 0.0 0.0 0.5 0.9 0.5 0.4 0.4 0.5 0.3 0.2
Spain (13) 0.6 0.6 0.6 0.7 0.7 0.6 0.6 0.6 0.6 0.6 0.6
Sweden .. .. .. 1.4 1.5 1.6 .. .. .. .. ..
Switzerland (7) 4.7 5.0 4.6 4.6 4.7 4.7 4.8 4.9 5.1 5.2 5.3
Turkey (14) .. 0.0 .. 0.0 .. .. 0.0 .. .. .. 0.1
United Kingdom 2.6 2.9 3.0 3.0 3.0 3.1 2.8 2.8 2.8 2.7 ..
United States (15) 6.8 6.5 7.3 6.8 7.4 7.8 7.9 8.0 7.8 .. ..
Selected other jurisdictions
Albania .. .. .. 0.0 0.0 0.0 0.0 0.0 0.0 0.0 0.0
Armenia .. .. .. .. .. .. 0.0 0.0 0.0 0.0 0.2
Botswana .. .. .. .. .. 2.3 .. .. .. .. ..
Brazil (16) .. .. .. .. .. 0.6 0.6 0.7 0.7 0.9 0.8
Bulgaria 0.2 0.1 0.1 0.1 0.1 0.1 0.1 0.1 0.1 0.1 0.1
Costa Rica (17) 0.2 0.1 0.1 0.1 0.1 0.1 0.2 0.4 0.4 0.5 0.5
Croatia .. .. .. .. .. .. .. .. .. .. 0.0
Dominican Republic .. .. .. .. .. .. 0.1 .. .. .. 0.4
Egypt 0.3 .. .. .. .. .. .. .. 0.2 0.2 0.2
Ghana .. .. .. .. .. .. .. .. .. .. 0.1
Gibraltar (18) .. .. .. 0.1 0.0 0.3 0.0 .. .. .. ..
Guyana .. .. .. .. .. .. .. 0.2 0.1 0.2 0.1

77
PENSION MARKETS IN FOCUS 2019 © OECD 2019
2008 2009 2010 2011 2012 2013 2014 2015 2016 2017 2018
Hong Kong (China) (19) 0.4 0.4 0.5 0.5 0.6 0.7 0.8 0.9 0.9 0.9 0.9
Indonesia .. .. .. 0.1 .. .. .. 0.1 0.2 0.2 0.2
Kazakhstan .. .. .. .. .. .. .. .. .. .. 0.2
Kenya 0.2 0.1 0.8 0.4 .. 0.6 0.6 .. .. .. ..
Kosovo .. .. .. .. .. 0.2 0.3 0.3 0.3 .. ..
Liechtenstein 3.6 4.3 5.8 6.1 3.0 2.8 2.6 2.5 2.9 3.0 ..
Malawi .. .. .. .. .. .. 0.4 0.8 0.5 0.3 0.9
Maldives .. .. .. 0.0 0.0 0.1 .. 0.1 0.1 .. ..
Malta .. .. .. 0.0 0.3 0.9 1.4 1.4 2.2 2.5 ..
Mauritius (20) .. .. .. .. 0.1 0.2 .. .. 0.2 0.2 ..
Mozambique .. .. .. .. .. .. .. .. .. .. 0.0
Namibia .. .. 3.1 2.6 2.7 3.2 3.3 .. .. .. ..
Nigeria 0.1 0.1 0.1 0.3 0.2 0.4 .. 0.5 0.6 0.7 0.2
North Macedonia 0.0 0.0 0.0 0.0 0.0 0.0 0.0 0.0 0.0 0.0 0.0
Pakistan .. .. .. .. .. 0.0 0.0 .. .. .. 0.0
Panama .. .. .. .. .. .. .. .. 1.0 .. ..
Papua New Guinea .. .. .. .. .. 1.3 .. .. .. .. ..
Peru (4) 0.1 0.2 0.2 0.2 0.2 0.2 0.2 .. 0.9 0.9 1.2
Romania .. 0.0 .. 0.0 0.0 0.0 0.0 0.0 0.0 0.0 0.0
Russia .. .. .. 0.1 .. 0.1 .. 0.1 0.1 0.1 0.1
Serbia .. 0.0 0.0 0.0 0.0 0.0 0.0 0.0 0.0 0.0 0.0
South Africa (21) .. 3.3 3.0 2.9 3.0 3.0 3.5 3.7 4.2 4.0 ..
Suriname .. .. .. .. .. .. .. .. 0.3 .. ..
Tanzania .. .. .. .. .. 1.4 1.7 .. 1.6 1.3 ..
Thailand .. 0.1 0.2 0.2 0.2 0.2 0.2 0.2 0.2 0.2 0.2
Trinidad and Tobago .. 0.8 .. 0.5 0.5 .. .. .. .. .. ..
Ukraine 0.0 .. 0.0 0.0 .. .. .. .. .. .. ..
Zambia .. .. .. .. .. .. 0.3 0.4 .. .. ..
Note: Please see the methodological notes at the end of the report.
Source: OECD Global Pension Statistics.

78
PENSION MARKETS IN FOCUS 2019 © OECD 2019
Table A B.6. Annual nominal investment rates of return of all funded and private pension plans, 2008-2018
In per cent
2008 2009 2010 2011 2012 2013 2014 2015 2016 2017 2018
OECD countries
Australia -7.5 -8.9 8.9 9.0 1.9 12.9 12.2 9.4 4.4 10.2 7.8
Austria (1) -13.3 8.4 6.1 -3.0 8.4 4.9 7.3 2.2 4.0 5.9 -5.3
Belgium (2) -20.2 13.7 7.7 -1.3 11.7 6.8 10.3 4.2 5.6 5.3 -3.2
Canada (3) -9.6 12.0 9.4 3.9 8.0 8.9 9.8 6.9 5.6 7.8 2.7
Chile (4) -18.7 20.3 11.5 -1.8 6.6 6.7 13.1 5.9 4.2 8.0 1.5
Czech Republic 2.1 0.4 3.0 3.0 2.6 1.6 1.3 1.0 0.8 0.5 0.4
Denmark (5) -0.8 6.0 9.4 9.2 8.6 1.4 11.8 2.2 6.4 4.9 -0.5
Estonia (6) -27.7 15.1 9.6 -4.6 8.8 3.1 5.0 2.1 3.3 3.3 -2.3
Finland (7) .. .. .. .. 7.7 7.7 6.7 5.0 5.1 7.2 -1.5
France (8) .. .. .. .. .. .. .. .. .. 4.3 ..
Germany 1.6 4.8 4.9 3.0 4.8 4.3 4.6 3.4 3.8 3.8 1.9
Greece 4.4 2.9 -3.1 -3.3 5.9 .. 3.8 4.5 4.2 7.6 -0.8
Hungary (7) -19.0 19.1 9.0 .. 13.2 7.4 8.6 4.6 6.6 6.9 -1.7
Iceland (7) -9.3 8.4 3.7 7.5 11.4 9.1 8.0 9.6 1.6 7.3 5.6
Ireland (7) -35.0 .. .. .. .. .. .. 4.6 8.1 6.7 -5.2
Israel (9) -13.1 24.8 9.8 -2.2 9.6 10.4 5.6 3.3 3.6 7.6 0.6
Italy (7,10) -3.2 6.4 3.1 0.4 6.4 4.5 5.7 1.8 2.5 2.9 -1.7
Japan (11) .. .. .. .. .. .. .. .. .. 3.4 4.4
Korea 2.5 8.2 5.1 3.5 3.4 3.2 4.1 3.7 3.4 3.4 3.3
Latvia -12.8 12.9 7.9 -2.1 8.3 2.3 5.3 1.7 2.2 3.0 -4.4
Lithuania .. .. .. -3.5 10.2 3.9 7.3 4.5 4.4 4.2 -4.3
Luxembourg -10.4 8.4 3.5 0.9 8.5 3.3 7.7 1.7 4.2 2.6 -3.4
Mexico (12) -1.8 11.4 11.2 5.0 13.6 2.5 8.9 1.3 2.9 8.4 -0.3
Netherlands -15.7 12.8 11.0 6.8 12.7 3.3 15.9 1.6 9.7 5.5 -1.2
New Zealand -2.3 -6.8 12.8 7.7 3.2 10.5 .. .. .. .. ..
Norway (7) -8.7 12.0 8.4 0.0 7.5 10.1 7.2 4.3 5.5 7.9 -0.1
Poland (7) -14.7 13.0 10.5 -4.9 4.0 3.4 .. -6.7 9.3 17.0 -10.0
Portugal (7) -12.5 11.5 -0.5 -3.9 7.8 5.1 6.6 2.5 1.5 4.7 -1.1
Slovak Republic -5.0 1.5 1.3 0.5 3.7 1.5 3.7 0.3 2.6 2.2 0.0
Slovenia 6.2 9.2 5.2 1.6 7.2 3.4 9.8 5.7 7.5 2.6 -0.5
Spain (13) -6.6 7.2 1.2 0.6 6.4 7.7 6.4 2.1 2.6 3.3 -3.1
Sweden (7) .. .. .. 1.3 7.8 6.8 10.3 2.8 6.5 .. ..
Switzerland (7) -13.2 10.2 3.3 -0.1 7.1 6.0 6.9 0.7 3.9 7.3 -3.0
Turkey (12,14) 11.1 25.3 8.4 -1.0 16.4 -0.8 14.2 2.2 10.8 13.2 9.0
United Kingdom -13.3 16.7 15.3 12.9 11.8 7.5 5.7 4.9 14.7 5.6 ..
United States (7) -26.5 12.5 7.1 -1.2 7.1 12.1 4.0 -1.5 4.7 9.7 -4.9
Selected other jurisdictions
Albania 7.0 8.4 9.5 4.6 5.7 5.6 5.0 5.3 5.0 4.4 3.9
Armenia .. .. .. .. .. .. 2.8 6.2 9.2 9.5 4.0
Bolivia 9.7 10.0 8.1 .. .. .. .. .. .. .. ..
Botswana .. .. .. .. .. .. .. .. .. 12.0 ..
Brazil .. .. .. .. .. .. .. .. .. .. 5.9
Bulgaria -23.9 8.5 5.0 -0.3 7.3 4.6 5.8 1.5 5.0 6.8 -3.5
Colombia 5.0 26.8 25.4 -0.1 17.9 -0.3 10.4 2.9 9.4 13.2 0.2
Costa Rica (12) 2.4 9.1 7.0 9.1 10.5 11.8 7.5 11.4 7.2 6.4 5.7
Croatia .. .. .. .. .. .. 9.4 10.6 7.8 2.4 1.1

79
PENSION MARKETS IN FOCUS 2019 © OECD 2019
2008 2009 2010 2011 2012 2013 2014 2015 2016 2017 2018
Dominican Republic 12.1 14.0 10.8 12.5 14.3 13.2 12.0 10.7 10.7 10.8 7.8
Egypt .. .. .. .. .. .. .. .. 10.8 12.1 12.5
El Salvador 3.1 5.4 4.6 2.8 5.2 2.3 3.4 2.3 2.3 4.7 4.2
Ghana .. .. .. .. .. .. 21.0 24.0 20.0 .. ..
Gibraltar .. .. .. .. 2.1 2.5 .. .. .. .. ..
Guyana .. .. .. .. .. .. .. 0.8 1.2 4.6 4.4
Hong Kong (China) (15) .. 26.6 7.8 -11.3 12.4 7.4 1.5 -3.6 0.9 22.3 -9.3
India .. .. .. 3.7 11.2 2.8 17.7 6.4 .. .. ..
Indonesia .. .. .. 4.4 11.3 2.5 15.6 6.2 11.1 11.3 3.8
Kenya 8.6 6.4 17.5 -9.9 .. 17.6 13.1 .. 7.3 10.0 ..
Kosovo .. .. .. .. .. 8.1 6.3 2.0 4.5 6.2 -5.6
Liechtenstein -7.8 9.8 3.3 -2.0 -2.0 6.8 4.7 6.2 3.3 6.8 -4.2
Malawi .. .. .. .. .. 36.0 24.2 15.2 14.2 26.1 20.7
Maldives (16) .. .. .. .. .. 14.4 .. 8.6 6.1 5.0 5.2
Malta .. .. .. -0.2 0.6 0.8 0.4 -1.3 6.1 4.7 ..
Mauritius (17) .. .. .. .. .. .. .. 6.4 0.9 .. ..
Namibia .. .. .. 12.7 14.4 16.5 9.6 .. 2.5 8.4 ..
Nigeria .. .. 10.8 3.4 11.9 12.8 8.0 9.1 11.8 15.4 9.3
North Macedonia -10.6 14.2 7.0 1.8 7.9 7.9 6.6 5.5 5.8 5.3 1.1
Pakistan -9.3 10.9 11.5 8.5 18.5 21.4 20.2 12.8 .. -6.1 -0.7
Panama .. .. .. 6.7 6.0 5.8 3.7 4.5 5.8 5.9 ..
Papua New Guinea .. .. .. .. .. .. .. .. .. 10.6 4.3
Peru -25.2 27.1 19.8 -10.0 12.0 0.5 7.1 4.2 9.1 6.6 -2.4
Romania 19.5 16.4 15.1 2.9 10.4 10.6 8.7 4.1 4.5 4.5 1.4
Russia .. .. .. .. .. 6.2 3.1 10.6 11.0 5.0 2.8
Serbia -6.3 13.9 7.4 5.6 11.6 11.0 10.7 15.2 7.4 6.5 6.6
South Africa (18) 3.8 3.6 12.4 9.0 11.1 15.6 14.7 9.0 6.0 5.8 4.9
Suriname .. .. .. .. .. .. .. .. 26.4 8.7 5.0
Tanzania .. .. .. .. .. .. .. 13.5 5.1 .. ..
Thailand .. 6.4 2.1 2.8 7.9 1.9 5.8 0.9 4.6 5.3 -1.4
Trinidad and Tobago .. 7.5 .. 8.2 10.8 .. .. .. .. .. ..
Ukraine .. .. 17.2 10.4 .. .. .. .. .. 17.3 14.3
Uruguay -14.3 37.7 25.2 17.4 20.3 11.9 12.7 10.7 9.1 20.8 7.8
Zambia .. .. .. .. .. .. 14.0 14.7 .. .. ..
Note: Please see the methodological notes at the end of the report.
Source: OECD Global Pension Statistics.

80
PENSION MARKETS IN FOCUS 2019 © OECD 2019
Table A B.7. Annual real investment rates of return of all funded and private pension plans, 2008-2018
In per cent
2008 2009 2010 2011 2012 2013 2014 2015 2016 2017 2018
OECD countries
Australia -11.4 -10.2 5.6 5.3 0.6 10.3 8.9 7.8 3.3 8.1 5.6
Austria (1) -14.4 7.3 3.7 -6.0 5.5 2.9 6.2 1.2 2.6 3.7 -7.1
Belgium (2) -22.3 13.4 4.4 -4.6 9.2 5.8 10.7 2.6 3.5 3.1 -5.4
Canada (3) -10.7 10.5 6.9 1.6 7.1 7.5 8.2 5.2 4.0 5.8 0.7
Chile (4) -24.1 23.5 8.3 -6.0 5.1 3.6 8.0 1.5 1.5 5.6 -1.0
Czech Republic -1.6 -0.6 0.7 0.6 0.2 0.2 1.2 1.0 -1.2 -1.8 -1.6
Denmark (5) -3.1 4.5 6.4 6.6 6.4 0.6 11.3 1.8 5.9 3.9 -1.3
Estonia (6) -32.4 17.1 3.7 -8.0 5.2 1.7 5.5 3.0 1.0 -0.1 -5.5
Finland (7) .. .. .. .. 5.2 6.0 6.2 5.3 4.0 6.7 -2.6
France (8) .. .. .. .. .. .. .. .. .. 3.1 ..
Germany 0.5 3.9 3.6 1.0 2.7 2.8 4.4 3.2 2.3 2.3 0.4
Greece 2.3 0.3 -7.8 -5.6 5.0 .. 6.5 4.7 4.2 6.9 -1.4
Hungary (7) -21.7 12.8 4.2 .. 7.8 7.0 9.6 3.7 4.8 4.7 -4.3
Iceland (7) -23.2 0.9 1.2 2.1 6.9 4.8 7.1 7.5 -0.3 5.3 1.8
Ireland (7) -35.7 .. .. .. .. .. .. 4.5 8.1 6.3 -5.9
Israel (9) -16.3 20.2 6.8 -4.2 7.9 8.3 5.8 4.3 3.8 7.2 -0.2
Italy (7,10) -5.3 5.3 1.2 -2.8 4.0 3.9 5.7 1.7 2.0 2.0 -2.8
Japan (11) .. .. .. .. .. .. .. .. .. 3.2 3.3
Korea -1.5 5.2 2.0 -0.6 2.0 2.0 3.2 2.5 2.0 2.0 2.0
Latvia -21.1 14.3 5.2 -5.9 6.6 2.7 5.1 1.4 0.0 0.8 -6.7
Lithuania .. .. .. -6.6 7.2 3.5 7.5 4.6 2.6 0.3 -6.0
Luxembourg -11.4 6.5 0.7 -2.3 6.0 1.7 8.3 0.6 3.0 1.2 -5.2
Mexico (12) -7.8 7.5 6.6 1.2 9.7 -1.5 4.7 -0.8 -0.4 1.5 -4.9
Netherlands -17.3 11.5 8.9 4.3 9.5 1.6 15.1 0.9 8.6 4.2 -3.1
New Zealand -5.5 -9.5 10.5 3.1 1.6 9.5 .. .. .. .. ..
Norway (7) -10.6 9.7 5.5 -0.1 6.0 7.9 5.1 1.9 2.0 6.1 -3.4
Poland (7) -17.3 8.9 7.2 -9.1 1.6 2.7 .. -6.1 8.3 14.5 -11.1
Portugal (7) -13.2 11.6 -3.0 -7.3 5.8 4.9 6.9 2.1 0.6 3.2 -1.8
Slovak Republic -8.9 1.0 0.0 -3.8 0.4 1.1 3.9 0.8 2.5 0.4 -2.0
Slovenia 4.0 7.3 3.3 -0.4 4.4 2.7 9.7 6.2 6.9 0.9 -1.9
Spain (13) -7.9 6.3 -1.7 -1.7 3.4 7.4 7.6 2.1 1.0 2.2 -4.3
Sweden (7) .. .. .. -1.0 7.9 6.7 10.6 2.7 4.6 .. ..
Switzerland (7) -13.8 9.9 2.8 0.6 7.5 5.9 7.2 2.1 3.9 6.4 -3.6
Turkey (12,14) 0.9 17.6 1.9 -10.4 9.6 -7.6 5.6 -6.1 2.1 1.2 -9.4
United Kingdom -15.9 14.3 11.7 9.0 9.2 5.5 5.0 4.4 12.7 2.8 ..
United States (7) -26.6 9.5 5.5 -4.1 5.2 10.4 3.2 -2.2 2.6 7.5 -6.7
Selected other jurisdictions
Albania 4.6 4.7 5.8 2.8 3.2 3.8 4.3 3.3 2.7 2.6 2.0
Armenia .. .. .. .. .. .. -1.7 6.4 10.4 6.7 2.2
Bolivia -1.9 9.7 0.8 .. .. .. .. .. .. .. ..
Botswana .. .. .. .. .. .. .. .. .. 8.5 ..
Brazil .. .. .. .. .. .. .. .. .. .. 2.1
Bulgaria -29.4 7.9 0.5 -3.0 2.9 6.3 6.8 1.9 4.9 3.9 -6.0
Colombia -2.5 24.3 21.5 -3.7 15.1 -2.2 6.5 -3.7 3.5 8.8 -2.9
Costa Rica (12) -10.1 4.9 1.1 4.2 5.7 7.9 2.3 12.3 6.4 3.7 3.6
Croatia .. .. .. .. .. .. 9.9 11.3 7.6 1.2 0.2

81
PENSION MARKETS IN FOCUS 2019 © OECD 2019
2008 2009 2010 2011 2012 2013 2014 2015 2016 2017 2018
Dominican Republic 7.2 7.8 4.3 4.4 10.0 9.0 10.3 8.2 8.9 6.3 6.5
Egypt .. .. .. .. .. .. .. .. -10.1 -8.0 -3.0
El Salvador -2.2 5.4 2.4 -2.1 4.4 1.5 3.0 1.3 3.2 2.6 3.7
Ghana .. .. .. .. .. .. 3.4 5.4 4.0 .. ..
Gibraltar .. .. .. .. -0.6 0.4 .. .. .. .. ..
Guyana .. .. .. .. .. .. .. 2.6 -0.2 3.0 2.7
Hong Kong (China) (15) .. 24.6 4.8 -16.1 8.4 3.0 -3.3 -5.8 -0.3 20.2 -11.6
India .. .. .. -2.6 0.0 -5.8 11.1 0.0 .. .. ..
Indonesia .. .. .. 0.6 6.7 -4.9 6.7 2.8 7.8 7.4 0.6
Kenya -14.3 1.0 12.4 -24.2 .. 9.8 6.6 .. 0.9 5.3 ..
Kosovo .. .. .. .. .. 7.5 6.8 2.1 3.1 5.7 -6.7
Liechtenstein -8.4 9.5 2.8 -1.3 -1.5 6.7 5.1 7.6 3.3 5.9 -4.9
Malawi .. .. .. .. .. 13.3 0.1 -7.8 -4.8 17.8 9.8
Maldives (16) .. .. .. .. .. 10.8 .. 7.7 3.7 3.7 6.2
Malta .. .. .. -4.9 0.6 -0.2 0.3 -2.4 5.0 3.5 ..
Mauritius (17) .. .. .. .. .. .. .. 5.1 -1.4 .. ..
Namibia .. .. .. 5.0 7.5 11.0 4.7 .. -4.5 3.1 ..
Nigeria .. .. -0.8 -6.3 0.0 4.5 0.0 -0.5 -5.7 0.1 -1.9
North Macedonia -15.0 16.1 3.9 -1.0 3.0 6.5 7.2 5.8 6.1 2.8 0.3
Pakistan -26.4 0.3 -3.2 -1.2 9.8 11.2 15.3 9.3 .. -10.2 -6.5
Panama .. .. .. 0.3 1.3 2.0 2.7 4.2 4.2 5.4 ..
Papua New Guinea .. .. .. .. .. .. .. .. .. 4.9 -0.2
Peru -29.8 26.8 17.3 -14.1 9.1 -2.3 3.7 -0.2 5.7 5.2 -4.5
Romania 12.4 11.1 6.6 -0.3 5.2 8.9 7.8 5.0 5.0 1.1 -1.8
Russia .. .. .. .. .. -0.3 -7.4 -2.0 5.3 2.4 -1.4
Serbia -13.7 6.8 -2.6 -1.3 -0.5 8.6 8.8 13.5 5.8 3.4 4.5
South Africa (18) -5.0 -2.4 8.7 2.6 5.0 9.9 8.9 3.7 -1.0 1.3 0.5
Suriname .. .. .. .. .. .. .. .. .. .. ..
Tanzania .. .. .. .. .. .. .. 6.2 0.1 .. ..
Thailand .. 2.8 -0.9 -0.7 4.2 0.2 5.2 1.7 3.4 4.5 -1.7
Trinidad and Tobago .. 6.0 .. 2.7 3.4 .. .. .. .. .. ..
Ukraine .. .. 7.5 5.6 .. .. .. .. .. 3.2 4.1
Uruguay -21.5 30.0 17.0 8.1 11.9 3.1 4.1 1.2 1.0 13.4 -0.1
Zambia .. .. .. .. .. .. 5.7 -5.3 .. .. ..
Note: Please see the methodological notes at the end of the report.
Source: OECD Global Pension Statistics.

82
PENSION MARKETS IN FOCUS 2019 © OECD 2019
Table A B.8. Allocation of assets in funded and private pension plans in equities
As a percentage of total investment
exposure 2008 2009 2010 2011 2012 2013 2014 2015 2016 2017 2018
OECD countries
Australia total .. .. .. .. .. .. .. .. .. 42.2 43.7
Austria (1) total 21.2 26.1 31.6 26.0 29.5 34.4 32.6 30.1 33.4 41.4 43.1
Belgium (2) total 32.8 34.5 37.7 34.8 37.3 39.0 42.3 41.6 42.6 47.3 49.1
Canada (3) total 31.8 33.9 33.8 30.9 31.2 31.7 30.1 28.3 28.9 30.5 28.7
Chile total 36.6 41.5 48.2 40.4 41.6 42.1 40.3 39.6 33.6 40.8 38.8
Czech Republic direct 3.0 1.6 0.8 0.4 0.2 0.3 0.1 0.2 0.4 0.6 0.7
Denmark (4) direct 17.1 17.4 23.6 20.2 19.9 21.5 19.6 22.3 21.9 25.6 25.2
Estonia (5) total 29.6 32.0 38.6 32.6 33.7 33.8 34.5 31.0 33.8 36.1 34.2
Finland total .. .. .. .. .. .. .. .. 37.1 39.5 38.2
France (6) total .. .. .. .. .. .. .. .. .. 38.1 ..
Germany (7) total 5.6 5.8 4.7 3.2 3.6 4.4 4.5 5.0 5.8 6.2 5.4
Greece direct 4.9 5.9 3.0 0.5 2.5 2.6 4.4 .. 7.4 11.4 11.9
Hungary (3) direct 12.2 10.8 9.2 6.7 5.6 4.8 5.2 6.5 7.6 7.1 7.5
Iceland (8) total .. .. 18.1 18.1 21.3 26.3 30.9 34.2 31.7 30.5 30.6
Ireland (9) total .. .. .. .. .. .. .. 34.2 32.7 32.3 28.4
Israel direct 3.0 5.2 5.9 4.8 5.5 6.1 6.5 7.2 10.1 18.1 18.8
Italy (3) total 11.2 15.5 16.7 15.3 17.0 19.2 19.7 19.5 19.3 20.1 18.2
Japan (10) total 12.8 13.8 13.3 10.7 11.3 12.7 10.6 10.8 9.6 10.4 8.1
Korea (4) direct 2.8 3.2 4.0 4.1 4.5 3.9 3.5 2.9 3.1 3.4 2.7
Latvia total .. .. .. .. .. .. .. 19.2 20.6 27.9 27.7
Lithuania total .. .. 38.9 30.0 34.8 36.3 38.9 38.2 41.4 45.9 43.3
Luxembourg total .. .. 14.3 13.4 17.4 21.5 22.5 22.1 25.3 29.1 21.2
Mexico total 12.9 16.1 16.9 17.4 20.8 23.4 23.1 21.3 20.3 21.5 18.2
Netherlands total 33.4 32.2 35.6 34.6 34.1 37.0 38.8 37.4 31.0 31.6 28.6
New Zealand direct .. .. .. .. .. .. 27.3 26.5 29.1 32.7 31.8
Norway (3) total 22.5 31.0 34.3 29.0 32.3 35.5 36.0 35.4 35.7 36.9 35.8
Poland (3) direct 21.5 30.2 36.3 30.7 34.8 41.5 81.9 82.3 82.8 85.2 84.9
Portugal (11) total 18.0 22.2 21.7 20.0 17.3 20.3 18.8 19.5 19.1 15.0 12.2
Slovak Republic direct 2.7 0.2 1.4 1.2 0.2 1.1 1.5 1.5 2.1 2.2 2.5
Slovenia direct 3.1 2.7 2.6 1.2 1.4 1.3 1.5 1.1 1.2 1.9 2.2
Spain (3) direct 9.1 11.1 11.3 9.2 9.1 9.3 9.3 9.7 11.1 13.2 13.1
Sweden direct .. 14.5 14.7 14.0 13.5 14.5 14.5 13.8 15.3 13.9 13.9
Switzerland (3) total 21.5 26.6 27.6 26.0 27.8 29.2 29.5 29.7 30.3 31.1 28.1
Turkey (12) total 8.0 9.6 12.0 .. 16.1 14.0 13.5 14.2 11.9 13.1 13.8
United Kingdom direct 24.7 24.4 22.0 17.9 17.3 16.4 16.0 13.7 13.0 11.7 9.0
United States direct 26.3 27.9 28.6 28.0 28.9 31.1 31.0 31.1 31.4 32.8 30.7
Selected other jurisdictions
Albania total 0.0 0.0 0.0 0.0 0.0 0.0 0.0 0.0 0.0 0.0 0.0
Armenia direct .. .. .. .. .. .. 0.0 0.0 0.0 0.0 0.0
Botswana direct .. .. .. .. .. 51.0 .. .. .. 69.8 67.2
Brazil (13) total 27.4 32.1 32.8 29.8 .. 27.9 25.6 17.3 17.4 16.9 18.4
Bulgaria direct 10.4 11.3 14.8 11.7 11.0 12.8 16.3 16.2 15.3 17.4 17.4
Colombia total 24.0 40.3 43.4 33.1 35.1 31.5 27.6 25.4 38.0 40.4 34.0
Costa Rica (14) total 0.0 0.0 0.0 0.0 0.0 0.3 1.8 3.7 1.6 3.0 6.3
Croatia (15) total .. .. .. .. .. .. 22.7 23.7 21.9 21.9 21.0
Dominican Republic total .. .. .. .. .. .. .. .. .. 0.0 1.4
Egypt total 2.1 .. .. .. .. .. .. .. 6.4 1.7 2.1

83
PENSION MARKETS IN FOCUS 2019 © OECD 2019
exposure 2008 2009 2010 2011 2012 2013 2014 2015 2016 2017 2018
Ghana direct .. .. .. .. .. .. .. .. .. 1.7 2.4
Gibraltar (16) total .. .. .. 51.6 33.9 42.9 37.2 .. .. .. ..
Guyana total .. .. .. .. .. .. .. 23.3 23.4 27.3 37.7
Hong Kong (China) (17) total 45.5 50.7 55.2 55.0 57.4 60.5 61.1 60.6 59.9 63.4 57.5
India total .. .. .. .. .. .. .. .. 11.2 .. ..
Indonesia total .. .. .. .. .. .. .. .. 16.2 17.3 16.9
Jamaica total .. 12.7 14.0 16.0 14.7 15.4 15.7 24.0 28.5 33.5 38.1
Kazakhstan total .. .. .. .. .. .. .. .. .. .. 2.6
Kenya direct 32.7 20.2 21.2 23.5 24.3 26.0 26.6 .. 16.3 19.8 17.6
Kosovo direct .. .. .. .. .. .. .. 0.1 0.3 0.3 0.3
Liechtenstein total 16.7 19.6 26.1 25.1 24.9 26.3 29.4 29.6 30.1 31.7 28.6
Malawi total .. .. .. .. .. .. 49.8 38.8 38.4 41.8 48.4
Maldives total .. .. .. 12.2 6.0 3.9 .. 5.1 3.8 6.5 5.4
Malta direct .. .. .. .. .. 8.9 9.4 9.0 11.7 12.3 ..
Mauritius total .. .. .. .. .. .. .. .. 55.0 56.0 ..
Mozambique total .. .. .. .. .. .. .. .. .. .. 45.7
Namibia total .. .. 62.5 57.3 54.7 66.1 66.6 .. 57.8 .. ..
Nigeria direct 20.3 14.7 18.9 14.4 12.8 15.9 13.0 11.1 9.8 10.7 7.9
North Macedonia total 9.2 6.3 9.7 18.8 18.9 25.2 29.2 30.4 30.6 30.3 29.5
Pakistan total 14.3 29.1 30.7 28.7 32.2 37.3 44.3 49.3 .. .. 45.5
Panama total .. .. .. .. .. .. .. .. 0.4 .. ..
Papua New Guinea total .. .. .. .. .. 48.7 .. .. .. 42.4 42.5
Peru total 31.1 46.0 46.7 43.6 43.4 42.8 44.7 39.6 38.7 43.0 41.6
Romania direct 2.0 9.1 12.4 11.9 12.4 16.5 20.4 22.2 21.5 23.0 20.1
Russia direct .. .. .. .. .. 8.4 8.4 9.6 12.5 11.5 7.7
Serbia total .. 7.2 11.4 5.4 2.9 2.8 3.9 4.1 7.4 8.5 8.6
Singapore (18) total .. .. .. .. .. 0.8 0.1 0.1 0.2 0.2 0.2
South Africa (19) direct 15.9 20.8 22.4 21.2 19.9 21.4 21.3 21.1 19.5 18.8 36.6
Suriname direct .. .. .. .. .. .. .. .. 10.2 7.0 6.3
Tanzania direct .. .. .. .. .. .. 5.9 11.0 7.2 7.7 ..
Thailand direct 7.4 10.2 13.3 11.3 14.2 13.3 15.4 14.9 16.3 18.4 16.9
Trinidad and Tobago total .. 24.7 .. 26.8 32.3 .. .. .. .. .. ..
Uganda total .. .. .. .. .. .. .. .. 16.8 .. ..
Ukraine total 9.0 .. 18.1 18.4 .. .. .. .. .. .. ..
Uruguay total .. .. .. .. .. .. .. .. 0.2 0.2 0.2
Zambia direct .. .. .. .. .. .. 23.2 22.3 .. .. ..
Note: Please see the methodological notes at the end of the report.
Source: OECD Global Pension Statistics.

84
PENSION MARKETS IN FOCUS 2019 © OECD 2019
Table A B.9. Allocation of assets in funded and private pension plans in bills and bonds
As a percentage of total investment
exposure 2008 2009 2010 2011 2012 2013 2014 2015 2016 2017 2018
OECD countries
Australia total .. .. .. .. .. .. .. .. .. 14.2 14.6
Austria (1) total 49.0 53.4 48.9 52.0 52.1 48.1 47.8 46.4 45.7 44.4 45.4
Belgium (2) total 42.3 40.8 42.8 46.0 45.9 42.0 45.0 43.8 44.8 41.7 41.1
Canada (3) total 37.4 35.2 35.5 38.8 37.1 34.6 35.6 34.8 33.6 31.7 31.7
Chile total 58.7 47.5 48.8 57.7 56.7 56.7 58.7 59.2 65.6 58.4 60.6
Czech Republic direct 78.9 80.5 84.5 84.5 84.4 85.4 87.8 87.1 88.0 76.9 76.5
Denmark (4) direct 53.1 56.6 46.8 42.8 40.7 36.1 33.9 32.8 31.1 29.9 30.9
Estonia (5) total 55.0 51.9 47.8 50.2 49.6 48.6 48.4 48.6 42.6 59.5 62.5
Finland total .. .. .. .. .. .. .. .. 30.6 27.9 27.4
France (6) total .. .. .. .. .. .. .. .. .. 22.4 ..
Germany (7) total 47.1 48.2 46.3 48.7 51.4 51.5 53.4 52.5 52.4 52.0 49.9
Greece direct 58.9 52.2 48.2 52.4 37.1 32.5 60.2 .. 61.4 58.7 54.7
Hungary (3) direct 62.0 56.8 54.5 64.0 63.3 63.7 63.6 62.3 60.7 60.1 61.8
Iceland (8) total .. .. 53.0 53.4 51.8 49.7 47.7 46.1 49.7 44.0 45.0
Ireland (9) total .. .. .. .. .. .. .. 42.0 42.2 40.9 41.9
Israel direct 84.9 78.0 74.9 77.2 76.0 70.6 68.4 67.3 66.7 65.1 61.7
Italy (3) total 44.5 46.2 46.6 47.5 48.0 48.0 48.7 49.7 47.5 45.0 45.1
Japan (10) total 37.5 36.6 36.8 38.5 36.4 34.3 33.4 32.5 32.4 30.4 31.6
Korea (4) direct 48.5 44.2 45.4 44.2 43.8 45.8 45.1 45.5 44.7 43.0 42.5
Latvia total .. .. .. .. .. .. .. 59.4 63.3 61.7 61.3
Lithuania total .. .. 53.6 61.9 59.4 58.4 53.3 51.0 46.8 46.2 46.3
Luxembourg total .. .. 66.5 69.6 69.2 68.7 66.5 71.0 64.0 60.0 57.7
Mexico total 81.7 83.0 81.8 81.8 77.9 75.2 75.9 77.2 77.1 75.5 78.1
Netherlands total 41.9 43.4 42.1 44.4 43.7 43.4 42.5 46.0 45.6 43.5 46.2
New Zealand direct .. .. .. .. .. .. 22.2 22.0 22.3 23.3 24.2
Norway (3) total 66.0 59.1 57.0 62.3 59.0 57.2 56.7 56.5 55.4 54.2 56.2
Poland (3) direct 74.9 66.5 59.4 62.4 55.8 51.8 9.5 10.4 9.7 7.4 7.4
Portugal (11) total 52.2 56.5 50.2 45.0 45.9 45.6 45.5 52.0 58.1 69.2 70.7
Slovak Republic direct 66.3 68.4 68.4 67.9 68.5 66.3 68.8 65.1 64.5 57.8 58.6
Slovenia direct 69.8 69.4 63.2 61.6 63.7 66.5 59.9 65.3 62.5 59.6 60.1
Spain (3) direct 51.7 56.4 53.6 57.6 55.7 56.7 56.0 53.2 50.6 45.5 45.2
Sweden direct .. 27.0 24.6 29.7 27.9 23.5 21.7 18.7 17.3 14.5 16.1
Switzerland (3) total 40.8 37.8 36.5 37.3 35.2 33.6 34.1 32.7 31.9 30.6 31.3
Turkey (12) total 70.1 70.0 58.6 .. 58.4 69.0 63.3 58.4 54.1 50.5 54.5
United Kingdom direct 23.2 22.3 20.3 21.7 22.1 22.3 24.2 25.0 26.5 28.1 30.2
United States direct 28.0 25.9 25.5 26.7 26.2 23.2 23.5 23.9 23.4 21.7 24.5
Selected other jurisdictions
Albania total 67.9 58.2 48.6 96.8 97.1 96.7 92.0 90.6 94.7 94.7 96.0
Armenia direct .. .. .. .. .. .. 35.2 46.6 45.5 41.1 39.4
Botswana direct .. .. .. .. .. 34.5 .. .. .. 21.9 18.1
Brazil (13) total 58.6 54.8 53.1 53.5 .. 53.2 54.9 61.2 63.3 62.0 61.6
Bulgaria direct 54.8 45.2 44.1 51.8 57.6 54.1 56.8 56.5 55.2 60.9 56.8
Colombia total 65.9 55.1 50.0 51.3 52.2 52.6 48.5 46.8 50.8 49.5 53.1
Costa Rica (14) total 86.2 94.1 95.7 100.0 100.0 99.7 98.2 91.2 93.8 92.1 81.4
Croatia (15) total .. .. .. .. .. .. 72.5 73.2 72.4 73.4 70.7
Dominican Republic total .. .. .. .. .. .. .. .. .. 99.9 97.8
Egypt total 68.1 .. .. .. .. .. .. .. 70.1 69.4 74.1

85
PENSION MARKETS IN FOCUS 2019 © OECD 2019
exposure 2008 2009 2010 2011 2012 2013 2014 2015 2016 2017 2018
Ghana direct .. .. .. .. .. .. .. .. .. 69.6 69.1
Gibraltar (16) total .. .. .. 28.4 21.4 28.8 45.1 .. .. .. ..
Guyana total .. .. .. .. .. .. .. 20.5 22.5 22.8 18.9
Hong Kong (China) (17) total 28.9 27.2 26.5 25.6 24.8 22.7 21.7 22.4 22.7 20.9 24.3
India total .. .. .. .. .. .. .. .. 84.5 .. ..
Indonesia total .. .. .. .. .. .. .. .. 45.7 45.2 45.9
Jamaica total .. 56.3 73.8 69.1 71.6 70.4 71.3 63.2 58.8 52.6 48.4
Kazakhstan total .. .. .. .. .. .. .. .. .. .. 87.8
Kenya direct 35.6 26.5 26.2 35.2 39.5 38.1 32.5 .. 48.2 40.4 42.9
Kosovo direct .. .. .. .. .. .. .. 7.5 5.7 5.5 12.5
Liechtenstein total 39.4 38.1 42.3 45.6 45.3 43.7 43.0 45.7 41.4 38.6 40.5
Malawi total .. .. .. .. .. .. 23.7 25.2 38.0 37.1 39.3
Maldives total .. .. .. 66.8 79.8 86.1 .. 94.6 91.1 89.9 90.5
Malta direct .. .. .. .. .. 21.8 17.9 13.7 12.8 11.3 ..
Mauritius total .. .. .. .. .. .. .. .. 21.0 32.4 ..
Mozambique total .. .. .. .. .. .. .. .. .. .. 42.1
Namibia total .. .. 20.8 23.6 21.3 20.2 20.2 .. 23.7 .. ..
Nigeria direct 33.3 40.0 47.0 63.4 63.7 66.1 69.4 73.0 78.9 76.1 88.4
North Macedonia total 47.9 57.4 58.4 62.0 66.0 62.0 58.5 60.3 61.3 61.3 57.3
Pakistan total 35.4 41.9 49.7 58.8 52.8 39.5 44.0 34.1 .. .. 16.5
Panama total .. .. .. .. .. .. .. .. 55.1 .. ..
Papua New Guinea total .. .. .. .. .. 23.6 .. .. .. 29.8 33.2
Peru total 58.4 47.2 42.9 47.3 48.2 39.6 43.8 43.2 46.9 43.6 46.1
Romania direct 84.4 82.3 80.1 76.1 82.3 74.8 75.7 73.1 71.3 68.3 71.7
Russia direct .. .. .. .. .. 59.5 61.7 63.4 61.2 68.8 74.0
Serbia total .. 71.8 66.1 75.7 70.7 85.1 86.8 82.8 77.3 84.1 83.5
Singapore (18) total .. .. .. .. .. .. .. .. .. .. ..
South Africa (19) direct 7.9 7.6 7.7 7.7 8.2 8.1 9.0 8.8 9.3 9.1 16.6
Suriname direct .. .. .. .. .. .. .. .. 33.7 21.7 18.9
Tanzania direct .. .. .. .. .. .. 11.5 22.4 25.7 29.6 ..
Thailand direct 77.1 76.0 72.2 72.2 59.8 53.5 48.1 52.7 55.6 56.4 58.7
Trinidad and Tobago total .. 47.1 .. 45.2 43.4 .. .. .. .. .. ..
Uganda total .. .. .. .. .. .. .. .. 72.6 .. ..
Ukraine total 27.3 .. 30.7 40.1 .. .. .. .. .. .. ..
Uruguay total .. .. .. .. .. .. .. .. 72.5 77.6 69.7
Zambia direct .. .. .. .. .. .. 41.1 21.8 .. .. ..
Note: Please see the methodological notes at the end of the report.
Source: OECD Global Pension Statistics.

86
PENSION MARKETS IN FOCUS 2019 © OECD 2019
Table A B.10. Allocation of assets in funded and private pension plans in cash and deposits
As a percentage of total investment
exposure 2008 2009 2010 2011 2012 2013 2014 2015 2016 2017 2018
OECD countries
Australia total .. .. .. .. .. .. .. .. .. 15.5 13.7
Austria (1) total 15.1 9.5 8.3 11.7 9.2 12.8 8.3 9.0 8.9 7.0 7.7
Belgium (2) total 8.5 6.2 6.5 5.2 4.9 3.9 3.9 4.6 4.9 5.9 5.6
Canada (3) total 3.8 3.9 3.3 3.4 3.5 3.5 3.8 4.1 4.4 4.3 4.0
Chile total 0.9 0.6 0.3 0.3 0.5 0.3 0.3 0.6 0.3 0.2 0.3
Czech Republic direct 8.1 10.2 6.8 7.9 9.8 10.4 8.3 9.0 8.1 19.1 19.7
Denmark (4) direct 2.2 1.9 0.9 1.3 1.4 1.1 1.2 0.9 1.0 2.0 1.0
Estonia (5) total 14.1 15.3 9.4 16.4 16.4 17.4 17.0 20.3 23.3 4.1 3.1
Finland total .. .. .. .. .. .. .. .. 2.6 3.5 3.6
France (6) total .. .. .. .. .. .. .. .. .. 34.5 ..
Germany (7) total 4.7 2.9 2.5 3.6 3.0 3.7 3.5 4.4 3.5 3.8 4.2
Greece direct 25.6 28.8 37.0 37.0 46.4 21.4 14.7 .. 4.5 7.8 12.6
Hungary (3) direct 3.0 2.5 1.6 4.2 3.7 6.2 5.7 5.0 4.2 3.7 3.8
Iceland (8) total .. .. 11.3 10.6 10.3 9.4 7.9 8.4 7.9 10.0 6.9
Ireland (9) total .. .. .. .. .. .. .. 3.2 3.4 2.9 3.1
Israel direct 3.7 6.7 7.0 4.6 5.4 4.8 5.0 6.0 6.4 7.1 5.2
Italy (3) total 7.6 5.7 5.2 4.4 4.2 3.6 3.2 4.1 5.1 6.2 6.3
Japan (10) total 7.5 6.6 5.9 7.0 6.9 6.9 7.0 7.8 8.2 8.0 8.7
Korea (4) direct 18.6 19.1 15.8 18.1 18.8 17.7 18.4 18.2 18.0 17.8 18.5
Latvia total .. .. .. .. .. .. .. 19.3 12.7 7.1 6.0
Lithuania total .. .. 4.7 6.5 3.9 3.2 6.4 9.3 9.0 5.2 7.2
Luxembourg total .. .. 9.4 4.8 4.7 5.0 3.6 1.7 3.3 4.1 8.2
Mexico total 0.0 1.0 0.4 0.3 0.8 1.1 1.0 1.0 0.9 0.9 1.0
Netherlands total 4.0 2.2 2.4 2.0 3.0 2.7 2.7 2.2 2.5 3.3 3.1
New Zealand direct .. .. .. .. .. .. 7.3 6.8 7.0 6.7 7.9
Norway (3) total 4.4 3.9 2.6 2.7 2.7 2.3 2.7 2.4 2.2 2.4 2.0
Poland (3) direct 2.5 2.3 3.5 5.7 8.3 6.0 7.2 6.9 7.3 5.9 5.7
Portugal (11) total 13.5 6.0 10.9 9.5 13.3 11.7 16.5 10.9 7.3 5.6 7.8
Slovak Republic direct 24.4 29.2 26.5 28.1 22.7 20.5 16.9 14.5 10.0 12.0 11.2
Slovenia direct 20.6 19.0 22.2 23.7 18.2 12.5 18.7 14.3 13.6 12.3 9.2
Spain (3) direct 22.6 16.4 17.9 14.9 14.6 13.5 12.9 14.3 12.4 11.0 10.1
Sweden direct .. 1.5 1.6 2.0 1.8 1.5 1.4 1.2 1.0 0.9 1.0
Switzerland (3) total 8.7 8.1 7.0 7.4 7.7 8.1 7.3 5.6 5.0 5.0 5.3
Turkey (12) total 6.3 5.4 13.0 .. 9.0 16.5 18.3 19.6 24.5 25.2 22.1
United Kingdom direct 2.6 3.2 2.6 2.5 2.4 2.6 2.3 1.9 1.8 2.1 2.2
United States direct 3.5 3.2 3.1 3.2 3.1 2.7 2.6 2.7 2.7 2.4 2.5
Selected other jurisdictions
Albania total 32.1 41.8 51.4 2.9 2.4 1.9 6.3 7.4 3.5 3.4 2.1
Armenia direct .. .. .. .. .. .. 52.3 22.8 26.8 30.0 34.4
Botswana direct .. .. .. .. .. 13.2 .. .. .. 6.7 9.8
Brazil (13) total 0.0 0.0 0.0 0.1 .. 0.1 0.1 0.1 0.1 0.1 0.1
Bulgaria direct 23.9 28.3 24.3 23.0 19.4 19.1 10.6 10.6 14.1 5.9 9.2
Colombia total 1.3 2.0 3.2 1.8 2.3 2.8 3.1 3.9 3.6 2.2 3.5
Costa Rica (14) total 11.5 3.2 4.3 0.0 0.0 0.0 0.0 3.8 2.4 3.4 4.7
Croatia (15) total .. .. .. .. .. .. 4.4 2.8 5.0 4.4 6.4
Dominican Republic total .. .. .. .. .. .. .. .. .. 0.0 0.0
Egypt total 26.8 .. .. .. .. .. .. .. 20.5 24.9 21.4

87
PENSION MARKETS IN FOCUS 2019 © OECD 2019
exposure 2008 2009 2010 2011 2012 2013 2014 2015 2016 2017 2018
Ghana direct .. .. .. .. .. .. .. .. .. 13.9 2.6
Gibraltar (16) total .. .. .. 5.3 29.0 6.2 7.3 .. .. .. ..
Guyana total .. .. .. .. .. .. .. 28.7 28.6 25.1 21.9
Hong Kong (China) (17) total 14.7 14.3 11.0 13.3 13.3 12.9 13.1 12.6 12.5 11.5 13.6
India total .. .. .. .. .. .. .. .. 2.5 .. ..
Indonesia total .. .. .. .. .. .. .. .. 26.1 27.8 27.5
Jamaica total .. 2.2 0.9 0.8 1.4 2.0 1.6 1.6 1.0 1.2 1.4
Kazakhstan total .. .. .. .. .. .. .. .. .. .. 9.5
Kenya direct 6.9 7.6 4.2 5.3 7.3 6.2 5.5 .. 5.1 4.2 4.2
Kosovo direct .. .. .. .. .. .. .. 4.7 2.6 4.2 14.6
Liechtenstein total 6.4 9.4 8.6 7.0 7.0 7.6 6.3 4.7 5.5 6.8 5.8
Malawi total .. .. .. .. .. .. 11.7 13.6 10.2 9.8 8.3
Maldives total .. .. .. 20.9 14.2 9.9 .. 0.4 5.1 3.6 4.1
Malta direct .. .. .. .. .. 15.7 13.1 13.0 13.7 4.9 ..
Mauritius total .. .. .. .. .. .. .. .. 17.5 8.7 ..
Mozambique total .. .. .. .. .. .. .. .. .. .. 4.9
Namibia total .. .. 6.6 7.2 11.6 5.2 6.6 .. 7.1 .. ..
Nigeria direct 31.8 34.0 24.6 12.8 15.6 11.7 11.7 10.7 7.2 10.1 0.4
North Macedonia total 42.4 35.9 31.9 19.1 14.1 12.6 11.3 7.4 8.0 8.2 13.1
Pakistan total 47.1 27.0 17.6 10.6 14.1 19.2 8.7 .. .. .. 36.4
Panama total .. .. .. .. .. .. .. .. 43.4 .. ..
Papua New Guinea total .. .. .. .. .. 11.2 .. .. .. 13.4 12.4
Peru total 8.5 3.3 6.9 5.0 4.1 13.1 6.9 11.7 6.3 6.0 2.8
Romania direct 13.1 7.7 7.3 12.0 4.9 8.6 4.0 4.8 7.0 8.7 8.1
Russia direct .. .. .. .. .. 24.1 21.4 19.4 17.8 14.8 13.6
Serbia total .. 19.9 21.6 18.2 20.2 11.7 8.8 12.8 14.4 7.4 7.9
Singapore (18) total .. .. .. .. .. 3.7 3.5 3.4 3.4 3.2 3.2
South Africa (19) direct 7.5 6.3 6.5 5.7 5.0 3.7 3.5 4.8 4.0 3.6 7.4
Suriname direct .. .. .. .. .. .. .. .. 18.5 27.7 29.5
Tanzania direct .. .. .. .. .. .. 11.4 10.8 9.0 9.0 ..
Thailand direct 12.7 10.2 10.3 12.1 20.2 26.0 28.0 23.1 17.6 12.3 10.1
Trinidad and Tobago total .. 8.2 .. 5.8 6.2 .. .. .. .. .. ..
Uganda total .. .. .. .. .. .. .. .. 4.7 .. ..
Ukraine total 56.3 .. 34.7 32.2 .. .. .. .. .. .. ..
Uruguay total .. .. .. .. .. .. .. .. 8.3 6.8 9.8
Zambia direct .. .. .. .. .. .. 11.7 8.0 .. .. ..
Note: Please see the methodological notes at the end of the report.
Source: OECD Global Pension Statistics.

88
PENSION MARKETS IN FOCUS 2019 © OECD 2019
Table A B.11. Allocation of assets in funded and private pension plans in the "other" category
As a percentage of total investment
exposure 2008 2009 2010 2011 2012 2013 2014 2015 2016 2017 2018
OECD countries
Australia total .. .. .. .. .. .. .. .. .. 28.1 28.1
Austria (1) total 14.6 11.0 11.2 10.4 9.2 4.7 11.3 14.4 11.9 13.1 14.1
Belgium (2) total 16.4 18.4 13.0 14.1 11.9 15.1 8.8 10.0 7.6 5.0 4.1
Canada (3) total 26.9 27.0 27.3 26.9 28.1 30.1 30.4 32.8 33.0 33.5 35.6
Chile total 3.8 10.4 2.8 1.5 1.3 0.9 0.7 0.5 0.5 0.5 0.3
Czech Republic direct 6.9 4.5 4.2 4.7 4.4 2.5 2.3 1.9 1.3 1.3 0.9
Denmark (4) direct 20.1 16.0 18.4 26.9 28.0 30.5 34.6 35.5 38.0 38.4 39.0
Estonia (5) total 1.3 0.8 4.1 0.8 0.3 0.1 0.1 0.1 0.3 0.4 0.2
Finland total .. .. .. .. .. .. .. .. 29.8 29.1 30.9
France (6) total .. .. .. .. .. .. .. .. .. 5.0 ..
Germany (7) total 42.6 43.2 46.5 44.6 42.0 40.4 38.5 38.1 38.3 38.0 40.6
Greece direct 3.9 3.5 2.2 1.7 1.6 3.5 4.8 .. 2.1 1.3 1.8
Hungary (3) direct 0.6 2.6 3.2 0.0 2.6 2.0 1.8 2.5 1.9 2.4 1.8
Iceland (8) total .. .. 17.6 17.9 16.6 14.5 13.5 11.3 10.7 15.5 17.4
Ireland (9) total .. .. .. .. .. .. .. 20.6 21.6 23.9 26.6
Israel direct 7.3 7.3 8.7 9.5 9.7 14.3 15.5 15.1 16.8 9.6 14.3
Italy (3) total 36.6 32.6 31.5 32.8 30.8 29.2 28.4 26.7 28.1 28.8 30.4
Japan (10) total 42.2 43.0 44.0 43.8 45.5 46.2 49.0 49.0 49.8 51.1 51.6
Korea (4) direct 24.5 26.1 29.1 29.8 27.9 27.4 27.4 27.6 28.7 29.4 29.0
Latvia total .. .. .. .. .. .. .. 2.2 3.4 3.4 5.0
Lithuania total .. .. 2.8 1.6 2.0 2.1 1.5 1.6 2.9 2.7 3.1
Luxembourg total .. .. 9.7 12.2 8.7 4.8 7.5 5.3 7.3 6.7 12.9
Mexico total 5.4 0.0 0.9 0.5 0.5 0.4 0.1 0.4 1.7 2.1 2.7
Netherlands total 20.6 22.2 19.8 19.0 19.2 16.9 15.9 14.5 21.0 21.6 22.1
New Zealand direct .. .. .. .. .. .. 1.3 1.7 1.4 1.6 1.2
Norway (3) total 7.1 6.1 6.1 6.0 6.1 4.9 4.6 5.7 6.7 6.5 6.0
Poland (3) direct 0.7 0.9 0.9 1.2 1.1 0.8 1.4 0.5 0.1 1.4 2.0
Portugal (11) total 16.2 15.3 17.1 25.5 23.5 22.5 19.2 17.7 15.5 10.3 9.2
Slovak Republic direct 4.2 1.5 0.2 0.2 0.8 0.7 0.8 2.0 4.1 4.4 4.2
Slovenia direct 2.7 3.7 3.0 4.3 3.5 3.7 1.5 1.2 1.8 1.7 1.7
Spain (3) direct 10.2 10.0 9.7 11.2 11.0 10.1 9.2 8.0 8.0 8.5 9.3
Sweden direct .. 3.9 4.4 5.6 4.4 4.2 4.2 3.8 4.1 5.4 5.6
Switzerland (3) total 28.9 27.5 28.8 29.3 29.3 29.1 29.1 32.0 32.8 33.2 35.4
Turkey (12) total 15.6 15.0 16.3 .. 16.6 0.5 4.9 7.9 9.6 11.3 9.5
United Kingdom direct 27.7 24.7 26.4 31.2 30.2 30.8 32.3 32.4 31.0 30.1 31.9
United States direct 13.4 12.3 11.5 11.9 11.3 10.5 10.3 10.2 10.3 10.3 10.6
Selected other jurisdictions
Albania total 0.0 0.0 0.0 0.3 0.5 1.4 1.7 2.0 1.8 1.9 2.0
Armenia direct .. .. .. .. .. .. 1.1 0.3 0.3 0.9 1.4
Botswana direct .. .. .. .. .. 1.4 .. .. .. 1.2 4.1
Brazil (13) total 14.0 13.1 14.1 16.5 .. 18.8 19.4 21.4 19.2 21.0 19.9
Bulgaria direct 5.4 4.5 5.2 5.9 4.1 3.6 3.8 3.9 3.3 3.0 3.2
Colombia total 8.8 2.6 3.4 13.8 10.3 13.0 20.8 23.9 7.6 7.9 9.4
Costa Rica (14) total 2.2 2.7 0.0 0.0 0.0 0.0 0.0 1.3 2.3 1.5 7.7
Croatia (15) total .. .. .. .. .. .. 0.4 0.4 0.6 0.3 1.9
Dominican Republic total .. .. .. .. .. .. .. .. .. 0.1 0.8
Egypt total 3.0 .. .. .. .. .. .. .. 3.0 4.0 2.4

89
PENSION MARKETS IN FOCUS 2019 © OECD 2019
exposure 2008 2009 2010 2011 2012 2013 2014 2015 2016 2017 2018
Ghana direct .. .. .. .. .. .. .. .. .. 13.6 23.8
Gibraltar (16) total .. .. .. 14.7 15.7 22.1 10.5 .. .. .. ..
Guyana total .. .. .. .. .. .. .. 27.5 25.6 24.8 21.5
Hong Kong (China) (17) total 10.9 7.7 7.3 6.0 4.5 4.0 4.1 4.4 4.9 4.1 4.7
India total .. .. .. .. .. .. .. .. 1.7 .. ..
Indonesia total .. .. .. .. .. .. .. .. 12.0 9.7 9.7
Jamaica total .. 28.8 11.4 14.1 12.4 12.3 11.5 11.2 11.7 12.7 12.1
Kazakhstan total .. .. .. .. .. .. .. .. .. .. 0.2
Kenya direct 24.8 45.5 48.4 35.9 28.8 29.7 35.3 .. 30.3 35.5 35.3
Kosovo direct .. .. .. .. .. .. .. 0.0 0.0 5.5 0.0
Liechtenstein total 37.5 32.8 22.9 22.3 22.9 22.4 21.4 20.0 23.1 22.8 25.1
Malawi total .. .. .. .. .. .. 14.8 22.4 13.4 11.3 4.0
Maldives total .. .. .. 0.0 0.0 0.0 .. 0.0 0.0 0.0 0.0
Malta direct .. .. .. .. .. 21.5 27.5 32.8 33.2 43.0 ..
Mauritius total .. .. .. .. .. .. .. .. 6.5 2.9 ..
Mozambique total .. .. .. .. .. .. .. .. .. .. 7.3
Namibia total .. .. 10.2 11.8 12.4 8.5 6.6 .. 11.3 .. ..
Nigeria direct 13.8 10.9 9.1 8.9 7.3 5.9 5.4 4.8 4.0 3.1 3.2
North Macedonia total 0.5 0.4 0.0 0.1 1.0 0.2 1.1 1.8 0.2 0.1 0.1
Pakistan total 3.2 2.0 2.0 1.9 0.8 3.9 3.0 16.6 .. .. 1.6
Panama total .. .. .. .. .. .. .. .. 1.2 .. ..
Papua New Guinea total .. .. .. .. .. 16.5 .. .. .. 14.4 11.8
Peru total 2.0 3.6 3.4 4.1 4.2 4.5 4.6 5.5 8.1 7.5 9.6
Romania direct 0.0 0.0 -0.3 0.1 0.3 0.1 0.0 0.0 0.1 0.1 0.1
Russia direct .. .. .. .. .. 4.1 4.9 4.1 8.5 4.9 4.7
Serbia total .. 1.1 0.9 0.7 6.1 0.4 0.4 0.3 0.9 0.0 0.0
Singapore (18) total .. .. .. .. .. 95.6 96.3 96.5 96.4 96.6 96.7
South Africa (19) direct 58.0 54.6 51.8 52.8 53.5 52.2 50.8 52.3 51.3 52.2 36.7
Suriname direct .. .. .. .. .. .. .. .. 36.3 42.0 43.5
Tanzania direct .. .. .. .. .. .. 66.3 54.1 56.3 51.9 ..
Thailand direct 0.1 0.3 0.8 0.5 0.6 0.7 0.9 0.6 0.7 1.0 1.0
Trinidad and Tobago total .. 20.0 .. 22.2 18.1 .. .. .. .. .. ..
Uganda total .. .. .. .. .. .. .. .. 5.9 .. ..
Ukraine total 7.4 .. 16.6 9.4 .. .. .. .. .. .. ..
Uruguay total .. .. .. .. .. .. .. .. 18.9 15.5 20.4
Zambia direct .. .. .. .. .. .. 24.0 40.3 .. .. ..
Note: Please see the methodological notes at the end of the report.
Source: OECD Global Pension Statistics.

90
PENSION MARKETS IN FOCUS 2019 © OECD 2019
Table A B.12. Share of assets in funded and private pension plans invested abroad, 2008-2018
As a percentage of total investment
2008 2009 2010 2011 2012 2013 2014 2015 2016 2017 2018
Selected OECD countries
Canada (1) 29.0 29.0 29.2 29.6 31.5 33.7 33.0 34.2 32.9 36.8 37.1
Chile 28.5 43.8 45.1 36.5 38.3 42.4 43.8 44.2 39.0 42.9 41.2
Czech Republic 15.6 14.8 14.2 13.9 10.8 11.9 13.4 15.5 14.5 10.7 13.9
Denmark (2) .. .. .. .. .. .. .. .. 28.7 31.0 32.9
Estonia (3) 78.4 77.1 80.7 76.4 75.4 74.5 77.7 75.8 75.7 85.9 83.7
Iceland (4) .. .. 24.0 25.1 23.9 24.4 25.5 23.9 23.3 26.1 27.9
Israel 5.1 7.3 9.3 11.0 12.3 15.7 17.7 16.0 17.3 17.5 20.0
Italy (5) .. .. .. .. 56.5 59.6 59.9 60.4 58.8 62.7 63.0
Japan (6) 24.6 25.4 25.9 25.2 26.5 25.4 27.6 25.9 26.2 26.4 26.5
Korea (7) 4.5 5.4 5.5 5.0 4.3 4.4 5.6 7.3 10.9 11.6 12.6
Latvia .. 37.5 40.1 49.0 54.7 53.9 57.6 56.1 66.4 78.3 80.9
Lithuania .. .. 74.4 68.5 70.1 78.8 74.1 68.8 74.9 72.7 75.5
Mexico 6.3 6.4 7.0 7.8 10.2 12.1 12.7 12.3 11.3 12.8 9.6
Netherlands 81.7 82.3 82.8 78.3 78.7 79.7 81.7 81.3 88.0 87.4 86.5
New Zealand .. .. .. .. .. .. 50.3 48.8 49.2 49.2 50.1
Norway (1) 26.4 27.2 26.7 26.8 28.5 29.0 29.7 29.7 28.8 27.6 27.7
Poland (8) 0.6 .. .. 0.5 0.8 1.4 3.8 8.0 7.3 6.4 6.1
Portugal (9) 59.3 64.1 48.3 57.0 54.1 57.4 52.2 60.1 63.9 61.4 65.1
Slovak Republic 33.9 53.7 52.1 41.6 47.6 59.5 67.0 72.0 74.9 72.7 74.1
Slovenia 30.8 31.6 34.8 36.2 38.2 37.0 39.6 48.6 53.1 61.0 63.1
Sweden (7) 26.0 23.1 21.7 22.4 21.6 22.6 18.6 12.3 16.2 15.7 14.4
Switzerland (1) 34.7 37.8 38.2 37.5 38.2 39.3 40.7 39.8 40.8 41.0 39.3
Turkey (10) 0.5 0.4 0.1 .. 0.6 .. .. .. .. .. 3.1
United Kingdom 28.3 29.6 29.2 27.2 27.8 27.7 27.9 26.8 26.0 25.7 ..
Selected other jurisdictions
Armenia .. .. .. .. .. .. 11.4 30.4 29.4 28.1 ..
Botswana .. .. .. .. .. 30.1 .. .. .. .. ..
Brazil (11) .. .. .. 0.1 .. 0.1 0.1 0.3 0.2 0.3 0.4
Bulgaria 27.0 34.4 36.7 37.6 41.1 46.4 54.6 52.0 47.8 58.2 55.7
Colombia .. .. .. .. .. .. .. .. 28.9 34.5 33.1
Costa Rica (12) 7.5 3.4 2.3 1.5 2.8 3.7 3.6 4.9 6.3 7.8 10.8
Croatia (13) .. .. .. .. .. .. 13.1 13.3 9.2 11.2 11.8
Guyana .. .. .. .. .. .. .. 30.6 22.5 19.6 21.1
Hong Kong (China) (14) 53.4 49.9 49.6 49.8 48.3 48.0 46.4 46.1 47.5 46.6 45.3
Kazakhstan .. .. .. .. .. .. .. .. .. .. 21.8
Kosovo .. .. .. .. 93.5 71.3 94.1 91.8 91.5 .. ..
Mauritius .. .. .. .. .. .. .. 23.4 29.2 16.0 ..
Namibia .. .. 23.8 24.3 26.1 32.8 59.4 .. 51.2 .. ..
Nigeria (15) 3.1 5.8 .. 5.9 .. .. .. 7.6 11.2 12.7 19.5
North Macedonia 2.1 1.5 11.0 15.8 15.6 22.1 26.3 27.8 28.2 28.0 26.4
Papua New Guinea .. .. .. .. .. 12.8 .. .. .. .. ..
Peru 12.4 21.0 26.3 28.6 29.4 35.2 40.6 40.2 37.6 42.6 43.8
Romania 22.9 14.5 15.4 11.1 5.8 4.7 5.5 6.5 6.3 7.0 6.9
Serbia (16) .. 0.0 0.3 0.0 0.0 0.0 0.0 0.0 0.4 0.3 0.5
South Africa (17) 9.7 9.2 9.9 8.7 13.1 16.3 20.1 .. 21.7 22.4 23.7
Suriname .. .. .. .. .. .. .. .. 28.3 .. ..
Thailand .. 0.2 0.1 0.2 0.5 0.5 0.5 0.7 0.8 0.7 0.7

91
PENSION MARKETS IN FOCUS 2019 © OECD 2019
2008 2009 2010 2011 2012 2013 2014 2015 2016 2017 2018
Trinidad and Tobago .. 10.5 .. 8.5 10.4 .. .. .. .. .. ..
Uruguay .. .. .. .. .. .. .. .. 10.0 7.2 8.0
Zambia .. .. .. .. .. .. 9.7 .. .. .. ..
Note: Please see the methodological notes at the end of the report.
Source: OECD Global Pension Statistics.

92
PENSION MARKETS IN FOCUS 2019 © OECD 2019
Table A B.13. Share of assets issued in foreign currencies of funded and private pension plans, 2008-2018
As a percentage of total investment
2008 2009 2010 2011 2012 2013 2014 2015 2016 2017 2018
Selected OECD countries
Austria (1) 9.7 15.7 20.7 17.2 17.3 .. .. 15.7 20.8 21.9 21.8
Chile 28.1 43.1 44.5 36.0 37.8 43.4 36.3 45.7 40.6 44.2 42.4
Czech Republic 7.2 7.5 9.8 14.7 11.1 12.7 13.0 15.0 13.9 9.6 8.1
Estonia (2) .. .. .. .. .. 6.5 14.8 11.5 15.7 17.1 17.8
Hungary (3) .. .. .. .. .. .. .. .. .. 17.0 14.9
Israel 5.4 8.0 10.3 12.3 13.7 16.0 17.7 17.5 17.6 17.9 20.9
Lithuania .. .. 74.4 68.5 70.1 78.8 74.1 9.1 10.6 8.8 6.0
Mexico (4) 2.3 2.8 4.5 4.1 3.6 3.6 3.5 3.7 4.5 4.1 3.9
Netherlands 26.9 36.2 45.8 43.5 44.3 45.2 .. 50.9 53.8 52.3 51.1
Norway (3) 16.1 14.2 15.5 14.2 12.0 16.0 15.0 17.1 14.3 10.8 9.9
Poland (5) 0.6 .. .. 0.5 0.8 1.4 7.7 12.2 7.3 6.4 6.1
Portugal (6) 6.6 6.4 4.3 5.0 4.6 6.2 3.9 4.3 3.4 7.4 6.9
Slovak Republic .. .. .. .. .. .. .. 6.2 7.7 7.9 7.2
Slovenia .. .. .. .. .. .. .. 4.1 4.3 5.0 4.0
Sweden (7) 22.3 18.0 15.6 17.1 15.3 16.0 12.1 11.0 10.6 10.1 10.6
Switzerland (3) 25.8 29.0 29.6 29.7 31.4 32.7 34.6 34.6 36.0 36.7 35.3
Turkey (4) 6.2 5.2 .. .. .. .. .. .. .. .. 10.8
Selected other jurisdictions
Botswana .. .. .. .. .. 58.6 .. .. .. .. ..
Bulgaria 50.0 47.1 34.6 37.2 60.2 61.1 69.2 44.4 47.8 58.2 55.7
Colombia .. .. .. .. .. .. .. .. 29.4 32.2 33.1
Costa Rica (8) 7.5 3.4 8.2 13.3 11.5 9.1 9.9 10.4 13.7 22.3 23.7
Croatia (9) .. .. .. .. .. .. 59.3 56.6 53.3 54.8 51.8
Jamaica .. .. .. .. 5.2 6.1 8.1 8.4 9.5 7.9 8.5
Kazakhstan .. .. .. .. .. .. .. .. .. .. 20.0
Namibia .. .. .. .. .. .. 43.3 .. .. .. ..
Nigeria (10) .. .. .. .. .. .. .. .. .. .. 5.1
North Macedonia 29.5 .. 54.4 72.9 63.1 68.8 69.4 73.9 76.4 79.9 74.2
Panama .. .. .. .. .. .. .. .. 0.7 .. ..
Peru 12.4 21.0 26.2 28.6 29.4 35.2 40.6 40.1 37.5 42.5 43.8
Romania .. .. .. 4.3 3.6 2.7 3.9 4.9 9.9 5.1 4.8
Suriname .. .. .. .. .. .. .. .. 28.3 .. ..
Thailand .. .. .. .. .. .. 0.5 0.7 0.8 0.7 0.7
Trinidad and Tobago .. 2.7 .. 3.8 4.0 .. .. .. .. .. ..
Note: Please see the methodological notes at the end of the report.
Source: OECD Global Pension Statistics.

93
PENSION MARKETS IN FOCUS 2019 © OECD 2019
The primary source material for this report is provided by national pension authorities mainly as part of the framework of the OECD Global Pension Statistics (GPS). Data come from official national administrative sources and are revised on an on-going basis so as to better reflect the most recent figures for every past year. Caution should be exercised when interpreting some statistics given possible divergences with national reporting standards and different methods for compiling certain data for the GPS exercise. For this reason, countries are regularly requested to provide methodological information relevant for developing a thorough understanding of their submission under the GPS framework. The general and specific methodological notes below provide some explanations in this respect.
General notes
Conventional signs: "..” means not available. “|” means methodological break in series. This report is mainly based on the answers of national authorities to an annual survey. Statistics
for some jurisdictions come from publicly available reports, databases or websites of other national or international organisations: Japan (Bank of Japan) and Switzerland (Federal Social Insurance Office publication Statistique des assurances sociales suisses for personal plans) among OECD countries; and Bolivia (International Association of Pension Funds Supervision (AIOS)), China (People’s Republic of) (Ministry of Human Resources and Social Security (MOHRSS)), Croatia (website of the Croatian Financial Services Supervisory Agency (HANFA) before 2014), the Dominican Republic (AIOS before 2014), El Salvador (AIOS), Panama (AIOS), Singapore (CPF Board Annual Reports) and Uruguay (AIOS before 2016) among non-OECD jurisdictions.
The statistical data for Israel are supplied by and under the responsibility of the relevant Israeli authorities. The use of such data by the OECD is without prejudice to the status of the Golan Heights, East Jerusalem and Israeli settlements in the West Bank under the terms of International law. Data for Israel refer to old, new and general pension funds only.
The reference period is the calendar year, except for: Australia where the reference period is the financial year ending in June; and New Zealand (until 2014). Data for New Zealand up to 2013 are based on a 31 March balance date for most of the schemes.
Data on pension funds for 2018 are preliminary estimates for Switzerland and the United Kingdom. Data for the year 2018 on occupational pension plans in Switzerland refer to the first trend calculations. The value of pension fund investment in the United Kingdom at the end of 2018 is an early estimate based on the 2017 level of assets and the flow of transactions in 2018, and does not take into account value changes.
The Slovak Republic adopted the euro in 2009, Estonia in 2011, Latvia in 2014 and Lithuania in 2015. The whole time series (in millions of national currency) are expressed in millions of euro for these countries (even before their adoption of the euro).
This report uses five main additional reference series: exchange rates to convert values in US dollars, GDP, the variation of the consumer price index (CPI), population and average annual wages:
Methodological notes

94
PENSION MARKETS IN FOCUS 2019 © OECD 2019
o This report uses end-of-period exchange rates for all variables valued at the end of the year, and period-average rates for variables representing a flow over the year. These rates come from the IMF International Financial Statistics database.
o GDP values for OECD countries are extracted from the OECD Annual National Accounts and Quarterly National Accounts databases. GDP values for non-OECD jurisdictions come from the IMF World Economic Outlook published in April 2019, except for Gibraltar (Abstract of Statistics 2015 of the Statistics Office of Gibraltar), Isle of Man (the National Income Report 2016-17 of the Cabinet Office of Isle of Man) and Liechtenstein (UN National Accounts Main Aggregates Database).
o Consumer price indices are from the OECD Main Economic Indicators database for OECD countries, and from the IMF International Financial Statistics database for non-OECD jurisdictions except for Gibraltar (Abstract of Statistics 2015 of the Statistics Office of Gibraltar) and Papua New Guinea (Asian Development Bank).
o Data on population are from the OECD Labour Force Statistics database for OECD countries and from the World Bank World Development Indicators for all the other jurisdictions.
o Data on average annual wages come from the OECD Economic Outlook (Volume 2019 Issue 1) for OECD countries and from the ILO online database for other jurisdictions.
This report uses data from the Eurosystem Household Finance and Consumption Survey. The results published and the related observations and analysis may not correspond to results or analysis of the data producers.
Specific notes
Figure 1.1:
The maps show the amount of assets in funded and private pension plans in a selection of jurisdictions in 2018, except for Gibraltar (2013), India (2016), Isle of Man (2016), Lesotho (2012), Liechtenstein (2017), Malta (2017), Mauritius (2017), South Africa (2016), Tanzania (2017), Trinidad and Tobago (2012), Uganda (2016) and Zambia (2015).
Figure 1.2:
The geographical distribution is calculated as the amount of total pension assets in a country relatively to the whole OECD area. Data for personal plans for Switzerland refer to 2017 instead of 2018.
Figure 1.3:
The charts show the evolution of assets in funded and private pension plans between 2008 and 2018, except for Finland (2011-2018), Lithuania (2010-2018) and Switzerland (2013-2018) among OECD countries; and Armenia (2014-2018), Brazil (2014-2018), Dominican Republic (2014-2018), Ghana (2014-2018), India (2010-2016), Kosovo (2012-2018), Liechtenstein (2008-2017), Malawi (2013-2018), Maldives (2011-2018), Malta (2011-2017), Mauritius (2012-2017), Namibia (2010-2018), Papua New Guinea (2013-2018), Russia (2013-2018), Singapore (2011-2018), South Africa (2008-2016) and Tanzania (2013-2017) outside the OECD area. The simple and weighted averages in and outside the OECD area are calculated on all reporting jurisdictions. The number of reporting jurisdictions varies between 2008 and 2018. Weights for the calculation of weighted averages are based on assets.
Figure 1.4:
The scatter plot shows the geometric average annual growth rate of assets in pension plans between end-2017 and end-2018 (x-axis) and between end-2008 and end-2018 or over the longest time period available (y-axis) among reporting jurisdictions (labelled with their ISO code). ISO codes are available on the United

95
PENSION MARKETS IN FOCUS 2019 © OECD 2019
Nation Statistics Division internet page, ‘Countries and areas, codes and abbreviations’ at the following address: http://unstats.un.org/unsd/methods/m49/m49alpha.htm. To facilitate the reading, this chart does not include Armenia where pension assets grew by 50% between end-2017 and end-2018, and by 90% per year on average between end-2014 and end-2018.
Figure 1.5:
Totals in a given year are calculated on all the jurisdictions for which a value is available. The number of jurisdictions that the totals include may therefore vary over the years. Totals are expressed in current prices.
Figure 1.6:
Coverage rates are provided with respect to the total working-age population (i.e. individuals aged 15 to 64 years old), except for Germany (employees aged 25 to 64 subject to social insurance contributions), Iceland (Icelandic citizens and foreign workers in Iceland aged between 16 and 64) and Ireland (workers aged between 20 and 69). "QMO" = Quasi-mandatory. "Vol. occ." = Voluntary occupational. "Vol. pers." = Voluntary personal.
Data on personal plans for Austria refer to PZV contracts. For Italy, the coverage rate that is shown under voluntary occupational plans also covers individuals automatically enrolled in a plan. In Korea, the retirement benefit system is mandatory and can take two forms: a severance payment system and an occupational pension plan. The obligation of the employer in Korea is to provide a severance payment system, but, by labour agreement, the company can set up an occupational pension plan instead.
Data refer to 2018 or to the latest year available. Data refer to 2017 for Austria (PZV), Belgium, Canada, France, Iceland (mandatory plans), Turkey (auto-enrolment plans, personal and group personal plans) among OECD countries; and Croatia, Malta among other jurisdictions. Data refer to 2016 for Iceland (voluntary personal plans), Switzerland, Turkey (VASA + Oyak) and the United States among OECD countries; and Maldives, Namibia among other jurisdictions. Data refer to 2015 for Denmark (QMO and personal plans), Ireland, Germany, Korea, Sweden (private pension savings schemes). Data refer to 2014 for New Zealand (superannuation schemes) and Spain.
Figure 1.7:
The variation in the coverage of pension plans is calculated as the difference in the coverage rate in 2018 (or the latest year available) shown in Figure 1.6 and the coverage rate in the first year available, over a minimum period of five years. The first year available is 2008 for all countries except Australia (2010), Denmark (2013 for ATP), Finland (2013), Hungary (2010), Ireland (2009), Lithuania (2010), New Zealand (2009), Slovak Republic (2009) among OECD countries; and Bulgaria (2009), Hong Kong (China) (2009), Jamaica (2012), Maldives (2011), Malta (2012), North Macedonia (2009), Russia (2013) and Serbia (2009) among other jurisdictions.
Figure 1.8:
The contributor rate is calculated as the proportion of individuals who made a contribution to their individual accounts during the last month over the working-age population.
Figure 1.9:
This Figure shows the latest information available unless specified otherwise. The category "Total" shows the cases where the contribution rates cannot be split precisely between employer, employee (and state). (1) Members get contribution credits that are expressed as a percentage of a so-called coordinated salary. Contribution credits vary across age groups, from 7% between 25 and 34 years old up to 18% beyond 55 years old. This chart shows an average of the age-specific rates (7% at ages 25-34, 10% at 35-44, 15% at 45-54 and 18% at 55-64). The employer must pay at least half of these credits, the employee the remainder. Contribution rates may differ from the minimum contribution credits. (2) Contribution rates are

96
PENSION MARKETS IN FOCUS 2019 © OECD 2019
set by the collective agreement and are similar for all workers under the agreement. Contribution rates range between 12% and 18% and tend to increase with income. (3) The contribution rates are shown for private-sector workers. The contribution rates are higher for public sector workers (6.125% for employee and 5.175% for employers). The government supplements the total contribution with a flat-rate amount (the social quota - cuota social). Its amount depends on the salary level for private sector employees. The state contribution here includes the social quota of a private sector worker earning 3 times the minimum wage. (4) The minimum contribution rate is 6% equally split between the employer and employee from 1 April 2013. Members can however select a higher personal contribution rate of 4%, 6% (from April 2019), 8% or 10% (from April 2019) of salary. The government contributes 50 cents for every dollar of member contribution, up to NZD 521.43 annually. (5) Contribution rates to quasi-mandatory occupational plans vary according to the income level: 4.5% for earnings under 7.5 income base amount (IBA) and 30% for earnings over 7.5 IBA for ITP1 and SAF-LO. Contribution rates are shown here for an average earner who has earnings below 7.5 IBA. (6) Data refer to voluntary employment-related plans. (7) Data here do not include the one-time contribution of TRY 1 000 for those who do not opt out within the first two months, nor the additional government contribution (of 5% of the assets accumulated at retirement) if the individual chooses a minimum 10-year annuity at retirement. (8) An employer may choose to bear both the minimum employee and employer contributions. (9) The state matching contribution does not apply to individuals who joined voluntary.
Figure 1.10:
* means 2018 or the latest year available; ** means 2008 or the earliest year available. The time series of total contributions as a % of GDP is available in Annex B. The category "Total" shows the cases where the contributions cannot be split precisely between employer, employee (and state). (1) Source: CNB ARAD database.
Figure 1.11:
(1) Data refer to pension funds only. (2) Data refer to mandatory plans. (3) Data refer to new and general pension funds. (4) Data refer to KiwiSaver plans only. (5) Data refer to the 2nd pillar only. (6) Data refer to personal plans. (7) Data refer to open pension funds. (8) Data refer to occupational plans. (9) Data refer to ROP.
Figure 1.12:
This Figure shows the total amount of benefits paid by funded and private pension plans as a percentage of GDP in 2018 (or the latest year available), also available in Table A B.5 (please refer to the notes of this Table for more country-specific notes). This Figure shows the breakdown of benefits paid into lump sum payments and pensions when such information is available. This Figure also shows the amount of assets that may be transferred to an insurance company or any another entity (different from the ones in charge of the accumulation phase) which will be in charge of paying benefits to retirees.
Figure 1.13:
This Figure is based on the annual real net investment rates of return reported in the statistical annexes of this publication. Please refer to the notes of these statistical annexes for more country-specific notes. The annual returns are calculated over the period Dec 2017-Dec 2018 except for Australia (June 2017-June 2018). This chart does not include the return for Japan (3.3%), which is an average calculated for the fiscal year 2017 (ending in March 2018) over a sample of plans only.
Table 1.1:
This Table is based on the annual nominal and real net investment rates of return reported in the statistical annexes of this publication. Please refer to the notes of these statistical annexes for more country-specific notes. The 5, 10 and 15-year annual averages are calculated over the periods Dec 2013-Dec 2018, Dec
97
PENSION MARKETS IN FOCUS 2019 © OECD 2019
2008-Dec 2018 and Dec 2003-Dec 2018 respectively, except for Australia (June 2013-June 2018, June 2008-June 2018 and June 2003-June 2018).
Figure 1.14:
The "Other" category includes loans, land and buildings, unallocated insurance contracts, hedge funds, private equity funds, structured products, other mutual funds (i.e. not invested in equities, bills and bonds or cash and deposits) and other investments. Negative values (due to derivatives) have been excluded from the calculations of the allocation of pension assets. The GPS database gathers information on investments of pension plan assets in Collective Investment Schemes (CIS) and the look-through of these investments in equities, bills and bonds, cash and deposits and other. Data on asset allocation in this Figure include both direct investment in equities, bills and bonds, cash and deposits and indirect investment through CIS when the look-through of CIS investments is available. In such case, the Figure shows the overall exposure of pension assets in the selected asset classes. When the look-through is not available, the Figure only shows the direct investments of pension plan assets in equities, bills and bonds and cash and deposits and other assets, and investments in collective investment schemes are shown in a separate category. This Figure is based on the allocation of pension assets reported in the statistical annexes of this report. Please refer to the notes of these statistical annexes for more country-specific notes.
Figure 1.15:
This Figure is based on the allocation of pension assets reported in the statistical annexes of this report. This Figure shows the variation in equity and bond investments in 66 jurisdictions between 2017 and 2018 (Panel A) and 55 jurisdictions over the longest time period possible (at least over 3 years) (Panel B). Israel, Poland, Botswana, Kenya, Nigeria, Romania, Russia and Zambia are excluded from this Figure given the change in reporting of investments in CIS and the related look-through over the years.
Figure 1.17:
This Figure is based on the share of pension plan assets invested abroad and in foreign currencies reported in the statistical annexes of this report. Please refer to the notes of these statistical annexes for more country-specific notes.
Figure 1.18:
Data in Panel A refer to 2008 for all countries except Finland (2011), France (2009), Iceland (2009), Latvia (2009), Lithuania (2010), Poland (2013), Switzerland (2013) and Turkey (2011) among OECD countries; Albania (2012), Armenia (2014), Brazil (2014), Costa Rica (2015), Croatia (2014), Dominican Republic (2014), Guyana (2015), Maldives (2011), Namibia (2010) and Nigeria (2009) among other jurisdictions. Data in Panel B refer to 2018 for all countries except Australia (2013), Canada (2015), Finland (2015), France (2017), New Zealand (2013), Switzerland (2017), Turkey (2016) among OECD countries; and Namibia (2016) among other jurisdictions. (1) Data about Collective Voluntary Pension Savings that are managed by the AFPs are classified together with personal plans, although these plans are occupational. (2) There is one institution for occupational retirement provision operating in Hungary. Its market share is negligible compared to other pension providers administering personal pension plans.
Figure 1.19:
LHS: left-hand side axis. RHS: right-hand side axis. The funding ratio has been calculated as the ratio of total investment and net technical provisions for occupational DB plans managed by pension funds using values reported by national authorities in the OECD questionnaire. The ratios may differ from previous publications which included results calculated directly by national authorities or coming from publications.
Data for Finland refer to DB plans in pension funds only. Data for Luxembourg refer to DB traditional plans under the supervision of the CSSF. All liabilities of DB plans (instead of technical provisions only) are considered for Mexico (DB plans in pension funds only) and the United States. Data for the Netherlands

98
PENSION MARKETS IN FOCUS 2019 © OECD 2019
and Switzerland include all types of pension funds. Data for the United Kingdom come from the Purple Book 2018 published by the Pension Protection Fund and show assets, liabilities valued on a s179 basis (instead of net technical provisions) and the ratio between the two. Liabilities for Hong Kong, China refer to the amount of aggregated past service liability in DB ORSO schemes. Data for Indonesia refer to EPF DB funds and come from OJK Pension Fund Statistics reports before 2016.
Table 1.2:
"x" means that the type of fee does not exist or is not allowed in the country. Rules for Estonia are those prior changes in September 2019. In Portugal, in the specific case of personal retirement saving schemes, transfer fees are subject to a maximum of 0.5% of the transferred amount if there is a capital or return guarantee and cannot be charged otherwise.
Figure 1.20:
(1) Data refer to personal plans only. (2) Data refer to 2017. (3) Data refer to the second pillar only. (4) Data refer to the average management fee for mandatory schemes at the beginning of 2019. Source: Pension Statistics Overview 2018 of the Ministry of Finance. (5) Data refer to pension funds only. (6) Data refer to the state funded pension scheme only. (7) Data refer to open pension funds only. (8) Data refer to fees on mandatory savings and do not include asset management fees. (9) Data refer to new pension funds. (10) Data refer to fees paid by members of entities with more than four members in June 2018. Source: APRA Annual Superannuation Bulletin (June 2018). (11) Data refer to 2016. (12) Data refer to ROP only.
Figure 2.1:
The gender gap in pensions is calculated as the difference between the mean pension income of men and women (aged 65+) over the mean pension income of men (aged 65+), among pension beneficiaries. Calculations are based on HFCS for Belgium, Latvia and Portugal, and on LIS for all the other countries. Data refer to the latest year available, which is 2005 for Sweden, 2010 for France, Iceland and Ireland, and after 2010 for all the other countries. (1) In Belgium when partner A’s pension rights are less than 25% of those of partner B, the pension of A is not paid out and B receives a family pension (calculated at 75% of wages instead of 60%).
Figure 2.2:
Countries are ranked in the same order as in Figure 2.1.
Figure 2.4:
Panel A1: Circles show the employment rates of men and women in 1990 (or the first year available) while triangles show these rates in 2017 (or the latest year available) for all OECD countries. The white circle and white triangle show the OECD average in 1990 and 2017 respectively. Panel A2: OECD36 refers to the simple average of the share of men and women in part-time employment among OECD countries. Panel A3: The gender wage gap is defined as the difference between male and female median wages divided by the male median wages. OECD36 is the simple average of the gender wage gap among OECD countries.
Figure 2.5:
This chart shows the proportion of men (respectively women) aged 65+ receiving a regular pension income from occupational or personal plans over all men (resp. women) aged 65+. Pensioners who received a lump sum payment were not counted as receiving regular pension payments, unless they purchased an annuity. Data refer to 2014 for all countries, except Estonia (2013), Ireland (2013), Italy (2015) and Portugal (2013).
Table 2.2:

99
PENSION MARKETS IN FOCUS 2019 © OECD 2019
The gender gap in private pensions is only calculated over people aged 65+ who have received a regular pension income from an occupational or personal plan. The gap is calculated as the difference between the mean private pension income of men and women (aged 65+) over the mean private pension income of men (aged 65+) among a selection of countries.
Table 2.3:
The coverage for personal plans represents the share of men (respectively women) having a voluntary pension scheme or holding a life insurance contract.
Figure 2.6:
This chart shows the difference (in percentage points) in the proportion of men covered by an occupational plan and the proportion of women covered by an occupational plan. This proportion is calculated over the working-age population and over the employed population (to account for the employment gender gap).
Figure 2.7:
The sectors follow the NACE Rev 2 Classification.
Figure 2.8:
The gender gap is defined as the difference between men and women's entitlements in all private pension plans (i.e. occupational and voluntary) as a % of men's entitlements. This indicator is calculated over the working-age population. Data for Hungary and Greece refer to the assets in voluntary personal plans only.
Figure 2.9:
This chart shows the average amount of assets in pension plans for men and women in a group of OECD countries on average (on the left-hand side). The chart also shows the difference between this average (of average pension assets) for men and for women (relatively to men). The group of countries included in the calculations are the following ones: Austria, Belgium, Estonia, Finland, France, Germany, Greece, Ireland (except for the age group 16-24), Italy, Latvia (except for the age group 16-24), Luxembourg, the Netherlands, Portugal, the Slovak Republic, Slovenia, Spain (except for the age group 16-24).
Table A A.1:
"Occ.": occupational; "Pers": personal; "DB": defined benefit; "DC": defined contribution. "Fully" means that the OECD Global Pension Statistics exercise covers all the plans of this type for a given country. "Partially" means that the Global Pension Statistics exercise only covers some plans of this type. "Missing" means that this type of plan exists but OECD data do not cover this type of plan. Tables and charts in this report, which are based on the OECD Global Pension Statistics exercise, therefore cover the plans marked as "Fully" and "Partially", unless specified otherwise in the notes of a specific table or figure. Data for Germany refer to Pensionskassen and Pensionsfonds only. See the metadata file available on the OECD webpage for a full and detailed description of all types of funded and private pension plans in the countries participating in the OECD/IOPS/World Bank Global Pension Statistics exercise.
Table A B.1 - Table A B.2 - Table A B.3:
The total amount of investments of providers of funded and private pension plans is taken as a proxy of the total amount of assets in funded and private pension plans. (1) Data refer to Pensionskassen only. (2) The break in series in 2017 is due to the inclusion of individual pension savings, not reported before. (3) The break in series in 2011 comes from the exclusion of public buffer funds, included before. (4) Data on PERCO plans come from the French Asset Management Association. Data on pension insurance contracts for 2018 refer to 2017 instead. (5) The break in series in 2013 comes from the transformation of four funds operating on a pay-as-you-go basis into funded occupational schemes. (6) The drop of investments in 2011 comes from a pension reform that suspended payments to mandatory individual schemes and redirected all the contributions to pay-as-you-go public pension schemes, unless workers chose to keep

100
PENSION MARKETS IN FOCUS 2019 © OECD 2019
these individual pension schemes by the end of January 2011. The break in series in 2016 is due to the inclusion of individual retirement accounts (available through banks and investment companies) and pension insurance products, not included before. (7) Data on personal retirement savings accounts are included from 2014 onwards. The decrease in DC assets for Ireland in 2016 arose from a change in methodology (previously estimation based on industry reports). Estimates are now based on the aggregation of data submitted on an annual basis to the pensions supervisor by individual DC schemes. (8) Data include book reserves, with net technical provisions taken as a proxy of pension assets. (9) Data refer to pension funds only. (10) The drop in investments in 2014 is due to the reversal of the mandatory private pension system that led to a transfer of domestic sovereign bonds held by open pension funds into the social security system. (11) The drop of investments in 2011 is the result of the transfer of bank pension funds (i.e. pension funds sponsored by banks and having as beneficiaries the employees of their banks) to the Public Retirement System. Data cover closed and open pension funds and personal retirement saving funds (established as pension funds or as collective investment schemes managed by investment companies), and since 2017 personal plans offered by life insurance companies as well. (12) Data cover occupational plans, and personal plans from 2013 onwards. Data on personal plans for 2018 refer to 2017 instead. (13) Data refer to personal plans only. (14) The break in series in 2011 is due to a change in legislation, withdrawals and the unavailability of data from one of the three funds that was operating under the old framework. (15) The break in series in 2014 is due to the inclusion of open entities (under the supervision of SUSEP), not included before. (16) Data include occupational plans from 2015 onwards. (17) Data include pension insurance companies in 2018, which is not the case for previous years. (18) Source: AIOS (up to 2013). Data from 2014 include occupational plans. (19) Data for one DB pension scheme is missing for 2014, hampering the data comparability with previous years. (20) Source: Annual reports of the Securities Commission Malaysia. Data refer to the Private Retirement Schemes (PRS) under the supervision of the Securities Commission Malaysia only. (21) Data refer to some occupational voluntary pension schemes only. (22) Data cover all the accounts of the CPF, which may not all be earmarked for retirement purposes (e.g. the Medisave account). (23) Totals in a given year are calculated on all the countries for which a value is available. The number of countries that the totals include may therefore vary over the years.
Table A B.4:
(1) Data refer to Pensionskassen only. (2) Data refer to IORPs only. (3) Data refer to trusteed pension funds only. Source: Statistics Canada (Table:11-10-0079-01). (4) Data refer to contributions paid into AFPs only. (5) Source: CNB ARAD database. Data include employer, employee and state contributions. (6) Data refer to contributions paid into pension funds and pension insurance contracts only. (7) Data refer to contributions paid into mandatory plans only. From mid-2009 to 2011, the State temporarily suspended contributions to these plans. (8) Source: DREES. (9) The break in series in 2013 comes from the transformation of four funds operating on a pay-as-you-go basis into funded occupational schemes. (10) Data refer to contributions paid into pension funds only. The drop in the contributions in 2011 comes from a pension reform which suspended payments to the mandatory funded individual schemes and redirected all the contributions to pay-as-you-go public pension schemes, unless workers chose to keep these individual schemes by the end of January 2011. (11) Contributions paid for pension insurance contracts for 2017 and 2018 refer to 2016 instead. In 2017, the municipalities and the government made an extra contribution to the pension fund of civil servants which was converted from DB to DC. (12) Data refer to pension funds and pension insurance contracts only. (13) Data refer to employer, employee and state contributions into KiwiSaver plans for each financial year. (14) Data refer to pension funds only. (15) The decline in contributions in 2012 is likely due to a reduction of the contribution rate to open pension funds from 7.3% to 3.5% of salary following an amendment of the pension law in May 2011. Since 2014, participation in the funded pension system is voluntary. (16) Data cover closed and open pension funds and personal retirement saving funds (established as pension funds or as collective investment schemes managed by investment companies), and since 2017 personal plans offered by life insurance companies as well. (17) The decline in contributions between 2012 and 2013 is due to a change in the contribution

101
PENSION MARKETS IN FOCUS 2019 © OECD 2019
rates (from 9% to 4% of salary). (18) Data refer to contributions paid into pension funds and book reserves. Data for book reserves for 2018 refer to 2017 instead. (19) Data refer to mandatory plans only. (20) Data refer to personal plans only. (21) Data refer to contributions paid into occupational plans and IRAs. (22) Data refer to contributions paid into closed pension funds only. (23) Data include occupational plans from 2015 onwards. (24) Data include pension insurance companies in 2018, which is not the case for previous years. (25) Data for one DB pension scheme is missing for 2014, hampering the data comparability with previous years. (26) Data refer to the Private Retirement Schemes (PRS) under the supervision of the Securities Commission Malaysia only. (27) Data refer to some occupational voluntary pension schemes only. (28) Source: FSCA Annual Reports. Data cover all retirement funds in South Africa.
Table A B.5:
Benefits refer to the sum of lump sum and pensions paid by funded and private pension plans in a given year. (1) Data refer to Pensionskassen only. (2) Data refer to IORPs only. (3) Data refer to trusteed pension funds only. Source: Statistics Canada (Table:11-10-0079-01). (4) Data refer to benefits paid by AFPs only. (5) Data refer to benefits paid by pension funds and pension insurance contracts only. (6) Data refer tobenefits paid by mandatory plans only. (7) Data refer to benefits paid by pension funds only. (8) Source:DREES. (9) The break in series in 2013 comes from the transformation of four funds operating on a pay-as-you-go basis into funded occupational schemes. (10) Benefits paid from pension insurance contractsfor 2017 and 2018 refer to 2016 instead. (11) Data refer to benefits paid by pension funds and bookreserves only. (12) Data cover closed and open pension funds and personal retirement saving funds(established as pension funds or as collective investment schemes managed by investment companies),and since 2017 personal plans offered by life insurance companies as well. (13) Data refer to benefits paidby pension funds and book reserves. Data for book reserves for 2018 refer to 2017 instead. (14) Data referto personal plans only. (15) Data refer to benefits paid by occupational plans and IRAs. (16) Data refer tobenefits paid by closed pension funds only. (17) Data include occupational plans from 2015 onwards. (18)Data for one DB pension scheme is missing for 2014, hampering the data comparability with previousyears. (19) Data refer to MPF schemes only. (20) Data refer to some occupational voluntary pensionschemes only. (21) Source: FSCA Annual Reports. Data cover pensions and lump sum payments (onretirement or death) by all retirement funds in South Africa.
Table A B.6 - Table A B.7:
Data have been calculated using a common formula for the average nominal net investment return (ratio between the net investment income at the end of the year and the average level of assets during the year) for all the jurisdictions except for: Austria (2011-2012), Finland (2015), France, Ireland, Israel, Japan, the Netherlands (2018), Sweden, Turkey (2011, 2013-2014, 2016) and the United States among OECD countries; and Armenia (2014), Ghana, Hong Kong (China), India (2011, 2013-2014), Kenya (2011), Malawi (2013), Maldives (2015-2016), Malta (2011), Mauritius, Namibia (2016), Pakistan (2017), Papua New Guinea (2017), Romania (2010), Russia (2013), Suriname (2016), Tanzania (2015), Ukraine (2010, 2017-2018) and Zambia (2014) for which values have been provided by the jurisdictions or are from national official publications. Data for Bolivia, the Dominican Republic, El Salvador, Panama and Uruguay (before 2016) are from AIOS. Returns for the year N are calculated over the period end-December of year N-1 and end-December of year N for all countries, except: Australia (over end-June N-1 and end-June N);Japan and New Zealand (over end-March N-1 and end-March N). The average real net investment returnsare calculated using the nominal rate of return (as described above) and the variation of the consumerprice index over the relevant period. National authorities may produce their own estimates of annualinvestment returns that may differ from OECD estimates (due to different methodologies or scopes forinstance). (1) Data refer to Pensionskassen only. (2) Data refer to IORPs only. (3) Data refer to trusteedpension funds only. (4) Data refer to AFPs only. (5) Data refer to pension funds and pension insurancecontracts only. (6) Data refer to mandatory plans only. (7) Data refer to pension funds only. (8) Source:AFG. Data refer to PERCO plans only. (9) Data refer to new pension funds only. (10) Investment returnsare net of taxes. (11) Data for 2017 and 2018 refer to the end of March and represent an average calculated

102
PENSION MARKETS IN FOCUS 2019 © OECD 2019
over a sample of DB plans for the fiscal years 2016 and 2017 respectively. (12) Data refer to personal plans only. (13) Data refer to pension funds and book reserves only. (14) OECD estimates differ from the results of Turkey's own calculations (available at: https://egm.org.tr/data-center/individual-pension-system-progress-reports/). (15) Data refer to MPF schemes only. (16) Data for 2015 and 2016 refer to the investment fund of the Maldives Retirement Pension Scheme. (17) Results are provided by a national authority, calculated over a sample of plans that changes over the years. (18) Data refer to pension funds supervised under the Pension Funds Act only.
Table A B.8 - Table A B.9 - Table A B.10 - Table A B.11:
The "Other" category includes loans, land and buildings, unallocated insurance contracts, hedge funds, private equity funds, structured products, other mutual funds (i.e. not invested in equities, bills and bonds or cash and deposits) and other investments. Negative values (due to derivatives) have been excluded from the calculations of the allocation of pension assets. The GPS database gathers information on investments of pension plan assets in Collective Investment Schemes (CIS) and the look-through of these investments in equities, bills and bonds, cash and deposits and other. Data on asset allocation in the Tables include both direct investment in equities, bills and bonds, cash and deposits and indirect investment through CIS when the look-through of CIS investments is available. In such case, the Tables show the overall exposure of pension assets in the selected asset classes. When the look-through is not available, the Tables only show the direct investments of pension plan assets in equities, bills and bonds and cash and deposits and other assets. The sum of investments in these four categories is not equal to 100% and the difference to 100% corresponds to the share of pension plan assets invested in collective investment schemes. There has been a change in the reporting of investments in CIS and the related look-through over the period for Israel, Poland, Botswana, Kenya, Nigeria, Romania, Russia and Zambia. (1) Data refer to Pensionskassen only. (2) The break in series in 2017 is due to the inclusion of individual pension savings, not reported before. (3) Data refer to pension funds only. (4) Data refer to pension funds and pension insurance contracts. (5) Data refer to mandatory plans only. (6) Source: AFG. Data refer to PERCO plans only. (7) Data for Germany are estimates; the breakdown of investments through CIS has not been approved by external auditors yet and is not available for Pensionsfonds. (8) Data do not include the allocation of assets of pension insurance contracts. (9) Data for Ireland only refer to DB plans. (10) Source: Bank of Japan. Claims of pension funds on pension managers are excluded from the calculations of the asset allocation of Japan’s pension funds. The high value for the “Other” category in Japan is mainly driven by outward investments in securities. (11) Data cover closed and open pension funds and personal retirement saving funds (established as pension funds or as collective investment schemes managed by investment companies), and since 2017 personal plans offered by life insurance companies as well. (12) Data refer to personal plans only. (13) Data refer to closed pension funds only. (14) Data include occupational plans from 2015 onwards. (15) Data include pension insurance companies in 2018, which is not the case for previous years. (16) Data for one DB pension scheme is missing for 2014, hampering the data comparability with previous years. (17) Data for Hong Kong (China) cover MPF schemes and MPF-exempted ORSO registered schemes only. (18) Source: CPF Annual reports. (19) Data refer to pension funds supervised under the Pension Funds Act only.
Table A B.12:
(1) Data refer to pension funds only. (2) Data refer to ATP and pension insurance contracts. (3) Data referto mandatory plans only. (4) Data for pension insurance contracts for 2017 and 2018 refer to 2016. (5)Data refer to pension funds only and exclude investments in unallocated insurance contracts. (6) Source:Bank of Japan. Claims of pension funds on pension managers excluded. Data refer to outward investmentsin securities and refer to investments by residents in shares and securities issued by non-residentsoverseas or in Japan. (7) Data refer to pension insurance contracts only. (8) Data refer to open pensionfunds only. (9) Data cover closed and open pension funds and personal retirement saving funds(established as pension funds or as collective investment schemes managed by investment companies),and since 2017 personal plans offered by life insurance companies as well. (10) Data refer to personal

103
PENSION MARKETS IN FOCUS 2019 © OECD 2019
plans only. (11) Data refer to closed pension funds only. (12) Data include occupational plans from 2015 onwards. (13) Data include pension insurance companies in 2018, which is not the case for previous years. (14) Data refer to MPF schemes and MPF exempted ORSO registered schemes only. (15) Data refer toDB schemes only. (16) Data include bonds of the European Bank for Reconstruction and Development,which have been issued in Serbia and are denominated in RSD. (17) Data refer to funds under thesupervision of the Pension Funds Act.
Table A B.13:
(1) Data refer to Pensionskassen only. (2) Data refer to mandatory plans only. (3) Data refer to pensionfunds only. (4) Data refer to personal plans only. (5) Data refer to open pension funds only. (6) Data coverclosed and open pension funds and personal retirement saving funds (established as pension funds or ascollective investment schemes managed by investment companies), and since 2017 personal plansoffered by life insurance companies as well. (7) Data refer to pension insurance contracts only. (8) Datainclude occupational plans from 2015 onwards. (9) Data include pension insurance companies in 2018,which is not the case for previous years. (10) Data refer to DB schemes only.


www.oecd.org/daf/fin/private-pensions/


