Coca-Cola And Pepsi Ramjee Prasad 10804900 RH6802B54 B.Tech ECE LEET(3 rd Year) Coca Cola Pay Exercised Index Membership: Dow Jones Composite Do w Industrials S&P 100 S&P 500 S&P 1500 Super Comp $ 0 Sector: Consumer Goods $ 0 Industry: Beverages - Soft Drinks $ 0 Employees (last reported count): 92,400 $ 0 Mr. Alexander Benedict Cummings Jr., 52 Chi ef Admin. Officer, Exec. VP and Chief Operat ing Off icer of Afr ica Group $ 1.59M $ 0 History The Coca Cola history extends back to 1885, when John Pemberton invented the original recipe for a new cocawine. He named it Pemberton's French Wine Coca, which was believed to be inspired by Vin Mariani, a popular cocawine invented by Angelo Mariani. Pemberton developed Coca-Cola, a non-a lcoholic versio n of his origi nal cocawine, when Fulton County passed proh ibition legislati on. Carbonated water was added later by accident when Pemberton was mixing drinks for a friend and incidenta lly included it. His fri ends loved the new taste, so he alt ered the ori gin al for mula to incorporate it. This made the first big break in Coca Cola history. Candler incorporated The Coca-Cola Company in 1982, and began marketing the product. The drink achieved the status of national icon for the USA by its 50th anniversary. Bottles of Coca-Cola were sold starting in 1894, and cans in 1955. The first bottle was sold in Vicksburg, Mississippi. In 1899, Chattanooga, Tennessee became the first site of a Coca-Cola bottling company.
Dow Jones CompositeDow IndustrialsSampP 100SampP 500SampP 1500 Super Comp
$ 0
Sector Consumer Goods $ 0
Industry Beverages - Soft Drinks $ 0
Employees (last reported count) 92400 $ 0
Mr Alexander Benedict Cummings Jr 52Chief Admin Officer Exec VP and Chief Operating Officer of AfricaGroup
$ 159M $ 0
HistoryThe Coca Cola history extends back to 1885 when John Pemberton invented the original recipe for a
new cocawine He named it Pembertons French Wine Coca which was believed to be inspired byVin Mariani a popular cocawine invented by Angelo Mariani Pemberton developed Coca-Cola anon-alcoholic version of his original cocawine when Fulton County passed prohibition legislationCarbonated water was added later by accident when Pemberton was mixing drinks for a friend andincidentally included it His friends loved the new taste so he altered the original formula toincorporate it
This made the first big break in Coca Cola history Candler incorporated The Coca-Cola Company in1982 and began marketing the product The drink achieved the status of national icon for the USA byits 50th anniversary Bottles of Coca-Cola were sold starting in 1894 and cans in 1955 The first
bottle was sold in Vicksburg Mississippi In 1899 Chattanooga Tennessee became the first site of aCoca-Cola bottling company
In Pembertons original formula he added five ounces of coca leaf (cocaine) per gallon of syrupCandler claimed that he altered the formula and only added a tenth of the amount Coca Cola oncecontained an estimate of nine milligrams of cocaine per glass It wasnt until 1903 that it was removedfrom the drink altogether replacing it with coca flavoring
New Coke came out in 1985 after Coca-Cola attempted to change the original formula Mostconsumers preferred the taste of the original Coca-Cola and many ceased purchasing the productuntil the company switched back to the original formula It was renamed Coca Cola Classic to showconsumers that the drink had reverted back to its original formula
By the 21st century Coca Cola history took another leap in the market In 2005 the companylaunched Diet Coke sweetened with artificial flavors Later in 2005 it announced Coca ColaZero sweetened with aspartame and acesulfame potassium Since then the company has producedother products containing the same Coca-Cola formula with minor differences
Coca Cola is now being sold around the world in more than 200 different countries The Coca-Colacompany now sponsors an assortment of events including the Olympic Games and NASCAR In
England it is the primary sponsor of The Football League It is also featured in several televisionshows including The Gods Must Be Crazy
Coca Cola history has come a long way since Pemberton invented the originalrecipe and continues to grow by leaps and bounds It is no surprise that it is oneof the leading soft drinks of the market
Increase or Decrease in Inventory acirceurordquo acirceurordquo acirceurordquo acirceurordquo acirceurordquoIncrease or Decrease in Accounts acirceurordquo acirceurordquo acirceurordquo acirceurordquo acirceurordquo
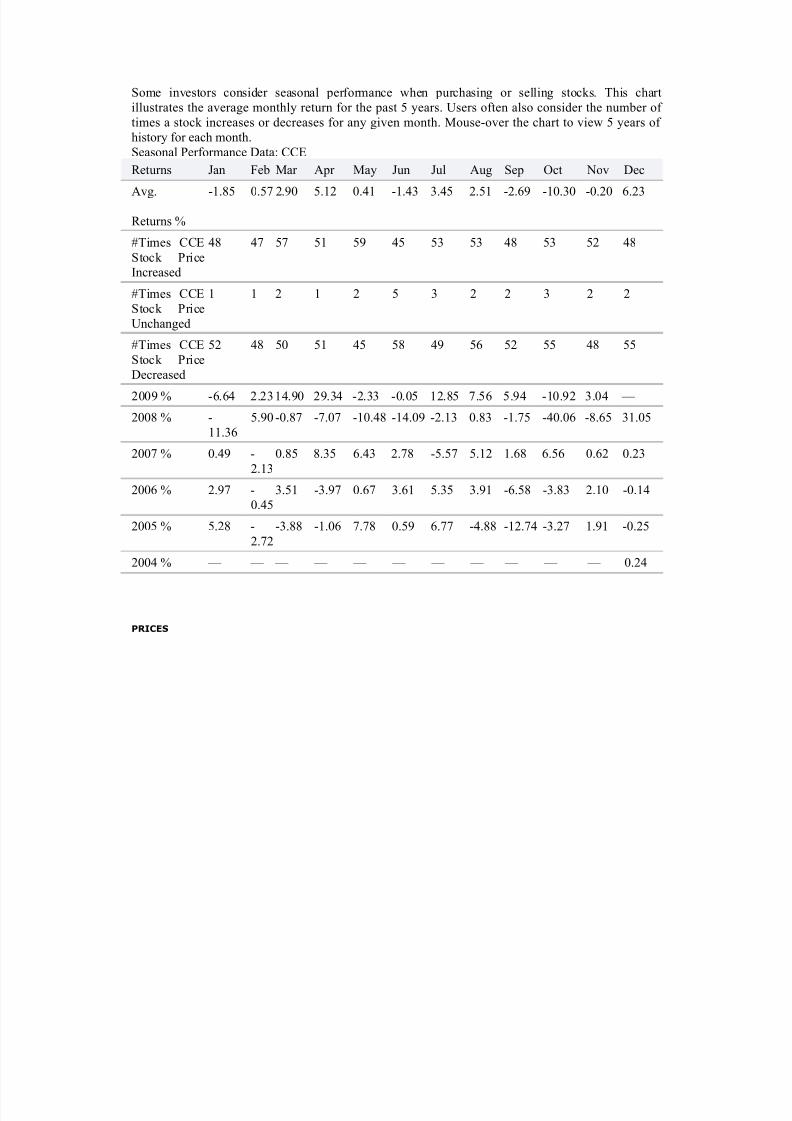
Some investors consider seasonal performance when purchasing or selling stocks This chartillustrates the average monthly return for the past 5 years Users often also consider the number of times a stock increases or decreases for any given month Mouse-over the chart to view 5 years of history for each monthSeasonal Performance Data CCE
Returns Jan Feb Mar Apr May Jun Jul Aug Sep Oct Nov DecAvg
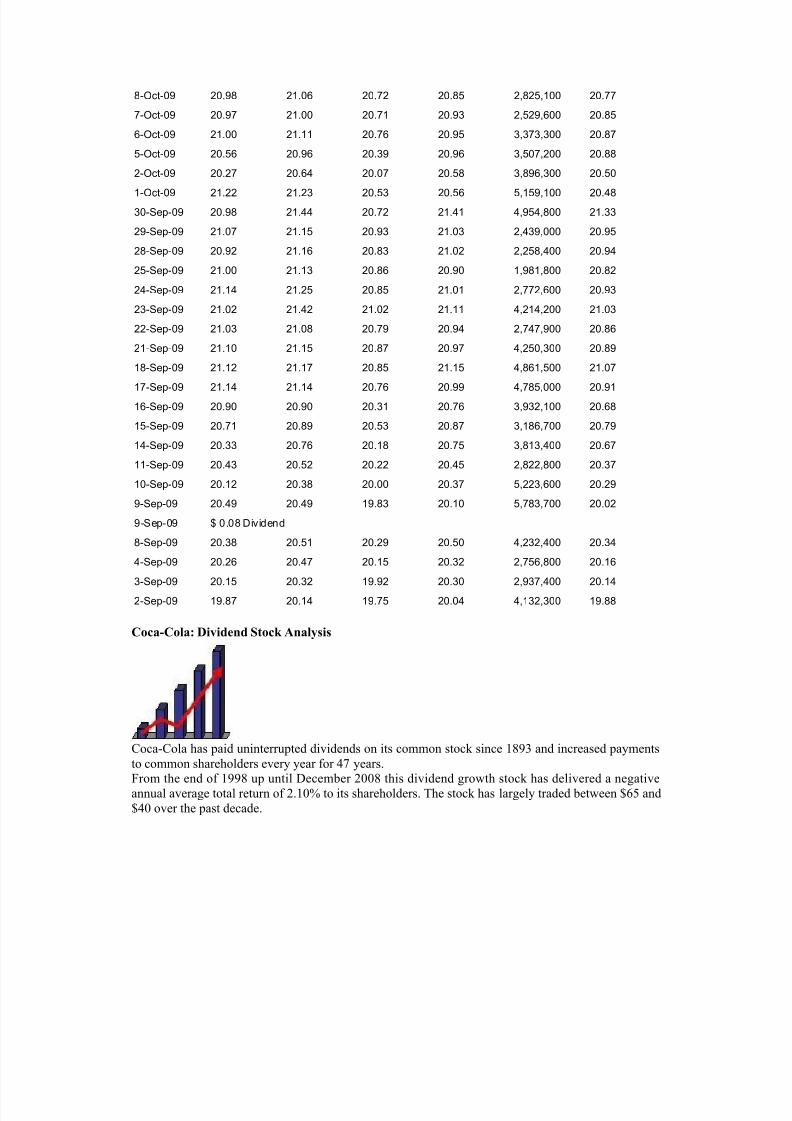
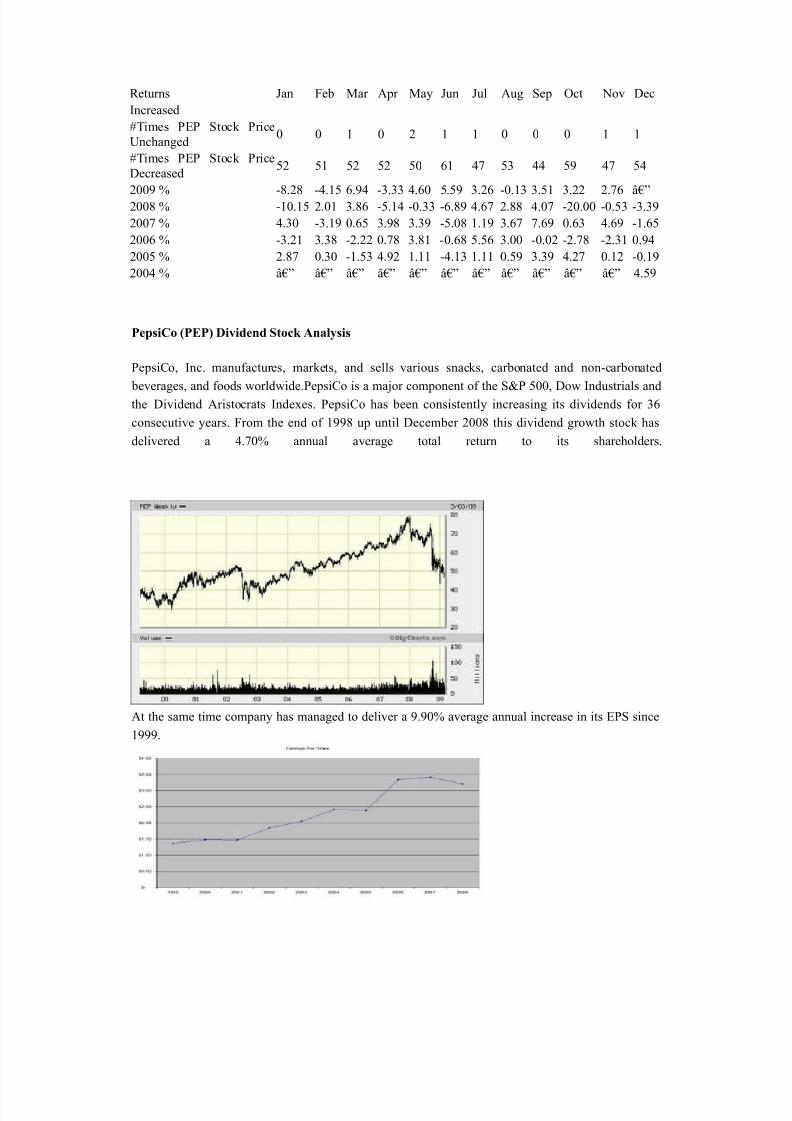
Coca-Cola has paid uninterrupted dividends on its common stock since 1893 and increased paymentsto common shareholders every year for 47 yearsFrom the end of 1998 up until December 2008 this dividend growth stock has delivered a negativeannual average total return of 210 to its shareholders The stock has largely traded between $65 and$40 over the past decade
The company has managed to deliver a 1090 average annual increase in its EPS between 1999 and2008 Analysts are expecting an increase in EPS to $305-$310 for 2009 and $325-$330 by 2010This would be a nice increase from the 2008 earnings per share of $249 Future drivers for earningscould be the companyrsquos tea coffee and water operations Cost savings initiatives could also add to the
bottom line over time
Some analysts believe that Coca Cola could follow arch rival Pepsi Corsquos (PEP) moves to acquire itsown bottlers in an effort to gain more control over the production and distribution of its beverages inkey markets Coke holds a 35 interest in its largest manufacturer and distributor of Coca Cola
products Coca-Cola Enterprises In (CCE) Coca-Cola Enterprises Inc accounts for about 40 of Cokersquos concentrate sales and 16 of the companyrsquos worldwide volume which makes it a likely targetof acquisition should Coca Cola decide to follow Pepsi Corsquos strategy of buying back its bottlingoperations
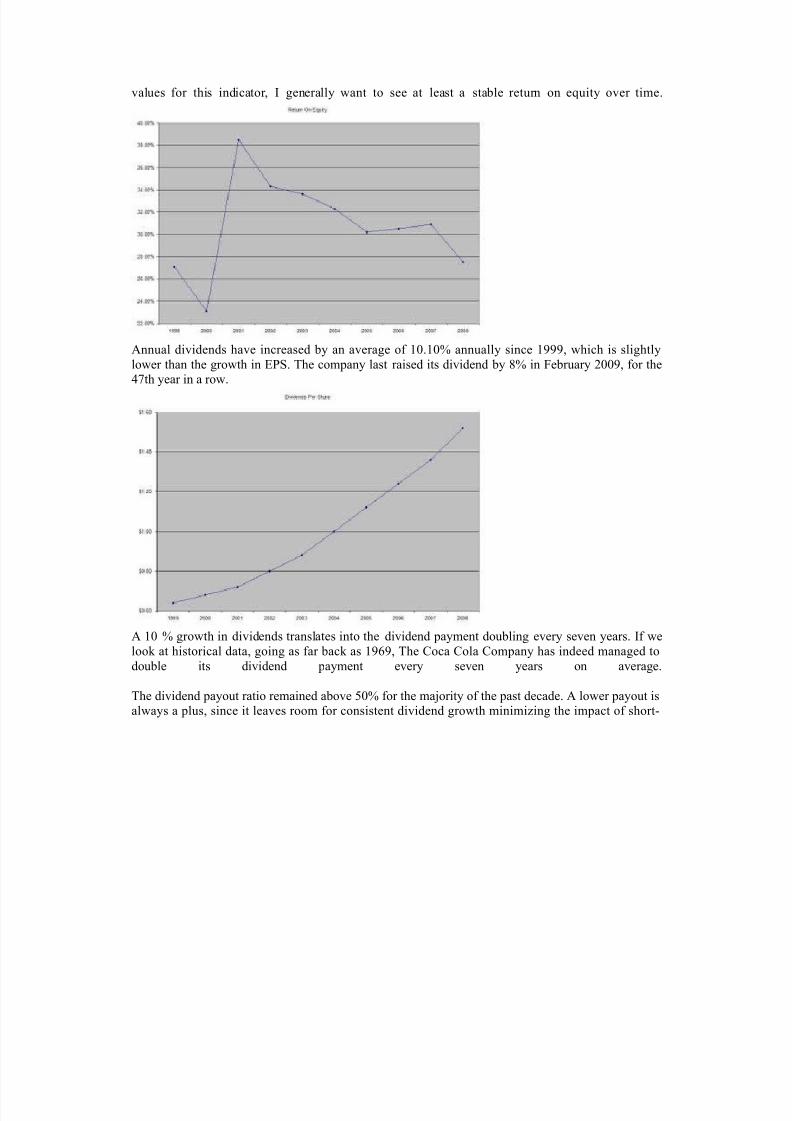
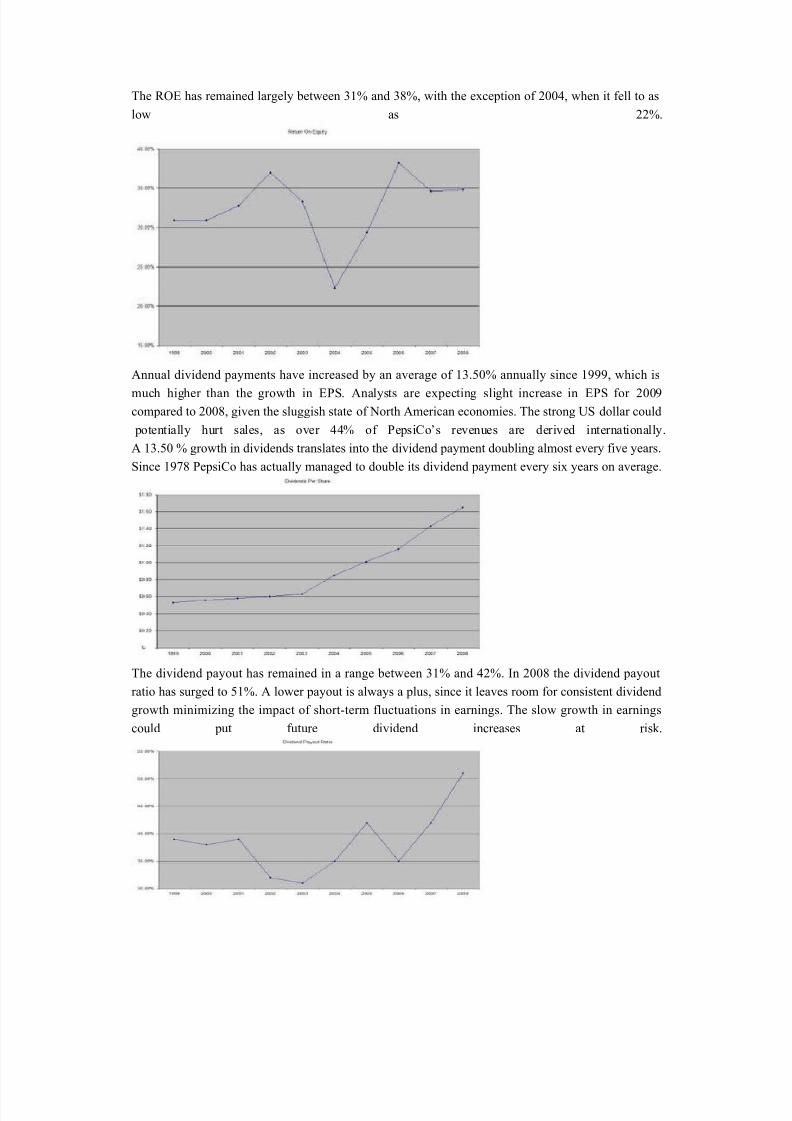
The Return on Equity has been in a decline after hitting a high in 2001 Rather than focus on absolute
values for this indicator I generally want to see at least a stable return on equity over time
Annual dividends have increased by an average of 1010 annually since 1999 which is slightlylower than the growth in EPS The company last raised its dividend by 8 in February 2009 for the47th year in a row
A 10 growth in dividends translates into the dividend payment doubling every seven years If welook at historical data going as far back as 1969 The Coca Cola Company has indeed managed todouble its dividend payment every seven years on average
The dividend payout ratio remained above 50 for the majority of the past decade A lower payout isalways a plus since it leaves room for consistent dividend growth minimizing the impact of short-
Currently Coca Cola is trading at 20 times earnings and yields 330 In comparison arch rival in thecola wars Pepsi Co trades at a PE multiple of 165 and yields 340 Check my analysis of Pepsi Co
I believe that The Coca Cola Company is not as attractively valued at the moment as Pepsi Co Iwould consider adding to my position there if it can cover its dividends at least two times by itsearnings by the end of the year and if the PE ratio doesnrsquot increase above 20COCA COLA ENTERPRISES INC Dividends amp Splits
Coca-ColaFantaDr Pepper Sprite (soft drink)Irn BruCola TurkaBig Cola
History
Pepsi is a carbonated soft drink produced and manufactured by PepsiCo It is sold in many placessuch as retail stores restaurants schools cinemas and from vending machines The drink was firstmade in the 1890s by pharmacist Caleb Bradham in New Bern North Carolina The brand wastrademarked on June 16 1903 There have been many Pepsi variants produced over the years since1898
In October 2008 Pepsi announced that it would be redesigning its logo and re-branding many of its products by early 2009 In 2009 Pepsi Diet Pepsi and Pepsi Max began using all lower-case fonts for name brands and Diet Pepsi Max was re-branded as Pepsi Max The brands blue and red globetrademark became a series of smiles with the central white band arcing at different angles
depending on the product Pepsi in countries such as the US Canada Brazil Bolivia Guatemala Nicaragua Honduras El Salvador Colombia Argentina Puerto Rico and Australia is carrying thesmile logo while the rest of the countries continue to use the old design on all packagingIn mid-September 2009the new logo has started to appear on 300 and 600ml bottles of Pepsi inAustralia Pepsi Max bottles still carry the current logo as of 27th September
Large Block Holder Type Number
Institutions 1764 Total Number of Shares Held156 B of Shares Owned by all Large Block Holders10000
Though carbonated soft drinks remain the most popular beverage PEP recognizes that non-carbonated soft drinks are a faster growing category The company is focusing on the health andwellness trends It has eliminated trans fats from many of its snack foods and is introducing ldquogoodforyourdquo foods under the Quaker Oats brand Risks include the highly competitive and very maturenature of it products also with more exposure to foreign markets political and currency risks alsoincrease
Conclusion PEP did not earn any Stars in the Fair Value section earned two Stars in the DividendAnalytical Data section and earned one Star in the Dividend Income vs MMA section for a total of three Stars This quantitatively ranks PEP as a 3 Star-Hold
Using my D4L-PreScreenxls model I determined the share price could increase to $6562 beforePEPrsquos NPV MMA Differential fell to the $500 that I like to see for a stock with 37 consecutive yearsof dividend increases At that price the stock would yield 270
Resetting the D4L-PreScreenxls model and solving for the dividend growth rate needed to generatethe target $500 NPV MMA Differential the calculated rate is 63 This dividend growth rate is
lower than the the 76 used in this analysis thus providing a margin of safety PEP has a risk rating of 100 which classifies it as a low risk stock
Like its competition Coca-Cola (KO) PEPrsquos Free Cash Flow Payout currently at 70 tends toremain higher than the 60 level that I prefer However this is mitigated to an extent by relativelylow debt levels and predictable cash flows PEP is a stock I will buy as my allocation allows andwhen it dips below its buy price of $5510 For additional information including the stockrsquos dividendhistory please refer to its data page
Stock price of last five years with monthly price list
In Pembertons original formula he added five ounces of coca leaf (cocaine) per gallon of syrupCandler claimed that he altered the formula and only added a tenth of the amount Coca Cola oncecontained an estimate of nine milligrams of cocaine per glass It wasnt until 1903 that it was removedfrom the drink altogether replacing it with coca flavoring
New Coke came out in 1985 after Coca-Cola attempted to change the original formula Mostconsumers preferred the taste of the original Coca-Cola and many ceased purchasing the productuntil the company switched back to the original formula It was renamed Coca Cola Classic to showconsumers that the drink had reverted back to its original formula
By the 21st century Coca Cola history took another leap in the market In 2005 the companylaunched Diet Coke sweetened with artificial flavors Later in 2005 it announced Coca ColaZero sweetened with aspartame and acesulfame potassium Since then the company has producedother products containing the same Coca-Cola formula with minor differences
Coca Cola is now being sold around the world in more than 200 different countries The Coca-Colacompany now sponsors an assortment of events including the Olympic Games and NASCAR In
England it is the primary sponsor of The Football League It is also featured in several televisionshows including The Gods Must Be Crazy
Coca Cola history has come a long way since Pemberton invented the originalrecipe and continues to grow by leaps and bounds It is no surprise that it is oneof the leading soft drinks of the market
Increase or Decrease in Inventory acirceurordquo acirceurordquo acirceurordquo acirceurordquo acirceurordquoIncrease or Decrease in Accounts acirceurordquo acirceurordquo acirceurordquo acirceurordquo acirceurordquo
Some investors consider seasonal performance when purchasing or selling stocks This chartillustrates the average monthly return for the past 5 years Users often also consider the number of times a stock increases or decreases for any given month Mouse-over the chart to view 5 years of history for each monthSeasonal Performance Data CCE
Returns Jan Feb Mar Apr May Jun Jul Aug Sep Oct Nov DecAvg
Coca-Cola has paid uninterrupted dividends on its common stock since 1893 and increased paymentsto common shareholders every year for 47 yearsFrom the end of 1998 up until December 2008 this dividend growth stock has delivered a negativeannual average total return of 210 to its shareholders The stock has largely traded between $65 and$40 over the past decade
The company has managed to deliver a 1090 average annual increase in its EPS between 1999 and2008 Analysts are expecting an increase in EPS to $305-$310 for 2009 and $325-$330 by 2010This would be a nice increase from the 2008 earnings per share of $249 Future drivers for earningscould be the companyrsquos tea coffee and water operations Cost savings initiatives could also add to the
bottom line over time
Some analysts believe that Coca Cola could follow arch rival Pepsi Corsquos (PEP) moves to acquire itsown bottlers in an effort to gain more control over the production and distribution of its beverages inkey markets Coke holds a 35 interest in its largest manufacturer and distributor of Coca Cola
products Coca-Cola Enterprises In (CCE) Coca-Cola Enterprises Inc accounts for about 40 of Cokersquos concentrate sales and 16 of the companyrsquos worldwide volume which makes it a likely targetof acquisition should Coca Cola decide to follow Pepsi Corsquos strategy of buying back its bottlingoperations
The Return on Equity has been in a decline after hitting a high in 2001 Rather than focus on absolute
values for this indicator I generally want to see at least a stable return on equity over time
Annual dividends have increased by an average of 1010 annually since 1999 which is slightlylower than the growth in EPS The company last raised its dividend by 8 in February 2009 for the47th year in a row
A 10 growth in dividends translates into the dividend payment doubling every seven years If welook at historical data going as far back as 1969 The Coca Cola Company has indeed managed todouble its dividend payment every seven years on average
The dividend payout ratio remained above 50 for the majority of the past decade A lower payout isalways a plus since it leaves room for consistent dividend growth minimizing the impact of short-
Currently Coca Cola is trading at 20 times earnings and yields 330 In comparison arch rival in thecola wars Pepsi Co trades at a PE multiple of 165 and yields 340 Check my analysis of Pepsi Co
I believe that The Coca Cola Company is not as attractively valued at the moment as Pepsi Co Iwould consider adding to my position there if it can cover its dividends at least two times by itsearnings by the end of the year and if the PE ratio doesnrsquot increase above 20COCA COLA ENTERPRISES INC Dividends amp Splits
Coca-ColaFantaDr Pepper Sprite (soft drink)Irn BruCola TurkaBig Cola
History
Pepsi is a carbonated soft drink produced and manufactured by PepsiCo It is sold in many placessuch as retail stores restaurants schools cinemas and from vending machines The drink was firstmade in the 1890s by pharmacist Caleb Bradham in New Bern North Carolina The brand wastrademarked on June 16 1903 There have been many Pepsi variants produced over the years since1898
In October 2008 Pepsi announced that it would be redesigning its logo and re-branding many of its products by early 2009 In 2009 Pepsi Diet Pepsi and Pepsi Max began using all lower-case fonts for name brands and Diet Pepsi Max was re-branded as Pepsi Max The brands blue and red globetrademark became a series of smiles with the central white band arcing at different angles
depending on the product Pepsi in countries such as the US Canada Brazil Bolivia Guatemala Nicaragua Honduras El Salvador Colombia Argentina Puerto Rico and Australia is carrying thesmile logo while the rest of the countries continue to use the old design on all packagingIn mid-September 2009the new logo has started to appear on 300 and 600ml bottles of Pepsi inAustralia Pepsi Max bottles still carry the current logo as of 27th September
Large Block Holder Type Number
Institutions 1764 Total Number of Shares Held156 B of Shares Owned by all Large Block Holders10000
Though carbonated soft drinks remain the most popular beverage PEP recognizes that non-carbonated soft drinks are a faster growing category The company is focusing on the health andwellness trends It has eliminated trans fats from many of its snack foods and is introducing ldquogoodforyourdquo foods under the Quaker Oats brand Risks include the highly competitive and very maturenature of it products also with more exposure to foreign markets political and currency risks alsoincrease
Conclusion PEP did not earn any Stars in the Fair Value section earned two Stars in the DividendAnalytical Data section and earned one Star in the Dividend Income vs MMA section for a total of three Stars This quantitatively ranks PEP as a 3 Star-Hold
Using my D4L-PreScreenxls model I determined the share price could increase to $6562 beforePEPrsquos NPV MMA Differential fell to the $500 that I like to see for a stock with 37 consecutive yearsof dividend increases At that price the stock would yield 270
Resetting the D4L-PreScreenxls model and solving for the dividend growth rate needed to generatethe target $500 NPV MMA Differential the calculated rate is 63 This dividend growth rate is
lower than the the 76 used in this analysis thus providing a margin of safety PEP has a risk rating of 100 which classifies it as a low risk stock
Like its competition Coca-Cola (KO) PEPrsquos Free Cash Flow Payout currently at 70 tends toremain higher than the 60 level that I prefer However this is mitigated to an extent by relativelylow debt levels and predictable cash flows PEP is a stock I will buy as my allocation allows andwhen it dips below its buy price of $5510 For additional information including the stockrsquos dividendhistory please refer to its data page
Stock price of last five years with monthly price list