PEPTIDOMIMETICS TO MIMIC PROTEIN-PROTEIN INTERACTIONS A Dissertation by ZEBIN XIA Submitted to the Office of Graduate Studies of Texas A&M University in partial fulfillment of the requirements for the degree of DOCTOR OF PHILOSOPHY May 2004 Major Subject: Interdisciplinary Engineering
Transcript
PEPTIDOMIMETICS TO MIMIC PROTEIN-PROTEININTERACTIONS
A Dissertation
by
ZEBIN XIA
Submitted to the Office of Graduate Studies ofTexas A&M University
in partial fulfillment of the requirements for the degree of
DOCTOR OF PHILOSOPHY
May 2004
Major Subject: Interdisciplinary Engineering
PEPTIDOMIMETICS TO MIMIC PROTEIN-PROTEININTERACTIONS
A Dissertation
by
ZEBIN XIA
Submitted to Texas A&M Universityin partial fulfillment of the requirements
for the degree of
DOCTOR OF PHILOSOPHY
Approved as to style and content by:
___________________________James C. Rock
(Co-Chair of Committee)
___________________________ ____________________________Kevin Burgess John P. Wagner
(Co-Chair of Committee) (Member)
___________________________ ____________________________Andrew K. Chan Karen Butler-Purry
(Member) (Head of Department)
May 2004
Major Subject: Interdisciplinary Engineering
iii
ABSTRACT
Peptidomimetics to Mimic Protein-Protein Interactions.
(May 2004)Zebin Xia, B.S., Hunan Normal University, P.R.China;
M.S., Nankai University, P.R.China
Co-Chairs of Advisory Committee: Dr. James C. Rock Dr. Kevin Burgess
Quenched Molecular Dynamics (QMD) used to explore molecular
conformations was developed to operate in Insight II platform for two simulation
engines: CHARMm and Discover. Two scripts and procedures were written formolecular minimization, dynamics, minimization of each of several hundred conformers,
and cut off. Experience with Insight II/Discover versus Quanta/CHARMm, and betweenInsight II/CHARMm versus Quanta/CHARMm has taught that the forcefield is the key
factor in QMD studies.
Protein A has been used for the purification of commercial antibodies, but it isexpensive. Seven peptidomimetics of protein A were designed based on the hot-spots
located at the helix-loop-helix region of protein A, and synthesized via solid phase usingthe Fmoc approach. These peptidomimetics were characterized by MS and NMR. The
conformations of four peptidomimetics were studied by NMR and CD in
water/hexafluoroisopropanol (pH 4). The CD and NMR data show that addition ofhexafluoroisopropanol stabilizes their a-helical conformations. The structures of these
peptidomimetics in solution were generated with Quanta/CHARMm using NMR data as
limits for the QMD technique.Protein G has also been used to purify antibodies, but it is expensive too. A
number of protein G mimics were designed as trivalent molecules. An efficient
preparation of trivalent molecules having a useful primary amine arm has been
iv
developed through solid phase synthesis. The cheap, commercially available
poly(propylene imine) dendrimers were used as scaffolds which allow multimerizationof functionalized compounds. A small library of trivalent compounds were synthesized
using this approach. A portion of compounds in this library were tested by AmershamBiosciences. The seven amino acid modified DAB-Am-4 exhibits strong binding to the
IgG/Fab, and is a potential ligand for IgG purification.
The interactions between neurotrophins (ie NGF and NT-3) and their receptorsare typical drug targets. Fourteen second-generation peptidomimetics showing NGF-
like or NT3-like activities in a preliminary bioassay, were resynthesized and testedagain. Preliminary and retested data were compared. To access a direct binding assay,
five fluorescently labeled peptidomimetics 41a-e were synthesized for a fluorescence
activated cell sorting (FACScan) assay. Six monomeric precursors 42 and 43 wereprepared on large scales for the library of bivalent turn analogs.
v
DEDICATION
I would like to dedicate this dissertation to my wife, my parents and my
parents-in-law.
vi
ACKNOWLEDGMENTS
Fist, I would like to thank my advisors: Dr. James C. Rock, for his useful
guidance in my graduate study and for his kindness, and Dr. Kevin Burgess, forproviding me the opportunity and excellent environment conducive to independent
research and hard work. I would like to thank Dr. Andrew K. Chan and Dr. John P.
Wagner for serving on my graduate advisory committee.I would like to thank Dr. Karl M. Koshlap for his help in my 2D NMR spectra,
Dr. Lisa M. Pérez for her help in the QMD exploration on Insight II platform. I wouldlike to thank Miguel Angel Castañeda and Jingyi Shen for proofreading of my
dissertation. I would like to thank everybody in the Burgess group especially Sam, Reyes
and Mookda, Pattarawarapan for their friendship and helpful discussions.I would like to specially thank my wife, Wenhong Zhu. I could not complete
my study without her love and support.
vii
TABLE OF CONTENTS
PageABSTRACT…………………………………………………………………………..…iiiDEDICATION………………………………………………………………………........vACKNOWLEDGMENTS…………………………………………….............................viTABLE OF CONTENTS…………………………….................................................... viiLIST OF FIGURES……………………………...............................................................ixLIST OF SCHEMES……………………………...........................................................xiiiLIST OF TABLES……………………………………………………………………...xivLIST OF ABBREVIATIONS……………………………….........................................xviCHAPTER
I INTRODUCTION: FUNDAMENTALS OF PROTEIN-PROTEIN INTERACTIONS.............................................................................................. 1
1.1 Importance in Medicine and Biotechnology ........................................ 11.2 “Hot-spots” at Protein-protein Interfaces............................................. 21.3 Examples of Peptide-like Molecules that Mimic Hot-spots.................. 31.4 Examples of Non-peptide Small Molecules that Mimic Hot-spots ....... 5
II ADAPTATION OF INSIGHT II/DISCOVER TO CONFORMATION STUDIES OF PEPTIDOMIMETICS ............................................................... 8
2.1 Specific Aims ..................................................................................... 82.2 Background and Significance.............................................................. 82.3 Exploration of the QMD Technique in INSIGHT II/DISCOVER...... 172.4 Exploration of the QMD Technique in Insight II/CHARMm............. 222.5 QMD Studies of P27 Stereoisomers .................................................. 262.6 Summary .......................................................................................... 29
III PEPTIDOMIMETICS OF PROTEIN A AS POTENTIAL LIGANDS FOR AFFINITY SUPPORTS ................................................................................. 30
3.1 Specific Aims ................................................................................... 303.2 Background and Significance............................................................ 303.3 Design of New Protein A Peptidomimetics ....................................... 463.4 Solid Phase Syntheses of Peptidomimetics Using Fmoc Approach.... 483.5 Conformational Analyses of Peptidomimetics................................... 50
IV MONO- AND MULTIVALENT SMALL MOLECULE PEPTIDOMIMETICS OF PROTEIN G FOR AFFINITY SUPPORTS ......... 79
4.1 Specific Aims ................................................................................... 794.2 Background and Significance............................................................ 794.3 Design of Protein G Mimics for IgGs................................................ 884.4 Syntheses of Monovalent Protein G Mimics, Functional Compounds and Building Blocks for Multivalent Protein G Mimics..................... 914.5 Development of Solid Phase Syntheses of Multivalent Protein G Mimics Using Poly(propylene imine) Dendrimers as Scaffolds....... 1004.6 Summary ........................................................................................ 116
V SMALL MOLECULE MIMICS OF THE NEUROTROPHINS.................... 117
5.1 Specific Aims ................................................................................. 1175.2 Background and Significance.......................................................... 1175.3 Synthesis of the Template ............................................................... 1255.4 Solid Phase Syntheses of Peptidomimetics 36-38 ............................ 1265.5 Synthesis of Fluoresceinylated Peptidomimetics 41 ........................ 1315.6 Syntheses of Monomeric Precursors 42 and 43 for Fluoresceinylated Bivalent Turn Mimics of Neurotrophins ............. 1335.7 Comparison of Biological Activities ............................................... 1365.8 Summary ........................................................................................ 142
VI CONCLUSIONS.......................................................................................... 144
REFERENCES .......................................................................................................... 147APPENDIX A ........................................................................................................... 167APPENDIX B............................................................................................................ 174APPENDIX C............................................................................................................ 177APPENDIX D ........................................................................................................... 182APPENDIX E............................................................................................................ 184APPENDIX F ............................................................................................................ 207APPENDIX G.................................................................................................................270
VITA…………………………………………………………………………………...294
ix
LIST OF FIGURES
PageFigure 1.1. Structures of peptidomimetics A and B. ...................................................... 4Figure 1.2. Structures of peptidomimetics C and D. ...................................................... 5Figure 1.3. Structures of compounds E, F and G. .......................................................... 7Figure 2.1. Structure of a chosen molecule for QMD studies. ...................................... 16Figure 2.2. Structure of stereoisomers of P27.............................................................. 17Figure 2.3. a - f Gaussian energy histograms for the QMD studies of compound H corresponding to conditions 1 - 6 respectively........................................... 21Figure 2.4. a - f The lowest energy structures for the QMD studies of compound H corresponding to conditions 1 - 6 respectively........................................... 22Figure 2.5. a - d Gaussian energy histograms for the QMD studies of compound H corresponding to conditions 1 - 4 respectively........................................... 25Figure 2.6. a - d The lowest energy structures for the QMD studies of compound H corresponding to conditions 1 - 4 respectively........................................... 26Figure 2.7. The lowest energy structures of four stereoisomers of P27. ....................... 28Figure 3.1. Antibody. (a) crystal structure of intact human IgG1 which lacks functional hinge regions, (b) schematic representation of an antibody. ...... 32Figure 3.2. (a) The B domain of protein A complexed with Fc fragment of IgG; (b) an expanded view of the same interaction from a different perspective; (c) “hot-spots” from protein A involved in the Fc binding......................... 35Figure 3.3. Structures of protein A mimics. ................................................................. 38Figure 3.4. Schematic presentation of antibody purification by affinity chromatography........................................................................................ 39Figure 3.5. Basic principle of STD NMR spectroscopy. .............................................. 41Figure 3.6. Some short-range proton-proton distances in a peptide chain..................... 44Figure 3.7. Short-range NOEs observed in an ideal helical conformation. ................... 44Figure 3.8. Sequence of the helix-loop-helix fragment of protein A and sequences of the peptidomimetics targeted. ............................................................... 47
x
PageFigure 3.9. (a) - (b) CD spectra for compounds 1 and 3, respectively, at 50 µM concentrations in pH 4 phosphate buffer (20 mM), and in the indicated buffer:(CF3)2CHOH ratios (by volume)...................................... 52Figure 3.10. (a) - (b) CD spectra for compounds 4 and 5, respectively, at 50 µM concentrations in pH 4 phosphate buffer (20 mM), and in the indicated buffer:(CF3)2CHOH ratios (by volume)...................................... 53Figure 3.11. (a) - (b) CD spectra for compounds 6 and 7, respectively, at 50 µM concentrations in pH 4 phosphate buffer (20 mM), and in the indicated buffer:(CF3)2CHOH ratios (by volume)...................................... 54Figure 3.12. CD spectra for peptidomimetic 6 (50 mM) alone (A) and peptidomimetic 6 (6 mM) mixed with IgG (0.125 mg/ml) (B) in pH 4 phosphate buffer (20 mM).......................................................... 55Figure 3.13. Fingerprint region of a 80-ms TOCSY spectrum of mimic 1 in 90% H2O/10% D2O......................................................................................... 57Figure 3.14. (a) - (b) NH-NH and Ca/NH “fingerprint” regions, respectively, of a 150-ms ROESY spectrum of mimic 1 in 90% H2O/10% D2O, pH=4, 25 ˚C............................................................................................ 58Figure 3.15. Fingerprint region of a 80-ms TOCSY spectrum of mimic 4 in 90% H2O/10% D2O......................................................................................... 60Figure 3.16. (a) - (b) NH-NH and Ca/NH “fingerprint” regions, respectively, of a 300-ms NOESY spectrum of mimic 4 in 90% H2O/10% D2O, pH=4, 25 ˚C............................................................................................ 61Figure 3.17. Fingerprint region of a 80-ms TOCSY spectrum of mimic 5 in 90% H2O/10% D2O......................................................................................... 63Figure 3.18. (a) - (b) NH-NH and Ca/NH “fingerprint” regions, respectively, of a 300-ms NOESY spectrum of mimic 5 in 90% H2O/10% D2O, pH=4, 25 ˚C............................................................................................ 64Figure 3.19. Fingerprint region of a 80-ms TOCSY spectrum of mimic 6 in 90% H2O/10% D2O......................................................................................... 66
xi
PageFigure 3.20. (a) - (b) NH-NH and Ca/NH “fingerprint” regions, respectively, of a 150-ms ROESY spectrum of mimic 6 in 90% H2O/10% D2O, pH=4, 25 ˚C............................................................................................ 67Figure 3.21. (a) - (b) Ca/NH and NH-NH “fingerprint” regions, respectively, of a 200-ms ROESY spectrum of mimic 1 in 80% buffer/20% (CF3)2CDOD, pH=4, 25 ˚C ..................................................................... 70Figure 3.22. (a) - (b) Ca/NH and NH-NH “fingerprint” regions, respectively, of a 250-ms ROESY spectrum of mimic 4 in 85% buffer/15% (CF3)2CDOD, pH=4, 25 ˚C ..................................................................... 71Figure 3.23. (a) - (b) Ca/NH and NH-NH “fingerprint” regions, respectively, of a 250-ms ROESY spectrum of mimic 5 in 85% buffer/15% (CF3)2CDOD, pH=4, 25 ˚C ..................................................................... 72Figure 3.24. (a) - (b) Ca/NH and NH-NH “fingerprint” regions, respectively, of a 200-ms ROESY spectrum of mimic 6 in 85% buffer/15% (CF3)2CDOD, pH=4, 25 ˚C ...................................................................... 73Figure 3.25. (a) - (d) Summary of the sequential and medium-range connectivities for peptidomimetics 1, 4-6 respectively................................................... 74Figure 3.26. (a) - (d) Superimposed low energy structures generated for peptidomimetics 1 (11), 4 (6), 5 (10), and 6 (12) {number of structures within the cut-off threshold are indicated in parentheses}, respectively... 77Figure 4.1. (a) The C2 domain of protein G /Fc fragment of IgG complex; (b) hot-spots of C2 domain involved in Fc binding. .................................. 81Figure 4.2. ViewerPro plot of interaction details between domain III of protein G and the CH1 domain of IgG/Fab. ............................................................... 82Figure 4.3. Structure of protein G b-sheet/IgG b-sheet interaction mimic. ................... 85Figure 4.4. Conceptual approach to trifunctionalization of three of the four sites in the tetravalent core of DAB-Am-4. ....................................................... 87Figure 4.5. Docking of the virtual leads A – C with the region of IgG that docks with the protein G domain III.................................................................... 90
xii
PageFigure 4.6. Library design: it was anticipated that the alkynes 8a-c would be coupled a supported dendric amine, then with the azide components 9 to give the products like 10. ...................................................................... 91Figure 4.7. Several linkers for the syntheses of multivalent protein G mimics. .......... 101Figure 4.8. Structure (a) and TOCSY spectrum (b) of compound 29a........................ 108Figure 4.9. (a) Selected HPLC traces indicating the product distribution of the desired product 10bu relative to the impurities 34 and 35; and (b) comprehensive data from this set of optimization experiments................ 112Figure 4.10. Structure (a) and TOCSY spectrum (b) of compound 10cx. ................... 115Figure 5.1. Specificities of neurotrophins and their receptors. ................................... 118Figure 5.2. NGF with different color highlighted turn regions. .................................. 119Figure 5.3. Some examples of b-turn mimics with a covalent bond instead of turn hydrogen bond........................................................................................ 122Figure 5.4. Some examples of b-turn mimics retaining a partial turn. ........................ 123Figure 5.5. Structures of D3, first and second generation compounds. ....................... 124Figure 5.6. Fluoresceinylated bivalent turn mimics. .................................................. 134Figure 5.7. Cell survival data for compounds 36-38 made by different people in TrkA-expressing cells. ........................................................................ 138Figure 5.8. Cell survival data for compounds 36 and 37 in TrkC-expressing cells. .... 140Figure 5.9. Cell survival data for different concentrations of compounds 36b in TrkC-expressing cells. ........................................................................ 141Figure 5.10. Cell survival data for different concentrations of compounds 36c in TrkC-expressing cells. ...................................................................... 142
xiii
LIST OF SCHEMES
PageScheme 3.1. Solid Phase Synthesis of Peptidomimetic 1 ............................................. 49Scheme 4.1. Preparation of Compound 11................................................................... 92Scheme 4.2. Synthesis of Functional Compounds (approach I) ................................... 94Scheme 4.3. Hydrolyses of Compounds 13 and 14 ...................................................... 95Scheme 4.4. Synthesis of Functional Compounds 16-21 (approach II) ........................ 95Scheme 4.5. Syntheses of 2-Azide-N-(Aryl)-Acetamide 9 ........................................... 98Scheme 4.6. Syntheses of Building Blocks 8a-c .......................................................... 98Scheme 4.7. Preparation of Trivalent Compounds 29 ................................................ 105Scheme 4.8. Preparation of Multivalent Compound 31.............................................. 106Scheme 4.9. Preparation of Trivalent Compound 32.................................................. 107Scheme 4.10. DAB-Am-4 Concentration Dependence Experiments of Products ....... 111Scheme 4.11. Preparation of Trivalent Protein G Mimics Library.............................. 113Scheme 5.1. Preparation of the Template .................................................................. 126Scheme 5.2. Preparation of Resin Supported Peptidomimetics 36 ............................. 127Scheme 5.3. Preparation of Peptidomimetics 36-38................................................... 129Scheme 5.4. Strategy for Attaching Fluorescent Label to Peptidomimetics................ 132Scheme 5.5. Syntheses of Monomeric Precursors 42 and 43...................................... 135
xiv
LIST OF TABLES
PageTable 2.1. Minimization Methods in CHARMm and Discover .................................... 14Table 2.2. Summary of QMD Data for Conditions 1-4 ................................................ 20Table 2.3. Summary of QMD Data for Conditions 5-7 ................................................ 20Table 2.4. Summary of QMD Data for Conditions 1-4 ................................................ 24Table 2.5. Summary of QMD Data for P27 Stereoisomers .......................................... 27Table 3.1. Characteristics of Human Antibody Isotypes .............................................. 32Table 3.2. Important NMR Techniques Used in This Study......................................... 42Table 3.3. Summary of Purity, Yield and MALDI-MS Data for 7 Peptidomimetics..... 49Table 3.4. Summary of CD Data and Estimated Helical Contents for Peptidomimetics 1, 3-6 ............................................................................... 51Table 3.5. Chemical Shifts and Coupling Constants of Mimic 1 (in 90% H2O/10% D2O) .............................................................................. 59Table 3.6. Chemical Shifts and Coupling Constants of Mimic 4 (in 90% H2O/10% D2O) .............................................................................. 62Table 3.7. Chemical Shifts and Coupling Constants of Mimic 5 (in 90% H2O/10% D2O) .............................................................................. 65Table 3.8. Chemical Shifts and Coupling Constants of Mimic 6 (in 90% H2O/10% D2O) .............................................................................. 68Table 4.1. Hydrogen Bonds Between Domain III of Protein G and the CH1 Domain of IgG/Fab..................................................................................... 83Table 4.2. Some Functional Compounds ..................................................................... 96Table 4.3. 2-Azide-N-(Aryl)-Acetamide...................................................................... 99Table 4.4. Original and Estimated Loading Values for Several Resins....................... 100Table 4.5. Summary of Yield and Purity Data for Compounds 29 ............................. 104Table 4.6. Purity and Yield Data for Trivalent Molecules 10..................................... 114Table 5.1. Nine Ideal b-Turn Types........................................................................... 121Table 5.2. Summary of Purity and Yield Data for Compounds 36-38 ........................ 130
xv
PageTable 5.3. Summary of Purity and Yield Data for Compounds 41 ............................. 131Table 5.4. Monomers Prepared in Scheme 5.5........................................................... 134Table 5.5. Survival Data of E25 TrkA Cells for Compounds 36-38 Made by Different People................................................................................... 137Table 5.6. Survival Data of NIH3T3 TrkC Cells for Compounds 36 and 37 Made by Different People................................................................................... 139Table 5.7. Cell Survival Data for Different Concentrations of Compound 36b Made by Different People......................................................................... 140Table 5.8. Cell Survival Data for Different Concentrations of Compound 36c Made by Different People......................................................................... 141
CHAPTER IINTRODUCTION: FUNDAMENTALS OF PROTEIN-PROTEIN
INTERACTIONS
1.1 Importance in Medicine and Biotechnology
Protein-protein interactions play a critical role in numerous biologicalprocesses in cells. They are important in the normal function of signal transduction,1-3
immune response,4,5 protein enzyme inhibitors6,7 etc. The abnormal protein-proteininteractions are key factors in the development of some pathological processes, for
example, Alzheimer’s disease,8,9 anemia, rheumatoid arthritis, and respiratory distress
syndrome and emphysema.6,7 Since data from the human genome project wereinterpreted, a huge amount of information about protein-protein interactions has been
accumulated. A lot of protein-protein interactions become pharmaceutical targets. Thisnot only provides great opportunities, but also are big challenges for medicinal chemistry
and biotechnology.10 First, most of protein-protein interactions are quite specific; second,
protein-protein interactions in vivo are sensitive to both the levels of proteins and howthey are distributed;11 third, if the protein-protein interfaces consist of noncontinuous
binding epitopes it is difficult to rationally design binding-site mimics; fourth, the
interfaces in protein-protein interactions are commonly greater than 1200 Å2,12,13 whichvastly exceed the potential binding area of small molecular mimics, and are often planar
lacking binding sites for small molecules.14
This dissertation follows the style of the Journal of Organic Chemistry.
2
Despite of the difficulties in the mimic of protein-protein interactions, a number
of small molecular mimics, which can be used to modulate protein-protein interactions,have been identified, and new marketed products and recent research success,15 which
target the protein-protein interactions, have been reviewed.10,16-18 The following strategyis often followed in the design of new bioactive compounds:19 a. identify protein-protein
interactions, b. propose hot-spots of contact area, c. design a library of small molecules
with molecular modeling, d. prepare the compounds, and f. screen bioactivities ofcompounds.
1.2 “Hot-spots” at Protein-protein Interfaces
An excellent understanding of protein-protein interfaces is required forintelligent design of small molecules which are able to interfere with protein-protein
interactions. Most interfaces consist of two relatively large protein surfaces with good
shape complementarity to each other through steric, hydrophobic and electrostaticinteractions, and hydrogen bonds.12,20-22 The interface size differs from study to study.
Janin23 reported that it ranges from 670 to 4890 Å2 per subunit in dimeric proteins. Later,a range of interface size from 368.1 to 4746.1 Å2 was found by checking 32 non-
homologous dimers.6 A more recent examination of 75 protein-protein complexes
exhibited that the interface areas range from 1140 to 4660 Å2, and 70% of thesecomplexes have the interface areas burying 1600 (±400) Å2, which were called
“standard-size” interfaces.24 Generally, larger than 1200 Å2 of total surface area, 600 A2
per monomer, is required for the formation of “O-ring”, which excludes bulk solvent and
provides a low dielectric environment for “hot-spots” binding.25,26 Only a small numberof “hot-spot” residues on protein surfaces contribute significantly to the binding, and
they clustered near the geometric center of the protein-protein interface.26 A survey ofamino acids on hot-spot regions showed that tryptophan, tyrosine and arginine are
enriched in this area.26 Although the identification of hot-spots remains an open question,
the following numerous methods have proven useful for this task: X-ray crystallography,
3
NMR spectroscopy, mutagenesis screening,4,26-28 site-directed mutagenesis,29,30 and
others.31-34
1.3 Examples of Peptide-like Molecules that Mimic Hot-spots
Impressive progress has been made to date in the discovery of small molecules
modulating protein-protein interactions. The design of small molecule inhibitors forvarious enzymes has been quite successful, and the structural properties of enzyme
interfaces are probably the main reason for this. Most enzymes have deep pockets within
their interfacial surface area unlike many other protein heterodimers whose interfaces arelarge and flat. Moreover, these deep pockets are often the active sites of the enzymes.
Small molecular inhibitors of HIV-1 protease dimerization are good examples ofpeptide-like molecules mimicking hot-spots. The interface of HIV-1 protease
dimerization consists mainly of an interdigitating C- and N- terminal four-stranded
antiparallel b-sheets.35 Specifically, about half of it is only composed of the area near the
C- and N- termini, and accounts for close to 75% of the total binding energy ofhomodimer.36 The following residues located at the C- and N- termini were identified as
hot-spots by calorimetric experiments:36 Cys95, Thr96, Leu97, Asn98, Phe99, Pro1, Ile3and Leu5. Based on these hot-spots Chmielewski’s group37 designed their first
peptidomimetic A (Figure 1.1) as an inhibitor of HIV-1 protease with an IC50 of 350 nM
( at 25 nM protease). They then applied alanine scanning, Zhang-Poorman analysis38 andmolecular modeling to peptidomimetic A. After the removal of less-important amino
acids and the replacement of the isobutyl group of Leu with a cyclohexyl group in
peptidomimetic A, a lead compound B (Figure 1.1) with smaller molecular weight wasdeveloped, whose IC50 is 680 nM (at 25 nM protease).39
4
A BFigure 1.1. Structures of peptidomimetics A and B. The numbers correspond to theposition of the residue in the complementary protease monomer.
Another excellent example is the mimicking of the hot-spots of the smallsubunit R2, which results in the active form of ribonucleotide reductase by associating
the large subunit R1, and to inhibit herpes simplex virus ribonucleotide reductasedimerization.40,41 Hot-spots clustered together on the C-terminal fragment (called
chains of hexapeptide C led to the discovery of D (IC50 < 1 nM), which efficientlyinhibited HSV replication in tissue culture.43-45
8
NOHN
NH
HN
NH
O
O
O
O
O
HN
O
OH
O NH2
OHNH
(2)(3) (4) (5)
(6)
NH
O
HN
NH
HN
NH
OHO
O
O
O
O
OH
OH O
H2N(95) (96) (97)
(98)(99)
8
HNO
NH
O
O
HN
O
NH2
OH
NH
OHO
OO
H2N
HN
O
1
5
C DFigure 1.2. Structures of peptidomimetics C and D.
1.4 Examples of Non-peptide Small Molecules that Mimic Hot-spots
Mimics could be divided into two types: peptide and non-peptide small
molecules. Beside the above peptide-like mimics there are many examples of non-peptide small molecules that mimic hot-spots modulating the protein-protein
interactions. The following example successfully transformed the epitope of intercellular
adhesion molecule-1 (ICAM-1) into a small molecule that is an effective antagonist ofleukocyte functional antigen-1 (LFA-1). This epitope is composed of hot-spots in
ICAM-1’s first domain: E34, K39, M64, Y66, N68 and Q73.46,47 The interactions
between LFC-1 and ICAM-1 are pivotal to lymphocyte and immune system function.48,49
Therefore, the development of new antagonists, which are able to be used to inhibit the
binding of the LFA-1 and ICAM-1, block the lymphocyte function, and regulate thehuman T cell-mediated inflammation, is significant. ICAM-1, a LFA-1’s native ligand,
was employed as a lead and starting point through kistrin which contains RGD sequence
and blocks LFA-1 – ICAM-1 interactions in vitro,50 the RGDMP peptides,51 H2N-CGY(m)DMPC-COOH, and compound E (Figure 1.3) (IC50 = 0.70 ± 0.21 µM for the
inhibition of LFA-1/ICAM-1 binding), which was previously identified as an inhibitor of
LFA-1,52 during the identification of compound F (Figure 1.3) with IC50 = 0.0014 ±
0.00014 µM for the inhibition of LFA-1/ICAM-1 binding and IC50 = 0.003 ± 0.002 µM
H2N NH
O
O
HN
O
NH
O
HN
O
NH
CO2H
O
H2N
CO2H
N
O
O
HN
O
NH
O
HN
O
NH
O
N
CO2H
6
for the inhibition of mixed lymphocyte reaction, using alanine scanning, molecular
modeling and other approaches.53 The molecular modeling shows that functional groupsof the ICAM-1 epitope, such as carboxylic acid (E34), sulfide (M64), phenol (Y66) and
carboxamide (N68, Q73), are embodied in compound F well.The development of a potent Bcl-xL antagonist, which is a non-peptide small
molecule, is another example of mimicking hot-spots. Bcl-xL is a kind of anti-apoptotic
protein while Bak is a type of pro-apoptotic protein.54 The interactions of Bcl-xL/Bakcompete for supremacy over cell life and death decisions. In case of cancer Bcl-xL is
often overexpressed and protects transformed cells from cell death leading touncontrolled cell growth in despite of the presence of apoptotic signals.55 The crystal and
solution structures of Bcl-xL/Bak complex displayed that Bak binds the BH1-BH3
domains of Bcl-xL via its helical fragment.56,57 Amino acid residues Val74, Leu78, Ile81,Asp83 and Ile85 of the helical fragment of Bak were identified as hot-spots in the
binding of Bcl-xL.58,59 Based on these hot-spots and the helix secondary structure a
library of terphenyl molecules was designed. Of them, compound G (Figure 1.3) (Kd =114 nM) with a helical structure was identified as a lead, and is a promising antagonist
of Bcl-xL.60
7
E F
G
Figure 1.3. Structures of compounds E, F and G.
O
NH
Br
O
OH
NH O
NH
Cl
O
OH
NH
OS
ClOH
OH
OCO2HHO2C
8
CHAPTER IIADAPTATION OF INSIGHT II/DISCOVER TO CONFORMATION
STUDIES OF PEPTIDOMIMETICS
2.1 Specific Aims
Computational molecular modeling has proven to be a very useful tool in
modern drug discovery. The quenched molecular dynamics (QMD) is an excellentapproach for molecular conformational exploration in the computational modeling. This
project is to explore the QMD technique based on Insight II platform. Specifically, the
goals of this work are to:a. write two scripts and two procedures for molecular minimization, dynamics,
minimization of each of 600 conformers, and cut off; one for InsightII/Discover while the other for Insight II/CHARMm;
a. link the two scripts to the main program of Insight II;
b. validate the scripts in Quanta and Insight II platforms using a specificmolecule H, and compare the results;
c. perform QMD studies of the four stereoisomers of P27.
2.2 Background and Significance
Since Hendrickson61 first stated that the energy of a molecule might be
calculated on a computer in 1961, the field of computational chemistry has been rapidly
extended to the study of peptides and other biological molecules.62,63 These studies focuson the structures, energies, vibrational frequencies, and molecular dynamics simulations
from small molecules to large molecules in pure liquid, or vacuum, or solution, or acrystal environment.64-67 Recent advances in computer hardware, interactive graphics,
and theoretical algorithms are opening up a new era in this field.
9
2.2.1 Ab Initio and Simulation MethodsComputational methods applied in chemistry and biology fields
can be categorized into three classes: semiempirical, empirical and ab initio.Semiempirical method introduces significant simplifications which make it
computationally much more feasible. Most integrals are neglected, and empirical
parameters have to be introduced to compensate for such an approximation. Empiricalmethods differ greatly from ab initio and semiempirical methods since it is not based on
the solution of the Schrödinger equation. Molecules are treated as the systems which arecomposed of atoms held together by bonds. The total energy of the system is expressed
as the sum of bond stretching, bending, torsion, and attraction and repulsion between
nonbonded atoms. Ab initio methods, also called nonempirical method, are based on thesolution of time-independent Schrödinger equation, and is free of any empirical
procedures and parametrizations. This method might be considered as a true theory.
Despite that, it still includes some approximations, such as separation of nuclear andelectronic motion (Born-Oppenheimer approximation), neglect of relativistic effects and
concept of Molecular Orbitals (MO’s). Since 199468 the application of ab initio methodwith inclusion of electron correlation has significantly changed the common view on
interactions of molecules. It can be used to calculate not only electrostatic energy,
dispersion energy, repulsion, polarization, but also electron correlation (e.g. Hartree-Fock method), allowing for reliable comparison of the strength of stacked and hydrogen
bonded pairs of nucleic acid base, and characterization of the nature of the base-baseinteractions.69-71 Hence, the ab initio study qualitatively improved our knowledge of the
hydrogen bonding interactions which is important in life science, and revealed the
intrinsic nonplanarity of amino groups of DNA.72,73
Molecular dynamics (MD) and Monte Carlo are very popular simulation
methods in ab initio calculations. MD describes a movement process of a molecule intime, in which the motions of each atom including atom positions, masses and velocities
are governed by Newton’s equations. Monte Carlo method is based on a random
10
generation of an ensemble of conformations, or on statistical mechanics. Both are used
for the samplings of conformational space.74
2.2.2 Force FieldsThe force fields employ a combination of internal coordinates and special terms
(bond distances, bond angles, torsions, etc.), to describe a part of the potential energy
surface due to interactions between bonded atoms, and nonbond terms to describe thevan der Waals and electrostatic interactions between atoms. The functional forms range
from simple quadratic forms to Morse functions, Fourier expansions, Lennard-Jonespotentials, and so on. The goal of a forcefield is to describe an entire class of molecules
with reasonable accuracy. Some forcefields aim at high accuracy for a limited set of
element types, thus enabling good prediction of many molecular properties. Theforcefield contains necessary building blocks for the calculations of energy and force:
a. list of atom types
b. list of atomic charges (if not included in the atom-type information).c. atom-typing rules.
d. functional forms for the components of the energy expression.e. parameters for the function terms.
f. rules for generating parameters that have not been explicitly defined for some
forcefields.g. a defined way of assigning functional forms and parameters for some forcefields.
CFF and CHARMm are two important forcefields. CFF is capable of predictingmany properties, and parameterized against a wide range of experimental observables
for organic compounds containing H, C, N, O, S, P, halogen atoms, alkali metal cations,
and several biochemically important divalent metal cations. CFF has been shown toreproduce experimental results more accurately than classical forcefields such as CVFF
and AMBER. CHARMm force field is mainly applied for biochemistry, and packaged in
11
a highly flexible molecular mechanics and dynamics engine originally developed in the
laboratory of Dr. Martin Karplus at Harvard University75. It has been widely used andcan be considered well tested and characterized. A variety of systems, from isolated
small molecules to solvated complexes of large biological macromolecules, can besimulated using CHARMm.
Like CFF and CHARMm forcefields, AMBER and CVFF (Consistent Valence
Force Field) are also applied for biochemistry. The AMBER force field wasparameterized against a limited number of organic models. It has been mainly used in
the study of proteins, DNA. CVFF is a classic forcefield having some anharmonic andcross term enhancements. As the traditional default forcefield in the Discover program,
CVFF has been used extensively. Both AMBER and CVFF can be considered well
characterized.
2.2.3 Methods Based on Molecular DynamicsMolecular dynamics (MD) is one of the most important computational
techniques. It can be used to generate a realistic picture of a structure's motions, perform
conformational searching, do a time series analysis of structural and energetic properties,explore energy decay, and analyze solvent effects.76,77 A molecular dynamics calculation
generates a dynamics trajectory consisting of a set of frames of coordinates and
velocities that represent the trajectory of the atoms over time. Using trajectory data, onecan compute the average structure and analyze fluctuations of geometric parameters,
thermodynamics properties, and time-dependent processes of the molecule.In CHARMm and Discover, molecular dynamic simulation can be performed
using a classical mechanics approach, in which Newton's equations of motion are
integrated for all atoms in the system. With energy evaluations, a defined .psf or .car file,a set of coordinates and parameters are required to initiate a molecular dynamics
calculation. The Verlet algorithm is one of the most often used approaches in MD.78
Several methods have been applied in molecular computation, such as QMD,
simulated annealing, consensus dynamics. QMD has been used for many years in our
12
lab. Molecular simulation with this method is performed at high temperature. The
structures generated at this temperature are periodically saved, and quenched via a formof minimization to produce a conformational ensemble of structures.79 A typical QMD
calculation used in our lab involves the following steps:(1). preliminary preparation (in Discover)
A molecular structure in which all Cartesian coordinates are defined is required
for a dynamics simulation. As the internal coordinate values of the molecule aredetermined, total energy of the molecule is computed by evaluating the individual terms
of the energy equation.(2). minimization
Energy minimization should be performed on structures prior to dynamics in
order to relax the conformation and remove steric overlap that produces bad contacts. Aminimized ideal geometry may then be used as a starting point for dynamics.
(3). heating
A minimized structure represents the molecule at absolute zero or a temperaturenear absolute zero. Heating starts at this temperature, and is accomplished by assigning
greater random velocities to each atom at predetermined time intervals according to aGaussian distribution appropriate for that low temperature. The temperature is then
gradually increased.
(4). equilibrationAt equilibration the average temperature and structure remain stable, and
various statistical properties of the system become independent of time. Equilibrationwas achieved by allowing the system to evolve spontaneously for a period of time, and
by integrating the equations of motion. This is facilitated by periodically reassigning
velocities appropriate to the desired temperature.(5). simulation
CHARMm and Discover take the equilibrated structure as their startingpoint. The trajectory traces the motions of the molecule through a period of at least 10
picoseconds. Conformers are then sampled as many as you want from the trajectory.
13
(6). quenching
This step is the logical opposite of heating; it takes the molecule fromthe equilibrated temperature to absolute zero. In fact, quenching is a form of
minimization by utilizing molecular dynamics to slowly remove all kinetic energy fromthe system.
(7). cut off
It is used to remove the structures with higher energy, and keep thelower energy conformations for the next step.
(8). clustering familiesThe remaining structures via cutoff are clustered into a few families
Based on the RMSD values, which are indications of the relative energies and
conformational properties.
2.2.4 CHARMm and DiscoverBoth CHARMm and Discover are simulation engines including forcefields for
minimization, dynamics, and other molecular mechanics simulations. CHARMm 75,
which is the abbreviation of Chemistry at Harvard: Macromolecular Mechanics, is alarge program designed for manipulation of structures and calculation of molecular
properties. It facilitates comparison of structures and evaluation of conformational
energies. It may also be used to minimize energies, perform a normal mode or moleculardynamics simulation, and analyze the structural, equilibrium, and dynamic properties
determined in calculations. CHARMm can be used to deal with isolated molecules,molecules in solutions, and molecules in crystalline solids. It is also available to carry
out a wide range of analysis such as static structure and energy analysis, structure and
energy comparisons, correlation functions and statistical properties of moleculardynamic trajectories, and interfaces to computer graphics programs.
Discover is another large program written in C and FORTRAN language. It hasbeen applied in life science more widely than CHARMm, and can be used to perform
energy minimization, template forcing, torsion forcing and dynamic trajectories, and to
14
calculate properties such as interaction energies, derivatives, mean square displacements,
and vibrational frequencies. Discover provides tools for performing simulations undervarious conditions including constant temperature, constant energy, constant pressure,
constant stress, periodic boundaries, and fixed and restrained atoms.Both CHARMm and Discover may run in a standalone mode. In this case, the following
three files: an input file (run_name.inp, where run_name is your name for the
calculation) containing special commands to control the calculation, and two filesdescribing the model (run_name .crd or .mdf and run_name .psf or .car) are required.
The differences in minimization methods80 between CHARMm and Discoverywere shown in Table 2.1.
Table 2.1. Minimization Methods in CHARMm and Discover
Method Variant Simulation EngineCHARMm Discover
Steepest Descents yes yesConjugate-Gradient Polak-Ribiere no yes
Fletcher-Reevs yes yesPowell yes no
Newton-Raphson Full, iterative yes yesBFGS(quasi) no yesDFP(quasi) no yesTruncated no yes
ABNR yes no
2.2.5 SignificanceSince b-turns and helices are pivotal to many protein-protein interactions our
group has been interested in the types of b-turn mimics in which the residues of amino
acids and synthetic templates are held together to mimic the conformations of the loopregions of the neurotrophins, and of a-helical mimics in which short peptidomimetics
15
consisting of natural and unnatural amino acids were designed to mimic the
conformation of the helical regions of protein A. The conformations of these mimicswere examined by a combination of CD and ROE or NOE. In order to further understand
the conformation bias toward the real structures of these mimics, some of them aresimulated with Quanta/CHARMm through QMD technique.
The Quanta/CHARMm package has shown a poor ability in handling the
following operations: drawing big molecules with 2-D sketcher, coloring some portionof a molecule, and exporting the images of an overlay of structures. In the forcefield
selection there is no other choice but CHARMm forcefield. In addition, it is impossiblefor Quanta to be updated indefinitely.
Insight II is a very powerful platform which supports a lot of operations. It can
be used to handle all the above problems. Insight II contains many modules inside, suchas Builder, Biopolymer, Discover, CHARMm, Docking, NMR_Refines, QuanteMM,
and Analysis etc. Furthermore, several forcefields are available for modeling and
simulation: cff91.frc, amber.frc, cvff.frc, CHARMM.cfrc, charmm27.cfrc,charmm22.cfrc and charm19.cfrc. So you may do many things what you want to do in
this platform, like molecular conformation and property studies. Although both Quantaand Insight II are graphic molecular modeling programs, Quanta only accesses
CHARMm simulation engine while Insight II can access CHARMm and Discover
engines. So development of QMD on InsightII platform is very significant.To explore the QMD technique on the Insight II platform, the following
molecule H (Figure 2.1) made previously in our lab was taken as an example. During theexploration of QMD the greatest challenge is the composition of scripts and the correct
linking of these scripts to the main program of Insight II. This is very different from the
use of Quanta/CHARMm in which the only thing to do is to click pulldowns.
16
To obtain some information of the stereochemistry and conformation of a
molecule, P27 was selected for QMD studies (Figure 2.2).
H
Figure 2.1. Structure of a chosen molecule for QMD studies.
HNNH
HN
HN
O
HOOCO
NH2
O
NH2
O
O2N
17
Figure 2.2. Structure of stereoisomers of P27.
2.3 Exploration of the QMD Technique in INSIGHT II/DISCOVER
2.3.1 Molecular Modeling Method on Insight II/DiscoverAll calculations were performed on a Silicon Graphics O2 workstation with the
IRIX 6.3 operating system, using the modeling program Discover_3 (C version, Accelry
company) within InsightII (accelry company) environment.QMD strategy was employed in all simulations; and standard Discover
parameters were used. The molecule was modeled as neutral or charged compound. Theeffects of the solvent was also modeled by a dielectric continuum of m=45,
representative of dimethyl sulfoxide (DMSO). The equations of motions were integrated
by using Verlet Algorithm with time step of 1 ps. SHAKE was used to constrain all bond
length. The starting structure was minimized with 1000 steps of steepest descent (SD)and 3000 steps of the different Newton methods like BFGS, Newton-raphson in order.
HNNH
HN
O
OO
NH2
O
O
O2N
+H3N
HO
I
i + 1
i + 2
i + 3
configurationi + 1 i + 2 i + 3 L L L L L D L D L D L L
P27
18
The minimized structure was then heated to 1000K by increasing the temperature 10K
every 160 time-steps (0.16 ps) from the temperature of 5 K. After being heated, thestructure was equilibrated for 12 ps at 1000 K. The molecular simulation run was then
performed in the NVT ensemble for a total time of 600 ps. The trajectories were savedevery 1 ps. Each of the 600 structures was thoroughly energy minimized using 1000
steps of SD followed by 3000 steps of BFGS or Newton-Raphson.
The structures with lower energies obtained by performing cutoff procedurewere selected for further analysis in InsightII. First these structures were clustered into
families on the basis of the RMS deviation of the ring backbone atoms. The lowest-energy structure was selected as the representative of this whole study. The lowest-
energy structure of each family was selected as the representative of each family. The
distances between the protons which interact with one another were measured, and thedihedral angles of the lowest-energy structures of each family were calculated.
The similar molecular modeling method was used in Quanta/ CHARMm.
2.3.2 Script and Procedures with the QMD Technique for Insight II/DiscoverA script was written and used for the minimization of a molecule, dynamics,
minimization of each of the saved 600 structures, and cut-off. The details are presented
in Appendix A.
The detailed procedures of molecular modeling by QMD are presented inAppendix B. They include the methods for building a molecule, minimizing energies,
simulating molecules, performing cutoff, and clustering the structures into families.
2.3.3 Results and Discussion for Insight II/DiscoverThe results from the lowest energy conformer of the first family of each
calculation under the following different conditions using InsightII/Discover package
were listed in Table 2.2: (1). Forcefield is cvff, minimization methods are SD and bfgs, and lysine side-chain
with NH2.
19
(2). Forcefield is cff, minimization methods are SD, newton_raphson, and lysine
side-chain with NH2. (3). Force field is cff, minimization methods are SD and bfgs, and lysine side-chain
with NH2.(4). Forcefield is cff, minimization methods are SD and bfgs, and lysine side-chain
with NH3+.
Table 2.3 also presents the results from the lowest energy conformers of thefirst family of each calculation under different conditions 5-7 using Quanta/CHARMm
package. CHARMm forcefield was employed; and the minimization methods are SDand Adopted Basis Newton-Raphson (ABNR).
(5). Shake on all bonds with hydrogens, and lysine side-chain with NH2.
(6). No shake was used, and lysine side-chain with NH3+.
(7). No shake was used, and lysine side-chain with NH2.
Even though different conditions were used during the quenched moleculardynamics simulation, all results obtained are not desirable, because no data fit any types
of turns using Insight II/Discover package (Table 2.2). Table 2. 3 shows that the resultsare desirable, and conformations with b-turn types were obtained using
Quanta/CHARMm package. There are several factors leading to this: force fields,
organic group charge and SHAKING operation.
Figure 2. 3 shows Gaussian energy histograms of 600 structures afterminimization. It is very obvious that the energy distributions of 600 structures given by
Quanta/CHARMm are closer to Gaussian distribution than those given byInsightII/Discover. The lowest energy structures of each condition except that of
condition 7 were displayed in Figure 2.4.
20
Table 2.2. Summary of QMD Data for Conditions 1-4(RMSD Threshold 0.7 Å)
different conditionsitems dihedralanglesa
1 2 3 4
E (Glu) f -94.02 -130.19 -90.66 -131.80y -71.98 -42.22 -4.45 67.28
K (Lys) f -138.57 -120.94 -135.88 68.86y 89.84 39.07 72.90 57.24
numberin family
89 89 92 91
lowest energy(kcal/mol)
93.027 -65.825 -65.185 -75.088
distance (Å)(COi-NHi+3)
5.46 4.49 3.89 4.72
types of turnb none none none noneaDihedral angles are defined in page 42. bTurn type was determined in term of data from the literature.81-83
Table 2.3. Summary of QMD Data for Conditions 5-7(RMSD Threshold 0.7 Å)
different conditionsitems dihedralangles 5 6 7
E (Glu) f -70.14 -72.06 -92.80y -29.79 -20.10 47.60
K (Lys) f -73.67 -95.40 -165.91y -32.44 7.755 -16.82
numberin family
92 95 85
lowest energy(kcal/mol)
-0.4418 -2.2913 -0.0707
distance (Å)(COi-NHi+3)
2.718 2.252 2.92
types of turn bIII bI none
21
0
50
100
150
200
90 95 100 105 110 115 120
aN
umbe
r of
str
uctu
res
Energy (kcal/mol)
0
50
100
150
200
-70 -65 -60 -55 -50 -45 -40
b
Num
ber
of s
truc
ture
s
energy (kcal/mol)
0
50
100
150
200
-70 -65 -60 -55 -50 -45 -40
c
Num
ber
of s
truc
ture
s
energy (kcal/mol)
0
50
100
150
200
-80 -75 -70 -65 -60 -55 -50
d
Num
ber
of s
truc
ture
s
Energy (kcal/mol)
0
50
100
150
200
-5 0 5 10 15 20
e
Num
ber
of s
truc
ture
s
Energy (kcal/mol)
0
50
100
150
200
-5 0 5 10 15 20
f
Num
ber
of s
truc
ture
s
Energy (kcal/mol)
Figure 2.3. a - f Gaussian energy histograms for the QMD studies of compound Hcorresponding to conditions 1 - 6 respectively.
22
Figure 2.4. a - f The lowest energy structures for the QMD studies of compound Hcorresponding to conditions 1 - 6 respectively.
2.4 Exploration of the QMD Technique in Insight II/CHARMm
2.4.1 Molecular Modeling Method on Insight II/CHARMmThe method is similar to that used for Insight II/Discover. But there are
a b
c d
e f
23
some differences between these two methods. When the minimized structure was heated
to 1000 K, the temperature 10 K was increased every 100 time steps (0.1 ps) fromtemperature 0 K (not 5 K). The molecular simulation running was performed in either
NVE, in which the energy is constant, or NVT, in which the temperature is constant,ensemble for a total time of 600 ps (not only NVT). ABNR was employed to minimize
each of the 600 structures instead of BFGS or Newton-Raphson.
2.4.2 Script and Procedures with the QMD Technique for Insight II/CHARMmA script was written and used for NVE during simulation. When NVT was
selected during simulation, the line (TCON TCOUpling 0.400000 TREF 1000.000000 )
should replace FINALT 1000.000000 in the codes of the simulation section. This script
is also used to carry out the minimization, dynamics, minimization of each structure of600 structures, and cut-off. The details are presented in Appendix C.
The procedures are very simple because Builder was employed to
build a molecular structure for InsightII/CHARMm, similar to what it does inInsightII/Discover. The script can be used to handle energy minimization, molecular
simulation and cutoff operation. Since it is impossible for InsightII to deal with theseparated files including the data from structures or energies. Quanta was then employed
for clustering the structures into families and the followed analysis. The procedures are
presented in Appendix D.
2.4.3 Results and Discussion for Insight II/CHARMmTable 2.4 presents the results for the lowest energy conformer of the first family
of each calculation in the following conditions using InsightII/CHARMm package
(analyzed in Quanta): (1). Forcefield is CHARMm forcefield, NVE was used during simulation.
(2). Forcefield is CHARMm forcefield, NVT was used during simulation.
(3). Force field is cff, NVE was used during simulation. (4). Forcefield is CHARMm forcefield, NVE was used during simulation. All of
minimization, dynamics, and analysis were carried out in Quanta/CHARMm.
24
Table 2. 4 shows that all results obtained are desirable because when
CHARMm was used as the simulation engine and forcefield, b-turn types can be
obtained in either InsightII/CHARMm or Quanta/CHARMm. However, no data fit anyturn types using CHARMm as simulation engine and cff as forcefield in
InsightII/CHARMm package. This is another example indicating that the forcefield hasan important effect on the QMD simulation. Different force fields used in the QMD
simulation can cause different results. Gaussian energy histograms of the 600 structures
after minimization was presented in Figure 2.5. Figure 2.5 showed the distribution ofenergy of the 600 structures obtained from Quanta/CHARMm is closer to Gaussian
distribution than that obtained from InsightII/CHARMm. The lowest energy structures
of each condition are shown in Figure 2.6. The lowest-energy structures of compound Hin conditions 1 and 4 are similar. Same similarity has been observed for those in
conditions 2 and 3.
Table 2.4. Summary of QMD Data for Conditions 1-4(RMSD Threshold 0.7 Å)
different conditionsitems dihedralangles
1 2 3 4
E (Glu) f -74.33 -69.12 -98.19 -70.14y -26.77 -40.44 37.49 -29.79
K (Lys) f -69.22 -66.59 -159.80 -73.67y -33.79 -26.80 -23.97 -32.44
numberin family
84 69 77 92
lowest energy(kcal/mol)
1.540 -2.508 -69.510 -0.4418
distance (Å)(COi-NHi+3)
2.759 2.560 3.105 2.718
types of turn bIII bIII none bIII
25
Figure 2.5. a - d Gaussian energy histograms for the QMD studies of compound Hcorresponding to conditions 1 - 4 respectively.
a b
c d
26
Figure 2.6. a - d The lowest energy structures for the QMD studies of compound Hcorresponding to conditions 1 - 4 respectively.
2.5 QMD Studies of P27 Stereoisomers
2.5.1 Molecular Modeling Method for the Computations of P27Quanta/CHARMm package was employed for these computations. No SHAKE
was used to constrain all bond length with hydrogens. The molecular simulation wasperformed in the NVE ensemble. Other conditions are the same as those in Insight
II/CHARMm.
a b
c d
27
2.5.2 Results and Discussion for the Computation of P27Table 2. 5 presents the data results obtained for the lowest energy conformer of
the first family of each calculation for four different stereo-structures: LLL, LLD, LDL,and DLL using Quanta/CHARMm package.
All results in Table 2.5 are desirable since each data set of four-different stereo-
structures modeling fits one kind of b-turns. There are three types of b-turns for four
stereo-structures. Specifically, both LLL and LLD adopt bI turn while LDL and DLL
adopt bII and bII' respectively. The lowest-energy structures of these four stereo-
structures look different as shown in Figure 2. 7.
Table 2.5. Summary of QMD Data for P27 Stereoisomers(RMSD Threshold 0.7 Å)
stereoisomers of P27items dihedralangles
LLL LLD LDL DLL
K (Lys) f -65.08 -68.90 -72.39 71.77y -28.28 -31.14 108.50 -120.20
T (Thr) f -98.83 -82.62 89.36 -94.74y 22.13 -92.85 35.67 91.89
(HS) f 70.12 -75.44 70.96 74.06y 46.51 -54.50 50.67 62.01
numberin family
102 97 85 86
lowest energy(kcal/mol)
1.77 2.16 2.28 1.81
distance (Å)(COi-NHi+3)
2.245 4.772 2.373 4.418
types of turn bI bI bII bII¢
28
Figure 2.7. The lowest energy structures of four stereoisomers of P27.
LLL DLL
LDL LLD
29
2.6 Summary
Two written scripts worked very well for QMD study in Insight II platform andsucceed in the connection of Insight II program based on the test running. Using the
scripts, InsightII/CHARMm may be employed to perform minimization, dynamics
(heating, equilibration, simulation), minimization of each of 600 structures, and cut off.Insight II can not be used to carry out clustering families from CHARMm files. In this
case, Quanta may be applied. The similar data results obtained from the test run indicate
that Insight II/CHARMm may substitute Quanta/CHARMm for QMD studies.InsightII/Discover may also be applied to perform all of minimization,
dynamics, and analysis including clustering of families for QMD studies using thedifferent script. However, the final results are very different from those obtained using
CHARMm forcefield and are not desirable according to b-turn types for the selected
molecule. This can be attributed to the different forcefields used by Discover and
CHARMm.QMD studies for P27 suggest that the LLL and LLD isomers prefer a type I b-
turn conformation, the LDL isomer prefers a type II b-turn conformation and the DLL
isomer prefers a type II¢ b-turn conformation.
30
CHAPTER IIIPEPTIDOMIMETICS OF PROTEIN A AS POTENTIAL LIGANDS
FOR AFFINITY SUPPORTS
3.1 Specific Aims
This project is to design and find peptidomimetics of protein A which resembleits helical regions, have highly selective binding to IgG, and can be produced
economically on a large scale, and to test them for bioactivities. Specifically, thisresearch will attempt to:
a. design several peptidomimetics with key residues of protein A and a helix-
loop-helix motif constrained by incorporation of Aib;b. synthesize these peptidomimetics using standard FMOC chemistry;
c. study solution conformations by circular dichroism (CD) spectroscopystudies and NMR spectroscopy studies, such as ROESY and NOESY;
d. simulate the structures of the peptidomimetics in solution using NMR data
as limits by QMD;e. supply samples for testing the bioactivities of the peptidomimetics.
3.2 Background and Significance
3.2.1 Antibodies: Application, Structure and PurificationAntibodies, especially immunoglobulin G, have widespread and varied
applications, including ones in diagnostics,84,85 as bioaffinity ligands in purification of
high-value pharmaceuticals (eg cytokines and blood-clotting factors)86 and as probes indiverse biochemical experiments.85,87-90 Perhaps the most exciting potential applications
of antibodies are in the area of therapeutics.91,92 Animal IgG can be “humanized” so thatit is not rejected by the human immune system.93
31
Antibodies are produced by B-cells. However, B-cells themselves can’t grow
outside an animal. For this reason, Kohler and Milstein94 developed a theory and methodto produce monoclonal antibodies, and were awarded the 1984 Nobel prize for medicine.
The basic unit of most mammalian antibodies is a glycoprotein (~150 KD),which consists of four polypeptide chains, two light chains (~25 KD) and two heavy
chains (~50 KD) that are connected by disulfide bonds. Each light chain is composed of
two domains, one variable domain (VL) and the other one constant domain (CL). Thereare two types of light chains, Kappa (k), lambda (l). In humans, 40% of light chains are
l, while 60% are k.
Each heavy chain consists of one variable domain (VH) and three or four
constant domains (CH1, CH2, CH3 and CH4) which depend on antibody isotypes. The
hinge region is located in the region between CH1 and CH2 domains, and allowsflexibility between the two Fab arms of the Y-shaped antibody molecule in order to
accommodate binding requirements. The heavy chain also serves to determine antibodyclasses. Five different classes or isotypes of antibody are distinguished by their heavy
chains, that is, IgG to g, IgE to e, IgA to a, IgM to m, IgD to d (Table 3.1).91 Each isotype
has a unique specialized function, which allows it to perform a certain task in the
immune response to different pathogens. IgG1 is the most abundant antibody subclassfound in human blood.
The Fc fragment of IgG is composed of a dimer of two C-terminal constant-
homology regions of the heavy chain, that is, two constant domains: CH2 and CH3. TheCH2 domain consists of about 110 amino acids, while the CH3 domain consists of about
106 amino acids. The two monomers are related with a perfect two-fold axis. Figure 3.1shows the crystal structure (PDB: 1MCO)95 and schematic representation of antibody
IgG.
32
Figure 3.1. Antibody. (a) crystal structure of intact human IgG1 which lacks functionalhinge regions, (b) schematic representation of an antibody.
Table 3.1. Characteristics of Human Antibody Isotypes
antibody class IgG IgE IgA IgM IgDantibody subclass IgG1 IgG2 IgG3 IgG4 IgA1 IgA2
heavy chain g1 g2 g3 g4 e a1 a2 m dmolecular weight (kDa) 146 146 165 146 188 160 160 970 184
IgG is the most important class of antibodies and obtained from human plasma,
ascites fluid, fetal calf serum, culture supernatants of engineered cells (eg hybridoma andbacterial cells) and other sources, then it must be purified for most applications.
However, the purity of IgGs is critical, particularly for therapeutic applications. Usually
its purification is achieved via a chromatographic technique, and there are severaloptions for this. Size-exclusion and ion-exchange96,97 methods have both been used, but
affinity chromatography is the most widely applied.86,98,99 Monoclonal antibodies (mAbs)designed to bind a specific antigen may be purified using supports based on that
antigen.100 A drawback in that approach is that the binding constants for the antigen tend
Fab
Fc
VH
VH
-s-s- -s-s-
CH 2 -s-s-
CH 3
heavy chain
heav
y cha
inlig
ht ch
ainCH 1
CL
-s-s-Fab
Fc(a) (b)
33
to be so high that harsh elution conditions are required and denaturation of the IgGs can
occur. Moreover, for widespread large-scale purification of mAbs, methods that workirrespective of the mAb epitope are most important. Such generalized methods for
affinity chromatographic purification of antibodies rely on their interactions with ligandsthat bind non-variable regions on the antibody surface.98,101 Usually these ligands are
naturally occurring proteins that have this characteristic, like protein A from
Staphylococcus aureus and protein G from Streptococcus.102,103 Affinity columns basedon protein A are the most widely used for several reasons. First, protein A is well-
characterized and may be obtained from recombinant bacteria.102,104 Second, protein Ainteracts with the Fc fragment of IgG with a high affinity constant (~10-7M).105 Third,
protein A is stable over a wide range of pH 2-11, it can refold after treatment with
denaturating solutions like urea and guanidinium salts,106 it can even be cleaned using0.5 M NaOH, hence the affinity supports can sometimes be recycled.107 Finally, protein
A is easily coupled to supports.
3.2.2 Protein A and Its Binding with Immunoglobulin GProtein A is a cell wall component of Staphylococcus aureus. It has five highly
homologous IgG-binding domains A, B, C, D and E, each of which consists of 58-62
amino acid residues.108,109 The structure of fragment B of protein A has been determined
by X-ray crystallography and NMR spectroscopy.104,110,111 A major part of the structure offragment B is composed of two a-helices while the rest is folded irregularly (Figure
3.2c). The residues from these two helices in protein A participate in the protein-protein
interface that is located in the hinge region that connects the second and the thirdconstant domains of the heavy chain (CH2 and CH3) of Fc.
34
Generally, a protein contains a number of domains which are considered to be
the smallest functional elements of protein structure, and can create great diversity forprotein-protein interactions.112 Protein A recognizes antibodies by binding to their Fab or
Fc fragments. The binding of protein A to the Fc of the antibody is very strong and wellknown, while the behavior of binding between protein A and the Fab of IgG is rather
less well characterized.113 However, protein A shows weak binding activity with the Fab
of IgE, IgA and IgM.114-116
Crystallographic data for the complex between the key helix-loop-helix region
of protein A (the “B-domain”) and the human IgG Fc fragment (protein databanknumbers:1l6x and 1FC2; Figure 3.2a) is thought to illustrate the key hot-spots for the
interaction.104 It features contact of residues in the two helices of protein A/fragment B
(residues Gln128-Leu136, Glu144-Asp155) with b-turns of the IgG Fc region. This
structural model is also supported by data from NMR117,118 and mutational studies.119
Consequently, it has been proposed120 that the following protein A residues are important
for binding the Fc region of IgG: Phe124, Phe132, Tyr133, Leu136, Ile150, Lys154,
Gln128, Asn130, Asn147, and Arg146. Of these, Phe132 and Tyr133 may be pivotal;they form a hydrophobic pocket that encapsulates the Ile253 of IgG (Figure 3.2c).
35
IgG-Fc
Fragment B
Helix 1Helix 2
Figure 3.2. (a) The B domain of protein A complexed with Fc fragment of IgG; (b) anexpanded view of the same interaction from a different perspective; (c) “hot-spots” fromprotein A involved in the Fc binding.
(a)
(b)
(a)
(c)
36
3.2.3 Structure Based Design of Protein A MimicsEven though protein A binds IgG with high capacity and selectivity, several
deficiencies exist with current purification strategies, like high cost, especially for large-
scale applications. Protein A is an expensive bacterial product, and its productionincludes expensive and laborious procedures. Another drawback is that protein A may
leach from the matrix and contaminate the isolated immunoglobulins.121,122 For these
reasons, inexpensive, synthetic ligands with appropriate affinities for the non-variableregions of IgG are extremely interesting as potential ligands for affinity supports.
As early as 1987, Proath123 found that artificially thiophilic ligands might beused to replace protein A in the affinity purification of antibodies. Later Elkak124
proposed hystidyl ligands to be used; Khatter125,126 suggested that supported,
functionalized, pyridyl-pyridinium salts could also be used. However their poorselectivity for antibodies or incompletely characterized structures limited their
application. Recently, with the development of computer-aided molecular design and
the utilization of combinatorial technologies,127 Fassina’s group128 designed and prepareda multimeric peptide library which contains the general formula (X1-X2-X3)4-K2-K-G.
After screening the activity of three sublibraries, they found that the lead compound isTG19318 (Figure 3.3). TG19318 is a very active inhibitor of the binding of rabbit IgG to
protein A, and has broader specificity than protein A. TG19318 may be used to purify
not only IgG from different sources, but also IgA, IgE, IgM and IgY.129-131 The apparentaffinity constant for TG19318 binding to IgG was found to be ka = 3 * 105 M-1 and kd =
0.3 µM.132 The purities of isolated immunoglobulins were judged using SDS-PAGE andELISA. The optimal binding conditions between TG19318 and immunoglobulins are at
pH 6.5-7.5 with buffers at low ionic strength.133 However, there exist some limitations
for TG19318 use. TG19318 has poor selectivity, and does not distinguish amongdifferent immunoglobulin isotypes. It may be used to purify monoclonal antibodies, but
not to isolate either polyclonal IgA or polyclonal IgM from serum. The bindingmechanism between TG19318 and various immunoglobulins is unknown. There is no
direct evidence about the binding between TG19318 and the Fc portion of Igs.
37
Lowe’s group120 designed, synthesized and screened a nonpeptidic library using
triazine as a scaffold to mimic a key, Phe132-Tyr133, dipeptide motif on fragment B ofprotein A that is believed to play an important role in the interaction with the Fc
fragment of IgG.104 They found a completely different kind of lead structure, termed as22/8. This ligand prepared using solution phase has a lower affinity constant: ka = 1.4 *
10 5 M-1 and kd = 7.1 µM for the binding of human IgG, than that of protein A, while,
attached on agarose matrix, 22/8 (Figure 3.3) exhibits a high binding capacity of IgG:151.9 mg IgG/g moist wet gel, probably due to higher ligand concentration in the
affinity matrix.134 Like TG19318, the ligand 22/8 displays a broader specificity, and canbind immunoglobulins from different species, the binding order being as follows:
human>chicken>cow>rabbit>pig>horse>rat>goat>sheep>mouse. Its binding pattern is
not identical to that of protein A. However, the binding mechanism between 22/8 andIgG is also unknown. The purity of the isolated IgG was judged using only SDS-PAGE.
There are no data about ligand leaching and toxicity in the literature.
Nonetheless these lead ligands show some binding to IgG, and their applicationis a great help for large-scale purification because of their stability toward
cleaning-in-place procedures, they might not bind IgG with high selectivity, capacity andappropriate affinities. None of these have found widespread commercial application, so
we have begun to explore peptidomimetics of protein A as potential ligands for affinity
supports.
38
TG19318 22/8Figure 3.3. Structures of protein A mimics.
3.2.4 Techniques for the Binding Study of Ligands with IgG3.2.4.1 Affinity Chromatography
Affinity chromatography is a powerful fractionation technique for large-scale
purification of biotechnological products. Antibody purification is carried out usingnatural affinity ligands (such as proteins A and G) via this technique. Affinity
chromatography is composed of five steps in the following order: activation of the
matrix, coupling of ligands, adsorption of the antibodies, elution, and regeneration of theaffinity matrix. The theory and application of affinity chromatography have been
depicted in books and articles.135-137
The principle of affinity chromatography (Figure 3.4) is based on molecularrecognition between antibodies and ligands. Commonly, any antibody that needs to
purify has an inherent binding site called recognition site. The antibody is able torecognize a ligand molecule via this site. If the ligand is immobilized on a polymeric
matrix, when a biological sample, such as blood serum, is passed through the affinity
column, the immobilized ligand can capture the antibody selectively. The elution bufferis passed through the column by changing external conditions, such as pH value, ionic
strength, solvents and temperature, so that the complex consisting of the
N
N
N
HN NH
NH
OHOH
Gly-Lys-Lys-Tyr-Thr-ArgTyr-Thr-Arg
Lys-Tyr-Thr-ArgTyr-Thr-Arg
39
antibody and ligand is no longer stable; the antibody can then be released from the
complex and eluted in a purified form.
Figure 3.4. Schematic presentation of antibody purification by affinity chromatography.
+
matrix ligand
immobilized ligand
antibody
impurities
pure antibodymatrix
elution buffer
40
3.2.4.2 Saturation Transfer Difference NMR SpectroscopyVarious NMR based techniques, for example, transferred NOE, diffusion or
relaxation-edited NMR, 15N chemical shift studies and saturation transfer difference
(STD), have been employed to facilitate the screening of compound mixtures forcomponents which bind protein targets.138-143 STD NMR spectroscopy is a very useful
and important technique. STD, which means the difference between a saturation transfer
spectrum and a normal NMR spectrum, can provide a fast and sensitive method to screenlibrary compounds for their binding activities to the protein, and to identify the binding
epitope of ligands to the protein because the ligand residues which directly contact to theprotein exhibit much stronger STD signals than others. The range (10-3 ~ 10-8M) of
dissociation constants for ligands to bind to IgG is required.144 Figure 3.5 shows the
effect of a selective saturation pulse on the antibody to bind ligand molecules illustratedas an ellipse. First, several antibody resonances are saturated by the selective pulse. This
saturation is then spread over the entire antibody as the intramolecular saturation
transfers. This change is indicated by the shading of the antibody, from light shade todeep shade. Even though the resonances of the small ligands are not directly affected by
the selective pulse, those ligand molecules which interact with the antibody are saturatedas intermolecular saturation transfers. The saturated ligands are released from the
complex consisting of ligands and antibody, and enter the solution via chemical
exchange. The released ligands may be detected. Some STD NMR studies for mypeptide ligands to bind IgG were performed, but the results of these studies could not be
validated since I do not have standard ligands, which are already known to bind to IgG,for comparison.
41
Figure 3.5. Basic principle of STD NMR spectroscopy.
3.2.5 Conformational Studies of Mimetic LigandsConformational studies of mimetic ligands are very necessary in biological and
medicinal chemistry. They reveal useful information concerning the preferred
conformation of the mimetic ligand in solution and the important residues in the
preferred conformation. They also provide information on ligand-receptor interactions,which is helpful to revise ligand design. The conformational studies presented here
include NMR, CD and molecular modeling studies.
3.2.5.1 NMR StudiesA combination of several NMR techniques is a very powerful tool in practice
for structural determination of peptidomimetics, of which the quality crystals are not
easily accessible.145,146 Useful information for identification of secondary structures, such
as 1H-1H distance, coupling constant 3J, torsion angle, etc., can be obtained. Table 3.2
summarizes several NMR techniques in this study.
Table 3.2. Important NMR Techniques Used in This Study
NMR technique observed data useful information
1D 1H NMR chemical shift and torsion angle3J-coupling constant
DQF-COSY and TOCSY 3J-coupling crosspeaks through-bond connectivitiesresidue assignment
ROESY or NOESY proton close contacts sequential assignmentdistance geometry
3J-Coupling constant. It is an important parameter in the determination of
peptidomimetics structures,147,148 and directly relates to the dihedral angle or torsionangle, that is, the spatial arrangement of residues. The dihedral angle is often used to
determine protein secondary structure. C-N-Ca-C in para are the atoms along a protein
backbone. The dihedral angle of (C, N, Ca, C) is called f torsion angle while the
dihedral angle of (N, Ca, C, N) is called y torsion angle. In terms of the following
Karplus equation, the torsion angle (f) values in a polypepide may be estimated.149
3JHNa = 6.4 cos2q - 1.4cosq + 1.9
where q = | f - 60o |
For ideal a-helix and b-sheet, the estimated values147,150 of torsion angle and
coupling constant 3JHNa are:
For a-helix, f = ~ -60o and 3JHNa < 6 Hz
b-sheet, f > -118o and 3JHNa > 8 Hz.
43
NOE or ROE-Observable Proton Close Contacts. 1H-1H distances can be
estimated by either the nuclear Overhauser effect spectroscopy (NOESY)151-153 or therotating frame Overhauser effect spectroscopy (ROESY)154,155 experiments and
measuring cross peak intensity. Generally, NOE includes three effects: negative, nulland positive enhancements. Negative enhancement is observed for large molecules
whose molecular weight is greater than 2000, while positive enhancement is expected
for small molecules whose molecular weight is less than 1000.155,156 If medium-sizedmolecules are used for NOESY experiment, the NOE is often close to zero. In this case,
ROESY pulse sequence should be chosen because a weak radiofrequency and variousmixing times are applied, and this minimizes false NOE effects and HOHAHA cross
peaks and then increases the cross-peak intensity with correlation time.157 Overall,
NOESY is only useful for proton close contact information of small and large molecules,while ROESY is applicable to all-sized molecules, especially to medium-sized
molecules.
NMR Characteristics of Ideal Helix. helix is one of the most important
secondary structural motifs in proteins.158,159 It often plays a key role in molecularrecognition. In a helical structure the polypeptide backbone is tightly wound around the
long axis of the molecule, and the R groups of the amino acid residues protrude outward
from the helical backbone. The repeating unit is a single turn of the helix, which includes3.6 amino acids. In case of a standard helix, the three-dimensional path through its axis
is a perfectly linear. However, helices have been observed to be non-linear due tosolvent induced distortions,160 peptide bond distortions161,162 and others.163
NOE-observable 1H-1H distances and the coupling constant (3JHNa) are two
important parameters in the determination of helix structure of polypeptide. The distance
between the hydrogen atoms X and Y located in the amino acid residues in the sequencepositions i and j respectively, is presented by dXY(i, j). Specifically, daN(i, j) ≡ daN(aHi,
NHj), dNN(i, j) ≡ dNN(NHi, NHj), etc. Figure 3.6 shows some distances defined in the
direction from the N to C terminus of the polypeptide chain.164
44
Figure 3.6. Some short-range proton-proton distances in a peptide chain.
NOEs may be classified as strong, medium and weak, which are represented bythe thickness of the line. The characteristic patterns of short-range NOEs in an ideal
helix are described in Figure 3.7.165
Figure 3.7. Short-range NOEs observed in an ideal helical conformation.
NH
C C N C C N C C N C CH HH
CH2 OCH2 O
H
CH2
H
O
H
CH
H
Oi
i
ii+1
i+1
i+1i+2
i+2
i+2
i+3
i+3
i+3H
dNN
d aN
d (i, i+3)a
d (i, i+3)aN
b
1 2 3 4 5 6 7dNN(i,i+1)
daN(i,i+1)
daN(i,i+3)
dab(i,i+3)
daN(i,i+2)
dNN(i,i+2)
3JHN (Hz) 4 4 4 4 4 4 4
45
3.2.5.2 Circular Dichroism StudiesCircular dichroism (CD) is often applied for the structural characterization of
peptides or proteins since CD spectra are remarkably sensitive to the backbone
conformation of proteins.166,167 CD spectra of peptides or proteins in the 190-230 nmregion result from the peptide amide chromophores, and the chiral environment of all
amide bonds and amide-amide interactions.168
Different secondary structural types of proteins display distinct CDcharacteristics. Helical structures are characterized by a strong positive p-p* band
between 190-195 nm, a negative p-p* minimum at 208 nm and a negative n-p*
minimum at 222 nm.158,169 A strong positive p-p* band between 195-200 nm and a
negative n-p* band between 215-220 nm are the characteristics of b-sheets.170,171 For
random coils, the CD spectra often show a strong negative p-p* minimum at 200 nm and
a weak positive n-p* band near 220 nm.172
The CD spectrum of a protein often reflects the secondary structural content ofthis protein. The CD signal at 222 nm is used for a rough estimation of the helical
content via some equations.173
A number of solvent systems may be used to promote the helix characteristics
of peptides, such as trifluoroethanol (TFE)174,175 and hexafluoroisopropanol (HFIP).176
The main effects of TFE and HFIP result from their significantly weaker basicity.177 Inthese solvent systems, hydrogen bonding of amide protons to the solvents is decreased,
and intramolecular hydrogen bonds are strengthened. Consequently, this effect stabilizessecondary structures. In addition, TFE is a less polar solvent, and interrupts hydrophobic
interactions and denatures the tertiary and quaternary structure of proteins.178
3.2.5.3 Molecular Modeling StudiesMolecular dynamic simulation may be applied to predict various possible
conformations for particular molecules and to visualize the structures of the
conformations. Generally, two types of simulations are used for the modeling of peptides
or mimetics. One is NMR data independent simulation wherein the NOEs or ROEs
46
obtained from the 2D NMR experiments are not required for input as restraints for the
simulation. Only the parameters from the software are used. The other is NMR dataconstraint simulation wherein the NOEs or ROEs data must be set up as limits before
simulation runs. Conformations will then be generated under this condition using theselected simulation methods.
3.3 Design of New Protein A Peptidomimetics
Protein A includes two helices, it is very important to understand helical
mimics. Commonly, helical conformation is not the minimum energy conformation ofshort peptides which consist of less than 20 amino acids. A variety of approaches have
been adopted to stabilize helical peptides, which include: first, noncovalent side chainconstraints, such as hydrophobic interactions,179 metal ion induction,180-182 and salt
bridges;183,184 second, covalent bonding between side-chains, such as i to i + 3, i to i + 4,
or i to i + 7 linkages,185-189 and disulfide linkages which span non-adjacent loops betweeni to i + 4 and i to i + 7;190-192 third, incorporation of unnatural amino acids into short
peptide sequences (for example, a-aminoisobutyric acid (Aib) is able to stabilize helical
structures in short peptides).193-197 Besides, short peptides may be stabilized by somesolvents, such as trifluoroethanol198 and hexafluoroisopropanol,176 intrinsic helix
dipole,176,199 and C- or N- terminal capping motifs.200-202 Based on the helix-loop-helix
structure of protein A and the approaches summarized above, the following protein Apeptidomimetics are proposed (Figure 3.8). Of seven peptidomimetics, five include two
Aibs and resemble Balaram’s helix-turn-helix motif.194 Aminocaprionic acid [Acp,
NH2(CH2)5COOH] is used as a linker similar to the loop of protein A.
Figure 3.8. Sequence of the helix-loop-helix fragment of protein A and sequences ofthe peptidomimetics targeted.
Compared with the protein A original sequence, peptidomimetics 1-5 contain
most of the amino acids identified as “ hot-spots”, which are underlined, to bind IgG/Fc.
A key, Phe132-Tyr133, dipeptide motif is involved in each of peptidomimetics 1-6.However, all of the peptidomimetics are much shorter than the protein A original
sequence, meaning that they are much easier to make. In peptidomimetics 1-6 the N-
terminus is capped with succinic acid which provides a negative charge to stabilize theintrinsic helix dipole. The Asp next to succinyl reinforces this stabilization. Succinyl-
Asp is used to form a N-terminal capping box.199,200 The Aib is incorporated to thepeptidomimetics and expected to enhance helix stability. The Asn used as a C-terminal
capping box is intended to stabilize the helical conformation by formation of a side-
48
chain to main-chain i + i-4 interaction.201 Replacement of Ile, Phe or Gln with Ala in the
peptidomimetics 2 - 5 is intended to enhance helix stability.203 In peptidomimetics 4 and
5 the N-terminal or C-terminal side is expanded to see if this is important to both helixstability and binding with IgG. Peptidomimetics 6 and 7 were minimalist designs to
mimic only the first and second helical regions in the protein A helix-loop-helix motif,respectively.
3.4 Solid Phase Syntheses of Peptidomimetics Using Fmoc Approach
All the peptide sequences were prepared using Rink’s amide linker on HypoGel
400 Ram resin via the conventional Fmoc approach.204-206 Peptidomimetic 1 was taken asan example, and its synthesis by solid phase was presented in Scheme 3.1. In this
scheme there are many repeated steps (coupling between –COOH and –NH2, andremoval of Fmoc). Most of the couplings were performed using HBTU/HOBt207 except
that of Aib. Since Aib is a spatially hindered residue the coupling with Aib is very
difficult and does not work well using these coupling reagents. Two other couplingmethods with several different conditions were tried. One is where Fmoc-Aib-OH was
first transformed to Fmoc-Aib-F using cyanuric fluoride,208 and the Fmoc-Aib-F wasthen used to react with other amino acids. The other is where tetramethyl fluoro
formamidinium hexafluorophosphate (TFFH)209 made by ourselves was used as coupling
reagent instead of HBTU/HOBt during the coupling reaction. Both methods work well,and the second one was selected for the syntheses of seven peptidomimetics because
several grams of TFFH may be prepared at one time with high yield. In order for Aib to
be coupled to the sequence successfully, double coupling cycles210 are required, and eachused 4 equivalents of Fmoc-Aib-OH, 4 equivalents of TFFH and 8 equivalents of DIEA.
For the same reason, the coupling reaction of the amino acid following the Aib couplingneeds to carry out twice too. Table 3.3 summarizes purity, yield and MS (MALDI) data
for seven peptidomimetics.
49
Scheme 3.1. Solid Phase Synthesis of Peptidomimetic 1
Table 3.3. Summary of Purity, Yield and MALDI-MS Data for 7 Peptidomimeticsa
compound purityb (%) yield MALDI MS for (M++H)UV Sedex (%) calc¢d found
aHypoGel 400 RAM (0.53 mmol/g) was used for the syntheses of the seven peptidomimetics. bPurityassessed by HPLC for crude via monitoring UV absorption at 254 nm and using an evaporative lightscattering detector (Sedex).
The strategy used in this study was first to record CD spectra for all the
peptides in pH 4 phosphate buffer (20 mM), then with varying concentrations of
1,1,1,3,3,3-hexafluoropropan-2-ol (HFIP). Recording CD spectra using buffer mediumrevealed if the peptide sequences showed any biases towards helical conformations that
were observable by that technique. Similar experiments using HFIP/buffer were used toreveal the presence or absence of helicity under conditions that are more conducive to
this. Consequently, these analyses were used to select the compounds that would be
studied more thoroughly by NMR and molecular simulations.
3.5.1 CD Studies of PeptidomimeticsThe CD spectra of peptidomimetics 1, 3-7 (50 µM) in phosphate buffer (20µM,
pH=4) and at different concentrations of HFIP are shown in Figures 3.9, 3.10 and 3.11.
Peptidomimetic 7 shows no observable bias towards helical conformations under anyconditions, and its CD spectra are characteristic for random coil conformations. The
spectra recorded in water indicate largely unstructured fragments with a small
contribution of a-helical secondary structure for peptidomimetics except for 6. The
addition of HFIP stabilized an a-helical conformation. There are one distinct maximum
between 190-195 nm and two minima at 222 nm and 208 nm, which are thecharacteristics of a-helical secondary structure. Initially, the helicity increases steadily
with the concentration of (CF3)2CHOH. The helicity does not change further or changes
little when the concentration of (CF3)2CHOH reaches some values, for example, 20% (by
volume) for peptidomimetic 1 and 15% for peptidomimetics 3-6, which were selectedfor NMR studies.
The CD signal at 222 nm is used to make an estimation of the helical content.173
Table 3.4 presents the results of the helical content either without or with (CF3)2CHOH
for peptidomimetics 1, 3-6 at 25 ˚C. Surprisingly, these data show that peptidomimetic 6was the most helical of the set. This result suggests that the helicities of the peptide
51
sequences 1, 3-5 are mainly from the contribution of the amino acids similar to those of
peptidomimetic 6.
Table 3.4. Summary of CD Data and Estimated Helical Contents forPeptidomimetics 1, 3-6
Figure 3.9. (a) - (b) CD spectra for compounds 1 and 3, respectively, at 50 µMconcentrations in pH 4 phosphate buffer (20 mM), and in the indicatedbuffer:(CF3)2CHOH ratios (by volume).
(a)
(b)
[q]
(10-3
deg
cm2 dm
ol-1
)
Wavelength (nm)
Wavelength (nm)
[q]
(10-3
deg
cm2 dm
ol-1
)
-20
-10
0
10
20
190 200 210 220 230 240 250 260
0%5%15%20%50%
-30
-20
-10
0
10
20
30
190 200 210 220 230 240 250 260
0%2%5%10%15%50%
53
Figure 3.10. (a) - (b) CD spectra for compounds 4 and 5, respectively, at 50 µMconcentrations in pH 4 phosphate buffer (20 mM), and in the indicatedbuffer:(CF3)2CHOH ratios (by volume).
Wavelength (nm)
[q]
(10-3
deg
cm2 dm
ol-1
)
Wavelength (nm)
[q]
(10-3
deg
cm2 dm
ol-1
)
(a)
(b)
-30
-20
-10
0
10
20
30
40
190 200 210 220 230 240 250 260
0%2%5%10%15%50%
-30
-20
-10
0
10
20
30
40
50
190 200 210 220 230 240 250 260
0%2%5%10%15%50%
54
Figure 3.11. (a) - (b) CD spectra for compounds 6 and 7, respectively, at 50 µMconcentrations in pH 4 phosphate buffer (20 mM), and in the indicatedbuffer:(CF3)2CHOH ratios (by volume).
[q]
(10-3
deg
cm2 dm
ol-1
)
Wavelength (nm)
Wavelength (nm)
[q]
(10-3
deg
cm2 dm
ol-1
)
(a)
(b)
-30
-20
-10
0
10
20
30
40
190 200 210 220 230 240 250 260
0%5%10%15%50%
-15
-10
-5
0
5
10
15
190 200 210 220 230 240 250 260
0%5%10%15%20%50%
55
In addition to the CD measurement for each compound, the CD spectra of each
compound mixed with IgG have also been recorded. This study is to know whetheraddition of IgG to the peptidomimetics improves or changes their a-helical secondary
structure or not. Consequently, for peptidomimetics 1-5, and 7, there is no significant
difference in CD spectra between peptidomimetics alone and the mixture ofpeptidomimetics with IgG. For peptidomimetic 6, however, the addition of IgG increases
the a-helical secondary structure content, from –10.679 to –12.324, corresponding to
62% and 72% (Figure 3.12).
Figure 3.12. CD spectra for peptidomimetic 6 (50 mM) alone (A) and peptidomimetic 6(6 mM) mixed with IgG (0.125 mg/ml) (B) in pH 4 phosphate buffer (20 mM).
-20
-10
0
10
20
190 200 210 220 230 240 250 260
Sequece 6Sequence 6 mixed with IgG
(A)
(B)
Wavelength (nm)
[q]
(10-3
deg
cm2 dm
ol-1
)
56
3.5.2 NMR Analyses of PeptidomimeticsThree types of solvent systems were used in NMR studies. Specifically,
DMSO-d6, 90% H2O : 10% D2O , and 80% H2O : 20% (CF3)2CDOD were used for
compound 1; DMSO-d6, 90% H2O : 10% D2O , and 85% H2O : 15% (CF3)2CDOD wereused for compounds 4, 5 and 6; DMSO-d6 was used for compound 2, and 90% H2O :
10% D2O was used for compound 3; DMSO-d6 and 90% H2O : 10% D2O were used for
compound 7. The ratio of H2O and (CF3)2CDOD was determined by a series of CDexperiments (Table 3.4). Whenever water was used, it was buffered with 20 mM sodium
phosphate (pH = 4). Since compounds 1, 2 and 3 are structurally similar, and compound7 does not have any helical propensity based on CD data, compounds 1, 4-6 were finally
selected for NMR conformational studies.
3.5.2.1 Characterization of Seven PeptidomimeticsChemical shifts of seven peptides were assigned by analyzing the spectra of 1D
and 2D NMR including DQF-COSY,211 TOCSY,212 NOESY151-153 or ROESY.154,155 Thespin systems of amino acids were identified by the through bond-coupling network of
DQF-COSY and TOCSY spectra obtained. One cross peak for every aH-NH coupling
of each amino acid residue is expected to appear in the fingerprint region of DQF-COSYand TOCSY spectra. The sequential assignments for peptides were carried out by the
through-space NOE connectivities of NOESY or ROE connectivities of ROESY
experiments. The amide region and fingerprint of the NOESY and ROESY spectraprovide important information to verify the backbone structure of a peptide.
The solvent system (90% H2O/10% D2O) was chosen to illustrate thecharacterization of peptidomimetics 1, 4, 5 and 6. The fingerprint region of TOCSY
spectra, and the NH-NH and Ca/NH regions of ROESY or NOESY spectra of these
compounds were shown in Figures 3.13-3.20. The chemical shifts and coupling
constants of peptidomimetics 1, 4-6 were tabulated in Tables 3.5-3.8 respectively.
Figure 3.13. Fingerprint region of a 80-ms TOCSY spectrum of mimic 1 in 90%H2O/10% D2O. Individual spin systems are identified with one-letter symbols for theamino acid residues.
Y3 F13H10
N11D1
N15
Q9
H7 F2
I14
I5L6Acp8
58
Figure 3.14. (a) - (b) NH-NH and Ca/NH “fingerprint” regions, respectively, of a 150-ms ROESY spectrum of mimic 1 in 90% H2O/10% D2O, pH=4, 25 oC.
I14N-N15ND1N-F2N
N11N-Aib12NAib12N-F13N
L6N-H7NH7N-Acp8N
Aib4N-I5N
I5N-L6N
F2N-2,6H
F13N-2,6H
H10aN
N15aN
D1a-F2N
H7a-Acp8N
F13a-2,6H
F2a-2,6H Y3a-2,6H
I5aN
F2a-Y3N
F2aN
N11a-Aib12N
H7aN
N11aN
Q9a-H10N
Q9aN
L6aN I14aN
Y3a-Aib4NY3aN
I5a-L6N
L6a-H7N
I14a-N15N
F13a-I14NF13aN
H10a-N11N
(a)
(b)
59
Table 3.5. Chemical Shifts and Coupling Constants of Mimic 1(in 90% H2O/10% D2O)
Figure 3.15. Fingerprint region of a 80-ms TOCSY spectrum of mimic 4 in 90%H2O/10% D2O. Individual spin systems are identified with one-letter symbols for theamino acid residues.
D1
Q2
R14
N15
N20
A5
Q19
N4
Q3
A13
A16
F6H11
Y7
A9
I18
(R14)NH
Acp12
L10
61
Figure 3.16. (a) - (b) NH-NH and Ca/NH “fingerprint” regions, respectively, of a 300-ms NOESY spectrum of mimic 4 in 90% H2O/10% D2O, pH=4, 25 oC.
F 6aN
L10 a-H11N
H11aN
Q2aN
Y7a-A ib8NA5a -F6N
F6a -Y7N
R 14aNQ3a-N 4N
Y7aN
I18a -Q19 NA9aN
H11a -Acp12N
L10aN
I18aN
A 5aN A16aN
A16a -Aib17N
F6N-Y7N
R14N-N15NQ2N-N4N A5N-F6N
N15N-A16ND1N-Q2NA16N-Aib17N
Y7N-Aib8N Aib8N-A9N
L10N-H11N
H11N-Acp12N
(a)
(b)
62
Table 3.6. Chemical Shifts and Coupling Constants of Mimic 4(in 90% H2O/10% D2O)
Figure 3.17. Fingerprint region of a 80-ms TOCSY spectrum of mimic 5 in 90%H2O/10% D2O. Individual spin systems are identified with one-letter symbols for theamino acid residues.
D1
R11
N12
A2
N20
A6K19
Q16
S17
H8F3
Y4
A10
I15
(R11)NH
A13
L18
Acp9
L7
(K19)NH2
64
Figure 3.18. (a) - (b) NH-NH and Ca/NH “fingerprint” regions, respectively, of a 300-ms NOESY spectrum of mimic 5 in 90% H2O/10% D2O, pH=4, 25 oC.
I15N-Q16N
F3N-Y4N
A2N-F3N
N12N-A13N
Y4N-Aib5N
L18N-K19N
H8N-Acp9N
Aib14N-L15N
D1aN N12aN
D1a-A2N
H12a-A13N
R11aN
K19a-N20N Q16aN
L18a-K19N
S17aNH8aN
Q16a-S17N
R11a-A6N
A13a-Aib14NA10a-H8N
A2a-F3NY4aN
A10aN
I15aN
F3aNF3a-Y4N
H8a-Acp9N
A2aN
S17a-L18N
I15a-Q16N
R11d-A13N
A13aN
Y4a-Aib5N
L7aN
(a)
(b)
65
Table 3.7. Chemical Shifts and Coupling Constants of Mimic 5(in 90% H2O/10% D2O)
Figure 3.19. Fingerprint region of a 80-ms TOCSY spectrum of mimic 6 in 90%H2O/10% D2O. Individual spin systems are identified with three-letter symbols for theamino acid residues.
Asp His
PheTyr
Leu
Ile
67
Figure 3.20. (a) - (b) NH-NH and Ca/NH “fingerprint” regions, respectively, of a 150-ms ROESY spectrum of mimic 6 in 90% H2O/10% D2O, pH=4, 25 oC.
IleNH-LeuNH
AspNH-PheNHPheNH-TyrNH
HisNH-LeuNH
IleNH-AibNH
HisNH-AmideNHTyrNH-AibNH
HisaN AspaN
HisaN
PheaN
Ilea-LeuNPhea-TyrN
TyraN
Leua-HisN
LeuaN
IleaN
Tyra-AibNAspa-AibN
(a)
(b)
68
Table 3.8. Chemical Shifts and Coupling Constants of Mimic 6(in 90% H2O/10% D2O)
3.5.2.2 a-Helical Conformation Observed via NMR Spectroscopies in Solution
The NMR studies were performed in 1:9 D2O : buffer medium (20 mMphosphate), and in (CF3)2CDOD : buffer using the same ratios used for the CD studies
indicated in Table 3.4. The following discussion only relates to the (CF3)2CDOD : buffermedia since the conformational preferences were more pronounced in that solvent
system. Chemical shifts (see Appendix E) were assigned via a combination of DQF-
COSY, TOCSY, and NOESY (4 and 5) or ROESY (1 and 6) spectroscopies. The lattertechniques were then used to detect close contacts of protons. NH-NH and Ca/NH
“fingerprint” regions of the NOESY or ROESY spectra of compounds 1, 4 - 6 were
shown in Figures 3.21-3.24. Intraresidue: daN(i,i), sequential: daN(i,i+1) and dNN(i,i+1),
and medium-range: daN(i,i+3) connectivities are denoted. The close contacts of protons,
along with coupling constant information, are summarized in Figure 3.25. Figure 3.7shows the crosspeaks that should be observed for ideal helical conformations.
Comparison of the data presented in Figure 3.25 with this shows that the N-terminalsequence for each of the model peptides has a more distinct conformational bias to
helical character than the C-terminal helix. Even peptidomimetic 6, that includes the
residues for the C-terminal helical part, shows a pronounced tendency towards helicalcharacter in the other {N-terminal} region. No long-range crosspeaks were observed,
again consistent with helical structures. These assertions are supported by data fromcoupling constants that show several small 3JHa,HN values (< 6 Hz) (see Appendix E).
Figure 3.25. (a) - (d) Summary of the sequential and medium-range connectivities forpeptidomimetics 1, 4-6 respectively. The intensities of NOE/ROE cross-peaks areindicated by the thickness of the lines. Where two resonances overlap so absoluteassignments were not possible, this is indicated with an asterisk (*).
When 1:9 D2O:buffer was used as the NMR solvent system, several short andmedium-range ROE or NOE connectivities were observed (Figures 3.14, 3.16, 3.18 and
3.20). The ROE or NOE connectivities and a number of small 3JHa,HN coupling constants
(< 6 Hz) (Tables 3.5-3.8) indicated a partial a-helical conformation within
peptidomimetics 1, 4 - 6. The a-helix propensity is mainly contributed from the
fragment of peptidomimetics 1, 4 - 6, which are corresponding to the first helical region.
After (CF3)2CDOD substitutes for D2O, based on the ratios (Table 3.4) for NMR solvent
system, the number of short and medium-range ROE or NOE connectivities increases(Figures 3.21-3.24). Thus addition of hexafluoroisopropanol to the medium results in a
stabilization of an a-helix of peptidomimetics 1, 4 - 6. No long-range ROE
connectivities were observed either before or after addition of hexafluoroisopropanol.
3.5.2.3 Secondary Structures of Peptidomimetics 1, 4-6 Generated fromConstrained Molecular DynamicsThe ROE/NOE connectivity data and dihedral angles (f) deduced from
coupling constants were used as distance and torsion angle restraints in constrainedmolecular dynamics studies. There were performed using the Quanta/CHARMm
package following a protocol similar to that described for quenched molecular dynamics(QMD)79,213 studies. Thus the NMR data were obtained to generate sets of molecular
coordinates, each one corresponding to an instantaneous conformational state of the
molecules studied. Overall these data give an impression of the most populatedconformational states that are consistent with the restraints applied from the NMR data.
Figure 3.26 presents the lowest energy structures of peptidomimetics 1, 4, 5, and 6 thatwere identified within 6 - 7 kcal/mol of the low energy conformation for that particular
peptidomimetic. Based on this simulation, all the peptidomimetics may populate helical
states at the N-terminus, but the C-terminal conformations of the residues designed tomimic the second helical region in 1, 4, and 5 display little or not helical character.
77
Figure 3.26. (a) - (d) Superimposed low energy structures generated forpeptidomimetics 1 (11), 4 (6), 5 (10), and 6 (12) {numbers of structures within the cut-off threshold are indicated in parentheses}, respectively. The side chains were omittedfor clarity in peptidomimetics 1, 4 and 5.
(a) (b)
(c) (d)
78
3.6 Summary
The structures of seven peptidomimetics have been characterized by NMR and
MALDI-MS. The a-helical secondary structures of peptidomimetics 1, 4-6 have been
characterized by NMR spectroscopies and CD spectra. Consequently, peptidomimetics1, 4 and 5 have some helical character, which are mainly in the residues near the N-
terminus. Peptidomimetic 6 with seven amino acids is the best one among seven mimics
based on helical content. The NMR spectroscopies of peptidomimetics show sequentialand some typical medium-range ROE or NOE connectivities, which signify an a-helical
conformation. Small 3JHa, HN coupling constants are additional supporting evidence.
(CF3)2CHOH, like trifluoroethanol, is a well-known helix-inducer. Addition of
(CF3)2CHOH to peptidomimetics stabilized their a-helical secondary structure,
especially for peptidomimetic 6 whose helical content enhances from 62% to 94%, asobserved in NMR and CD spectra. The evidence has shown that trifluoroethanol induces
a-helical conformation for the peptides or peptide fragments which have an inherent
propensity for such conformations.171,214 In terms of this observation, peptidomimetic 6probably has an inherent a-helix propensity. The residues close to the N-terminal of
mimics 1, 4 and 5 are structured better than those close to the C-terminal in the presenceof (CF3)2CHOH. This indicates that the former has a higher a-helix propensity than the
latter does.
CD studies provide an approach to see if a receptor improves the a-helix
propensity of a ligand via their interaction. This is an interesting study. IgG has been
proven to increase a-helical content of peptidomimetic 6 via this approach.
For the binding studies between ligands and a receptor, like IgG, via STD NMRspectroscopy, compounds 6 and 7 with IgG respectively were studies. There are no
standard compounds, which shows good binding to IgG, for comparison, it is hard to
make conclusions for my results. Mimics 1-7 were sent to Amersham Biosciences forbioactivity studies. Unfortunately, there were no binding activities to be found for these
compounds.
79
CHAPTER IVMONO- AND MULTIVALENT SMALL MOLECULE
PEPTIDOMIMETICS OF PROTEIN G FOR AFFINITY SUPPORTS
4.1 Specific Aims
The goal of this project is to synthesize some monovalent small moleculesdesigned by Amersham Pharmacia, and to design and synthesize our own multivalent
small molecules. Both groups of small molecules are intended to mimic protein G that isalso currently used to purify IgG. This research, specifically, attempts to:
a. synthesize several monovalent molecules, one of which has shown some
binding to IgG by Amersham’s preliminary data;b. find a scaffold, and synthesize multivalent mimics based on Amersham’s
designed ligands and my peptidomimetic 6 discussed in Chapter III;c. design our own monovalent compounds and synthesize building blocks;
d. develop a solid-phase methodology which can be used to attach building
blocks to the scaffold efficiently;e. make a small library of trivalent compounds via a parallel synthetic
approach;
f. characterize all mimics by NMR, MS, etc.;g. attach multivalent compounds onto sepharose for bioassay.
4.2 Background and Significance
4.2.1 Protein G and Its Binding Domain for IgGProtein G is a small globular protein produced by groups C and G
Streptococci. This globular protein consists of several nearly identical binding domains,ie III, B1, B2 and C2. The structures of these domains have been determined by means
of X-ray crystallography215-217 and NMR spectroscopy.218,219 Crystal structures of the
80
protein G binding domain complexed with the Fc fragment (PDB: 1FCC)220 and the Fab
(PDB: 1IGC)217 of IgG are known. Figures 4.1 and 4.2 show the details of the protein GC2 domain : Fc and the protein G domain III : Fab interactions respectively.
Protein G, like protein A, can selectively bind to IgGs, but with higher affinity(kd = ~ 10-8 M).105 So it is also often used to purify IgGs.221,222 Likewise, high cost limits
its application in IgGs purification. Therefore, novel cheap ligands with good selectivity
and high affinity are extremely expected.
4.2.1.1 Binding Between Protein G and Fc Regions of IgGProtein G can bind the Fc fragment very tightly as protein A does. Crystal
structure of the protein G C2 domain complexed with the Fc fragment (PDB: 1FCC)220
of IgG (Figure 4.1a) is known. The binding interface is located between protein G andthe hinge region which connects the CH2 and CH3 domains of IgG. Three residues,
Ile253, Ser254 and Gln311 from the CH2 domain, and nine residues from the CH3
domain were involved in the interactions. Of the twelve residues, nine residues aresituated within the loop regions of the Fc, three residues: Glu380, Glu382 and Gln438
are exposed on one of several b-sheets making up the CH3 domain. The residues from
the a-helix and the N-terminal portion of the third b-sheet of protein G are identified as
important residues for binding to the Fc by two independent experiments.223,224 Sauer-Eriksson’s group220 identified eight residues from protein G as hot-spots: Glu27, Lys28,
Lys31, Gln32, Asn35, Asp40, Glu42 and Trp43 (Figure 4.1b).
81
Figure 4.1. (a) The C2 domain of protein G /Fc fragment of IgG complex; (b) hot-spotsof C2 domain involved in Fc binding.
4.2.1.2 Binding Between Protein G and Fab Regions of IgGThe interactions between protein G and IgG/Fab feature a sheet region and a
helical region on the protein G fragment in close contact with the CH1 domain of theFab. Crystal structure of the protein G domain III complexed with the Fab (PDB:
1lGC)217 of IgG is known (Figure 4.2a). The first of these interactions is an antiparallelalignment of the second b-strand of domain III with the seventh b-strand of the CH1
domain of Fab (Figure 4.2b). The residues involved in this site are Lys15A to Thr22A
from protein G, and Ser209H to Lys216H from the Fab. This b/b interaction site
incorporates a few charged residues, Lys18A, Glu20A, Lys212H and Asp214H, which
lie along the outer surface of the b-strand and are exposed to the environment. The
other, called minor contact, contains residues Tyr38A to Gly43A at the C-terminal endof the a-helix from the domain III, and Pro125H to Tyr129H on the first b-strand of CH1
(Figure 4.2c). These two interaction sites are stacked together so that a huge binding
surface area is formed. Hydrogen bonds involved in the interactions are tabulated in
Table 4.1.
IgG-Fc
C2 domain of protein G
helix
CH3 CH2
(a) (b)
82
Figure 4.2. ViewerPro plot of interaction details between domain III of protein G andthe CH1 domain of IgG/Fab. Hydrogen bonds between these two domains are markedusing dashed lines. (a) The overall interaction; (b) the contact between the Fab andprotein G b-sheets; (c) the interaction between a b-strand of the Fab (on the left) and thea-helix of domain III (on the right).
CH1 domain
protein G:domain III
VH domain
VL domain
CL domain
IgG:Fab fragment
CH1 domain Domain III Domain IIICH1 domain
(a)
(b) (c)
83
Table 4.1. Hydrogen Bonds Between Domain III of Protein G and the CH1 Domainof IgG/Fab
donor acceptor distanceresidue atom residue atom (Å)
Lys216H Ne Lys15A O 3.03Lys18A N Asp214H O 3.18
Asp214H N Lys18A O 2.73Glu20A N Lys212H O 2.86Thr22A OHb Ser209H O 2.76Thr22A OHb Ser210H Ob 2.98
Tyr129H OH Asp41A O 2.76Val128H N Asn42A Og 3.02Tyr38A OH Pro126H O 2.96
4.2.2 Comparison of Protein A with Protein G Binding to IgGGenerally, protein G binds all of four human IgG subclasses as well as
monoclonal antibodies of mouse and rat. However, protein A binds to neither human
IgG3 nor rat IgG.221,222,225,226. Protein G binds human IgG with a higher affinitydissociation constant (~10-8M) than protein A (~10-7M) does.105 Interestingly, both
proteins A and G interact with the same part of IgG-Fc,225,227,228 even though they exhibitno sequence homology within their Fc-binding domains.108,229,230 The a-helix of either
protein A or protein G is involved in the interaction of IgG-Fc. Specifically, The binding
between protein A and the Fc is stabilized by hydrophobic interactions and fewer polar
contacts, while the binding between protein G and the Fc is stabilized by hydrogenbonds and salt links containing charged and polar residues, and occasional main-chain
atoms. Protein A has only 6 charged or polar interactions with Fc, while protein G has12. However, there are five hydrophobic contacts between protein A and the Fc, while
there is no hydrophobic contact between protein G and the Fc. So it is obvious that
protein A and G apply different interaction modes for their IgG/Fc binding. Despitethese differences, the interesting thing is that several of the Fc residues which interact
84
with protein A also interact with protein G since the helix 2 of protein A is located in
nearly the same region as the third b-strand of protein G.
The complex of protein G with the Fab (Figure 4.2a) displays an entirelydifferent way used in the interaction at the protein-protein interface. The binding
between protein G and the Fab is predominantly mediated by the hydrogen-bondformation between main-chain/main-chain, via pairing of two b-strands. This kind of
binding is totally different from that with the Fc, where the interactions from side-chain/side-chain predominate, via forming hydrogen bonds and salt links.
4.2.3 Structure Based Design of Protein G MimicsWith regard to protein G mimics, only one paper, “ synthesis of a dityrosine-
linked protein G peptide dimer” by Vranken’s group,231 was found. Based on thestructure of the binding domain (beta/beta strands) between protein G and IgG/Fab, they
designed and synthesized the dityrosine-linked peptide dimer using solid phasechemistry (Figure 4.3). The original sequence of protein G B1 domain contributing to
the beta/beta interactions with the Fab fragment of IgG is presented on the right, and
dashed lines indicate hydrogen bonds. The dityrosine peptide dimer (on the left) wasobtained from the replacement of Lys with Tyr and dimerization of the monomer.
In this paper they did not provide evidence for the beta sheet conformation whichdityrosine peptide dimer was expected to adopt in solution, and did not present any
bioassay data.
85
GlyHN
Leu
O
HO
OH
NH
O
GlyLeu Glu Thr
GluThr
Thr Glu Gly Lys Leu
Fab
B1 of protein G
dityrosine peptide dimer
Figure 4.3. Structure of protein G b-sheet/IgG b-sheet interaction mimic.
4.2.4 Functionalized Modification of Poly(propylene imine) DendrimersDendrimers are chemically well-defined, highly branched molecules with a
perfect monodisperse and tree-like structures. Well architecture, extensive branching and
high surface functionality have distinguished dendrimers from classic polymers.
Syntheses, properties and applications of dendrimers are discussed in several reviewsand books.232-239
Poly(propylene imine) dendrimers are one of the two classes of popularlystudied and commercially available dendrimers.238 Dendric molecules like compound
DAB-Am-4 (Figure 4.4) are attractive frameworks for syntheses of tetravalent and
higher oligomers of biologically active ligands. This is important because many protein-protein interactions feature multivalent ligands interacting with receptors to initiate or
perturb their association.2,18,240-243 Within this area of interest there are many situations inwhich it would be advantageous to attach ligands to all the sites except one on a dendric
system; for example, if three out of the four primary amine groups in DAB-Am-4 were
coupled to biomolecules then the remaining unfunctionalized one could support afluorescent or similar label, or be used to attach it to an affinity support. Further, in
86
combinatorial chemistry, size exclusion methods may facilitate more facile isolation of
dendric molecules than similar monofunctionalized ones.244,245
It is extremely difficult to devise reactions to selectively use n – 1 functional
groups out of a total of n at the periphery of a dendric entity. In fact, to the best of ourknowledge, this has not been reported before. The closest literature precedents would be
methods in which segments of dendric molecules are functionalized in different ways,246-
248 and these tend to involve de novo syntheses of the dendric core.249 This researchattempts to develop an alternative approach, also depicted in Figure 4.4, which takes
advantage of the relatively disperse arrangement of functional groups on supports forsolid-phase syntheses.250,251
The hypothesis that drove this research was that one of several reactive groups
could be reacted, selectively, with the resin leaving the others free to be transformed intoligands for biological interactions. This is not the same as other research in which
dendrimers have been used to increase the loading of resins because, unlike those
studies,252,253 the goal is to obtain molecules that contain the dendric core fragment in theproducts after cleavage from the resin.
87
N N NH2
NH2
H2N
NH2
DAB-Am-4
E X(i)
(ii) add peptidomimetic
N N NHpeptidomimetic
NHpeptidomimetic
HN
NHpeptidomimetic
E
cleave
EN N NHpeptidomimetic
NHpeptidomimetic
H2N
NHpeptidomimetic
can be usedfor labeling orfor anchoring
to affinity supports
Figure 4.4. Conceptual approach to trifunctionalization of three of the four sites in thetetravalent core of DAB-Am-4.
The concept outlined in Figure 4.4 was tested in the context of finding ligands
that interact with immunoglobulins G (IgG). The focus of the current research was tofind peptidomimetics based on the hot-spots involved in the two interaction sites
between protein G/domain III and IgG/Fab (Figure 4.2). We hypothesized that these twointeractions form a hydrophilic perimeter around a hydrophobic core formed among
Pro125H, Thr211H and Val213H. This is a typical type of hot-spot in protein-protein
interactions that has been compared with an “O-ring”.26 We chose to target this region ofthe IgG Fab fragment for our peptidomimetic design. It was anticipated that one unit on
a dendrimer might rest comfortably in the hydophobic pocket while the others couldform additional contacts with the protein surface. The site on the dendric molecule that
did not contain a peptiomimetic “warhead” would be used to anchor the whole dendric
molecule to a solid support.
88
4.2.5 Affinity: A Software For Docking Ligands to the Binding SitesAffinity is a suite of programs which is designed for automatically docking a
ligand molecule to a receptor molecule. For a given system of a ligand and a receptor,
Affinity can automatically find the properly binding structure for this system based onthe energy of the system on Insight II platform.
There are a few features in Affinity. First, Monte Carlo254 and Simulated
Annealing strategy255, both of which are powerful algorithms, were employed to dock aligand to a receptor. Second, a full molecular mechanics forcefield was used in searching
for and evaluating docked structures. That is, Affinity takes into account electrostaticfactors, hydrogen bonding, hydrophobic interaction and steric effect. Third, a receptor
may be divided into two sections: one is the binding site, in which atoms are active and
move freely; the other is called “bulk”, in which atoms are not in the binding site and areheld rigidly during the docking process. This feature allows a receptor to adjust either
the binding of different ligands or different binding modes of the same ligand. Fourth,
the ligand itself is flexible, which allows different conformations of the same ligand tobe docked to a receptor. Fifth, a three dimension grid256 surrounding the movable atoms
containing the binding site atoms of a receptor and all atoms of a ligand may beconstructed and presents as a “bulk” in order to reach the above aims. The following
steps are required for docking ligands to the binding site: a. download a receptor from
protein data bank and fix incorrect part of the structure; b. build a ligand using Buildermodule in Insight II; c. define a subset from a receptor for the binding site; d. create an
assembly of a ligand and a receptor; e. assign potentials for the assembly; f. generategrids; g. perform docking calculation; h. get docked structures and analyze results.
4.3 Design of Protein G Mimics for IgGs
The Affinity module of Insight II was used to explore the docking of severalmolecules that appeared to have desirable features for binding to the IgG Fab region.
89
Affinity works in the following way. The user defines a region of the target protein
surface and a synthetic ligand, then the docking process is simulated using the Affinitymodule. It minimizes the conformation of the ligand and the user-defined region of the
protein surface hence accommodating the possibility of an induced fit. The particularregion of IgG/Fab considered was the one that encompasses the hot-spots for binding of
IgG to protein G domain III, ie a ~210 Å2 area on the IgG/Fab surface between the two
interaction sites shown in Figure 4.2b and c. This region of the protein surface isessentially flat, but it contains a hydrophobic channel and some Lewis basic site (formed
by Ser127H, Ser209H and Lys215H amino acids of the Fab fragment). Wehypothesized that the hydrophobic channel might accommodate a residue such as
Leu17A, Tyr38A and/or Thr21A on protein G, while the H-bond acceptors might match
with the Lys15A, Lys18A, Glu20A, Thr22, or Asn42A of protein G. Syntheticstructures that might bind were selected for compatibility with these surface
characteristics, and their synthetic accessibility, then their binding was tested using
Affinity. Ultimately this led to compounds A – C that gave favorable binding modes inthe Affinity-simulated docking to the selected patch of the IgG surface. Figure 4.5
shows their simulated binding modes.
90
HN N
N N NH NHO
O
NH
NN N H
N NH2O
ONH
NN N H
NHNO
O Ph
ONH2
NH2OA B C
Figure 4.5. Docking of the virtual leads A – C with the region of IgG that docks withthe protein G domain III.
Structures A – C were treated as “virtual leads”, from which a library of 18
trivalent compounds was designed, focused on these structures (Figure 4.6). Theconcept was that a supported form of the DAB-Am-4 polyamine would be coupled with
the three alkyne-electrophiles, or electrophile precursors, 8a-c, and the products would
be combined with the seven azides 9t – z to give products like 10.
91
HO NH
NH
O OC N HO N
HNH
OPh
O8a 8b 8c
O
Alkyne Coupling Partners
NHN Ar
O
N+-N
Ar =
OMe
OMeOMe
OMe
zywvut9
Azide Components
Cl
x
N
NH
10at
NHO
N NN
HN
O
NHNH
ON N
NNH
O
N
HNHN
ONN
N
HN
O
H2N
Representative Product
vacant site forattachement of affinity support
Figure 4.6. Library design: it was anticipated that the alkynes 8a-c would be coupled asupported dendric amine, then with the azide components 9 to give the products like 10.
4.4 Syntheses of Monovalent Protein G Mimics, Functional Compounds andBuilding Blocks for Multivalent Protein G Mimics
4.4.1 Synthesis of Compound 11Scheme 4.1 describes synthesis of compound 11 which was designed and
proven to be active to the binding of IgGs by Amersham. This is a one-step reaction.
Compound 11 was obtained by stiring the mixture of N-tosyl-3-pyrrolecarboxylic acidand ethyl-cis-2-amino-1-cyclopentane carboxylate for over ten hours. The Carboxy
group of N-tosyl-3-pyrrolecarboxylic acid is conjugated to the pyrrole ring, so several
coupling agents were tried for this coupling reaction: (a) DIC and HOBt, (b) oxalyl
92
chloride, (c) DIC or EDCI and DMAP, (d) TFFH. TLC indicated that (b) and (c) work
well, and compound 11 was obtained in 92% yield.
Scheme 4.1. Preparation of Compound 11
SO O
NOH
O
H2N OO
SO O
N HN
O
OO
+EDCI.HCl, DMAP
0 - 25 ˚C, 18 h
11 92%
4.4.2 Syntheses of Functional Compounds for Multivalent Protein G MimicsTwo approaches were used to prepare functional compounds. Scheme 4.2
depicts approach I applied to synthesize functional compound 15 (R = Me). The
coupling between pyrrole-3-carboxylic acid and ethyl-cis-2-amino-1-cyclopentanecarboxylate under the conditions of DIC or EDCI and DMAP gave intermediate 12 in
84% yield, which reacted with substituted benzene sulfonyl chloride, and afforded
93
compound 13 in 64% yield and 14 in 73% yield. By carefully controlling thetemperature and reaction time, the functional compound 15 was obtained in 85% yield.
This method was also used to synthesize other functional compounds (R = 4-MeCO, 4-MeO). Unfortunately, the hydrolysis of compounds 13 and 14 does not work well. The
yields are very low, and the major product is compound 22 (Scheme 4.3). Therefore,
approach II was employed to prepare these functional compounds (Scheme 4.4).Intermediate 12 was synthesized as described in approach I, and hydrolyzed completely
to give intermediate 22 in 90% yield, which was followed by the substitution257 of the N-proton of the pyrrole ring with substituted benzene sulfonyl group and gave the final
functional compounds 16 - 21 (Table 4.2). In approach II, we found that if the
substituted group in benzene ring of aromatic sulfonyl chloride is an electron-donatinggroup, the substitution works well and gives functional compound in higher yield. If the
substituted group is an electron-withdrawing group, the substitution does not work well.
The position of the substituted group in the benzene ring also affects the reaction. Thesubstituted groups in the ortho and para positions of the benzene ring facilitate the
reaction, while the substituted groups in the meta position of the benzene ring is againstthis reaction.
94
Scheme 4.2. Synthesis of Functional Compounds (approach I)
SO O
N HN
O
OHO
R
SO O
ClR
NaOH/Dichloroethane25 ˚C, 14 h
+
SO O
N HN
O
OO
R
HNOH
O
H2N OO
HN HN
O
OO
+DIC, DMAP
0 ˚C - 25 ˚C, 18 h
12 84%
LiOH0 ˚C
11 R = Me13 R = MeCO, 64%14 R = MeO, 73%
15 R = Me, 85%
95
Scheme 4.3. Hydrolyses of Compounds 13 and 14
13 R = MeCO14 R = MeO
SO O
N HN
O
OO
R 0 ˚C
LiOH.H2O HN HN
O
OHO
SO O
N HN
O
OO
Hydrolysis22
R
Scheme 4.4. Synthesis of Functional Compounds 16-21 (approach II)
HN HN
O
OO
25 ˚C, 1 hHN H
N
O
OHOLiOH.H2O
ArS
O O
Cl
NaOH/dichloroethane25 ˚C, 14 h
ArS
O ON H
N
O
OHO
12 22 90%
96
Table 4.2. Some Functional Compounds
compound Ar yield (%)
16 76
17 77
18 69
19 51
20 a little by TLC
21 a little by TLC
ArS
O ON H
N
O
OHO
O
OO
O
O
O
O
NC
97
4.4.3 Syntheses of Building Blocks for Multivalent Protein G Mimic LibraryOne building block is 2-azide-N-(aryl)-acetamide 9, which are prepared via
two-step reactions (Scheme 4.5). First, substituted aniline reacts with bromoacetyl
bromide under the condition of triethyl amine in an ice bath.258 This reaction goes fastand affords 2-bromo-N-(aryl)-acetamide 23 in about 90% yield. To decrease side-
products and let the reaction go steadily, the slow addition of bromoacetyl bromide into
the solution of substituted aniline and lower temperature are necessary to this reaction.All 2-bromo-N-(aryl)-acetamides 23 were purified via recystallization before the next
reaction. The substitution in compounds 23 with sodium azide goes smoothly at 40 ˚C ina few hours, and gives 2-azide-N-(aryl)-acetamide 9 in high yields259 (Table 4.3). The
use of co-solvents of acetone and DMF is for easy work-up after the end of this reaction.
The other building block is alkyne derivatives 8a-c (Scheme 4.6). Compounds8b and 8c were synthesized using the same approach. Amino acid methyl ester was
treated with triphosgene and saturated aqueous sodium hydrogencarbonate for 20
min.260,261 The reaction gave amino acid ester isocyanate 24. To afford high yield, lowertemperature and vigorous stirring for this reaction are important. Other methods were
also tried, such as the use of DIEA instead of sodium hydrogencarbonate. However, theyield of amino acid ester isocyanate is very low. To amino acid ester isocyanate 24 in
CH2Cl2 was added propargylamine. After 1 h the reaction was worked up. The crude
material was then columned quickly and gave compounds 25 in 94% yield and 26 in95% yield, which was hydrolyzed with lithium hydroxide monohydrate, and the final
product with a carboxylic acid group was obtained. Compound 8a was synthesized usingthe same method as for amino acid ester isocyanate 24.
98
Scheme 4.5. Syntheses of 2-Azide-N-(Aryl)-Acetamide 9
NH
BrO
ArArNH2
BrBr
OTEA, CH2Cl2
25 ˚C, 4 h+
NaN3DMF/acetone (1:3), 40 ˚C, 3 h N
HN3
OAr
23
9
Scheme 4.6. Syntheses of Building Blocks 8a-c
OO
OCl3C CCl3+
0˚C, 20 minsat.NaHCO3, CH2Cl2NH2 NCO
OO
OCl3C CCl3+
0˚C, 20 min
propargylamine
sat.NaHCO3, CH2Cl2
NH
NH
O
CH2Cl2, 25 ˚C., 30 minLiOH
THF/MeOH/H2O, 2 h
R COOMeH2N R COOMeOCN
24
R COOMe
NH
NH
O
R COOH
8b R = -CH2CH2-, 98%8c R = -CH(CH2Ph)-, 99%
25 R = -CH2CH2-, 94%26 R = -CH(CH2Ph)-, 95%
8a
99
Table 4.3. 2-Azide-N-(Aryl)-Acetamide
9
compound Ar yield (%)
9t 85
9u 90
9v 90
9w 93
9x 88
9y 89
9z 87
O
O
NH
N3
OAr
O
O
Cl
100
4.5 Development of Solid Phase Syntheses of Multivalent Protein G MimicsUsing Poly(propylene imine) Dendrimers as Scaffolds
4.5.1 Choice of Resins and Linkers, and Loading Determination of ResinsFor any solid phase synthesis, the selection of a resin is important. Many kinds
of resins are commercially available. Commonly, a suitable resin may be selected based
on reaction group, substrate, original loading, cleavage conditions and so on. Sometimesan experiment must be carried out in order to confirm if a resin is suitable for the
specific synthesis. Bradley and Gawley reported that PS-PEG (polystyrene-
poly(ethylene glycol)), TentaGel and ArgoGel could be used in dendrimersynthesis.250,251 In this study several resins were tested: TentaGel S PHB, NovaSyn TG
Hydroxy, Wang and PEGA resins. The loadings (Table 4.4) of these resins except for
PEGA were determined by standard quantitative detection of the liberated FMOCbyproduct via UV spectroscopy.262
Table 4.4. Original and Estimated Loading Values for Several Resins
resin original loading estimated loading DAB-Am-n(mmol/g) (mmol/g)
TentaGel S PHB 0.24 0.227 ± 0.011 n=4TentaGel S PHB 0.24 0.28 ± 0.03 n=8
Even though Wang resin is cheap, the estimated loading is as high as 0.55
mmol/g. It is not suitable to be used for the modification of dendrimers, especially high
generation dendrimers. After consideration of a hard cleavage from NovaSyn TGHydroxy and poor results from PEGA resin, TentaGel S PHB was finally chosen to be
used in the syntheses of multivalent protein G mimics.
101
To attach poly(propylene imine) dendrimer to the solid matrix, a suitable linker
was required. Several linkers263-265 are shown in Figure 4.7. Linkers a and b were usedfor a model study. It was found that b is better than a, so b was selected as the linker for
multivalent protein G mimic syntheses.
Figure 4.7. Several linkers for the syntheses of multivalent protein G mimics.
O linker
O Cl
O
O O
O
NO2
O N
O
O
O
O
O N
O
N
(a)
(b)
(c)
(d)
102
4.5.2 Syntheses of Multivalent Protein G Mimics Based on Amersham-DesignedCompounds and My Peptidomimetic 6 Discussed in Chapter IIISchemes 4.7 and 4.8 outline the strategies that were used to obtain multivalent
protein G mimics based on DAB-Am-4 (generation 1) and DAB-Am-8 (generation 2)
dendrimers respectively. The swelled TentaGel S PHB was treated with 4-
nitrophenylchloroformate and N-methyl morpholine,264 and followed by the treatment ofpoly(propylene imine) dendrimers and DMAP. After the mixture was gently shaken for
two days, the free amine resin-bound intermediate 28 or 30 was obtained. In this step,the ninhydrin test was carried out, and showed obviously positive results. In terms of
different generations of DAB dendrimers, the different ratios of DMF and DCM should
be used for this reaction. Amide formation between the intermediate 28 or 30 andfunctional compounds with the carboxylic acid group was carried out for about one day
by using standard carbodiimide coupling conditions, such as HOBt and HBTU, HOBt
and DIC, and by transforming the carboxylic acid group of functional compounds intocarboxylic chloride. Consequently, HOBt and HBTU are the best coupling agents for
this reaction.
103
Finally, the treatment of resin-bound functionalized DAB dendrimers with 50%
TFA afforded functionalized DAB dendrimers 29 or 31 with one free amine arm. Table4.5 shows purity and yield data for functionalized DAB dendrimers 29. The starting
materials of functional compound are expensive, so only a little excess functionalcompound was used in the amide formation step. To compare the binding activity of
peptidomimetic 6 (see Chapter III) with its dendric molecule, compound 32 was
synthesized (Scheme 4.9). All multivalent protein G mimics gave satisfactory molecular ions in MALDI-
MS analyses. However, MS spectra of the crude products showed traces of other sideproducts that were formed by either one or two amine-capped DAB-Am-4 dendrimers
with functional compounds. Even though one reason for this is that only a little excess of
functional compounds was used in the reaction, the key issue was the concentration ofpoly(propylene imine) dendrimers in the coupling with p-nitrophenylchloromate
activated carbonate, and this will be discussed later. To characterize the products, only
1D NMR spectra can’t satisfy this. Compound 29a was taken as an example. Its TOCSYspectrum was analyzed in Figure 4.8.
104
Table 4.5. Summary of Yield and Purity Data for Compounds 29
compound Ar puritya (%) yieldb (%)
29a 54 36
29b 76 58
29c 82 49
29d 74 45
29e 62 33
aPurity was assessed by HPLC for crude product via monitoring UV absorption at 254 nm. bYield wascalculated according to isolated product.
O
OO
O
O
O
N N
HN
NH
H2N
NH
O
O
HN
O
N
O
SO
O
Ar
HN
O
N SO
O
Ar
NH
ONS
OO
Ar
105
Scheme 4.7. Preparation of Trivalent Compounds 29
OH Cl O
O
NO2 O O
O
NO2+ N-methylmorpholineCH2Cl2, 25 ˚C, 1 d
O
O
N N
NH2
NH2
NH
H2N
N N
HN
NH
H2N
NH
O
O
HN
O
N
O
SO O
Ar
HN
ON S
OO
Ar
NH
ONS
OO
Ar
ArSO
ON
HN
O
OOH
(i)
(ii) 50% TFA
27
28
29
DAB-Am-4, DMAPDMF/CH2Cl2 (3:2)
25˚C, 2 d
HOBt/HBTU, DMF, 25˚C, 21 h
106
Scheme 4.8. Preparation of Multivalent Compound 31
Figure 4.8. Structure (a) and TOCSY spectrum (b) of compound 29a.
(a)
(b)
N N
HN
NH
+H3N
NH
O
O
HN
O
N
O
SO
O
HN
O
N SO
ONH
ONS
OO 29a
a
b g
de
d1
d2
d3 d4
d5
d6
d7d8
d9
d10
109
4.5.3 Library of Trivalent Protein G Mimics Based on Our DesignedMonovalent LigandsEven though some reaction conditions of the strategy used in Scheme 4.7 has
been optimized, the crude products of 29 still have poor purity. The same strategy asdescribed in Scheme 4.7 was used to synthesize multivalent protein G mimics using our
designed monovalent ligands. One and two amine-capped DAB-Am-4 dendrimers with
these ligands are also major byproducts although 5 fold reagents were used in thecoupling reactions. After careful evaluation of each step in the synthesis strategy, it
became evident that the efficiency of the synthesis with respect to formation of thedesired product 10bu was highly dependent on the concentration of poly(propylene
imine) dendrimers used in its coupling with p-nitrophenylchloromate activated
carbonate. To optimize this reaction (from 27 to 33 in Scheme 4.10), differentconcentrations of the DAB-Am-4: 0.08 M, 0.15 M, 0.30 M, 0.58 M, 1.0 M, 2.0 M and
neat were used while all other conditions used were the same. Figure 4.9 shows the
ratios of the three products with varying concentrations of the dendric amine. Theoptimal concentration with respect to formation of 10bu was 2 M; if higher
concentrations were used then the reaction liquid phase becomes quite viscous and thecoupling efficiency declines. Indeed, washing steps in the synthesis became difficult
when 2 M concentrations of the dendric amine were used; consequently 1.5 M was
preferred.In addition, 1,3-dipolar cycloaddition between alkyne and azide groups on resin
was applied in the synthetic strategy (Schemes 4.10 and 4.11). This is a typical clickreaction done by a few research groups using either solid phase or solution phase.266-270
Based on the conditions used in these papers the 1,3-dipolar cycloaddition on resin was
also optimized. The tested conditions include different equivalents of copper iodide: 0.1,1, 2 and 3 equiv, different reaction times: 20, 48 and 72 h, and different temperatures: 25
˚C and 40 ˚C. Except for the results in which 0.1 equiv. of copper iodide was used, notmuch difference was found for all other conditions. Therefore, in the library syntheses,
110
2.5 equiv. of copper iodide, 5 equiv. of azide and 25 ˚C were used for the 1,3-dipolar
cycloaddition (Scheme 4.11).The targeted library of 18 compounds were prepared using the conditions
developed above. Table 4.6 outlines details of the purities of the materials cleaved fromthe resin, and the yields of the desired products based on the loading of the resin.
Overall, the data is very satisfactory. The purities of most compounds are greater than
85% (UV) and 96% (Sedex) except that those of compounds 10ay and 10az are less than85%. The reason is that alkyne 8a was kept over two weeks at room temperature, and
not used freshly to make these two compounds. Generally, the purities measured by theSedex detector are higher than those from a UV detector since different thresholds of
detection may be used for these two detectors. In this study, the masses of all 18
compounds are greater than 1000; Sedex, being based on molecular mass, is likely to bemore representative of the real purity. Average purity of the crude products was 88.6 %
based on UV detection, and 95.8 % based on Sedex. 10 compounds were purified via
reverse phase HPLC and characterized via MALDI-MS and 1H NMR. Selectedcompounds were further characterized via 13C NMR and 1H-TOCSY. TOCSY proved to
be particularly informative. Figure 4.10 shows an illustrative spectrum wherein aprimary ammonium resonance (D10 in Figure 4.10) correlates with one arm of the
dendric backbone whereas the peaks in the other spin systems are largely coincident.
The above optimized conditions were also applied for the syntheses ofmultivalent protein G mimics using DAB-Am-8 (8 amino groups) and DAB-Am-16 (16
amino groups) as scaffolds. For the use of DAB-Am-8, the crude purity is about 65%(Sedex) while, for DAB-AM-16, HPLC analyses indicated a mixture of products were
formed and it proved too difficult to separate the desired products from the other
materials (data not shown).
111
Scheme 4.10. DAB-Am-4 Concentration Dependence Experiments of Products
DAB NH
NH
OO
NH N N
NO
HN
H2N3
DAB NH
NH
OO
NH N N
N
O
HNH2N
2
DAB NH
NH
OO
NH N N
NO
HN
34:
35:
10bu:
NH
HBTU/HOBt, DIEA, DMF/CH2Cl2 25 ˚C, 18 h
CuI, DIEA,THF, 25˚C, 20 h 50% TFA
NH
OHOOC
HN N3
O
2
3
O O
O
NO2 O NH
DAB NH2n 4-n
ODAB-Am-4, DMAPDMF/CH2Cl2 (3:2)
25˚C, 2 d
O NH
DABn
O
NH
NH
O
4-n
O
HN
27 33
H2N
112
(a)
10bu0.08M 10bu0.3M 10bu 10bu1M 2M
34
35
34
35
34 35 34 35
minutes
(b)
0.083 0.15 0.3 0.58 1.0 2.0 neat
3435
10bu0
10
20
30
40
50
60
70
80
90
100
are
a %
of
peaks
concentration of DAB-Am-4 (M)
Figure 4.9. (a) Selected HPLC traces indicating the product distribution of the desiredproduct 10bu relative to the impurities 34 and 35; and (b) comprehensive data from thisset of optimization experiments.
113
Scheme 4.11. Preparation of Trivalent Protein G Mimics Library
HBTU/HOBt, DIEA, DMF/CH2Cl2 25 ˚C, 18 h
50% TFA
O O
O
NO2 O NH
DAB NH2 3
ODAB-AM-4 (1.5M), DMAP
DMF/CH2Cl2 (3:2)25˚C, 2 d27
alkyne building block 8O N
HDAB
O
azide building block 9 O NH
DAB3
Oazideblock
N NN
28
CuI (2.5 eq), DIEA (40 eq), THF25 ˚C, 20 h
10
alkyneblock
alkyne
H2N DAB3
azideblock
N NN
alkyneblock
3
114
Table 4.6. Purity and Yield Data for Trivalent Molecules 10
compound alkyne azide puritya yieldb (%)
10 8 9 (UV/Sedex, %)at a t 94/96 75au a u 85/97 68ay a y 73/80 59az a z 78/83 52bt b t 88/96bu b u 90/99 81by b y 94/100 79bz b z 92/99bv b v 93/100bw b w 92/100 87bx b x 91/99ct c t 90/97cu c u 90/96cy c y 91/100 80cz c z 85/92 76cv c v 87/95cw c w 94/100cx c x 88/95 84
aPurity was assessed by HPLC for crude products via monitoring UV absorption at 254 nm and using anevaporative light scattering detector (Sedex). bYield was based on TentaGel S PHB (0.24 mmol/g).
115
(a)
10cx
(b)
Figure 4.10. Structure (a) and TOCSY spectrum (b) of compound 10cx.
N N
HN
NH
+H3N
NH
HN N
NN
O
NHO
Cl
HN
O
Ph
HN N
NN
O
NHO
Cl
HN
O
Ph
HNN
N N
O
HNO
Cl
HN
O
Ph
ab
c de f
g hi
j
D1
D2
D3 D4
D5D6
D7D8
D9D10
116
4.5.4 Immobilization of Multivalent Protein G MimicsThe method used to anchor the peptidomimetics to epoxy-activated sepharose
was based on a literature procedure.100,134 The sepharose resin was first washed several
times with pure water to remove some water-soluble additives/impurities. The resin wasthen mixed with compounds 10 dissolved in 0.2M NaHCO3/DMF (1:1, pH 9.7). The
extent of coupling of compounds 10 was monitored in three illustrative cases (10at,10cw and 10cx) via RP-HPLC using 1,3-dimethoxybenzene as a standard and followingthe loss of material from the liquid phase. Data obtained indicated this procedure gave a
loading of 3.81 ± 0.02 µmole/g sepharose. Finally, unreacted epoxide groups were
capped via treatment with 0.1M Tris (pH 9.4) as described in the literature.100
N,N-dimethylbenzylamine, 4-methylanisole were also tried as internalstandards. They did not give satisfactory results since their peaks by analytical HPLC
decrease more than those of compounds 10 as the end of their attachment.
4.6 Summary
An efficient approach for the syntheses of multivalent protein G mimics based
on DAB-Am-4 has been developed. The key feature of the synthetic route is thatmultiligand-functionalized DAB-4 dendrimer with one unfunctionalized amine arm can
be obtained by this method. The primary amine of modified DAB dendrimers is very
useful for bioassay, such as a fluorescence-attached direct binding assay and sepharoseimmobilized affinity assay. The reactions are very mild, and only need cheap reagents
and gentle shaking. The crude purity is high so that no further purification is needed.
This approach is suitable for a parallel synthesis strategy, so it is good to be used forlibrary preparation. A focused library of multiligand-functionalized DAB dendrimers
including Amersham’s and our designed ligands was prepared. A few compounds weretested by Amersham for their bioactivities. Compound 32 is a promising ligand, which
shows a strong binding to the Fab fragment of IgG.
117
CHAPTER VSMALL MOLECULE MIMICS OF THE NEUROTROPHINS
5.1 Specific Aims
This project is to resynthesize and synthesize small molecules that mimic theneurotrophins. Many cyclic peptidomimetics were made and sent to Prof. Saragovi for
biological assay before I joined Prof. Kevin Burgess’s group. Some of them show goodactivities on Trk receptors in preliminary screening so Prof. Saragovi requires more
amounts of these compounds for further biological studies. To provide a probe for a
direct binding assay, he also needs fluorescently labeled compounds. Sinceneurotrophins exist and function as dimers, bivalent turn mimics with a suitable-length
linkage are expected to have more selectivity and higher binding affinity to neurotrophinreceptors than monomeric molecules. Before making dimers we must first prepare
monomers. So the specific goals of this project are to:
a. resynthesize 14 compounds and characterize 12 of them with MS, 1H and13C NMR, which were previously confirmed by only MS;
b. compare the bioassay data of these compounds made by Hong Boon Leeand me repectively;
c. make five fluorescently labeled compounds;
d. synthesize several monomers exhibiting good binding with Trk receptorsfor the preparation of the library of dimers.
5.2 Background and Significance
5.2.1 Specificities of Neurotrophins and Their ReceptorsThe neurotrophins are a family of homologous dimeric growth factors which
118
include nerve growth factor (NGF), brain-derived neurotrophic factor (BDNF),
neurotrophin-3 (NT-3), neurotrophin-4/5 (NT-4/5), neurotrophin-6 and neurotrophin-7.271-275
The biological functions of neurotrophins are mediated via binding to twoclasses of receptors, the p75 neurotrophin receptor (p75NTR) and the Trk receptors which
are tyrosine kinase receptors.276 Each neurotrophin binds specifically to different Trk
receptors with relative high affinity (Kd: ~10-11M),277 that is, NGF binds to TrkA, bothBDNF and NT-4/5 bind to TrkB while NT-3 binds to TrkC, but can also bind to TrkA
and TrkB with lower affinity.278-280 All neurotrophins also bind to p75NGFR with lowaffinity constants varying from Kd = 10-9M to Kd = 10-11M.281 The thickness of the arrow
line represents the strength of binding between neurotrophins and their receptors in
Figure 5.1.
Figure 5.1. Specificities of neurotrophins and their receptors.
5.2.2 The Binding Between Neurotrophins and Their ReceptorsNeurotrophins are relatively small polypeptides (~25 kDa and 120 amino acid
residues).272 They share a common structural feature of three intertwined disulfide
bridges, exist and function as dimers in the biological system.272,273 The dimer interface
NGF
NT-3
TrKA
TrKB
TrKC
BDNF
NT-4/5p75
119
consists of b-strands in which several hydrophobic residues stabilize the conformation.
These hydrophobic residues are highly conserved in neurotrophins.282 Neurotrophins and
their receptors exhibit high sequence homology.273,276 Crystal structures are available forneurotrophins (NGF dimer: 1btg, NT-3 dimer: 1b8k, NT-4/5 dimer: 1b98) and their
receptors (TrkA-d5: 1he7, TrkB-d5: 1wwwb, TrkC-d5: 1wwc) in protein data bank.Binding determinants of neurotrophins to their receptors have been studied by loss-of-
function283-292 and gain-of-function286,290,293-297 experiments. It has been suggested that the
b-turn regions of neurotrophins are highly variable and play a crucial role in the binding
affinity and specificities of neurotrophin and receptor interactions because some criticalhot spots of neurotrophins are located in these regions. Figure 5.2 shows the loop regions
of NGF (pdb: 1www).298
Figure 5.2. NGF with different color highlighted turn regions.
5.2.3 b-Turn Mimics
Neurotrophins develop, regulate and maintain the peripheral and central
nervous system. The malfunction of neurotrophins can lead to a number of seriousdiseases, such as Alzheimer’s, stroke,299-301 neuropathy302,303 and some forms of
120
cancer.304,305 Neurotrophins exhibit a strong ability to promote the survival of peripheral
and central neurons during development and to repair the damaged nervous system afterneuronal damage, and are regarded as highly potential therapeutic agents in the treatment
of nerve injuries and neurodegenerative diseases.273,306 Nevertheless, since neurotrophinshave poor proteolytic stabilities and blood brain barrier permeabilities, they are hard to
use as therapeutic agents.307 In addition to the above drawbacks, they are expensive to
produce, and induce undesirable side-effects.301,308,309 Some of these side-effects comefrom neurotrophins binding to multiple receptors and activating multiple signaling
pathways. So small molecules, which are cheaper and easier to make, and selectivelymimic or disrupt the interactions of neurotrophins with their receptors, are of enormous
medical and commercial potential. Hot-spot residues are located in the b-turn loops of
neurotrophins, so b-turn mimetics are preferable.
The b-turn is one of several important secondary structures, and is often found
where a polypeptide chain abruptly reverses direction. It consists of four amino acid
residues: i, i+1, i+2 and i+3. There are nine types of b-turn according to backbone
torsion angle as presented in Table 5.1.82 Types I and II are the most common b-turn
types in proteins.
121
Table 5.1. Nine Ideal b-Turn Types
b-turn type backbone torsion angle (˚)fi+1 yi+1 fi+2 yi+2
To mimic a b-turn, some designs focus on the replacement of the turn hydrogen
bond (iC=O---HNi+3) with a covalent bond, and keep the side chain topology of i+1 and
i+2 amino acids.176,310-314 Figure 5.3 shows some examples of these designs. However,most of the compounds are not useful in the exploration of protein-protein interactions
because critical side chains corresponding to the target turns are difficult to incorporate
to the i+1 and i+2 amino acids.315 Moreover, these compounds do not contain an amide-based turn backbone, and most of them were synthesized in solution phase which limits
rapid production of libraries.
O
HN
R1
CO
HN
R2
COHN
R3R
i
i + 1 i + 2
i + 3
122
Figure 5.3. Some examples of b-turn mimics with a covalent bond instead of turnhydrogen bond.
Some designs retain a turn or partial turn which consists of amino acids in the
mimics (Figure 5.4),316-318 and they were not made via an efficient solid phase strategy.
For some compounds, the ring is so flexible that it induces an entropic penalty when themimics bind to targets. On the other hand, if the compounds are too rigid, this may
prevent molecules from adapting to the binding site.
O
HN
R1
CO
HN R2
COHN
R3OR
NHi
i + 1 i + 2
i + 3
b- turn structure
N
R1
R2O
SNH
R2
R3
R1O
O
n
N
NN
OR1
OOR
H
R2
O
R3
NH2N
COOHO
R1
R2
n
123
Figure 5.4. Some examples of b-turn mimics retaining a partial turn.
The reasonable solution to this problem is to find compounds which can bind
target proteins, then to synthesize and test molecules with suitable amino acid side
chains, for example, hot-spots of neurotrophin turn regions, and finally adjustconformational constraints. Studies of conformations of the peptidomimetics and
molecular modeling in solution may be useful to guide this process.
Dr. Burgess’ design of peptidomimics is composed of two parts: one is peptidic(two or three amino acids), the other is non-peptidic which may improve bioactive
conformation. An efficient solid phase route to access a library of b-turn analogs has
been developed. The first generation b-turn peptidomimetics with ring-fused C10 motifs
were made successfully via this method.171,19,319-326 The results from assay indicate thatthe first generation b-turn peptidomimetics are able to disrupt some protein-protein
interactions. D3 whose structure was presented in Figure 5.5 is one of the leadcompounds.327 These lead compounds themselves suggest that the peptidic and non-
peptidic fragments of the first generation b-turn peptidomimetics could be a very
favorable arrangement with regard to protein-protein interactions. Based on the firstgeneration compounds, the second generation b-turn peptidomimetics were designed as
O
OHHO OH
Phe
O
D-Trp
Thr
Lys
NHR1
R2O R3
R4
NH
CON
OHN
NHCO
HN
OHNO
COHN
COHN
124
shown in Figure 5.5. The difference is that the first generation compounds are less rigid
than the second generation compounds, in which a, b and c bonds are co-planar, andhave less degrees of movable freedom. Besides, the nitro group of nitroaryl compounds
was replaced with NH2, CH3SO2NH or NH2(C=NH)NH, which are normally regarded asconferring drug-likeness to candidates for pharmaceutical development.
HNO
HNCO
NHO
O
OC
O2N
HO2CNH2
NH
CO2H
D3
HNO
HNCO
NHO
R1R2
X
COY
O2N( )n
n = 0, x = O, Sn =1, x= O, NHn = 2, 3, x = NHY = NH2, OH
CONH2HN
OHN
COCONHR1
R2
OHN
i+1i+2
X
abc
ab
c
first generation second generation
36 x = H37 x = SO2CH338 x = (C=NH)NH2
Figure 5.5. Structures of D3, first and second generation compounds.
125
Since Trk receptors are activated by neurotrophins, which are natural dimers,
monomer turn analogs of neurotrophins are expected to either exhibit antagonistic effector have no bioactivity. Therefore, exploring bivalent turn analogs of neurotrophins is
more significant in medicinal chemistry. A focused library of dimers, each of whichcontains two lead monomeric b-turn peptidomimetics was prepared by the Burgess
group.328
5.3 Synthesis of the Template
Scheme 5.1 describes the syntheses of compound 40 called the template and is
the rigid element for all peptidomimetics in this chapter. The template 40 wassynthesized via three steps in Trt (triphenylmethyl)-protected form which can be
removed using 1% TFA. Hydrolysis329 of commercially available 4-(bromomethyl)-3-nitrobenzoic acid followed by protection of the resulting alcohol with TrtCl gave
compound 39330 in 92% and 66% yield respectively. Then hydrogenation of the nitro
group of compound 39 using Adam’s catalyst (PtO2) proceeded without significanthydrogenolysis of trityl ether to give template 40 in 76 % yield.331 Template 40 may be
activated with common coupling reagents and coupled to resins functionalized with theRink handle.332 This reaction is not complicated by reactions at the free amine group.333
126
Scheme 5.1. Preparation of the Template
O2N CO2H
Br
O2N CO2H
HONa2CO3
1:1 acetone/H2Oreflux 92 %
O2N CO2H
TrtO
TrtCl, Et3N,AgNO3
DMF, 55 °C
39 66 %
H2, PtO2, EtOAc
25 ˚C
H2N CO2H
TrtO
40 76 %
NH
OH2N
TrtO
Rink amide resin
HBTU, HOBt iPr2NEt, DMF
5.4 Solid Phase Syntheses of Peptidomimetics 36-38
Coupling of the first amino acids to the solid supported template 40 was the
most difficult step in the syntheses of these peptidomimetics described in Scheme 5.2.For this step, it was ever found that PyBrop/2,6-lutidine was a superior system;334 much
more excess of 2,6-lutidine was required to prevent loss of the Trt protecting groups
during the coupling reaction. After the first coupling reaction was completed, thestandard amino acid coupling methods were applied for two more steps, followed by
removal of the Trt-protecting group, then base mediated cyclization to give cyclized
nitroaryl compounds which was reduced to the corresponding aryl amine compounds onthe resin using SnCl2•2H2O/DMF (Scheme 5.2).
127
The resulting resin supported aryl amines may be cleaved from the resin to give
peptidomimetics 36 (Scheme 5. 3). Meanwhile, the side chain protecting groups was alsoremoved in this cleavage using 90 % TFA. These resulting resin supported aryl amines
react with methanesulfonyl chloride to give the corresponding sulfonamides 37 (Scheme5. 3), and react with guanidinylating agents (N,N'-bis-BOC-1-guanylpyrazole)335 to give
the guanidines 38 (Scheme 5. 3). The advantages of these reactions are to introduce
potential pharmacophores and increase water solubility. Peptidomimetics 36-38 areobviously more water-soluble than nitroaryl compounds.
Scheme 5.2. Preparation of Resin Supported Peptidomimetics 36
H2N
TrtO
O
FMOCNHCO
NHR1R2
HNO
CO
R2
FO2N
NHR1
HNCO
TrtO
O
HNCO
OTrt
O
HNCO
R2
TrtO
FMOCNHOFMOC-AA2, PyBrop
2,6-lutidine, CH2Cl2
(i) 20 % piperidine
(ii) Fmoc-AA1, DICHOBt, iPr2NEt,
CH2Cl2/DMF (3:1)
(i) 20 % piperidine
(ii) 2-fluoro-5-nitro-benzoylchloride,iPr2NEt, CH2Cl2
128
Scheme 5.2. (Continued)
HNO
HNCOCO
NHR1R2
OO2N
(i) remove Trt
(ii) K2CO3, DMF
O SnCl2.2H2O
HNO
HNCOCO
NHR1R2
OH2N
O
36 with resin
129
Scheme 5.3. Preparation of Peptidomimetics 36-38
HNO
HNCOCO
NHR1R2
OH2N
O
HNO
HNCOCO
NHR1R2
OH2N
HNO
HNCOCO
NHR1R2
OHN
HNO
HNCOCO
NHR1R2
OHN
90 % TFA
H3CO2SNH2
HN
CONH2
CONH2 CONH2
(i) pyrazole(BOC)2 DMF(ii) 90 % TFA
(i) CH3SO2Cl DMF(ii) 90 % TFA
36
3837
130
A small library of peptidomimetics 36-38 was reprepared using HypoGel-400-
Ram resin via the synthetic strategy depicted in Schemes 5.2 and 5.3. Table 5.2summarizes yield and purity data for peptidomimetics 36-38. The purities were generally
greater than 60% (UV) for crude materials. After the crudes were purified viapreparative HPLC, the purities of most peptidomimetics 36-38 are 100%; and analytical
HPLC shows a single peak for most of these compounds. One thing which should be
pointed out is that the purities and yields are high when either Lys/Ile or Lys/Thr wereused for the dipeptides in the peptidomimetics 36-38. This work was to only provide
samples for bioassay studies, no further chemistry and conformational studies werecarried out.
Table 5.2. Summary of Purity and Yield Data for Compounds 36-38a
aHypoGel 400 RAM (0.53 mmol/g) for syntheses of compounds 36-38. Purityb and Purityc assessed byHPLC for crude and purified product respectively via monitoring UV absorption at 254 nm and using anevaporative light scattering detector (Sedex).
131
5.5 Synthesis of Fluoresceinylated Peptidomimetics 41
Resin supported aryl amines 36 were first prepared according to the steps
depicted in Scheme 5.2. It was then reacted with Fmoc-b Ala-OH using the system
(PyBrop/2,6-lutidine), followed by the attachment of fluorescent label using fluorescein
isothiocyanate under the base condition. Finally, fluoresceinylated peptidomimetics 41were released from the resin with simultaneous removal of the side chain protecting
groups using 90 % TFA (Scheme 5.4). Application of b-alanine is to avoid the difficulty
of the reaction between aryl amine and fluorescein isothiocyanate due to their stereo-size. Purity and yield data were summarized in Table 5.3. Purities of most products are
not high even though all products were purified with preparative HPLC. This could be
partially attributable to the impurity of fluorescein isothiocyanate.
Table 5.3. Summary of Purity and Yield Data for Compounds 41a
Compound amino acid purityb
41 i+1 i+2 (%)isolated yield
(%)
a Ile Lys 92.4 43b Gly Lys 98.2 31c Ile Arg 89.1 29d Arg Gly 88.3 26e Lys Thr 100 51
aHypoGel 400 RAM (0.53 mmol/g) for synthesis of compound 41a-e. Purityb assessed by HPLC for purified product via monitoring UV absorption at 254 nm.
132
Scheme 5.4. Strategy for Attaching Fluorescent Label to Peptidomimetics
HNO
HNCOCO
NHR1R2
OH2N
O (i) Fmoc-b-Ala-OH PyBrop, 2,6-lutidine
(ii) 20% piperidine
HNO
HNCOCO
NHR1R2
ONH
O
H2N
O
(i) FluoresceinIsothiocyanate
iPr2NEt
(ii) 90 % TFA
HNO
HNCOCO
NHR1R2
ONHN
HHN
S
COOH
OHO
CONH2
O
O
41
133
5.6 Syntheses of Monomeric Precursors 42 and 43 for FluoresceinylatedBivalent Turn Mimics of Neurotrophins
Figure 5.6 shows the structures of fluoresceinylated bivalent turn mimics
consisting of two monomeric precursors. One of them is an unprotected peptidomimeticwith a hand, the other is a fluoresceinylated peptidomimetic with a hand. This research
focuses on the large-scale preparation and purification of three monomeric precursors foreach. These precursors were then provided to Mookda Pattarawarapan for further
assembly of dimers.
Scheme 5.5 depicts preparation of two kinds of monomeric precursors. Theresin-supported arylamine 36 (Scheme 5.2) was acylated using Fmoc-Gly-Cl which was
introduced to increase the spacer length and flexibility. After deprotection of Fmoc
group with 20% piperidine in DMF, Fmoc-Inp-OH was introduced using couplingreagents DIC/HOBt. Deprotection of Fmoc group gave resin supported peptidomimetic
derivatives. Each sample in the supported monomeric compound was divided into twoportions, one of which was cleaved directly from the resin to give 42, and the other was
treated with dichlorotriazinylaminofluorescein followed by 90% TFA cleavage to give
the fluorescently labeled triazine peptidomimetics 43 shown in Scheme 5.5 and Table5.4.
Scheme 5.5. Syntheses of Monomeric Precursors 42 and 43
HNO
HNCOCO
NHR1R2
OH2N
O
(i) Fmoc-Gly-Cl(ii) 20 % piperidine
HNO
HNCOCO
NHR1R2
ONH
O
HN
O
(iii)
(iv) 20 % piperidine
OHN
HNO
HNCOCO
NHR1R2
ONH
HN
O
OHN
FMOCN COOH
HNO
HNCOCO
NHR1R2
ONH
HN
O
ON
N N
NCl
NHF*
N N
NCl Cl
NHF*
90 % TFA
(i)
(ii)
90 % TFA
CONH2
CONH2
43
42
136
5.7 Comparison of Biological Activities
Biological activity measurements of compounds were carried out by Dr. Uri
Saragovi and his co-workers at McGill University in Canada. Cell survival assays327,336
were selected for these measurements. Cell survival was measured quantitatively by
MTT colorimetric assay, optical density readings and calculated relative to 100%
survival in 2 nM neurotrophins. Untreated cells in serum free media (SFM), which diewithout neurotrophins (0% survival), can be rescued by addition of appropriate
neurotrophins or mimic ligands with functionality of neurotrophins. Cells were cultured
in SFM supplemented with controls (NT-3 and NGF) and mimics with or withoutadditional 0.1nM of appropriate neurotrophins in which NT-3 is for TrKC-expressing
cells, and NGF is for TrKA-expresssing cells.Compounds 36-38 were prepared by Hong Boon Lee and myself respectively.
Data from cell survival assays were given in Table 5.5-5.8 and presented graphically in
Figure 5.7-5.10. For the same concentration (50 µM) of compounds 36b-d and 37a, mydata show partial antagonistic activities toward TrkA as they induce the death of the
TrkA-expressing E25 cells while Boon’s data display partial agonistic activities towardTrkA as they induce the survival of the TrkA expressing cells. When the concentration
of compounds 36b-d was increased to 75 µM, 36b and 36d work as agonists toward
TrkA, while 36c is still antagonist as shown by my data. For compounds 36b and 36d,both my data and Boon’s data indicate partial agonistic activities toward TrkC as the
survival of the TrkC-expressing cells was enhanced. In the test of differentconcentrations (from 0.4 µM to 50 µM) of compounds with 0.1 nM NT-3, compound
36c shows partial antagonistic activities toward TrkC from my data, but partial agonistic
activities from Boon’s data.
137
Table 5.5. Survival Dataa of E25 TrkA Cellsb for Compounds36-38 Made by Different People
survival of E25 TrkA cell (%)SFM NGF 0.1nM
compounds
my data Boon’s data my data Boon’s dataUntreated 0.00 0.00 0.00 0.00
)my data (w/o NT-3)Boon's data (w/o NT-3)my data (+ 0.1 nM NT-3)Boon's data (+ 0.1 nM NT-3)
Figure 5.10. Cell survival data for different concentrations of compounds 36c in TrkC-expressing cells.
5.8 Summary
More than ten compounds which exhibit good bioactivities in the preliminaryscreening were prepared with appropriate yields. All the compounds were purified by
RP-HPLC and characterized with MS and NMR. From the bioassay results provided byDr. Uri Saragovi, there is no good match between my data and Boon’s data. Compounds
36c and 37a may be identified as partial antagonist toward both of TrkA and TrkC based
on my data, but partial agonistic activities by Boon’s data. Both mine and Boon’s datashow no selectivity for TrkA and TrkC. For compounds 36b and 36d, my data indicate
that these compounds are partial agonists to both TrkA and TrkC when their
143
concentration increases to 75 µM, while Boon’s data show the same type of activities at
the concentration of 50 µM. There are no selective trophic effects between TrkA andTrkC for these compounds. From the concentrations of 0.4 µM to 50 µM of compound
36c, my data indicate that this compound induces a death of TrkC-expressing NIH3T3cells exposed to suboptimal NT-3 while Boon’s data show a big enhancement of the cell
survival. To use the method of fluorescence activated cell sorting (FACScan) assay, five
fluoresceinylated peptidomimetics 41 were prepared and purified by RP-HPLC. Threemonomeric precursors 42 and 43 were made on large scales for fluoresceinylated
bivalent turn mimics of neurotrophins.
144
CHAPTER VICONCLUSIONS
Protein-protein interactions are extremely important in modern drug discovery,
synthesis and administration. Hot-spots, which are key residues involved in the
interactions, are crucial for mimicking of protein-protein interactions. The approaches inthe designs and syntheses of peptidomimetics have been discussed. Generally, the
following strategy were adopted in each of my projects: identify protein-proteininteractions and hot-spots, estimate the geometry of amino acids in the hot-spots, design
mimics based on hot-spots and molecular modeling, synthesize a small library of
mimics, analyze mimics including conformational study and modeling, and screen thebiological activities of mimics.
Computer-aided design of mimics for protein-protein interactions is an obviousopportunity in modern medicinal chemistry. The QMD technique, which effectively
explores the conformations of molecules and has been used for many years in Dr
Burgess’ group based on Quanta/CHARMm package, can now be used on the Insight IIplatform. A variety of force fields, such as CVFF, CFF and CHARMm, are available for
QMD calculation. The test data for the compounds reported in this dissertation havedemonstrated that the exploration of QMD technique in Insight II platform is successful.
The interaction between expensive protein A and IgG is a typical protein-
protein interaction that has been used to purify IgG for therapeutic application. Sevenpeptidomimetics were designed to mimic the helix-loop-helix region of protein A; all
seven were synthesized with high yields on a solid support. The key step containing thecoupling of FMOC-Aib-OH works well using TFFH. The conformations of four
peptidomimetics were analyzed by CD, NMR spectroscopy and molecular modeling.
The results of CD, NMR and QMD studies are consistent with one another. Asdiscussed in Chapter III, these data indicate that these peptidomimetics have partial a-
helix secondary structures, and the addition of hexafluoroisopropanol to the buffered
145
water sample has proven to stabilize the a-helix of peptidomimetics. Excitingly, the
shortest peptidomimetic 6 was the most helical.
Protein G is another expensive natural ligand for current IgG purification.Since it binds IgG in a completely different way from that of protein A, ie a huge
binding area, several H-bonds, and both helix and b-sheet of protein G/domain III
containing hot-spots, the design of ligands to mimic these discontinuous hot-spots is a
great challenge. Poly(propylene imine) dendrimers were selected as scaffolds.Monovalent ligands based on affinity modeling and Amersham’s compounds were
designed. A new methodology for the formation of multivalent small molecule proteinG mimics on a solid support has been developed. As discussed in Chapter IV, the
concentration of poly(propylene imine) dendrimers proved to be a key issue. Only click
chemistry was used during the attachment of build blocks. The mild reaction conditions,high purity and high yield demonstrated that this methodology is efficient and very
useful for the preparation of a library of compounds. However, this approach does notwork well for high generations of poly(propylene imine) dendrimers as scaffolds. A few
protein G multivalent mimics with Amersham’s designed ligands and my
peptidomimetic 6 discussed in Chapter III were tested for binding to the Fab fragment ofIgG. The strong binding result indicates that peptidomimetic 6 functionalized trivalent
32 (in Chapter IV) is a very promising ligand for IgG purification.The interactions between neurotrophins and their receptors are another example
of protein-protein interactions studied in our lab. The b-turn regions of neurotrophins
were believed to be hot-spots in binding to the receptors. Twelve compounds were
resynthesized and characterized. In order to rapidly identify compounds and check fortheir affinity to our protein targets, five fluoresceinylated peptidomimetics were
prepared. The biological data obtained for the compounds which were synthesized by
Hong Boon Lee and resynthesized by me, respectively, were compared. Generally, thereis a poor match between Boon’s data and my data. If Boon’s data support partially
agonistic activities of a compound to either TrkA or C, my data support partiallyantagonistic activities. For the requirement of the library of bivalent turn mimics, three
146
lead monomeric precursors 42 and fluorescently labeled compounds 43 were prepared.
The dimers display enhanced binding abilities compared to monovalent ligands.328
147
REFERENCES
(1) Eyster, K. M. Biochem. Pharmacol. 1998, 55, 1927-1938.
(2) Klemm, J. D.; Schreiber, S. L.; Crabtree, G. R. Annu. Rev. Immunol. 1998, 16,569-592.
(3) Souroujon, M. C.; Mochly-Rosen, D. Nat. Biotechnol. 1998, 16, 919-924.
(4) Dall'Acqua, W.; Goldman, E. R.; Lin, W.; Teng, C.; Tsuchiya, D.; Li, H.; Ysern,X.; Braden, B. C.; Li, Y.; Smith-Gill, S. J.; Mariuzza, R. A. Biochemistry 1998,37, 7981-7991.
(5) Salzmann, M.; Bachmann, M. F. Mol. Immunol. 1998, 35, 271-277.
(6) Jones, S.; Thornton, J. M. Prog. Biophys. Mol. Biol. 1995, 63, 31-65.
(33) Sloan, D. J.; Hellinga, H. W. Protein Eng. 1998, 11, 819-823.
(34) Fancy, D. A.; Kodadek, T. Proc. Natl. Acad. Sci. U.S.A. 1999, 96, 6020-6024.
(35) Wlodawer, A.; Miller, M.; Jaskolski, M.; Sathyanarayana, B. K.; Baldwin, E.;Weber, I. T.; Selk, L. M.; Clawson, L.; Schneider, J.; Kent, S. B. Science 1989,245, 616-621.
(36) Todd, M. J.; Semo, N.; Freire, E. J. Mol. Biol. 1998, 283, 475-488.
149
(37) Shultz, M. D.; Chmielewski, J. Bioorg. Med. Chem. Lett. 1999, 9, 2431-2436.
(38) Zhang, Z. Y.; Poorman, R. A.; Maggiora, L. L.; Heinrikson, R. L.; Kezdy, F. J. J.Biol. Chem. 1991, 266, 15591-15594.
(39) Shultz, M. D.; Bowman, M. J.; Ham, Y. W.; Zhao, X.; Tora, G.; Chmielewski, J.Angew. Chem., Int. Ed. Engl. 2000, 39, 2710-2713.
(40) Darling, A. J.; McKay, E. M.; Ingemarson, R.; Preston, V. G. Virus Genes 1989,2, 187-194.
(41) Filatov, D.; Ingemarson, R.; Graslund, A.; Thelander, L. J. Biol. Chem. 1992,267, 15816-15822.
(42) Moss, N.; Deziel, R.; Adams, J.; Aubry, N.; Bailey, M.; Baillet, M.; Beaulieu, P.;DiMaio, J.; Duceppe, J. S.; Ferland, J. M.; et al. J. Med. Chem. 1993, 36, 3005-3009.
(43) Moss, N.; Beaulieu, P.; Duceppe, J. S.; Ferland, J. M.; Gauthier, J.; Ghiro, E.;Goulet, S.; Grenier, L.; Llinas-Brunet, M.; Plante, R.; et al. J. Med. Chem. 1995,38, 3617-3623.
(44) Moss, N.; Beaulieu, P.; Duceppe, J. S.; Ferland, J. M.; Garneau, M.; Gauthier, J.;Ghiro, E.; Goulet, S.; Guse, I.; Jaramillo, J.; Llinas-Brunet, M.; Malenfant, E.;Plante, R.; Poirier, M.; Soucy, F.; Wernic, D.; Yoakim, C.; Deziel, R. J. Med.Chem. 1996, 39, 4173-4180.
(45) Liuzzi, M.; Deziel, R.; Moss, N.; Beaulieu, P.; Bonneau, A. M.; Bousquet, C.;Chafouleas, J. G.; Garneau, M.; Jaramillo, J.; Krogsrud, R. L.; et al. Nature 1994,372, 695-698.
(46) Fisher, K. L.; Lu, J.; Riddle, L.; Kim, K. J.; Presta, L. G.; Bodary, S. C. Mol.Biol. Cell 1997, 8, 501-515.
(47) Casasnovas, J. M.; Stehle, T.; Liu, J. H.; Wang, J. H.; Springer, T. A. Proc. Natl.Acad. Sci. U.S.A. 1998, 95, 4134-4139.
(48) McMurray, R. W. Semin Arthritis Rheum 1996, 25, 215-233.
(49) Oppenheimer-Marks, N.; Lipsky, P. E. Clin. Immunol. Immunopathol. 1996, 79,203-210.
(50) Adler, M.; Carter, P.; Lazarus, R. A.; Wagner, G. Biochemistry 1993, 32, 282-289.
150
(51) Dennis, M. S.; Carter, P.; Lazarus, R. A. Proteins 1993, 15, 312-321.
(52) Burdick, D. J. WO 9949856, 1999, p 9-16.
(53) Gadek, T. R.; Burdick, D. J.; McDowell, R. S.; Stanley, M. S.; Marsters, J. C.,Jr.; Paris, K. J.; Oare, D. A.; Reynolds, M. E.; Ladner, C.; Zioncheck, K. A.; Lee,W. P.; Gribling, P.; Dennis, M. S.; Skelton, N. J.; Tumas, D. B.; Clark, K. R.;Keating, S. M.; Beresini, M. H.; Tilley, J. W.; Presta, L. G.; Bodary, S. C.Science 2002, 295, 1086-1089.
(54) Gross, A.; McDonnell, J. M.; Korsmeyer, S. J. Genes Dev. 1999, 13, 1899-1911.
(55) Reed, J. C. Trends Mol. Med. 2001, 7, 314-319.
(56) Fesik, S. W. Cell 2000, 103, 273-282.
(57) Muchmore, S. W.; Sattler, M.; Liang, H.; Meadows, R. P.; Harlan, J. E.; Yoon,H. S.; Nettesheim, D.; Chang, B. S.; Thompson, C. B.; Wong, S. L.; Ng, S. L.;Fesik, S. W. Nature 1996, 381, 335-341.
(58) Sattler, M.; Liang, H.; Nettesheim, D.; Meadows, R. P.; Harlan, J. E.; Eberstadt,M.; Yoon, H. S.; Shuker, S. B.; Chang, B. S.; Minn, A. J.; Thompson, C. B.;Fesik, S. W. Science 1997, 275, 983-986.
(59) Wang, J. L.; Liu, D.; Zhang, Z. J.; Shan, S.; Han, X.; Srinivasula, S. M.; Croce,C. M.; Alnemri, E. S.; Huang, Z. Proc. Natl. Acad. Sci. U.S.A. 2000, 97, 7124-7129.
(60) Kutzki, O.; Park, H. S.; Ernst, J. T.; Orner, B. P.; Yin, H.; Hamilton, A. D. J. Am.Chem. Soc. 2002, 124, 11838-11839.
(61) Hendrickson, J. B. J. Am. Chem. Soc 1961, 83, 4537-4547.
(62) Ramachandran, G. N.; Ramakrishnan, C.; Sasisekaran, V. J. Mol. Biol. 1963, 7,95-99.
(63) De Santis, P.; Giglio, E.; Liquori, A. M.; Ripamonte, A. J. Polym. Sci. Part A1963, 1, 1383-1404.
(64) Williams, D. E. Chem. Phys. 1981, 55, 163-167.
(65) Jorgensen, W. L. J. Am. Chem. Soc. 1981, 103, 335-340.
(66) Olson, W. K. J. Am. Chem. Soc. 1982, 104, 278-286.
151
(67) Van Gunsteren, W. F.; Karplus, M. Biochemistry 1982, 21, 2259-2274.
(68) Sponer, J.; Leszczynski, J.; Hobza, P. J. Biomol. Struct. Dyn. 1996, 14, 117-135.
(69) Gould, I. R.; Kollman, P. A. J. Am. Chem. Soc. 1994, 116, 2493-2499.
(70) Florián, J.; Leszczynski, J. J. Biomol. Struct. Dyn. 1995, 12, 1055-1062.
(71) Sponer, J.; Leszczynski, J.; Hobza, P. J. Comput. Chem. 1996, 17, 841-850.
(72) Florián, J.; Leszczynski, J. J. Am. Chem. Soc. 1996, 118, 3010-3017.
(73) Sponer, J.; Hobza, P. J. Phys. Chem. 1994, 98, 3161-3164.
(74) Nikiforovich, G. V. Int. J. Pept. Protein Res. 1994, 44, 513-531.
(75) Brooks, B.; Bruccoleri, R.; Olafson, B. S., D.; Swaminathan, S.; Karplus, M. J.Comp. Chem. 1983, 4, 187-217.
(76) Rossky, P. J.; Karplus, M. J. Am. Chem. Soc. 1979, 101, 1913-1937.
(77) Smith, P. E.; Dang, L. X.; Pattitt, B. M. J. Am. Chem. Soc. 1991, 113, 67-73.
(78) Verlet, L. Phys. Rev. 1967, 159, 98-103.
(79) O'Connor, S. D.; Smith, P. E.; Al-Obeidi, F.; Pettitt, B. M. J. Med. Chem. 1992,35, 2870-2881.
(81) Chou, P. Y.; Fasman, G. D. J. Mol. Biol. 1997, 115, 135-175.
(82) Wilmot, C. M.; Thornton, J. M. J. Mol. Biol. 1988, 203, 221-232.
(83) Richardon, J. S. Adv. Protein Chem. 1981, 34, 167-339.
(84) Lin, C. C.; Wu, J. C.; Chang, T. T.; Chang, W. Y.; Yu, M. L.; Tam, A. W.;Wang, S. C.; Huang, Y. H.; Chang, F. Y.; Lee, S. D. J. Clin. Microbiol. 2000, 38,3915-3918.
(85) Lu, B.; Smyth, M. R.; O'Kennedy, R. Analyst 1996, 121, 29R-32R.
152
(86) Yarmush, M. L.; Weiss, A. M.; Antonsen, K. P.; Odde, D. J.; Yarmush, D. M.Biotechnol. Adv. 1992, 10, 413-446.
(87) Askari, M.; Alarie, J. P.; Moreno-Bondi, M.; Vo-Dinh, T. Biotechnol. Prog.2001, 17, 543-552.
(88) Stokes, D. L.; Griffin, G. D.; Vo-Dinh, T. Fresenius J. Anal. Chem. 2001, 369,295-301.
(89) Mendoza, L. G.; McQuary, P.; Mongan, A.; Gangadharan, R.; Brignac, S.;Eggers, M. Biotechniques 1999, 27, 778-788.
(90) Banerjee, A.; Srilatha, N. S.; Murthy, G. S. Biochim. Biophys. Acta. 2002, 1569,21-30.
(91) van Dijk, M. A.; van de Winkel, J. G. Curr. Opin. Chem. Biol. 2001, 5, 368-374.
(92) Cragg, M. S.; French, R. R.; Glennie, M. J. Curr. Opin. Immunol. 1999, 11, 541-547.
(93) Vaswani, S. K.; Hamilton, R. G. Ann. Allergy Asthma Immunol. 1998, 81, 105-119.
(94) Kohler, G.; Milstein, C. Nature 1975, 256, 495-497.
(95) Guddat, L. W.; Herron, J. N.; Edmundson, A. B. Proc. Natl. Acad. Sci. U.S.A.1993, 90, 4271-4275.
(96) Bond, A.; Jones, M. G.; Hay, F. C. J. Immunol. Methods 1993, 166, 27-33.
(97) Boden, V.; Winzerling, J. J.; Vijayalakshmi, M.; Porath, J. J. Immunol. Methods1995, 181, 225-232.
(98) Labrou, N.; Clonis, Y. D. J. Biotechnol. 1994, 36, 95-119.
(99) Huse, K.; Bohme, H. J.; Scholz, G. H. J. Biochem. Biophys. Methods 2002, 51,217-231.
(100) Verdoliva, A.; Cassani, G.; Fassina, G. J. Chromatogr. B Biomed. Appl. 1995,664, 175-183.
(101) Labrou, N. E. J. Chromatogr. B Analyt. Technol. Biomed. Life Sci. 2003, 790,67-78.
153
(102) Langone, J. J. Adv. Immunol. 1982, 32, 157-252.
(103) Kihira, Y.; Aiba, S. J. Chromatogr. 1992, 597, 277-283.
(104) Deisenhofer, J. Biochemistry 1981, 20, 2361-2370.
(110) Deisenhofer, J.; Jones, T. A.; Huber, R.; Sjodahl, J.; Sjoquist, J. Hoppe-Seyler’sZ. Physiol. Chem. 1978, 359, 975-985.
(111) Torigoe, H.; Shimada, I.; Saito, A.; Ssato, M.; Arata, Y. Biochemistry 1990, 29,8787-8793.
(112) Doolittle, R. F. Protein Sci. 1992, 1, 191-200.
(113) Myhre, E. B. Bacterial Immunoglobulin Binding Proteins; Boyle, M. D. P., Ed.;Academic Press: London, 1990; Vol. 1, p 243-56.
(114) Ljungberg, U. K.; Jansson, B.; Niss, U.; Nilsson, R.; Sandberg, B. E.; Nilsson, B.Mol. Immunol. 1993, 30, 1279-1285.
(115) Sasso, E. H.; Silvermann, G. J.; Mannik, M. J. Immunol. 1991, 147, 1877-1883.
(116) Harboe, M.; Folling, I. Scand. J. Immunol. 1974, 3, 471-482.
(117) Gouda, H.; Shiraishi, M.; Takahashi, H.; Kato, K.; Torigoe, H.; Arata, Y.;Shimada, I. Biochemistry 1998, 37, 129-136.
(118) Gouda, H.; Torigoe, H.; Saito, A.; Sato, M.; Arata, Y.; Shimada, I. Biochemistry1992, 31, 9665-9672.
154
(119) Cedergren, L.; Andersson, R.; Jansson, B.; Uhlen, M.; Nilsson, B. Protein Eng.1993, 6, 441-448.
(120) Li, R.; Dowd, V.; Stewart, D. J.; Burton, S. J.; Lowe, C. R. Nat. Biotechnol.1998, 16, 190-195.
(121) Fuglistaller, P. J. Immunol. Methods 1989, 124, 171-177.
(122) Godfrey, M. A. J.; Kwasowski, P.; Clift, R.; Marks, V. Immunol. Methods 1992,149, 21-27.
(123) Porath, J.; Belew, M. Trends in Biotechnol. 1987, 5, 225-229.
(124) El-kak, A.; Vijayalakshmi, M. A. J. Chromatogr, Biomed. Appl. 1991, 570, 29-41.
(125) Ngo, T. T.; Khatter, N. Appl. Biochem. Biotechnol. 1991, 30, 111-119.
(126) Ngo, T. T.; Khatter, N. J. Chromatogr. 1992, 597, 101-109.
(127) Appel, J. R.; Dooley, C. T.; Cuervo, J. H. Nature 1991, 354, 84-86.
(128) Fassina, G.; Verdoliva, A.; Odierna, M. R.; Ruvo, M.; Cassini, G. J. Mol.Recognit. 1996, 9, 564-569.
(129) Palombo, G.; De Falco, S.; Tortora, M.; Cassani, G.; Fassina, G. J. Mol.Recognit. 1998, 11, 243-246.
(130) Palombo, G.; Rossi, M.; Cassani, G.; Fassina, G. J. Mol. Recognit. 1998, 11,247-249.
(131) Palombo, G.; Verdoliva, A.; Fassina, G. J. Chromatogr. B. 1998, 715, 137-145.
(132) Fassina, G.; verdoliva, A.; Palombo, G.; Ruvo, M.; Cassani, G. J. Mol. Recognit.1998, 11, 128-133.
(133) Fassina, G. In Affinity Chromatography: Methods and Protocols.; Bailon, P.,Ehrlich, G. K., Fung, W. J., Berthold, W., Eds.; Humana Press: Totowa, NewJersey, 2000, p 57-68.
(134) Teng, S. F.; Sproule, K.; Husain, A.; Lowe, C. R. J. Chromatogr. B. 2000, 740,1-15.
155
(135) Handbook of Affinity Chromatography; Kline, T. Ed.; Marcel Dekkler: NewYork, 1993.
(136) Affinity Chromatography, Methods and Protocols; Bailon, P., Ehrlich, G. K.,Fung, W. J., Berthold, W., Eds.; Humana Press: Totowa, New Jersey, 2000.
(137) Fassina, G.; Ruvo, M.; Palombo, G.; Verdoliva, A.; Marino, M. J. Biochem.Biophys. Methods 2001, 49, 481-490.
(138) Shuker, S. B.; Hajduk, P. J.; Meadows, R. P.; Fesik, S. W. Science 1996, 274,1531-1534.
(139) Keifer, P. A. Drugs Future 1998, 23, 301-317.
(140) Moore, J. M. Curr. Opin. Biotechnol. 1999, 10, 54-58.
(141) Diercks, T.; Coles, M.; Kessler, H. Curr. Opin. Chem. Biol. 2001, 5, 285-291.
(142) Stockman, B. J.; Farley, K. A.; Angwin, D. T. Methods in Enzymology. 2001,338, 230-246.
(144) Mayer, M.; Meyer, B. Angew. Chem., Int. Ed. 1999, 38, 1784-1788.
(145) Evans, J. N. S. Biomolecular NMR Spectroscopy; Oxford University Press:Oxford, 1995.
(146) Wuthrich, K. NMR of Proteins and Nucleic Acids; Wiley: New York, 1986.
(147) Bystrov, V. F. Prog. Nucl. Magn. Reson. Spectrosc. 1976, 10, 41-81.
(148) Pardi, A.; Billeter, M.; Wuthrich, K. J. Mol. Biol. 1984, 180, 741-751.
(149) Karplus, M. J. Phys. Chem. 1959, 30, 11-15.
(150) Pardi, A.; Wagner, G.; Wuthrich, K. Eur. J. Biochem. 1983, 137, 445-454.
(151) Kumar, A.; Wagner, G.; Ernst, R. R.; Wuthrich, K. J. Am. Chem. Soc. 1981, 103,3654-3658.
(152) Macurra, S.; Ernst, R. R. Mol. Phys. 1980, 41, 95-117.
156
(153) Wider, G.; Macura, S.; Kumar, A.; Ernst, R. R.; Wuthrich, K. J. Magn. Reson.1984, 56, 207-234.
(154) Bothner-By, A. A.; Stephen, R. L.; Lee, J.; Warren, C. D.; Jeanloz, R. W. J. Am.Chem. Soc. 1984, 106, 811-813.
(155) Bax, A.; Davis, D. G. J. Magn. Reson. 1985, 63, 207-213.
(156) Clore, G. M.; Gronenborn, A. M. J. Magn. Reson. 1982, 48, 402-417.
(157) Kessler, H.; Griesinger, C.; Kerssebaum, R.; Wagner, K.; Ernst, R. R. J. Am.Chem. Soc. 1987, 109, 607-609.
(158) Pauling, L.; Corey, R. B.; Branson, H. R. Proc. Nat. Acad. Sci. U.S.A. 1951, 37,205-211.
(159) Kendrew, J. C.; Bodo, G.; Dintzis, H. M.; Parrish, R. G.; Wycoff, H.; Philips, D.C. Nature 1958, 181, 662-666.
(160) Blundell, T. L.; Barlow, D.; Barkakoti, N.; Thornton, J. M. Nature 1983, 306,281-283.
(161) Chakarabarti, P.; Bernard, M.; Rees, D. C. Biopolymers 1986, 25, 1087-1093.
(162) MacArthur, W. M.; Thornton, J. M. J. Mol. Biol. 1996, 264, 1180-1195.
(163) Barlow, D.; Thornton, J. M. J. Mol. Biol. 1988, 201, 601-619.
(164) Wuthrich, K.; Billeter, M.; Braun, W. J. Mol. Biol. 1984, 180, 715-740.
(165) Clore, G. M.; Gronenborn, A. M. Crit. Rev. Biochem. Mol. Biol. 1989, 24, 479-564.
(166) Perzel, A.; Hollosi, M. In Circular Dichroism and the Conformatinal Analysis ofBiomolecules; Fasman; Fasman, G. D., Ed.; Plenum Press: New York, 1996, p362-364.
(167) Manning, M. C.; Illangasekare, M.; Woody, R. W. Biophs. Chem. 1988, 31, 77-86.
(168) Bush, C. A.; Sarkar, S. K.; Kopple, K. D. Biochemistry 1978, 17, 4951-4954.
(169) Woody, R. W.; Tinoco, I. J. J. Chem. Phys. 1967, 46, 4927-4945.
157
(170) Iizuka, E.; Yang, J. T. Proc. Natl. Acad. Sci. U.S.A. 1966, 55, 1175.
(171) Greenfield, N.; Fasman, G. D. Biochemistry 1969, 8, 4108-4116.
(172) Woody, R. W. Circular Dichroism Principles and Applications; Nakanishi, K.,Berova, N., Woody, R. W., Eds.; VCH: New York, 1994, p 473-496.
(173) Gans, P. J.; Lyu, P. C.; Manning, M. C.; Woody, R. W.; Kallenbach, N. R.Biopolymers 1991, 31, 1605-1614.
(174) Nelson, J. W.; Kallenbach, N. R. Proteins 1986, 1, 211-217.
(175) Sonnichsen, F. D.; Van Eyk, J. E.; Hodges, R. S.; Sykes, B. D. Biochemistry1992, 31, 8790-8798.
(176) Baumann, H.; Hard, T. Eur. J. Biochem. 1995, 230, 879-885.
(177) Llinas, M.; Klein, M. P. J. Am. Chem. Soc. 1975, 97, 4731-4737.
(178) Lau, S. Y. M.; Taneja, A. K.; Hodges, R. S. J. Chromatogr. 1984, 317, 129-140.
(179) Albert, J. S.; Hamilton, A. D. Biochemistry 1995, 34, 984-990.
(180) Siedlecka, M.; Goch, G.; Ejchart, A.; Sticht, H.; Bierzyski, A. Proc. Natl. Acad.Sci. U.S.A. 1999, 96, 903-908.
(181) Ghadiri, M. R.; Choi, C. J. Am. Chem. Soc. 1990, 112, 1630-1632.
(182) Ruan, F.; Chen, Y.; Hopkins, P. B. J. Am. Chem. Soc. 1990, 112, 9403-9404.
(183) Scholtz, J. M.; Qian, H.; Robbins, V. H.; Baldwin, R. L. Biochemistry 1993, 32,9668-9676.
(184) Bierzynski, A.; Kim, P. S.; Baldwin, R. L. Proc. Natl. Acad. Sci. U.S.A. 1982, 79,2470-2474.
(185) Yu, C.; Taylor, J. W. Bioorg. Med. Chem. 1999, 7, 161-175.
(186) Zhang, W.; Taylor, J. W. Tetrahedron Lett. 1996, 37, 2173-2176.
(187) Houston, M. E., Jr.; Gannon, C. L.; Kay, C. M.; Hodges, R. S. J. Pept. Sci. 1995,1, 274-282.
158
(188) Bracken, C.; Gulyas, J.; Taylor, J. W.; Baum, J. J. Am. Chem. Soc. 1994, 116,6431-6432.
(189) Osapay, G.; Taylor, J. W. J. Am. Chem. Soc. 1990, 112, 6046-6051.
(190) Phelan, J. C.; Skelton, N. J.; Braisted, A. C.; McDowell, R. S. J. Am. Chem. Soc.1997, 119, 455-460.
(191) Jackson, D. Y.; King, D. S.; Chmielewski, J.; Singh, S.; Schultz, P. G. J. Am.Chem. Soc. 1991, 113, 9391-9392.
(192) Ravi, A.; Prasad, B. V. V.; Balaram, P. J. Am. Chem. Soc. 1983, 105, 105-109.
(193) Toniolo, C.; Benedetti, E. Macromolecules 1991, 24, 4004-4009.
(194) Karle, I. L.; Flippen-Anderson, J. L.; Sukumar, M.; Uma, K.; Balaram, P. J. Am.Chem. Soc. 1991, 113, 3952-3956.
(195) Uma, K.; Balaram, P. Ind. J. Chem. 1989, 28B, 705-710.
(196) Marshall, G. R.; Hodgkin, E. E.; Langs, D. A.; Smith, G. D.; Zabrocki, J.;Leplawy, M. T. Proc. Natl. Acad. Sci. U.S.A. 1990, 87, 487-491.
(197) Toniolo, C.; Bonora, G. M.; Bavoso, A.; Benedetti, E.; Blasio, B. D.; Pavone, V.;Pedone, C. Biopolymers 1983, 22, 205-215.
(198) Cammers-Goodwin, A.; Allen, T. J.; Oslick, S. L.; McClure, K. F.; Lee, J. H.;Kemp, D. S. J. Am. Chem. Soc. 1996, 118, 3082-3090.
(199) Serrano, L.; Fersht, A. R. Nature 1989, 342, 296-299.
(200) Shoemaker, K. R.; Kim, P. S.; York, E. J.; Stewart, J. M.; Baldwin, R. L. Nature1987, 326, 563-567.
(201) Kallenbach, N. R.; Gong, Y. Bioorg. Med. Chem. 1999, 7, 143-151.
(202) Zhou, H. X.; Lyu, P. C.; Wemmer, D. E.; Kallenbach, N. R. J. Am. Chem. Soc.1994, 116, 1139-1140.
(203) Lyu, P. C.; Liff, M. I.; Marky, L. A.; Kallenbach, N. R. Science 1990, 250, 669-673.
(204) Fields, G. B.; Noble, R. L. Int. J. Pept. Protein Res. 1990, 35, 161-214.
159
(205) Patek, M. Int. J. Pept. Protein Res. 1993, 42, 97-117.
(206) Atherton, E.; Sheppard, R. C. Solid Phase Peptide Synthesis, A PracticalApproach; IRL Press: Oxford, 1989.
(207) Knorr, R.; Trzeciak, A.; Bannwarth, W.; Gillessen, D. Tetrahedron Lett. 1989,30, 1927-1930.
(208) Carpino, L. A.; Sadat-Aalaee, D.; Chao, H. G.; DeSelms, R. H. J. Am. Chem.Soc. 1990, 112, 9651-9652.
(209) Carpino, L. A.; El-Faham, A. J. Am. Chem. Soc. 1995, 117, 5401-5402.
(210) Wenschuh, H.; Beyermann, M.; Winter, R.; Bienert, M.; Ionescu, D.; Carpino, L.A. Tetrahedron Lett. 1996, 37, 5483-5486.
(211) Rance, M.; Sfrensen, O. W.; BodenHausen, G.; Wagner, G.; Ernst, R. R.;Wuthrich, K. Biochem. Biophys. Res. Commun. 1983, 117, 479-85.
(212) Griesinger, C.; Otting, G.; Wuthrich, K.; Ernst, R. R. J. Am. Chem. Soc. 1988,110, 7870-7872.
(213) Pettitt, B. M.; Matsunaga, T.; Al-Obeidi, F.; Gehrig, C.; Hruby, V. J.; Karplus,M. Biophy. J. Biophys. Soc. 1991, 60, 1540-1544.
(214) Dyson, H. J.; Merutka, G.; Waltho, J. P.; Lerner, R. A.; Wright, P. E. J. Mol.Biol. 1992, 226, 795-817.
(215) Achari, A.; Hale, S. P.; Howard, A. J.; Clore, G. M.; Gronenborn, A. M.;Hardman, K. D.; Whitlow, M. Biochemistry 1992, 31, 10449-10457.
(216) Gallagher, T.; Alexander, P.; Bryan, P.; Gilliand, G. L. Biochemistry 1994, 33,4721-4729.
(217) Derrick, J. P.; Wigley, D. B. J. Mol. Biol. 1994, 243, 906-918.
(218) Gronenborn, A. M.; Filpula, D. R.; Essig, N. Z.; Achari, A.; Whitlow, M.;Wingfield, P. T.; Clore, G. M. Science 1991, 253, 657-661.
(219) Lian, L. Y.; Derrick, J. P.; Sutcliffe, M. J.; Yang, J. C.; Roberts, G. C. K. J. Mol.Biol. 1992, 228, 1229-1234.
(220) Sauer-Eriksson, A. E.; Kleywegt, G. J.; Uhlen, M.; Jones, T. A. Structure 1995,3, 265-278.
160
(221) Akerstrom, B.; Brodin, T.; Reis, K.; Bjorck, L. J. Immunol. 1985, 135, 2589-2592.
(222) Bjorck, L.; Kronvall, G. J. Immunol. 1984, 133, 969-974.
(223) Gronenborn, A. M.; Clore, G. M. J. Mol. Biol. 1993, 233, 331-335.
(224) Frick, I.-M.; Wikstrom, M.; Forsen, S.; Drakenberg, T.; Gomi, H.; Sjobring, U.;Bjorck, L. Proc. Natl. Acad. Sci. U.S.A. 1992, 89, 8532-8536.
(225) Akerstrom, B.; Bjorck, L. J. Biol. Chem. 1986, 261, 10240-10247.
(226) Reis, K. J.; Ayoub, E. M.; Boyle, M. D. P. J. Immunol. 1984, 132, 3098-3102.
(227) Reis, K. J.; Ayoub, E. M.; Boyle, M. D. J. Immunol. 1984, 132, 3091-3097.
(228) Stone, G. C.; Sjobring, U.; Bjorck, L.; Sjoquist, J.; Barber, C. V.; Nardella, F. A.J. Immunol. 1989, 143, 565-570.
(229) Fahnestock, S. R.; Alexander, P.; Nagle, J.; Filpula, D. J. Bacteriol. 1986, 167,870-880.
(230) Guss, B.; Eliasson, M.; Olsson, A.; Uhlen, M.; Frej, A. K.; Jornvall, H.; Flock, J.I.; Lindberg, M. EMBO J. 1986, 5, 1567-1575.
(231) Va, P.; Vranken, D. V. The UCI Undergraduate Research Journal 2001, 4, 61-67.
(232) Newkome, G. R.; Moorefield, C. N.; Vogtle, F. Dendritic Molecules: Concepts,Syntheses and Perpectives; VCH: Weinheim, Germany, 1996.
(233) Tomalia, D. A.; Naylor, A.; Goddard III, W. A. Angew. Chem., Int. Ed. Engl.1990, 29, 138-175.
(234) Tomalia, D. A.; Hedstrand, D. M.; Wilson, L. R. Encyclopedia of PolymerScience and Engineering, Index Volume; Wiley: New York, 1990, p 46-92.
(235) Frechet, J. M. Science 1994, 263, 1710-1715.
(237) Frechet, J. M.; Hawker, C. J.; Gitsov, I.; Leon, J. W. J. Macromol. Sci., PureAppl. Chem. 1996, A33, 1399-1425.
161
(238) Bosman, A. W.; Janssen, H. M.; Meijer, E. W. Chem. Rev. 1999, 99, 1665-1688.
(239) Sadler, K.; Tam, J. P. J Biotechnol 2002, 90, 195-229.
(240) Fantl, W. J.; Johnson, D. E.; Williams, L. T. Annu. Rev. Biochem. 1993, 62, 453-481.
(241) Heldin, C.-H. Cell 1995, 80, 213-223.
(242) Li, Y.; Dias, J. R. Chem. Rev. 1997, 97, 283-304.
(243) Mammen, M.; Choi, S.-K.; Whitesides, G. M. Angew. Chem., Int. Ed. 1998, 37,2754-2794.
(244) Kim, R. M.; Manna, M.; Hutchins, S. M.; Griffin, P. R.; Yates, N. A.; Bernick,A. M.; Chapman, K. T. Proc. Natl. Acad. Sci. U.S.A. 1996, 93, 10012-10017.
(245) Qureshi, S. A.; Kim, R. M.; Konteatis, Z.; Biazzo, D. E.; Motamedi, H.;Rodrigues, R.; Boice, J. A.; Calaycay, J. R.; Bednarek, M. A.; Griffin, P.; Gao,Y. D.; Chapman, K.; Mark, D. F. Proc. Natl. Acad. Sci. U.S.A. 1999, 96, 12156-12161.
(246) Bo, Z.; Schafer, A.; Franke, P.; Schluter, D. Org. Lett. 2000, 2, 1645-1648.
(247) Zhang, W.; Nowlan III, D. T.; Thomson, L. M.; Lackowski, W. M.; Simanek, E.E. J. Am. Chem. Soc. 2001, 123, 8914-8922.
(248) Sivanandan, K.; Vutukuri, D.; Tayumanavan, S. Org. Lett. 2002, 4, 3751-3753.
(249) Zeng, F.; Zimmerman, S. C. Chem. Rev. 1997, 97, 1681-1712.
(250) Swali, V.; Wells, N. J.; Langley, J.; Bradley, M. J. Org. Chem. 1997, 62, 4902-4903.
(251) Cardona, C. M.; Jannach, S. H.; Huang, H.; Itojima, Y.; Leblanc, R. M.; Gawley,R. E. Helv. Chim. Acta 2002, 85, 3532-3558.
(252) Benters, R.; Neimeyer, C. M.; Wohrle, D. ChemBiochem 2001, 2, 686-694.
(253) Fromont, C.; Bradley, M. Chem. Commun. 2000, 283-284.
(254) Li, Z.; Scheraga, H. Proc. Natl. Acad. Sci. U.S.A. 1987, 84, 6611-6615.
162
(255) Kirkpatrick, S.; Gelatt, C. D.; Jr & Vecchi, M. P. Science 1983, 220, 671-680.
(256) Luty, B. A.; Wasserman, Z. R.; Stouten, P. F. W.; Hodge, C. N.; Zacharias, M.;McCammon, J. A. J. Comp. Chem. 1995, 16, 454-464.
(257) Zelikin, A.; Shastri, V. R.; Langer, R. J. Org. Chem. 1999, 64, 3379-3380.
(258) Aquino, C. J.; Armour, D. R.; Berman, J. M.; Birkemo, L. S.; Carr, R. A.;Croom, D. K.; Dezube, M.; Dougherty, R. W., Jr.; Ervin, G. N.; Grizzle, M. K.;Head, J. E.; Hirst, G. C.; James, M. K.; Johnson, M. F.; Miller, L. J.; Queen, K.L.; Rimele, T. J.; Smith, D. N.; Sugg, E. E. J. Med. Chem. 1996, 39, 562-569.
(259) Majo, V. J.; Perumal, P. T. J. Org. Chem. 1998, 63, 7136-7142.
(260) Honigfort, M. E.; Brittain, W. J. Macromolecules 2002, 35, 4849-4851.
(261) Tsai, J. H.; Takaoka, L. R.; Powell, N. A.; Nowick, J. S. Org. Syn. 2002, 78, 220-224.
(301) Hefti, F. J. Neurobiol. 1994, 25, 1418-1435.
(302) Apfel, S. C.; Kessler, J. A. Baillieres Clinical Neur. 1995, 4, 593-606.
(303) Ebadi, M.; Bashir, R. M.; Heidrick, M. L.; Hamada, F. M.; Refaey, H. E.;Hamed, A.; Helal, G.; Baxi, M. D.; Cerutis, D. R.; Lassi, N. K. Neurochem. Int’l.1997, 30, 347-374.
(304) Muragaki, Y.; Chou, T. T.; Kaplan, D. R.; Trojanowski, J. Q.; Lee, V. M.-Y. J.Neurosci. 1997, 17, 530-542.
165
(305) Washiyama, K.; Muragaki, Y.; Rorke, L. B.; Lee, V. M.; Feinstein, S. C.;Radeke, M. J.; Blumberg, D.; Kaplan, D. R.; Trojanowski, J. Q. Am. J. Path.1996, 148, 929-940.
(306) Conner, J. M.; Tuszynski, M. H. Mental Retardation and DevelopmentalDiabilities Research Reviews 1998, 4, 212-222.
(307) Hughes, R. A.; O’Leary, P. D. Clin. Exp. Pharm. Physi. 1996, 23, 956-959.
(308) Barinaga, M. Science 1994, 264, 772-774.
(309) Lindsay, R. M. Ciba Foundation Symposium 1996, 196, 39-53.
(310) Wang, W.; Yang, J.; Ying, J.; Xiong, C.; Zhang, J.; Cai, C.; Hruby, V. J. J. Org.Chem. 2002, 67, 6353-6360.
(311) Eguchi, M.; Shen, R. Y. W.; Shea, J. P.; Lee, M. S.; Kahn, M. J. Med. Chem.2002, 45, 1395-1398.
(312) Burgess, K. Acc. Chem. Res. 2001, 34, 826-835.
(313) Eguchi, M.; Lee, M. S.; Nakanishi, H.; Stasiak, M.; Lovell, S.; Kahn, M. J. Am.Chem. Soc. 1999, 121, 12204-12205.
(314) Virgilio, A. A.; Bray, A. A.; Zhang, W.; Trinh, L.; Snyder, M.; Morrissey, M.M.; Ellman, J. A. Tetrahedron 1997, 53, 6635-6644.
(315) Pitt, N. G., D. Tetrhedron Lett. 1999, 40, 3811-3814.
(316) Kitagawa, O.; Velde, D. V.; Dutta, D.; Morton, M.; Takusagawa, F.; Aubé, J. J.Am. Chem. Soc. 1995, 117, 5169-5178.
(317) Bach, A. C.; Espina, J. R.; Jackson, S. A.; Stouten, P. F. W.; Duke, J. L.; Mousa,S. A.; Degrado, W. F. J. Am. Chem. Soc. 1996, 118, 293-294.
(318) Roedern, E. G. V.; Lohof, E.; Hessler, G.; Hoffmann, M.; Kessler, H. J. Am.Chem. Soc. 1996, 118, 10156-10167.
(319) Feng, Y.; Wang, Z.; Jin, S.; Burgess, K. J. Am. Chem. Soc. 1998, 120, 10768-10769.
(320) Park, G.; Burgess, K. J. Comb. Chem. 2001, 3, 257-266.
echo "This is the lowest energy and its frame number in the cutoffed list"
echo $energy
echo $j
}
}
}
#end input file for cutoff
174
APPENDIX BPROCEDURES FOR QMD STUDIES WITH INSIGHT
II/DISCOVER FOR CHAPTER II
Starting InsightII Open UNIX shell Type i2k
Step 1: Building a 3D Molecule Go to Module select Builder or select Molbuilder from Toobox A. Draw the 2D molecule In somecases, such as NH3+, after drawing the molecule, go to Atom/Charge, have Formal_Charge be on, type 1, then execute. Go to sketcher, and put the file .car2d.Click 2DÆ3DIf stereochemistry is not correct, go to Toolbox/stereochemistry. Go to Moleculer, and rename the file .car.Or directly click Fragment Librtaries to build a 3D molecule.
Step 4: Run our own program (dyna.inp) This program is for the Minimization, Heating and Equilibration.
Step 5: Run our own program (mini.inp) This file is for the minimization of 600 structures.
Step 6: Run our own program (cutoff.inp) This file is for the cut off, like 114 structures from 600 structures.
Step 7: Build a cluster graph Open Analysis Go to Trajectory/get (pick up your cutoff.arc file) Trajectory/conformation (Pick the lowest energy structure) Then go to Trajectory/Cluster_Graph Choose: Add in List Control, Specified in Atom Set, Atom in molecule pick level. Pick atom subset (eg. 14 atoms). Have End_Definition be ON. Set: Max RMS Value, eg. 1.32 Number RMS Levels, eg. 4
Step8: Build a family. Go to Trajectory/Family Fill out Family Name like F1 Define Family Mode _Box Structure Pair Fill out with some frames, like 83,1 Structure Pair 2 Fill out with e.g. 83,114 Fill out Value with e.g. 0.0-0.6 Fill out Tolerance with e.g. 0.01 Choose Reference structure_lowest_Energy Click execute Go to Trajectory/put
176
Select Mode _Specified Frame Spec Fill out with e.g. 3,6-9… _Sort_Frame Archive File Name Name it like F1.arc Click execute
Repeat the above, we can get Family 2, 3, 4, and so on. .
Step 9: Measure Distance and Dihedral angles Go to Trajectory/Conformation Fill in the frame number with the lowest energy for each family, then execute. Go to Measure/Distance or Measure/Dihedral.
177
APPENDIX CA SCRIPT FOR MINIMIZATION, DYNAMICS AND CUTOFF IN
CHARMM FOR CHAPTER II
* Script file produced by Zebin Xia*! Startup script for CHARMm!UPPER ! case for file to writeBOMBLEVEL -2WRNLEV 0PRNLEV 5! Script to read parameter, psf and crd file!OPEN READ UNIT 21 CARD NAME"/chem/insight/I2000/irix6m3/biosym_lib//AMINOH.RTF"READ RTF UNIT 21 CARDCLOSE UNIT 21OPEN READ UNIT 21 CARD NAME"/chem/insight/I2000/irix6m3/biosym_lib//CHARMM_support.rtf"READ RTF UNIT 21 CARD APPENDCLOSE UNIT 21
OPEN READ UNIT 20 CARD NAME"/chem/insight/I2000/irix6m3/biosym_lib//PARM.PRM"READ PARA UNIT 20 CARDCLOSE UNIT 20
OPEN READ UNIT 20 CARD NAME "b8_1_2.psf"READ PSF UNIT 20 CARDCLOSE UNIT 20
OPEN READ UNIT 20 CARD NAME "b8_1_2.crd"READ COOR UNIT 20 CARDCLOSE UNIT 20
178
SKIPE EXCL BOND ANGL DIHE IMPR VDW ELEC HBON USER HARM CDIHCIC CDRO NOE
OPEN READ UNIT 30 CARD NAME "b8_heat_1.rst"OPEN WRIT UNIT 31 CARD NAME "b8_equil_1.rst"OPEN WRIT UNIT 32 FILE NAME "b8_equil_1.dcd"OPEN WRIT UNIT 33 FILE NAME "b8_equil_1.vel"OPEN WRIT UNIT 34 CARD NAME "b8_equil_1.ene"
OPEN READ UNIT 30 CARD NAME "b8_equil_1.rst"OPEN WRIT UNIT 31 CARD NAME "b8_1.rst"OPEN WRIT UNIT 32 FILE NAME "b8_1.dcd"OPEN WRIT UNIT 33 FILE NAME "b8_1.vel"OPEN WRIT UNIT 34 CARD NAME "b8_1.ene"
OPEN WRIT UNIT 41 CARD NAME "b8_1_final.crd"WRIT COOR UNIT 41 CARD* Coordinates after stage*
OPEN READ UNIT 32 FILE NAME "b8_1.dcd"OPEN WRIT UNIT 42 FILE NAME "b8_mini.dcd"OPEN WRIT UNIT 34 CARD NAME "b8_energy.ene"TRAJECTORY IREAD 32 SKIP 1 IWRITE 42* minimized trajectory*
set 2 0.0000set 4 ?ENERINCREMENT 2 by 0.0INCREMENT 4 by 0.0FORMAT (I16)set 3 @1INCREMENT 3 by 0WRITE TITLE UNIT 34*@3@2@4@2@4*@2@2@2@2@2*@2@2@2@2@2*@2@2
INCR 1 by 1IF 1 LE ?NFILE GOTO LOOP
OPEN READ UNIT 41 FILE NAME "b8_mini.dcd"OPEN WRIT UNIT 42 FILE NAME "b8_low.dcd"OPEN WRIT UNIT 43 CARD NAME "b8_l0w.ene"TRAJECTORY IREAD 41 SKIP 1 IWRITE 42* trajectory created by selecting frames with lowest energy*set 2 1set 8 100.0set 1 1set 7 1set 9 2.6label looptraj readenergy CDIE EPS 45.0if 8 gt ?ener set 8 ?ener set 7 @2if 9 lt ?ener goto nexttraj writewrite title unit 43*@2 ?enerincr 2 by 1label nextincr 1 by 1if 1 LE 600 goto loopprint @7print @8
stop
182
APPENDIX DPROCEDURES FOR QMD STUDIES WITH INSIGHT II/CHARMM
FOR CHAPTER II
Starting InsightII Open UNIX shell Type i2k
Step 1: Building a 3D Molecule Go to Module select Builder or select Molbuilder from Toobox A. Draw the 2D molecule In somecases, such as NH3+, after drawing the molecule, go to Atom/Charge, have Formal_Charge be on, type 1, then execute. Go to sketcher, and put the file .car2d.
B. Click 2DÆ3DIf stereochemistry is not correct, go to Toolbox/stereochemistry. Go to Moleculer, and rename the file .crd and .psf.
C. Or directly click Fragment Librtaries to build a 3D molecule.
Step 2: Select Forcefield and Potentials Go to FF/Selecttion Choose CHARMm.rfrc Go to FF/potentials Potential Action • Fix (sometimes, use accept) Partial Chg Action • Fix (sometimes, use accept) Formal Chg Action • Accept Click execute
Go to FF/Assign_CFF (If select cff as force field) Potential Action • Fix Partial Chg Action • Fix Formal Chg Action • Accept
183
Click execute
Step3: Open CHARMm Choose run/using existing_file (like b1.inp)
Step4: Go to Quanta for Analysis
184
APPENDIX EEXPERIMENTAL FOR CHAPTER III
General Methods. All a-amino acids used were of the L-configuration. All chemicals
were obtained from commercial suppliers and directly used without further purification.HypoGel 400 RAM Resin was obtained from Rapp Polymere and amino acids were
obtained from Advanced Chem Tech. 2-(1H-benzotriazole-1-yl)-1,1,3,3-
tri-iso-propylsilane (TIS) were purchased from Aldrich. N,N’-Diisopropylcarbodiimide(DIC) was purchased from Chem-Impex international. Tetramethyl fluoro
formamidinium hexafluorophosphate (TFFH) was prepared based on the known method
(Boas, U; Pedersen, B; Christensen, J. B. synthetic communications 1998, 28, 1223-1231. Dourtoglou, V.; Gross, B. synthesis 1984, 572-574). DMF was stored over 4Å
molecular sieves for a few days before use. After each solid phase reaction, the resin waswashed with DMF(3x), MeOH(3x), CH2Cl2(3x). Reverse phase high performance liquid
chromatography (RP-HPLC) was carried out using BACKMAN system on Vydac C-18
columns of the following dimensions: 25 x 2.2 cm for preparation, and 25 x 0.46 cm foranalysis. MALDI-TOF mass spectra were recorded on a Voyager-Elite XL instrument
(PerSeptive Biosystems, Framington, MA). All HPLC experiments were performed
using gradient conditions. The eluants used were solvent A (H2O with 0.1% TFA) andsolvent B (CH3CN with 0.1% TFA). Flow rates used were 10 mL/min for preparative
HPLC, and 1.0 mL/min for analytical HPLC. All NMR spectra were recorded on varianinstruments at 500 MHz. NMR chemical shifts are expressed in d ppm relative to
internal solvent peaks (H2O: 4.78 ppm, DMSO-d6: 2.50 ppm), and coupling constants
were measured in Hz. Multiplicities in 1H NMR were reported as s (singlet), d (doublet),
t (triplet), m (multiplet). The phosphate buffer (20 mM, PH=4) was prepared with
185
sodium dihydrogenphosphate monohydrate and pure water. 0.1 M HCl was used to
adjust PH value. CD spectra were recorded on an Aviv model 62 DS spectrometer.
General Procedure for Syntheses of Peptide Sequences 1-7. Rink resin in a frittedsyringe was swelled in CH2Cl2 for 30 min. The Fmoc protecting group on the resin was
removed by treating it twice with 20 % piperidine in DMF (10min and 15 min). The
resin was then washed using a typical washing cycle: DMF ( 3x ), CH3OH ( 3x ) andCH2Cl2 ( 3x ). The Fmoc-amino acid (4 eq.), HBTU(4 eq.), HOBt(4 eq.), and DIEA (6
eq.) in DMF were added. After 2 h of gentle shaking, a ninhydrin test on a small sampleof beads gave a negative result. The resin was filtered and washed using the washing
cycle described above. The Fmoc protecting group was then removed by treating the
resin with 20 % piperidine in DMF (2x: 10 min and 15 min). This coupling /deprotectioncycle was repeated to build the desired sequence, except the coupling when Fmoc-Aib-
OH was used the coupling agent used was TFFH instead of HBTU and HOBt. Finally,
the peptide was cleaved from the resin by a treatment with a mixture of 90% TFA, 5%TIS, and 5% H2O for 2 h. The cleavage solution was separated from the resin by
filtration, then most of the cleavage cocktail was evaporated in a stream of nitrogen, andthe crude peptide was precipitated using cooled anhydrous ethyl ether. The purity of this
crude product was determined by analytical HPLC (SSI system, 5-95% B in 30 min).
The crude product was dissolved in H2O, filtered, then purified via preparative HPLC(Beckman system) and finally lyophilized to yield the desired product.
CD Studies. The peptidomimetics were dissolved in buffered water and at various
concentrations of added hexafluoroisopropanol as specified in the text. CD
measurements were performed in a 0.1 cm pathlength cell at pH 4.0, 25 ˚C, 50 µM,averaging 5 scans with a step size of 0.5 nm for the spectra.
For monitoring if the addition of IgG to a synthesized peptide solution increasesthe helix content of the peptide, a special cell, which has two separated components, was
used. The pathlength of each component is 0.437 cm. The stoichiometry of ligand with
186
IgG used in this study was 2:1 which means 2 mg ligand and 1 mg IgG in 1 ml pH 4.0
buffer. The following experiments were performed for each sequence at 25 ˚C andaveraging 5 scans with a step size of 0.5 nm: (a) a pH 4.0 buffer solution in one
component, IgG solution in the other component; (b) mixed the pH 4.0 buffer and IgGsolution; (c) a peptide solution in one component, IgG solution in the other component;
(d) mixed the peptide solution and IgG solution.
The following formula (Gans, P. J.; Lyu, P. C.; Woody, R. W.; Kallenbach, N.R. Biopolymers 1991, 31, 1605-1614) was employed to estimate the helix content:
% helix = [ -[q]222/(40,000(n-4)/n)] x 100%
General Procedures for NMR Studies. All samples were prepared to give a 50 µMconcentration of the peptidomimetic. Three kinds of solvent systems were used: DMSO-
d6, 9:1 H2O:D2O and H2O : (CF3)2CDOD in the rations specified in the chapter VI. Forthe aqueous solvents, presaturation was carried out to suppress the H2O signal. One-
dimensional 1H NMR spectra were recorded with a spectral width of 8000 Hz, 30272
data points, 16 transients, and a 3 s acquisition time. Some vicinal coupling constantswere obtained from one-dimensional spectra at 25 oC. Assignments of 1H NMR
resonances were performed using sequential connectivities.ROESY or NOESY with mixing times of 150, 250, 300, 350, and 400 ms,
DQF-COSY and TOCSY with mixing time of 80 ms spectra were recorded in the pure
absorption mode according to the method of States et al (States, D. J.; Haberkorn, R. A.;Ruben, D. J. J. Magn. Res. 1982, 48, 286-292). All spectra were recorded with a 1.5 ~ 3
s relaxation delay, 512 t1 increments, and 16 or 32 scans per t1 increments with 2K datapoints at t2. Each 2D-data set was zero-filled to 2K x 2K data sets, and Gaussian
transformed in both dimensions. All spectra were processed on a Silicon Graphics O2
workstation using Varian (VNMR) and NMR Draw software. Sequential assignments of1H resonances , and structure determinations of peptidomimetics in solution were carried
out by the following standard methods (Wuthrich, K. In NMR of proteins and nucleic
acids, Wiley; New York, 1986. Bax, A. Annu. Rev. Biochem. 1989, 58, 223-256). The
187
intensities of the ROESY or NOESY cross-peaks were assigned as S (strong),
M(medium), and W (weak) based on the number of contours, and quantified as distanceconstraints of 2-3 Å (S), 3-4 Å (M), and 4-5 Å (W).(Gong, Y.; Zhou, H. X.; Guo, M.;
Kallenbach, N. R. Protein Sci. 1995, 4, 1446-1456) 3JHN, Ha coupling constants were
measured from 1D NMR spectra.
Molecular Modeling. Calculations were performed on a Silicon Graphics O2
workstation, operating under the IRIX 6.3 operating system using the modeling programCHARMm (version 23.2 Revision: 96.0501) with Quanta environment. Mechanics
simulations were carried out using CHARMm forcefield. Biharmonic potential was used
for dihedral angle constraints (Ef) as well as for ROE or NOE distance constraints.
Dihedral angle constraints to –85 < f < -35 for residues with 3JHNa < 6 Hz, and to –175˚
< f < -80˚ for residues with 3JHNa > 8 Hz were used. The residue topology files (RTF)
for all peptidomimetics were built using Quanta 2000 (vesion 2000, MolecularSimulations Inc.). Quenched molecular dynamics simulations for sequences were
performed using the CHARMm standard parameters. All molecules were modeled in a
dielectric constant of 80 (representing H2O). The starting structure was minimized using2000 steps of Steepest Descents (SD) and 2500 steps of the Adopted-Basis Newton
Raphson method (ABNR) respectively until an RMS energy derivative of £ 0.01 kcal
mol-1 A-1 was obtained. The minimized structure was then subjected to heating,equilibration, and dynamics simulation. The equations of motion were integrated using
the Verlet algorithm with a time step of 1 fs, and SHAKE was used to constrain all bond
lengths containing polar hydrogens. The minimized structure was heated to 1000K over12 ps and equilibrated for another 12 ps at 1000K, then molecular dynamics runs were
performed for a total time of 200 ps with trajectories saved every 1ps. The resulting 200structures were thoroughly minimized again, using 2000 steps of SD followed by 3000
steps of ABNR. After excluding structures more than 6-7 kcal/mol above the lowest
energy conformer identified, for peptidomimetics 1, 4, 5 and 6, the remainingconformers were clustered into groups based on RMS deviation of 0.4, 0.8, 0.8, 0.3 for
188
peptidomimetics 1, 4, 5 and 6 respectively, for a subset of main-chain backbone atoms
excluding those associated with the N- and C-terminal amino acids.
Crude HPLC trace of compound 1
Crude HPLC trace of compound 4
189
Crude HPLC trace of compound 5
Crude HPLC trace of compound 6
190
Table E1. Chemical Shifts and Coupling Constant Information for Peptidomimetic 1 (in 4:1 Buffer:(CF3)2CDOD)
were purchased from Aldrich. Epoxy-activated sepharose 6B was purchased fromAmersham biosciences. DMF was stored over 4Å molecular sieves for a few days before
use. For solid phase synthesis, fritted polypropylene syringes were purchased from
Torviq, and a manually controlled shaking apparatus was used. Reverse phase highperformance liquid chromatography (RP-HPLC) was carried out using BACKMAN
system on Vydac C-18 columns of the following dimensions: 25 x 2.2 cm forpreparation, and 25 x 0.46 cm for analysis. All HPLC experiments were performed using
gradient conditions. The eluants used were solvent A (H2O with 0.1% TFA) and solvent
B (CH3CN with 0.1% TFA). Flow rates used were 10 mL/min for preparative HPLC,and 1.0 mL/min for analytical HPLC. All NMR spectra were recorded on Varian or
Inova instruments at 300 MHz for 1H and 75 MHz for 13C; or 500 MHz for 1H and 125
MHz for 13C. NMR chemical shifts are expressed in d ppm relative to solvent (CDCl3:
7.27 ppm for 1H and 77 ppm for 13C, acetone-d6: 2.04 ppm for 1H and 29.9 ppm for 13C;DMSO-d6: 2.50 ppm for 1H and 39.5 ppm for 13C; CD3CN: 1.93 ppm for 1H and 1.3 ppm
for 13C), and coupling constants were measured in Hz. Multiplicities in 1H NMR were
208
reported as s (singlet), d (doublet), t (triplet), m (multiplet). FT-IR spectra were obtained
using the solution of product in CH2Cl2 and 4021 GALAXY series instrument. MALDI-TOF and ESI mass spectra were obtained from the Mass Spectrometry Applications
Laboratory at Texas A&M University. Thin layer chromatography was carried out usingsilica gel 60 F254 plates. Flash column was performed using silica gel (230-600 mesh).
ProcedureTo a suspension of N-tosyl-3-pyrrolecarboxylic acid (570 mg, 2.15 mmol) in 30
ml dichloromethane was added ethylimethylaminopropyl carbodiimide (453 mg, 2.37mmol) and 4-(dimethylamino)pyridine (867 mg, 7.1 mmol) at 0˚C. After 20 min, ethyl-
dissolved in 6 ml dichloromethane was then added. The mixture was stirred for 18 h at25 ˚C and concentrated in vacuo. The residue was added 1M HCl and then extracted
with ethyl acetate (20 mL X 4). The combined extracts were washed with saturatedsodium hydrogencarbonate and saturated sodium chloride, dried over anhydrous
magnesium sulfate. The solvent was removed in vacuo. The crude material was
chromatographed with ethyl acetate/hexane (30-50%) to afford product 11 as white solid(800 mg, 92%).
MS (ESI) calc’d for C20H25N2O5S (M+H)+ 405.14, found 405.20
1H NMR (CDCl3)
210
13C NMR (CDCl3)
ProcedureLithium hydroxide monohydrate (40.5 mg, 0.965 mmol) was added to a
solution of 11 (300 mg, 0.742mmol) in THF/methanol/H2O (3:1:1) (2.5 ml). The
mixture was stirred at 0˚C for 8 h. The solvent was removed in vacuo, the residue was
SO O
N HN
O
OHO
15
211
diluted with 3 ml of water and then acidified with 2M HCl (0.5 ml) up to a PH 2-3. The
resulting solution was extracted with 3 x 10 ml ethyl acetate, dried over anhydroussodium sulfate. The dried solution was concentrated in vacuo to give the crude material
which was recrystallized with 50% ethanol in water to afford product 15 as white solid(237 mg, 85%).1H NMR (300 MHz, DMSO-d6)d = 11.89 (bs, 1H), 7.95 (m, 1H), 7.91 (d, J=3.9, 1H), 7.88 (d, J=7.8, 2H), 7.48 (d, J=7.8,
27.1, 22.1, 21.1MS (ESI) (M+H)+ calc’d 377.11, found 377.11
1H NMR (DMSO-d6)
212
13C NMR (DMSO-d6)
ProcedureTo a suspension of pyrrole-3-carboxylic acid (717 mg, 6.45 mmol) in 20 ml N,
N-dimethylformamide and 30 ml dichloromethane was added 1,3-diisopropyl
carbodiimide (1212 uL, 7.74 mmol) and 4-(dimethylamino)pyridine (1735 mg, 14.2mmol) at 0 ˚C. After 20 min, ethyl-cis-2-amino-1-cyclopentanecarboxylate
HN HN
O
OO
12
213
hydrochloride (1.5 g, 7.74 mmol) dissolved in 30 ml dichloromethane was then added.
The mixture was stirred for 18 h at 25 ˚C, and concentrated in vacuo. The residue wasadded 1M HCl and then extracted with with ethyl acetate (20 mL X 4). The combined
extracts were washed with saturated sodium hydrogencarbonate and saturated sodiumchloride, dried over anhydrous magnesium sulfate. The solvent was removed in vacuo.
The crude material was chromatographed with ethyl acetate/hexane (60%) to afford
ProcedureLithium hydroxide monohydrate (231 mg, 5.505 mmol) was added to a solution
of compound 12 (1.06 mg, 4.23 mmol) in THF/MeOH/H2O (3:2:1) (9 ml). The mixturewas stirred at 25 ˚C for 1 h. The solvent was removed in vacuo, the residue was diluted
with 5 ml of water and then acidified with 2M HCl (6 ml) up to a PH 2-3. The resulting
solution was extracted with 3 x 50 ml ethyl acetate, dried over anhydrous sodium sulfate.The dried solution was concentrated in vacuo to give the crude material which was
recrystallized with 50% ethanol in water to afford product 22 as white solid (828 mg,90%).
ProcedureIntermediate 22 (71.4 mg, 0.32 mmol) was dissolved in 10 ml dichloroethane
and 3 ml N, N-dimethylformamide, and cooled to 0 ˚C. Ground sodium hydroxide (76.8mg, 1.92 mmol) was added to the solution and stirred for 1 h. A solution of 4-
methoxybenzenesulfonyl chloride (198.7 mg, 0.96 mmol) in 6 ml dichloroethane was
added dropwise. After 40 min the mixture was allowed to 25 ˚C and stirred 14 h. Thereaction was quenched by addition of 10 ml 1M HCl. The organic layer was separated,
and the aqueous layer was extracted with dichloromethane (3 x 20ml). The combined
organic extracts were washed with saturated sodium chloride, dried over sodium sulfate.Removal of the solvent in vacuo gave the crude material which was chromatographed
Syntheses of 2-Bromo-N-Aryl Acetamides 23A solution of aryl amine (0.08 mol) in CH2Cl2 (120 mL) and triethylamine (12
mL, 0.08 mol) was cooled in an ice bath with stirring, and a solution of bromoacetyl
bromide (6.97 mL, 0.08 mol) in CH2Cl2 (50 mL) was added dropwise. After thecompletion of addition the mixture was stirred about 1 h at 0 ˚C, then stirred 4 h at 25
˚C. To this reaction mixture was added 130 ml CH2Cl2. The mixture was washed
successively with 1M HCl (2 x 30 mL), NaHCO3 (1 x 30 mL) and H2O (1 x 30 mL), anddried over anhydrous Na2SO4. Finally the mixture was filtered and evaporated in vacuo.
The crude material was recrystallized with 60 mL CH3CH2OH and gave 2-bromo-N-Arylacetamides in yields from 86 to 94%. All compounds gave satisfactory MS data and
were verified by their 1H NMR and 13C NMR. The spectral data of three compounds:
Syntheses of 2-Azido-N-Aryl Acetamides 9Sodium azide (2 equiv) was added to a solution of 2-bromo-N-aryl acetamides
23 in acetone/DMF (3:1). The mixture was stirred for 5 h at 40˚C. Complete reaction
was observed at this stage by TLC (30% EtOAc in hexane); the acetone was removed,and H2O (100 mL) was added. The mixture was extracted with ethyl acetate (3x). The
organic phase was dried over MgSO4, and was evaporated in vacuo to give the
corresponding amidoazides 9 in good yields (> 97%). All compounds were verified bytheir MS, 1H and 13C NMR. The spectral data of three compounds: 9u, 9z and 9v, were
MS (ESI) calc’d for [C9H10N4O + H]+ 191.09, found 191.1004
HN
N3
O
228
1H NMR (CDCl3)
13C NMR (CDCl3)
229
Syntheses of Amino Acid Ester Isocyanates 24 and Propargyl Isocyanate 8aA saturated 100ml aqueous solution of NaHCO3 was added to a solution of b-
alanine methyl ester hydrochloride or L-phenylalanine methyl ester hydrochloride orpropargylamine (21.8 mmol) in 100 mL CH2Cl2. The biphasic mixture was cooled in an
ice bath and stirred mechanically, then triphosgene (2.16 g, 7.3 mmol) was added in asingle portion. The reaction mixture was stirred vigorously for 20 min at 0 ˚C. The
organic layer was separated, and the aqueous layer was extracted with 3 x 20 mL
CH2Cl2. The combined organic layers were dried over Na2SO4, filtered and concentratedto 50 ml for 24 in vacuo and 3 ~ 4 ml for 8a by distillation under atmospheric pressure.
Syntheses of Intermediates 25 and 26Propargylamine (0.9 equiv) was added to the solution of amino acid ester
isocyanates 24 in CH2Cl2. The reaction mixture was stirred for 30 min at 25 ˚C. The
solvent was removed in vacuo. The crude products were chromatographed usingEtOAc/Hexane (1:1) eluant to give intermediates 25 in 94% yield 94 % and 26 in 95%
MS (ESI) calc’d for [C14H16N2O3+Na]+ 283.11, found 283.1096
NH
NH
O
COOMe
Ph
234
1H NMR (DMSO-d6)
13C NMR (DMSO-d6)
235
Syntheses of Alkyne Building Blocks 8b and 8cLithium hydroxide monohydrate (1.3 equiv) was added to a solution of
compound 25 or 26 (1 equiv) in THF/MeOH/H2O (3:2:1) (about 1.7mL the mixture
solvents per mmol 25 or 26). The mixture was stirred at 25˚C for 2 h. The solvent wasremoved in vacuo, the residue was diluted with water and then acidified with 2M HCl up
to a pH of 2-3. The resulting solution was extracted with 6 x 30 mL ethyl acetate, dried
over anhydrous sodium sulfate. The dried solution was concentrated in vacuo to giveproducts 8b-c in 99% yield.
MS (ESI) calc’d for [C13H14N2O3-H]+ 245.09, found 245.0772
1H NMR (DMSO-d6)
NH
NH
O
COOH
Ph
238
13C NMR (DMSO-d6)
Preparation of Solid Phase Supported Poly(propylene imine) Dendrimers 28 and 30TentaGel S PHB with loading 0.24 mmol/g was swelled with CH2Cl2 in a fritted
syringe for 30 min. 4-nitrophenylchloroformate (6 equiv) and N-methylmorpholine (8
equiv) in CH2Cl2 was added. After gentle shaking for 24 h, the reaction mixture was thendrained, and the resin was washed with DMF (3x), MeOH (3x), CH2Cl2 (3x), MeOH
(3x), CH2Cl2 (3x). The resin containing the linker was treated with DAB-Am-4 (or 8) (5
equiv), 4-(dimethylamino)pyridine (3 equiv) in DMF/CH2Cl2 2:1 (or 1:1) for 48 h. Themixture was washed with Et3N (3x), MeOH (3x), CH2Cl2 (3x), DMF (3x), MeOH (3x),
CH2Cl2 (3x) and dried in vacuo for later use.
General Procedure for Preparation of Functionalized Poly(propylene imine)Dendrimers 29 and 31
TentaGel supported poly(propylene imine) dendrimer 28 or 30 was swelled
with CH2Cl2 for 30 min. The resin-supported DAB dendrimer was treated with functional
239
compounds 15-21, HOBt, HBTU, and DIEA in DMF/CH2Cl2 (1.5:1 for 29, 1:1 for 31).
After gentle shaking for 24 h, the reaction mixture was drained and the resin was washedwith DMF (3x), MeOH (3x), CH2Cl2 (3x), DMF (3x), MeOH (3x), CH2Cl2 (3x). The
functionalized DAB dendrimer was cleaved from the resin by treating with a mixture of50% TFA, 5% TIS, and 45% CH2Cl2 for 3 h. The cleavage solution was separated from
the resin via filtration. After most of the cleavage cocktail was evaporated in a stream of
nitrogen, the crude functionalized DAB dendrimer was triturated using cooled anhydrousethyl ether. The purity of this crude product was determined by analytical HPLC (SSI
system, 5-95% B in 30 min). The crude product was dissolved in the mixture of CH3CNand H2O, filtered, then purified with preparative HPLC and finally lyophilized to yield
47.7, 35.7, 31.4, 27.4, 23.3, 22.5, 21.1MS (MALDI) calc’d for [C166H222N28O28S7Na]+ 3302.48, found 3302.46
Analytical HPLChomogeneous single peak, retention time = 23.5 min (5-95% B in 35 min)
1H NMR (DMSO-d6)
244
13C NMR (DMSO-d6)
Procedure for Preparation of Amino Acid Modified Poly(propylene imine)Dendrimer 32
TentaGel supported poly(propylene imine) dendrimer 28 was swelled with
CH2Cl2 for 30 min. The following cycle was then followed: the resin-supported DABdendrimer was treated with Fmoc-His(Trt)-OH (4 equiv), HOBt (4 equiv), DIC (4
equiv), and DIEA (6 equiv) in DMF/CH2Cl2 (1:1) for 24 h, the Fmoc protecting groupwas removed by treating the resin twice with 20% piperidine in DMF (10 min and 15
min). The resin was washed with DMF (3x), CH3OH (3x) and CH2Cl2 (3x). After
washing, the resin was treated with Fmoc-Leu-OH and coupling reagents for 24 h. Theabove cycle was repeated seven times, each of which the desired Fmoc protected amino
acid was used until Asp was coupled. Finally succinic anhydride was used to cap N-
terminus, the work-up and purification are the same as those for 29 and 31. The aminoacid sequence is the same as that of peptidomimetic 6 discussed in Chapter III.
MS (MALDI) calc’d for [C160H229N33O39+H]+ 3239.8, found 3239.8
245
Analytical HPLChomogeneous single peak, retention time = 16.35 min (5-95% B in 35 min)
MS (MALDI)
246
N N
HN
NH
+H3N
NH
azideblock
N NN
alkyneblock
azideblock
N NN
alkyneblock
azideblock
NNN
alkyneblock
10
General Procedure for Preparation of Trivalent Protein G Mimics 10The resin with activated carbonate 27 was swelled with CH2Cl2 in a fritted
syringe for 30 min. Poly(propylene imine) dendrimer (DAB-Am-4) was then coupled toactivated carbonate 27 using the following conditions: 1.5 M DAB-Am-4 and a catalytic
amount of 4-(dimethylamino)pyridine in DMF/CH2Cl2 (2:1) at 25 ˚C for 48 h. The
TentaGel Supported dendrimer 28 was treated with alkyne building block 8a-c, HOBt,HBTU, and DIEA in DMF/CH2Cl2 (1.5:1), After gentle shaking for 18 h at 25˚C, the
reaction mixture was drained, and the resin was washed via two cycles of DMF (3x),MeOH (3x), CH2CL2 (3x). The resin was dried over night, and divided into many
portions as required (e.g. 4 portions for 8a, 6 portions for 8b-c). Each solid supported
alkyne portion was swelled again, and then treated with azide building blocks 9, CuI (2.5equiv) and DIEA (40 equiv) in THF at 25 ˚C for 20 h. The reaction mixture was drained
and the resin was washed with THF (3x), H2O (3x), then DMF (2x), MeOH (2x), CH2Cl2
(3x). The protein G mimic was cleaved from the resin by treating with a mixture of 50%
TFA in CH2Cl2 for 2 h. The cleavage solution was separated from the resin via filtration.
After most of the cleavage cocktail was evaporated in a stream of nitrogen, the crudeproduct was triturated using cooled anhydrous ethyl ether. All crude materials were
analyzed by analytical HPLC (SSI system, 5-95% B in 30 min) and MALDI-MS. The
selected crude materials were purified via preparative HPLC and lyophilized to yield the
247
desired products. Spectral data were obtained: 1H NMR for all compounds, 13C NMR for
eight compounds, TOCSY (mix=80ms) for three cmpounds, which have different alkynebuilding blocks.
LRMS (MALDI) calc’d for [C52H73N21O6 + Na]+ 1110.60, found 1110.6519Analytical HPLChomogeneous single peak, retention time = 14.1 min (5-95% B in 30 min)
MS (MALDI) calc’d for [C85H112N24O15 + H]+ 1709.88, found 1710.0662Analytical HPLChomogeneous single peak, retention time = 15.6 min (5-95% B in 30 min)
MS (MALDI) calc’d for [C85H112N24O15 + H]+ 1709.88, found 1710.4043Analytical HPLChomogeneous single peak, retention time = 15.2 min (5-95% B in 30 min)
MS (MALDI) calc’d for [C79H98Cl3N24O9 + H]+ 1631.7, found 1631.1354
Analytical HPLChomogeneous single peak, retention time = 19.5 min (5-95% B in 30 min)
265
1H NMR (DMSO-d6)
13C NMR (DMSO-d6)
266
General Procedure for Immobilization of Multivalent Protein G MimicsThe solution of compounds 10, 1,3-dimethoxybenzene, 0.2M NaHCO3/DMF
(1:1, pH = 9.7) was prepared and analyzed by RP-HPLC. Epoxy-activated sepharose 6B(Amersham Biosciences) was washed 10 times with pure water for 20 min. The mixture
of the solution with sepharose was shaken for 20 h at 25 ˚C, then incubated in a water
bath for 22 h at 35 ˚C. The reaction solution was analyzed again by RP-HPLC tomonitor the absorption of compounds 10 immobilized on sepharose. The sepharose with
the attachment of compounds 10 was washed three times with Tris (pH 9.4), total 10 h(2x3h and 1x4h) followed by pure water (5x).
HPLC trace of the 10at (peak 1) and standard (peak 2) solution in 0.2MNaHCO3/DMF (1:1) at t = 0.
267
HPLC trace of the 10at (peak 1) and the internal standard (peak 2) solution in 0.2MNaHCO3/DMF (1:1) at the end
HPLC trace of the 10cw (peak 2) and the internal standard(peak 1) solution in 0.2MNaHCO3/DMF (1:1) at t = 0.
268
HPLC trace of the 10cw (peak 2) and the internal standard (peak1) solution in
0.2M NaHCO3/DMF (1:1) at the end of loading
HPLC trace of the 10cx (peak 2) and the internal standard(peak 1) solution in
0.2M NaHCO3/DMF (1:1) at t = 0.
269
HPLC trace of the 10cx (peak 2) and standard (peak1) solution in 0.2M NaHCO3/DMF(1:1) at the end of loading
Docking ProtocolDocking/Affinity in Insight II was used for the docking study, and the Monte
Carlo method was applied to search for the globally optimized complexes. Crystal
structure of Fab fragment of IgG was selected as the receptor for this affinity modeling.Receptor and ligands were prepared using Insight II. Domain III of protein G and water
molecules were removed from the complex. Remaining Fab fragment of IgG was usedas a receptor. Ligands A-C (Figure 4.5) were constructed and optimized using Builder
module of Insight II. A subset containing the ligand and the specified binding active site
was then defined. CVFF force field was selected to assign potentials for the ligand-receptor assembly. Affinity and electrostatic grids were generated by
Affinity/GridDocking module. The partial charges on the atoms of IgG/Fab were taken
from the CVFF force field parameters. The grid spacing was 0.5 Å in each dimension,and each grid map consisted of 70 x 70 x 70 grid points. The subset was minimized with
2000 steps using Conjugate Gradient (Polak_Ribiere) method, and energeticallyfavorable structures were found via Monte Carlo search at the same time.
270
APPENDIX GEXPERIMENTAL FOR CHAPTER V
CO2HO2N
TrtO
39
ProcedureA mixture of 4-(bromomethyl)-3-nitrobenzoic acid (5.0 g, 19.23 mmol) and
sodium carbonate (8.15 g, 76.91 mmol) in 84 mL of 1:1 acetone/water was refluxed.
After 3 h the mixture was cooled to 25 ˚C, then acidified to pH 2 with 2M HCl, extracted
with ethyl acetate (80 mL x 4), dried over anhydrous magnesium sulfate andconcentrated in vacuo to give 4-(Hydroxymethyl)-3-nitrobenzoic acid 3.5 g (92%) as a
brown solid. This material was used for the next step without further purification.
dimethylformamide (45 mL) and diisopropylethylamine (6.8 mL, 39.09 mmol) wereadded to a 100 mL round bottom flask and the mixture was stirred at 55 ˚C for 10 h. The
solvent was removed in vacuo and the residue was purified by flash chromatography
with an eluent of 20 - 50% ethyl acetate and 1% acetic acid in hexane to give 5.125 g(yield 66%) compound 39 as yellow solid.
Procedure for Coupling Compound 40 to Polystyrene-Rink ResinResin with Rink linker was swelled in CH2Cl2 in a fritted syringe for 30 min.
The Fmoc protecting group on the resin was removed by treating the resin with 20%
piperidine in DMF (2 x, 10!min and then 15 min). The resin was washed with DMF(3x), MeOH (3x), CH2Cl2 (3x), DMF (2x), MeOH (2x), and CH2Cl2 (3x) and then treated
with template 40 (2 equiv), HBTU (3 equiv), HOBt (3 equiv), and DIEA (8 equiv) in
DMF. After 2 h of gentle shaking, the mixture was drained. The resin was then washedas the above washing cycle. A ninhydrin test on a small sample of beads was performed
and gave a negative result.
General Procedure for Preparation of the Cyclic Peptidomimetics (36a-d,NH2)Illustrated for Compound 36a. The resin containing template 40 was treated withFmoc-Lys(Boc)-OH (4 equiv), PyBrop (4.6 equiv), 2,6-lutidine (15 equiv) in CH2Cl2 for
20 h. After washing with DMF (3x), MeOH (3x), CH2Cl2 (3x), DMF (2x), MeOH (2x),
and CH2Cl2 (3x), and Fmoc deprotection, Fmoc-Ile was then introduced using Fmoc-Ile-OH (3 equiv), DIC (3 equiv), HOBt (3 equiv), and DIEA (5 equiv) in CH2Cl2/DMF 2:1
for 2 h. The previously described washing cycle and Fmoc deprotection were repeatedand 2-fluoro-5-nitrobenzoic acid moiety was introduced by treating the resin with 2-
fluoro-5-nitrobenzoyl chloride (2.5 equiv) and DIEA (5 equiv) in CH2Cl2 for 1 h. The
side-chain protecting group (Trt) of the template was removed by treatment with 1%TFA and 5% TIS in CH2Cl2 (6 x 3 min). After the resin was washed and the
macrocyclization step was carried out by gently shaking the resin supported peptide withK2CO3 (10 equiv) in DMF at 25 ˚C for 40 h, The mixture was drained and the resin was
MeOH (2x), and CH2Cl2 (3x) and then dried in vacuo over night. The resin containingside-chain protected cyclic peptide was swelled in CH2Cl2 for 30 min and treated with
SnCl2.2H2O (10 equiv) in DMF for 24 h. After washing the peptide was cleaved from theresin by the treatment of a mixture of 90% TFA, 5% TIS, and 5% H2O for 2 h. The
cleavage solution was separated from the resin via filtration. After most of the cleavage
276
cocktail was evaporated in a stream of nitrogen, the crude peptide was precipitated using
cooled anhydrous ethyl ether. The purity of this crude product was determined byanalytical HPLC (SSI system, 2-40% B in 30 min). The crude product was dissolved in
H2O, filtered, then purified with preparative HPLC and finally lyophilized to yield whitepowder of 36a: 15 mg, yield: 40%.
68.4, 60.7, 53.7, 35.7, 31.0, 27.1, 26.0, 23.3, 16.3, 11.3MS (MALDI) calc’d for C27H36N6O5 (M+H+) 525.6, found 525.1
277
Analytical HPLChomogeneous single peak, retention time = 11.7 min (2-40% B in 30 min)
1H NMR (DMSO-d6)
278
13C NMR (DMSO-d6)
General Procedure for Preparation of the Derivatized Macrocycles 37 and 38N-Methyl Sulfonamide Derivatives 4a-e. Resin containing side-chain protected cyclicpeptide with amino group was swelled in CH2Cl2 in a fritted syringe for 30 min and
treated with 10 equiv. of methanesulfonyl chloride, 10 equiv. of pyridine and 1 equiv. of
4-dimethylaminopyridine in CH2Cl2. After gental shaking for 24 h, the resin waswashed with DMF (3x), MeOH (3x), CH2Cl2 (3x), DMF (2x), MeOH (2x), and CH2Cl2
(3x) and the peptide was cleaved from the resin by treatment with a mixture of 90%TFA, 5% TIS, and 5% H2O for 2 h. The cleavage solution was separated from the resin
via filtration. After most of the cleavage cocktail (about 90%) was evaporated in a
stream of nitrogen, the crude peptide was triturated using anhydrous ethyl ether. Thepurity of this crude product was determined by analytical HPLC (SSI system, 2-40% B
in 30 min). The crude product was dissolved in H2O, filtered, then purified with
preparative HPLC and finallly lyophilized to yield products 37a-e.
with amino group was swelled in CH2Cl2 in a fritted syringe for 30 min and treated with
10 equiv. of N, N'-bis-BOC-1-guanylpyrazole in DMF. After gental shaking for 24 h,the resin was washed with DMF (3x), MeOH (3x), CH2Cl2 (3x), DMF (2x), MeOH (2x),
and CH2Cl2 (3x) and the peptide was cleaved from the resin by treatment with a mixtureof 90% TFA, 5% H2O and 5% TIS for 2 h. The cleavage solution was separated from
the resin via filtration. After most of the cleavage cocktail (about 90%) was evaporated
in a stream of nitrogen, the crude peptide was triturated using anhydrous ethyl ether. Thepurity of this crude product was determined by analytical HPLC (SSI system, 2-40% B
in 30 min). The crude product was dissolved in H2O, filtered, then purified withpreparative HPLC and finally lyophilized to yield products 38a-c.
11.4LRMS (MALDI) calc’d for C28H38N8O5 (M+H+) 567.6, found 567.1
Analytical HPLChomogeneous single peak, retention time = 13.7 min (2-40% B in 30 min)
HNO
HNCOCO
NH
OHN
CONH2
NH2
NH2HN
285
1H NMR (DMSO-d6)
13C NMR (DMSO-d6)
286
General Procedure for Preparation of the Fluoresceinylated Macrocycles 41Resin containing side-chain protected cyclic peptide with amino group was
swelled in CH2Cl2 in a fritted syringe for 30 min and treated with 4 equiv Fmoc-b-Ala-
OH, 4.6 equiv PyBrOP and 15 equiv 2,6-lutidine in CH2Cl2. After 20 h shaking, the
resin was washed and the Fmoc protecting group was removed with 20% piperidine inDMF. Fluorescein 5-isothiocyanate, (ie “isomer I”; 3 equiv) was then added with 5
equiv DIEA in CH2Cl2/DMSO (2:1) for 3 h. After washing, the resin was cleaved with a
mixture of 90% TFA, 5% TIS, and 5% H2O for 2 h. After most of the cleavage cocktailwas evaporated in a stream of nitrogen. Anhydrous ethyl ether was added to precipitate
the product. The crude product was purified by preparative HPLC and lyophilized to
1H), 1.57 (m, 2H), 1.39 (m, 2H)LRMS (MALDI) calc'd for C47H44N8O11S (M+H+) 929.9, found 929.2
Analytical HPLC98.2 %, retention time = 15.8 min (10-50% B in 30 min)
HNO
HNCOCO
NH
ONHN
HHN
S
COOH
OHO
CONH2
O
NH2
O
288
1H NMR (DMSO-d6)
General Procedure for Preparation of Monomeric Precusors 42 and 43Resin containing side-chain protected cyclic peptide with amino group was
swelled in CH2Cl2 in a fritted syringe for 30 min and treated with 4 equiv Fmoc-Gly-OH,4.6 equiv PyBrOP and 15 equiv 2,6-lutidine in CH2Cl2. After 30 h shaking, the resin
was washed and the Fmoc protecting group was removed with 20% piperidine in DMF.
The resin was then washed and treated with 3 equiv Fmoc-Inp-OH, 5equiv DIC and 5equiv HOBt in DMF for 8 h. The resin was washed and Fmoc was removed. The resin
was washed again, dried in vacuo and split into two portions. One portion was subjected
to cleavage condition via the treatment with a mixture of 90% TFA, 5% TIS and 5%H2O for 2 h. After most of the cleavage cocktail was evaporated in a stream of nitrogen.
Anhydrous ethyl ether was added to precipitate the product. The crude product waspurified by preparative HPLC and lyophilized to yield final products 42a-c.
The other portion of the resin was swelled in CH2Cl2 in a fritted syringe for 30
min and treated with 2 equiv dichlorotriazinylaminofluorescein, 3 equiv iPr2NEt in a
289
mixture of DMSO/CHCl3 (1:3) for 3 h. The resin was washed and subjected to the above
cleavage condition. After most of the cleavage cocktail was evaporated in a stream ofnitrogen. Anhydrous ethyl ether was added to precipitate the product. The crude
product was purified by preparative HPLC and lyophilized to yield final fluorescently-labeled products 43a-c.


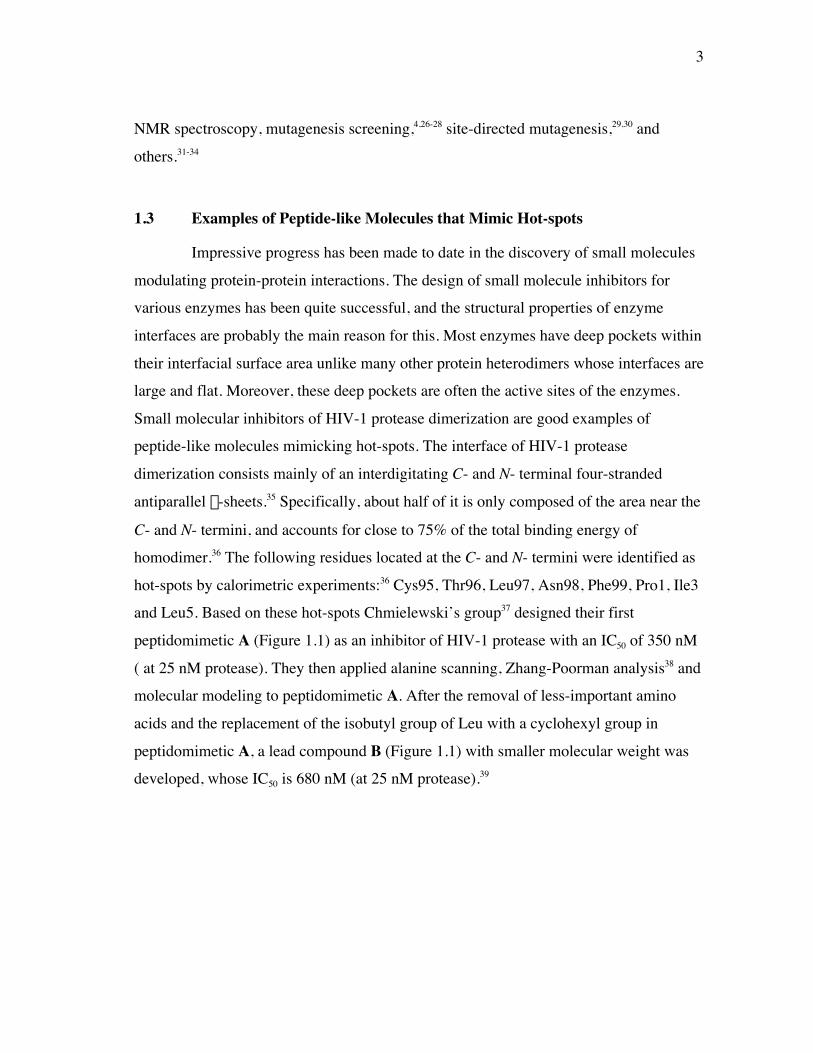


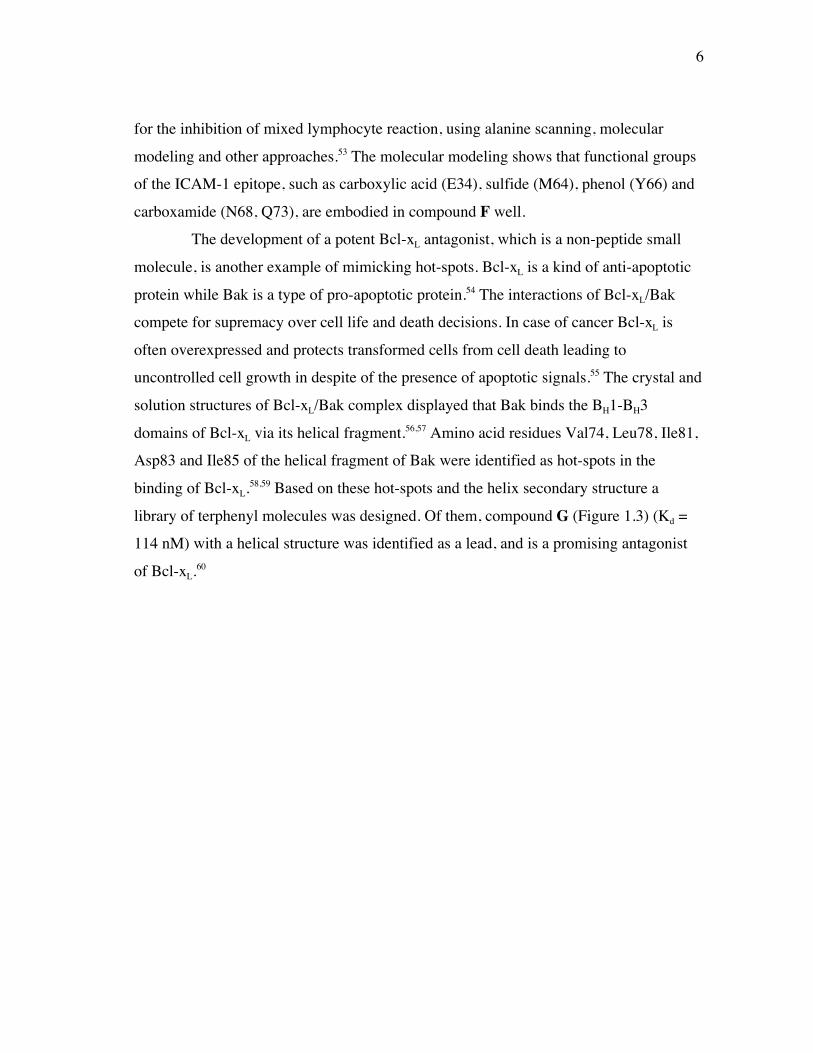


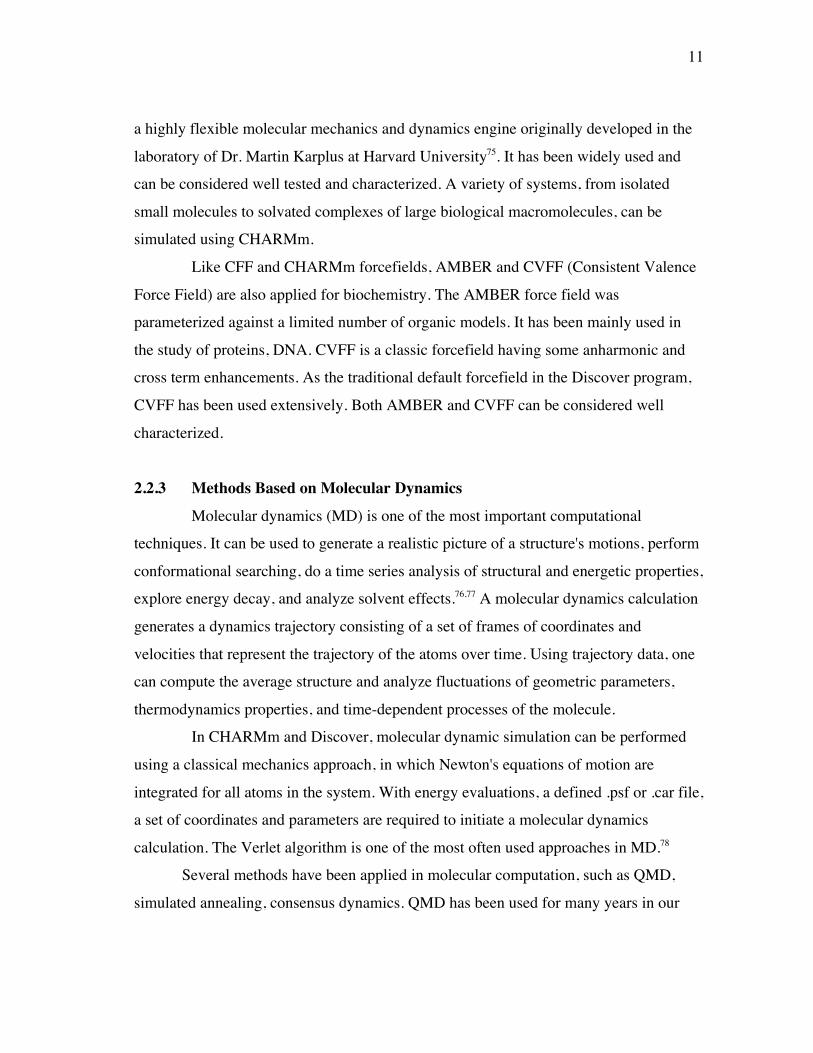


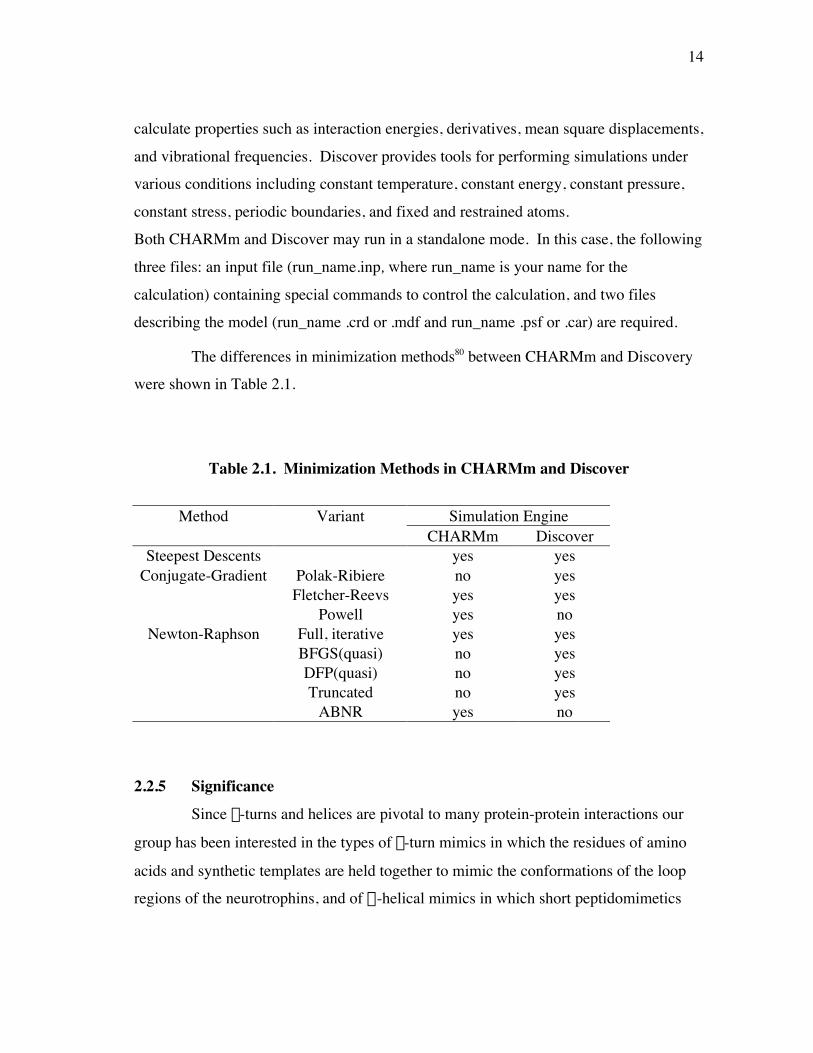

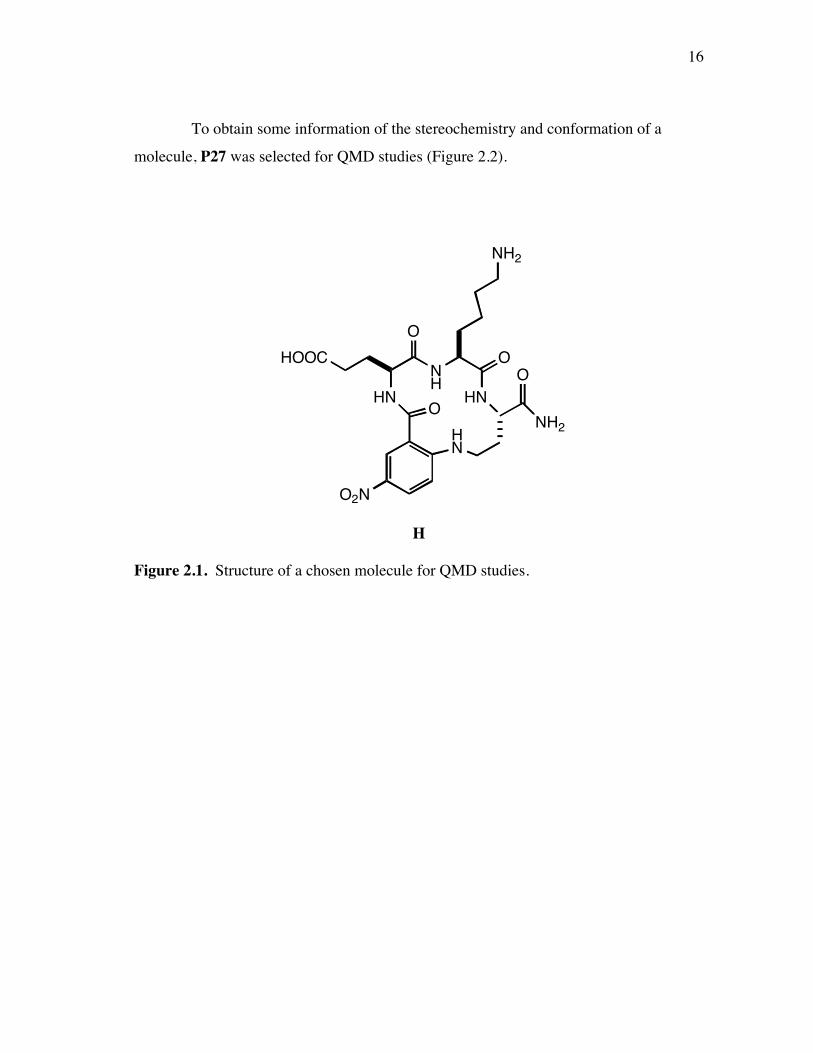

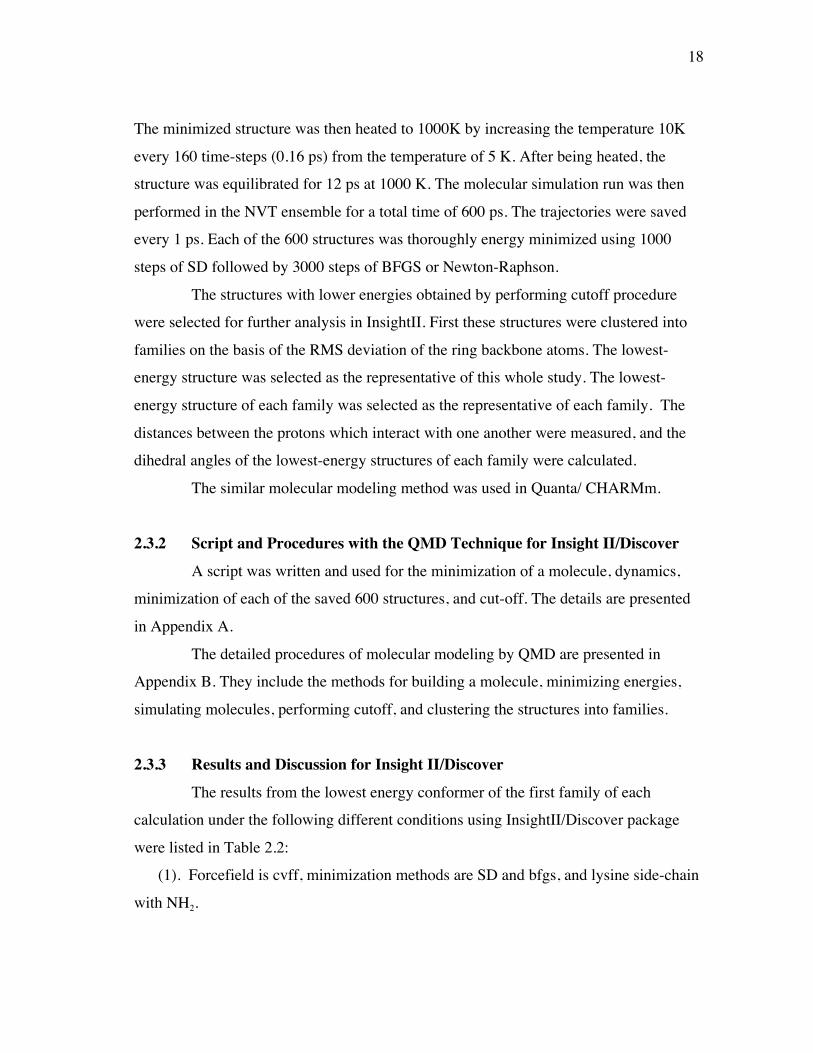

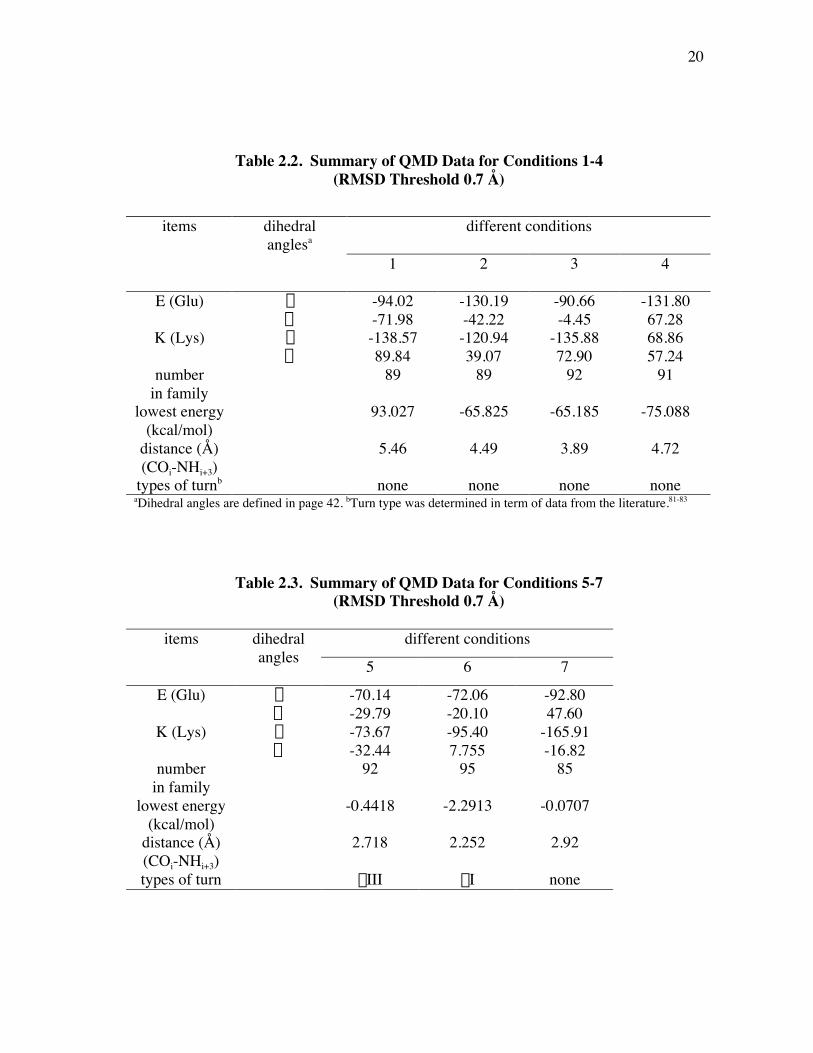


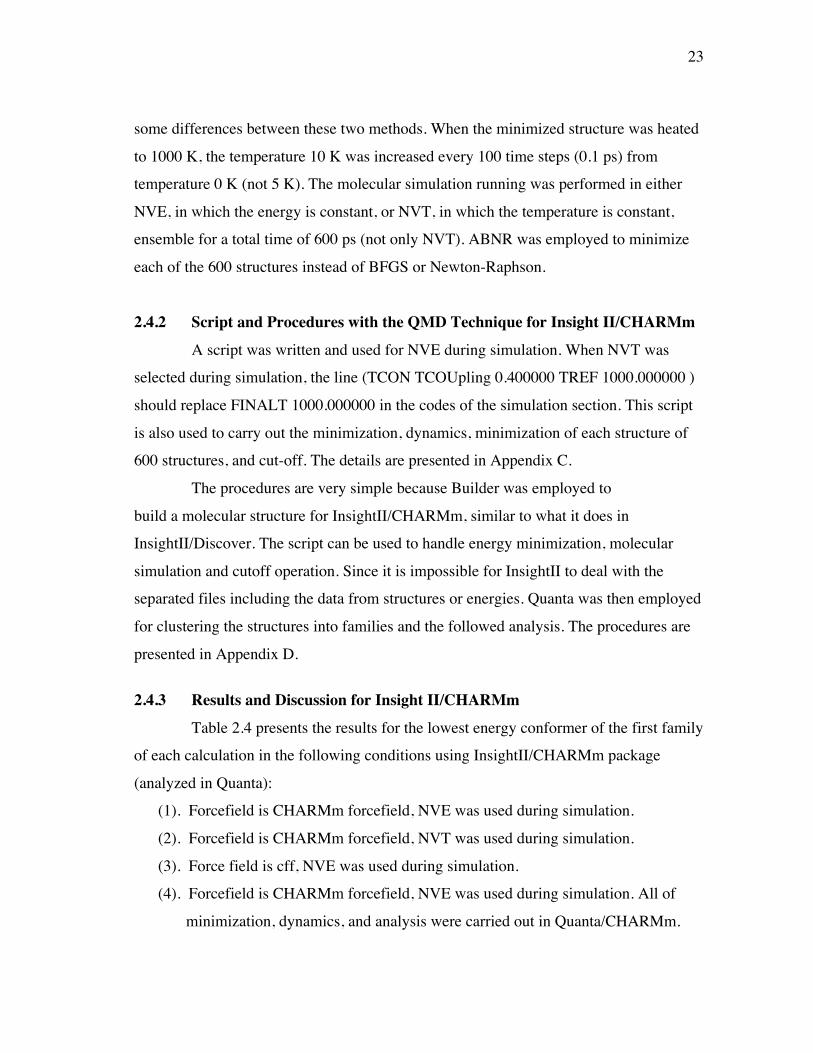

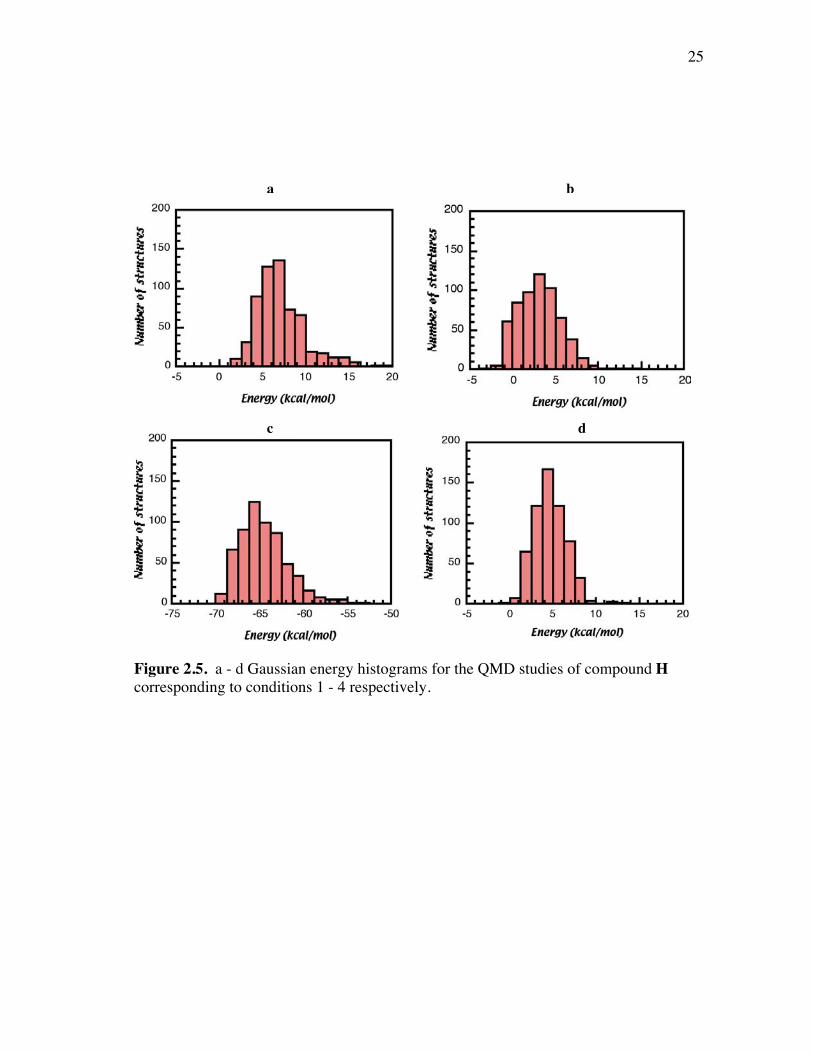

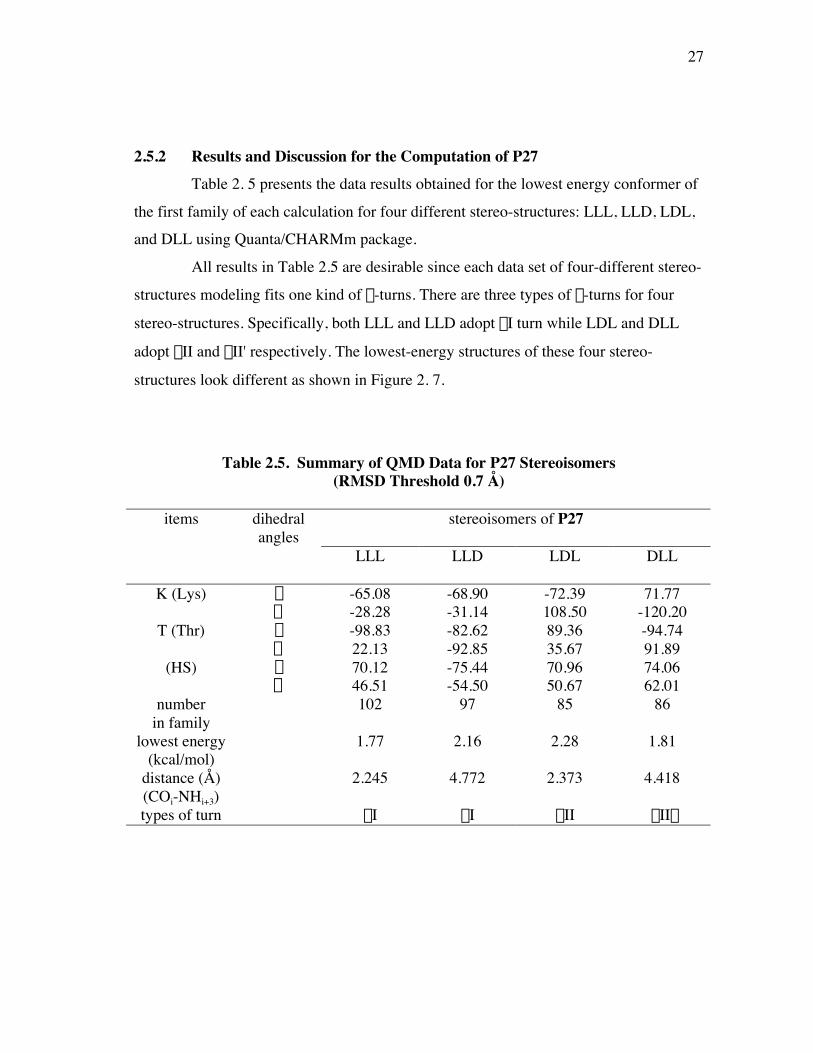


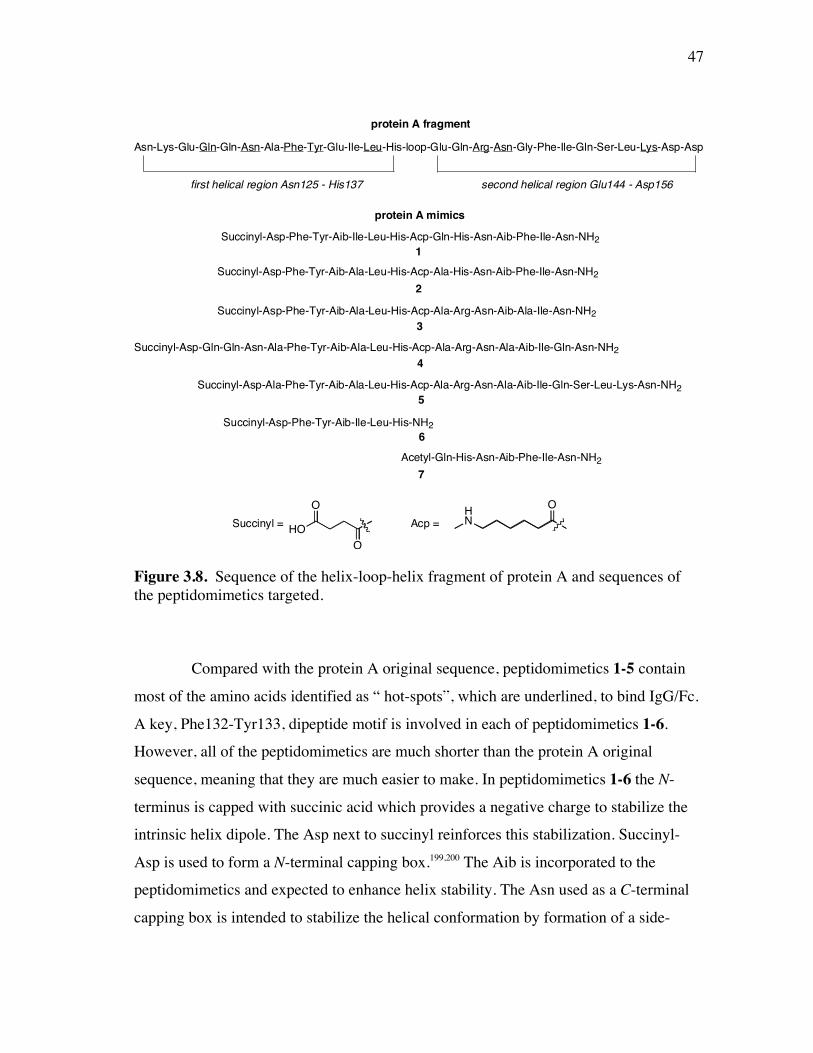
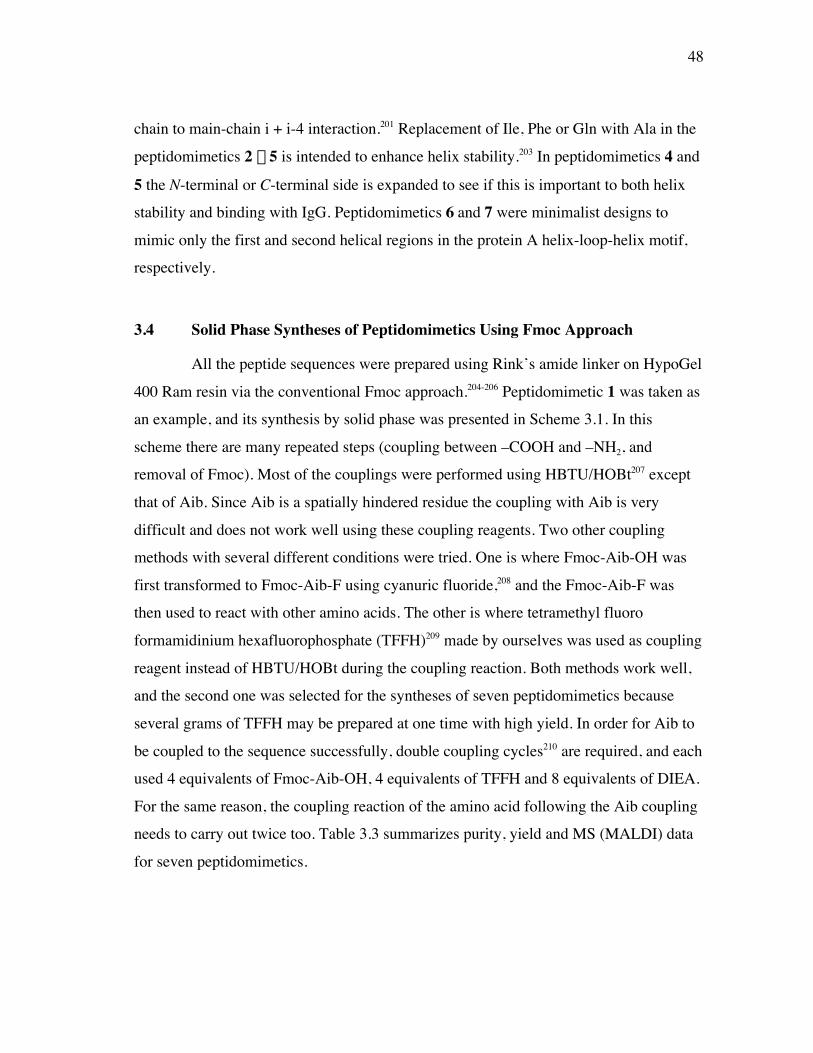

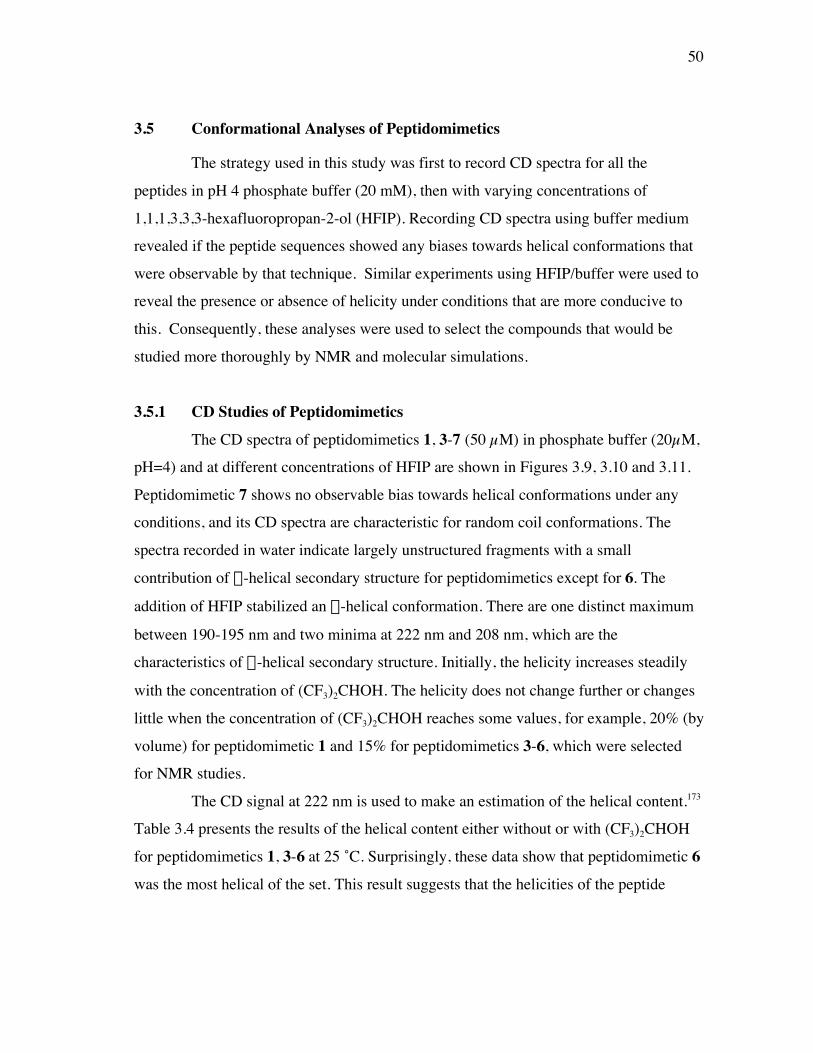


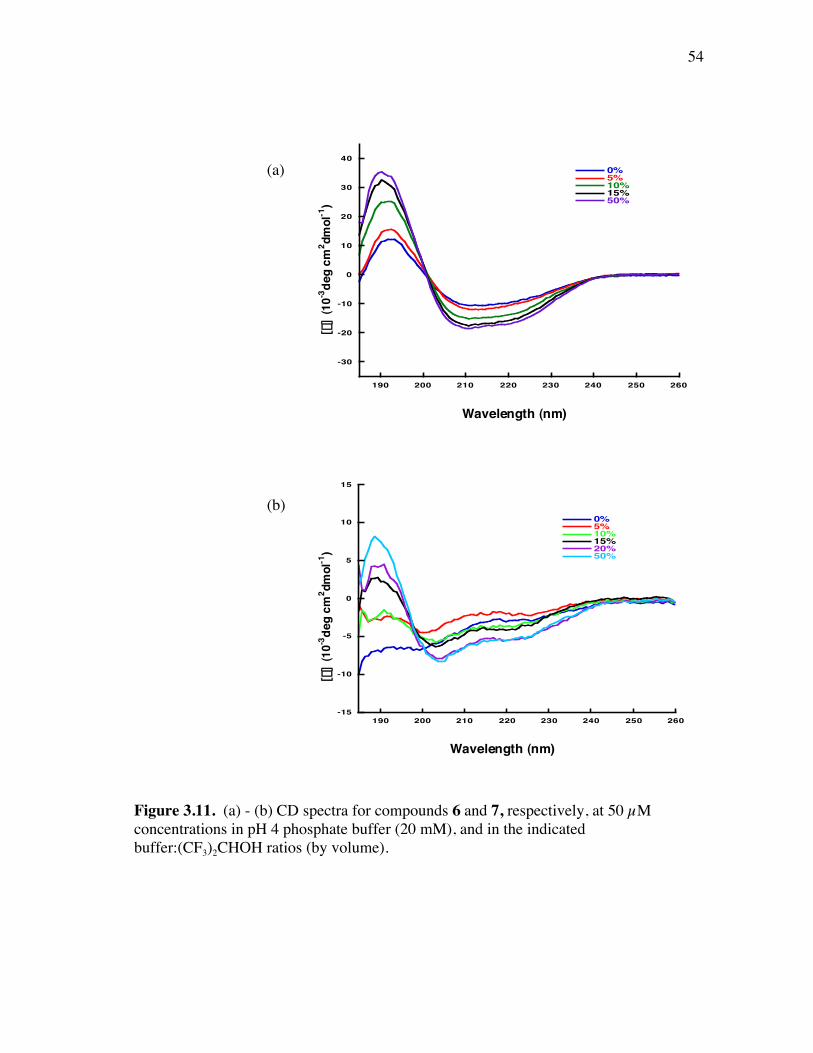
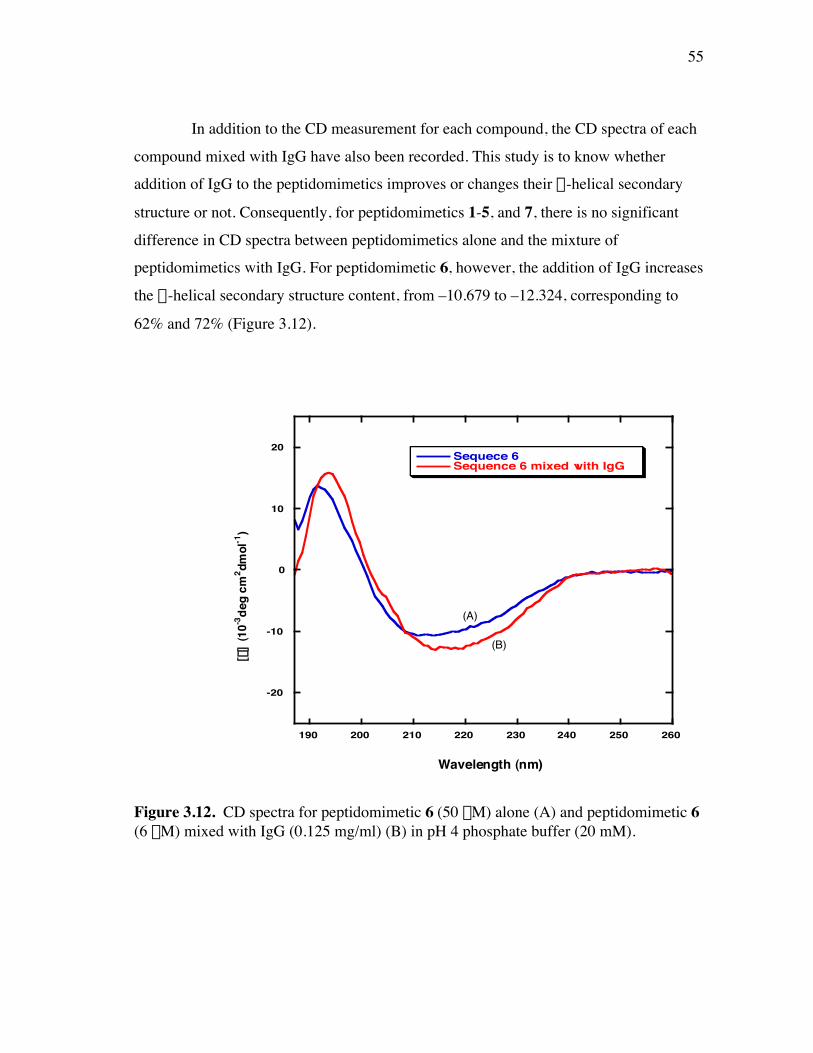
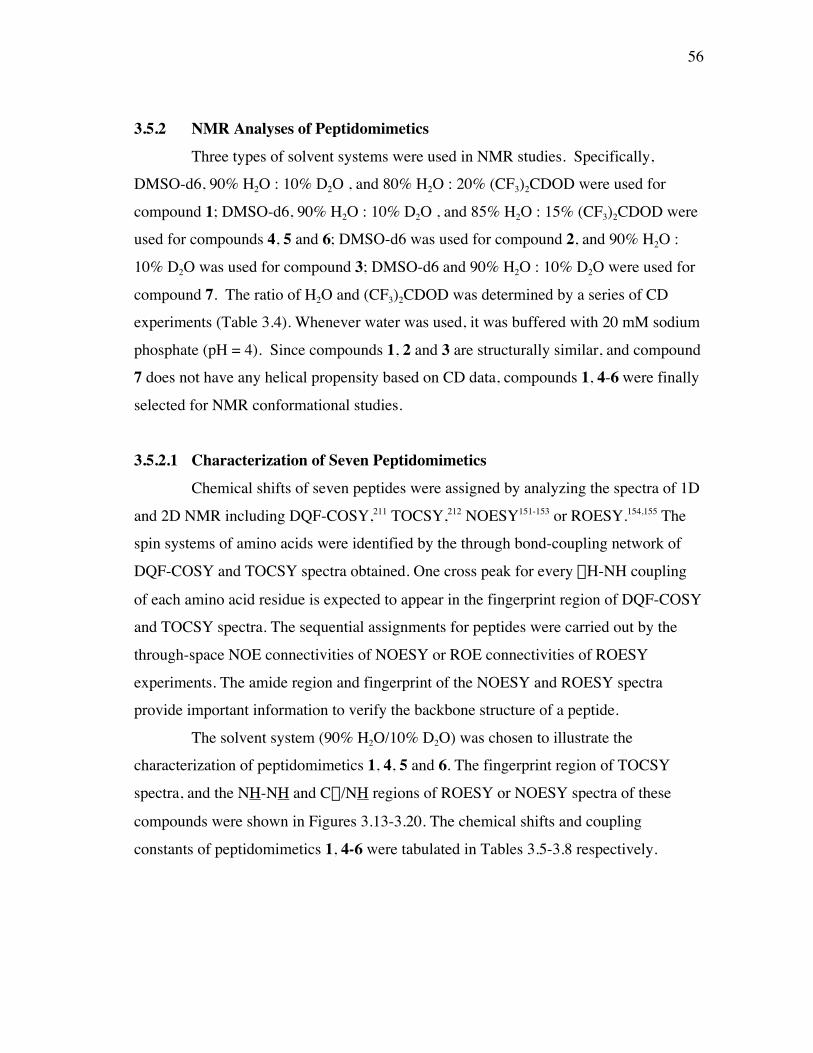

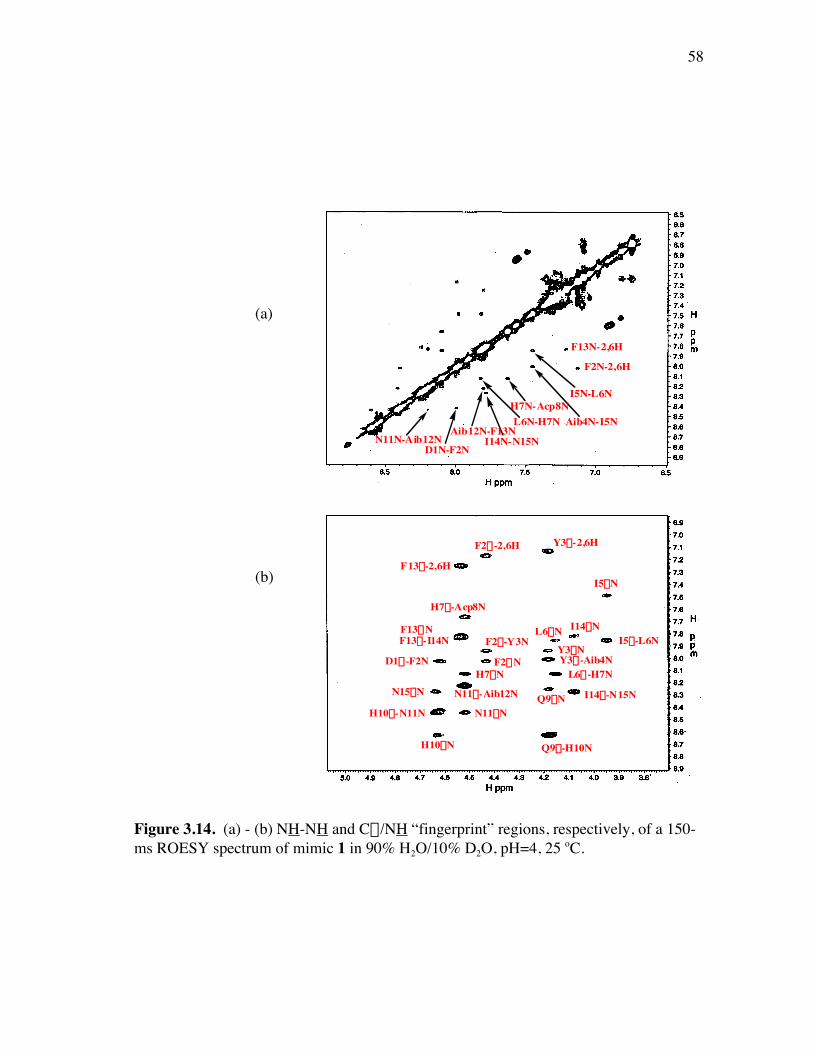

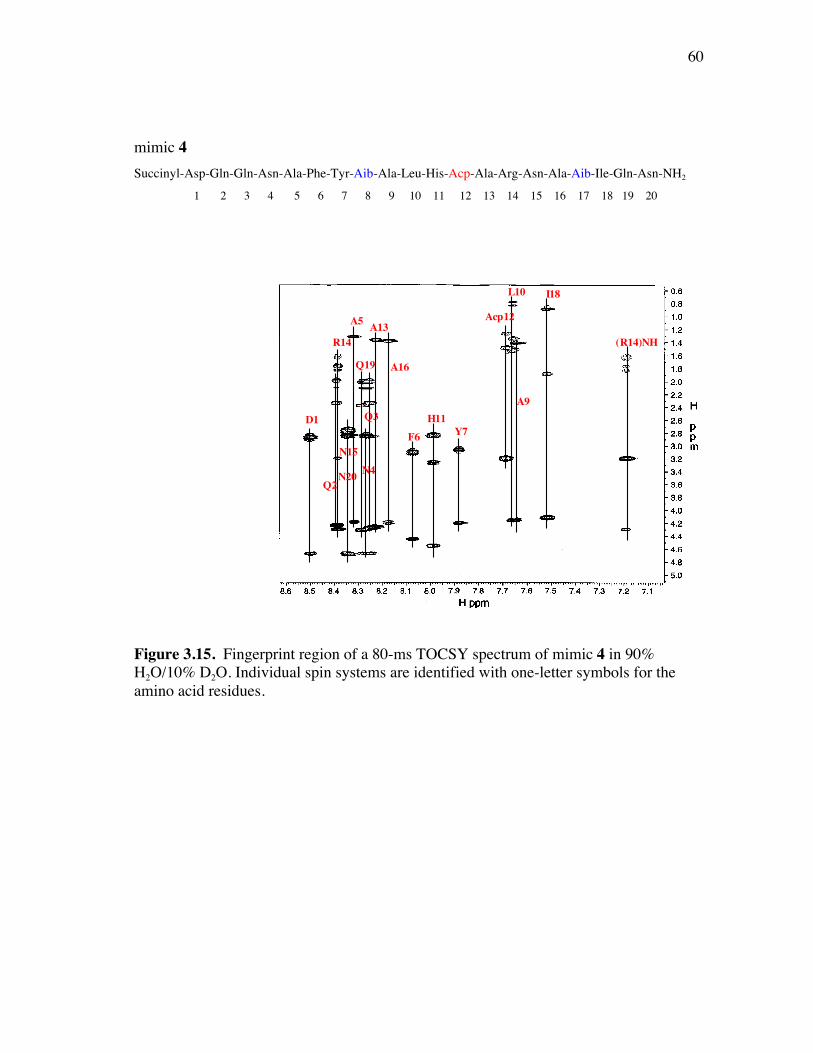
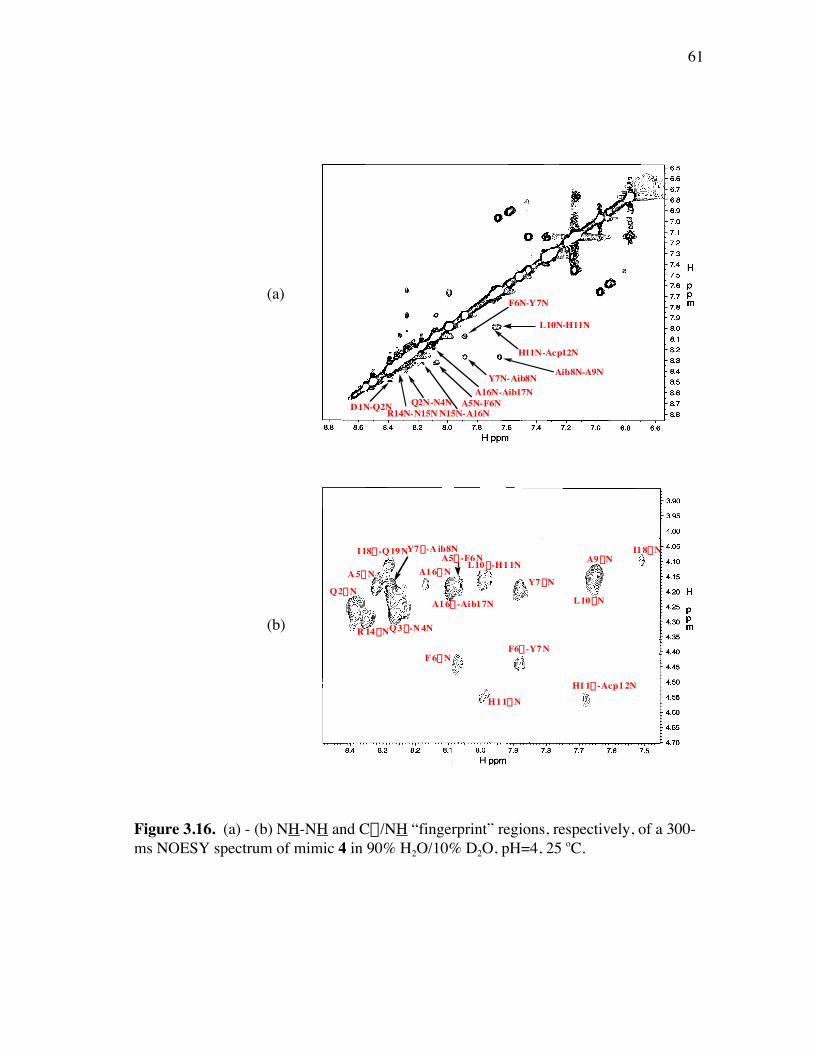

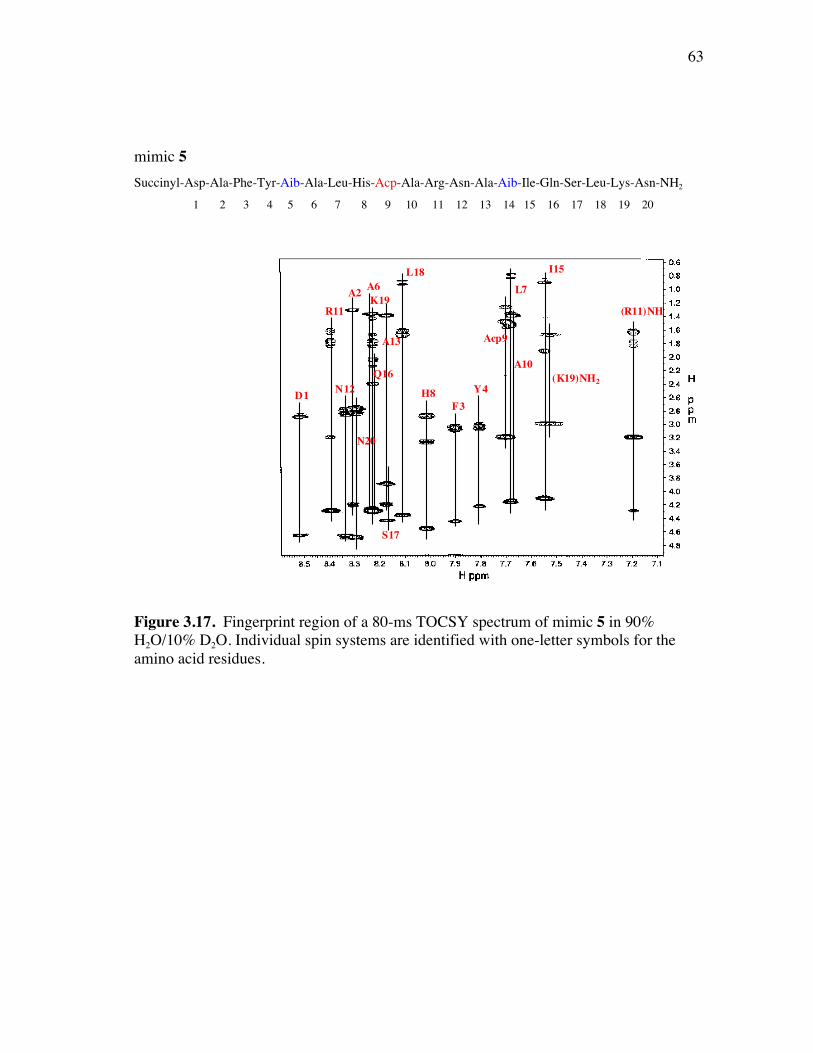
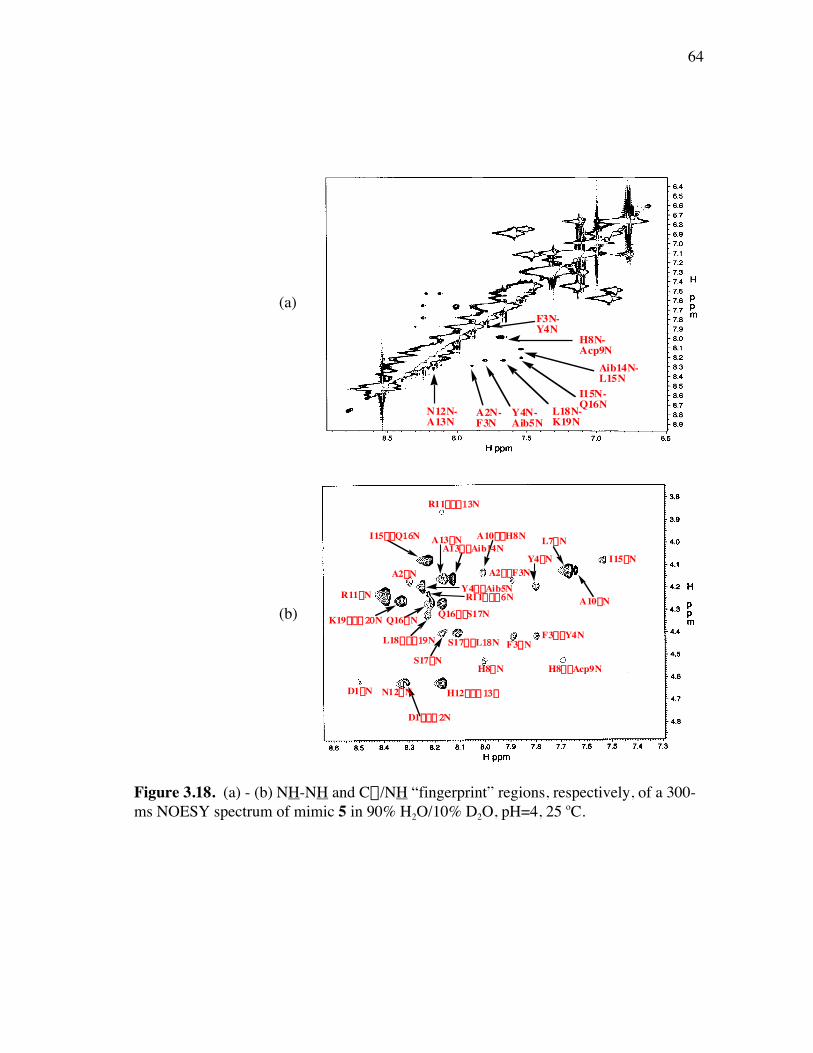


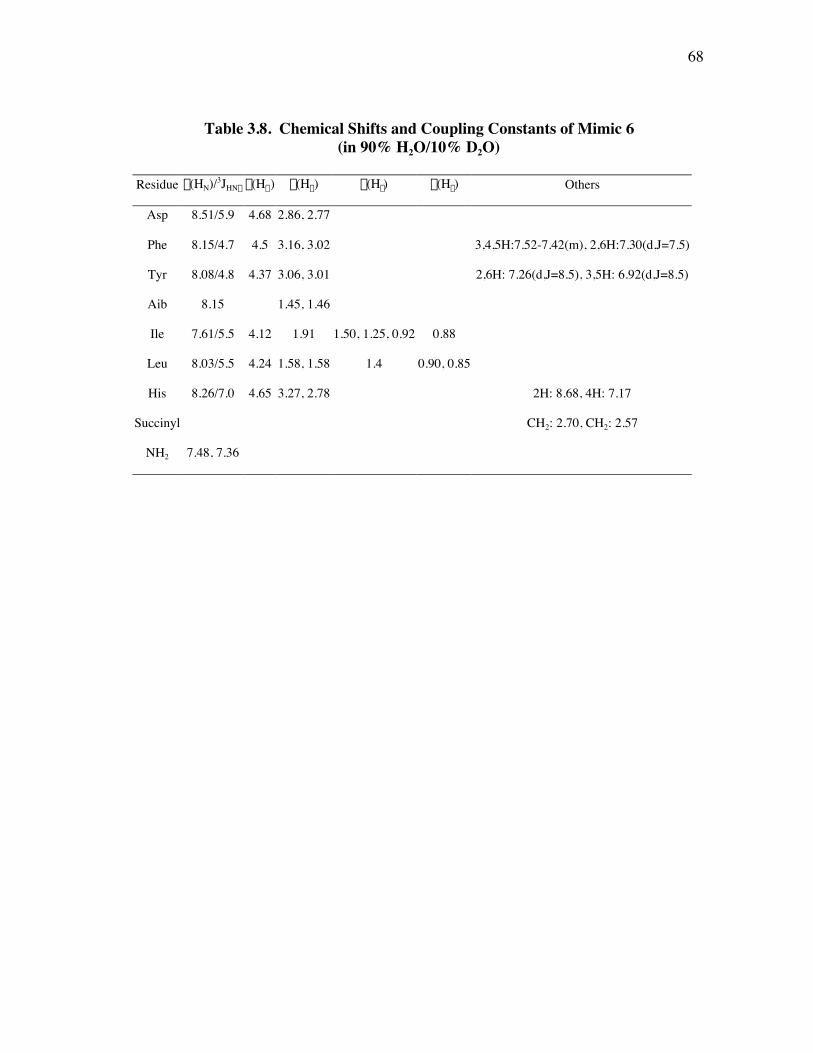

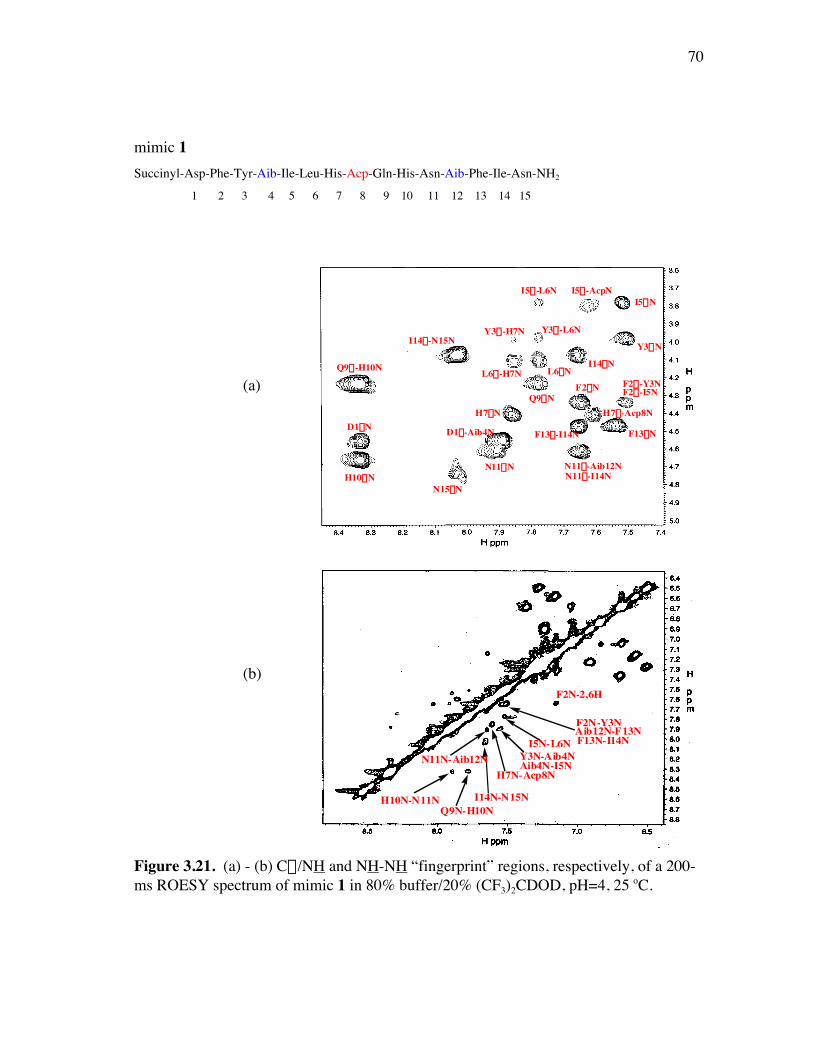

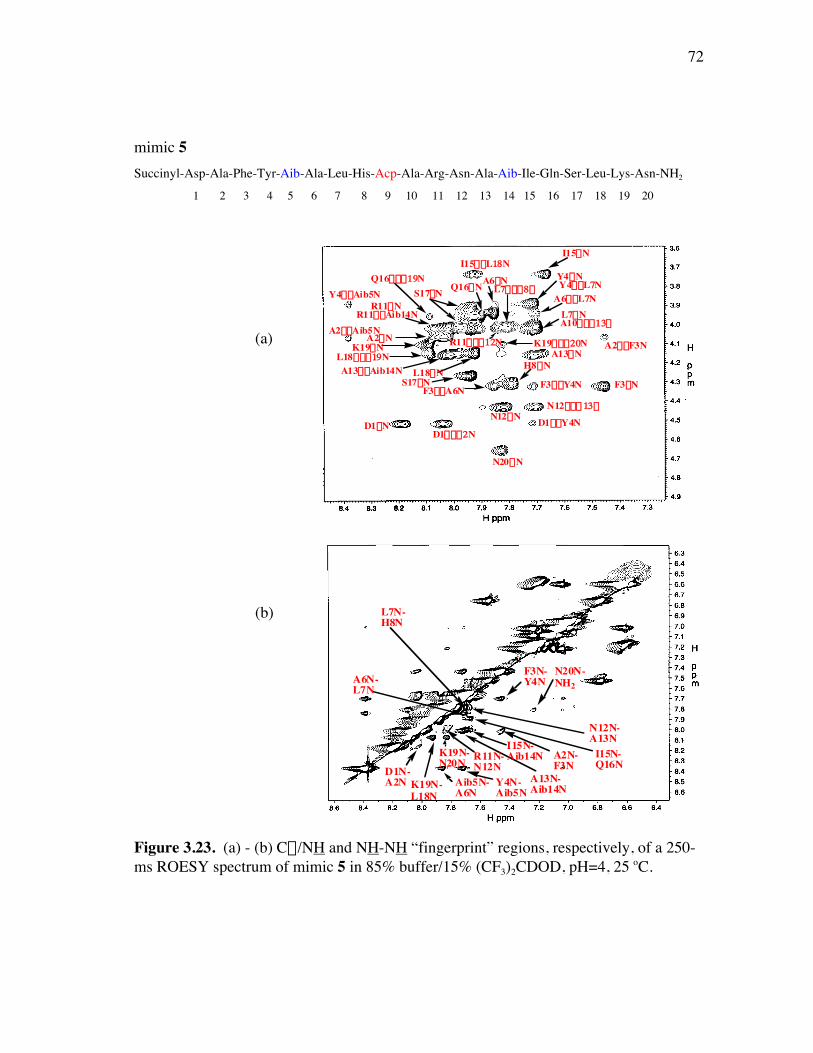
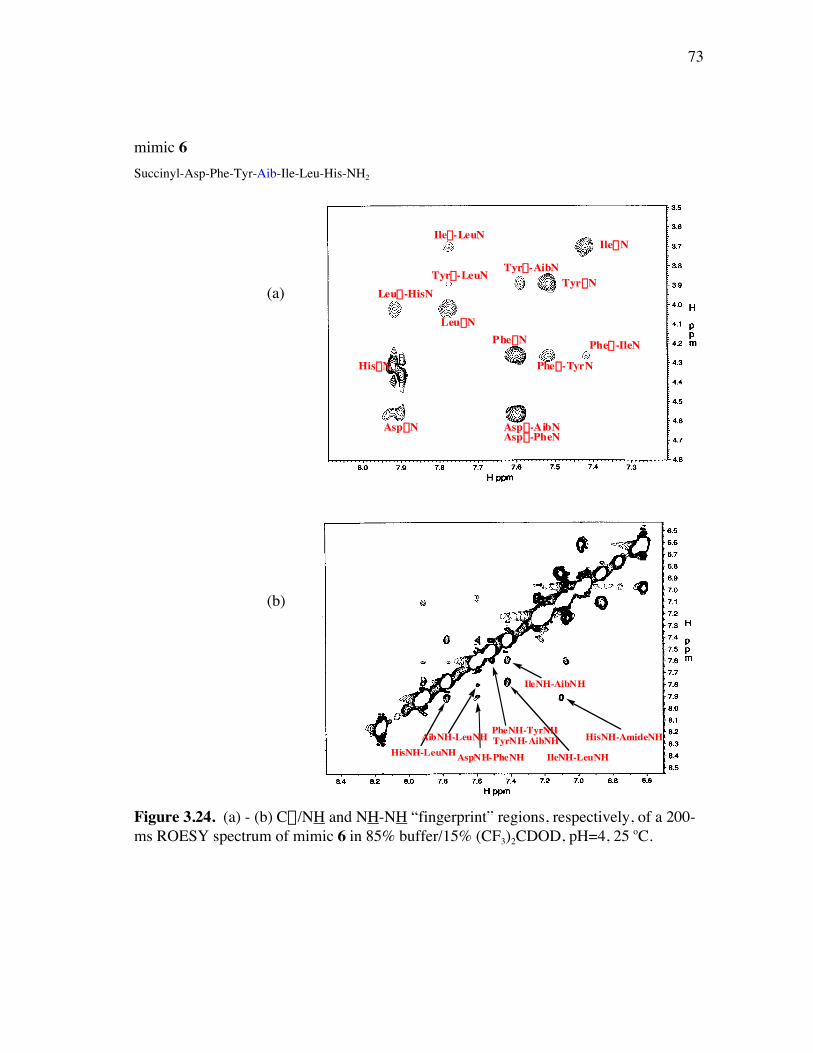
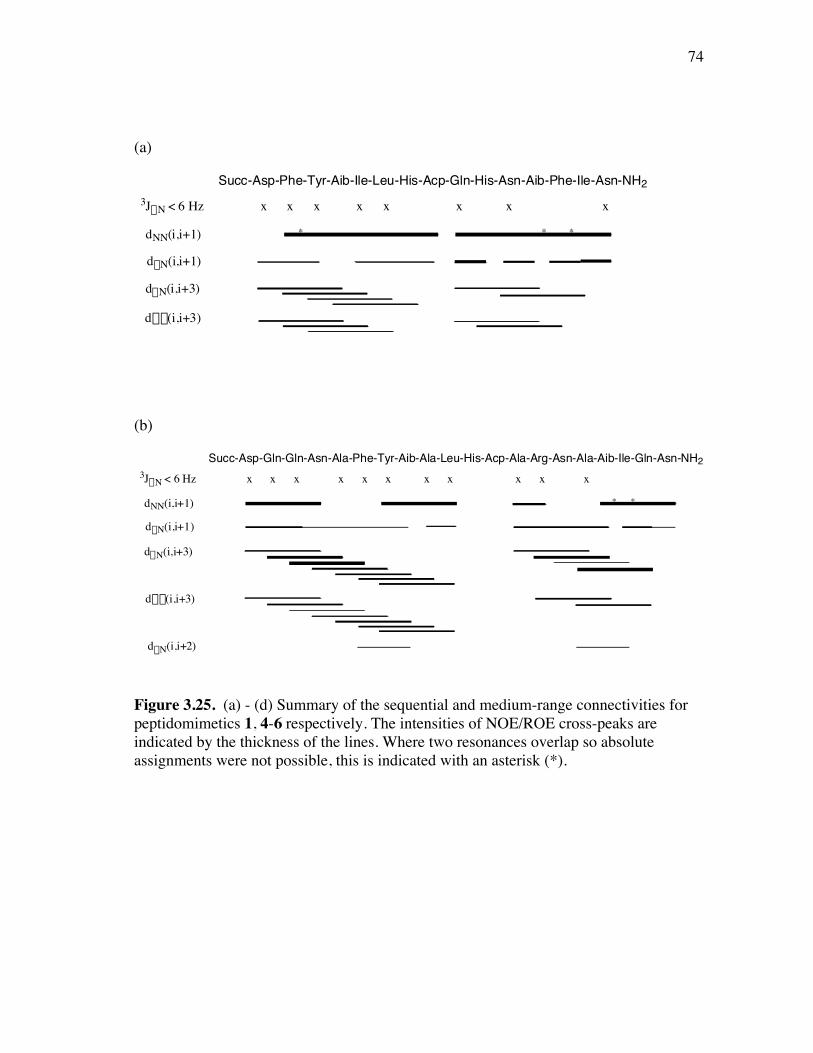


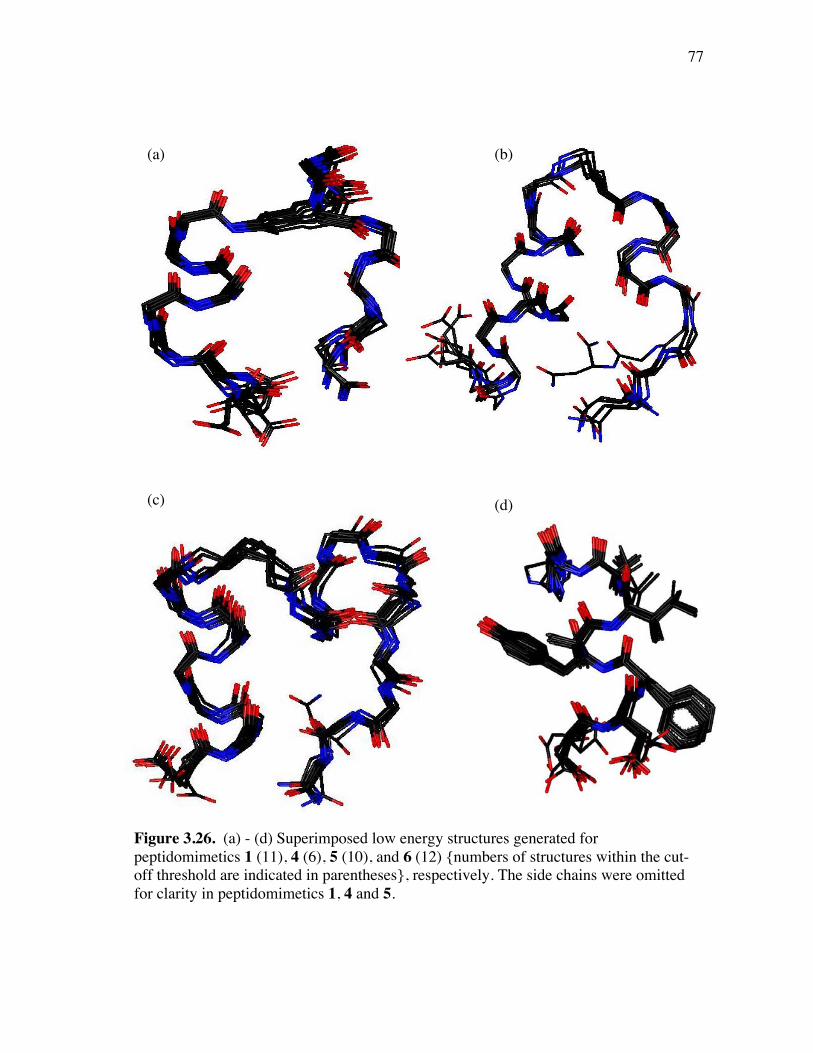


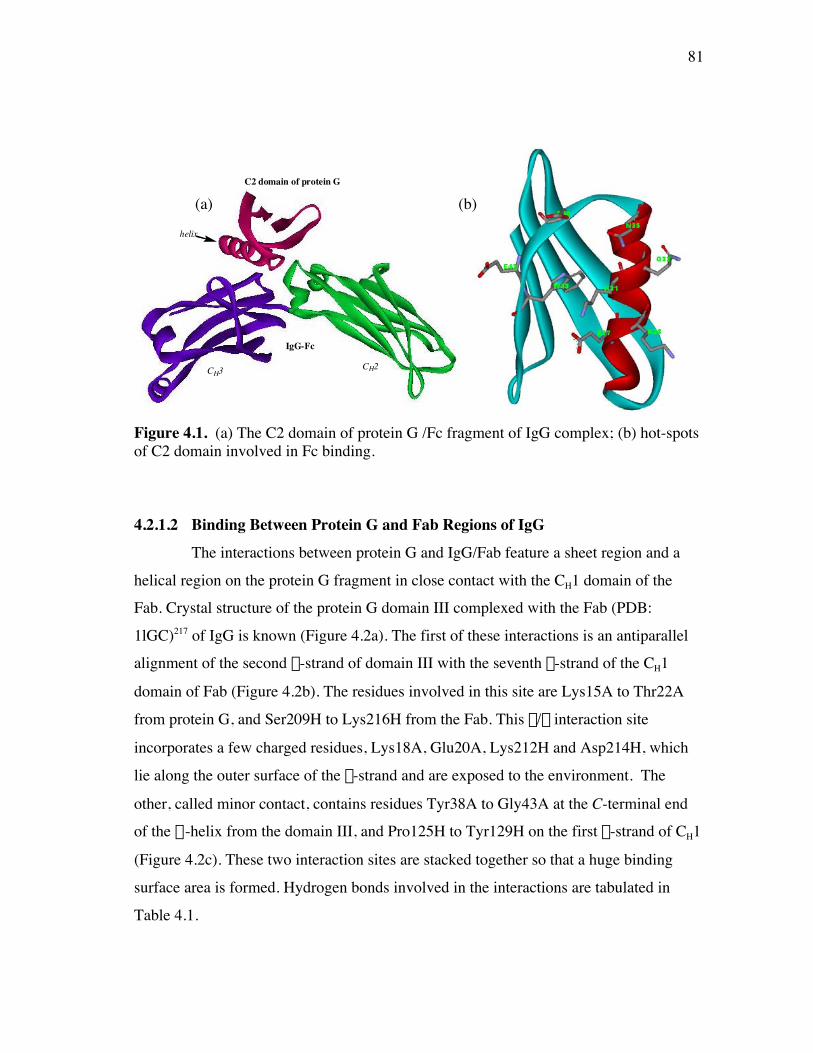


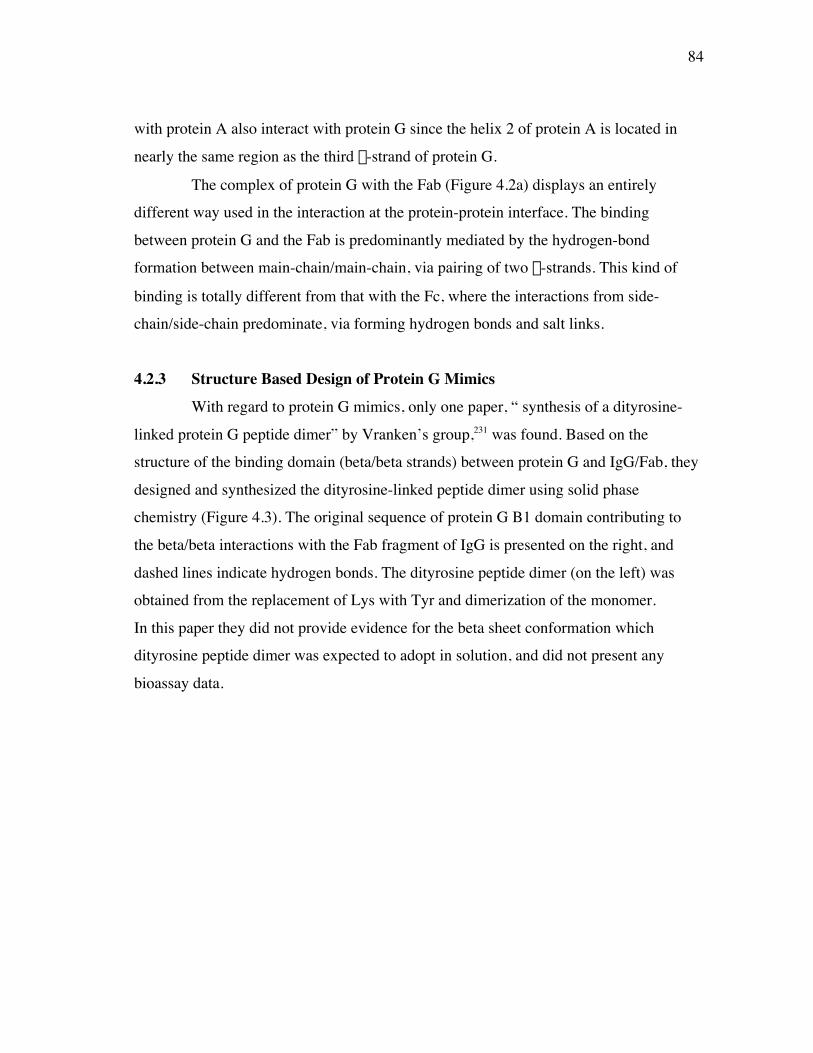
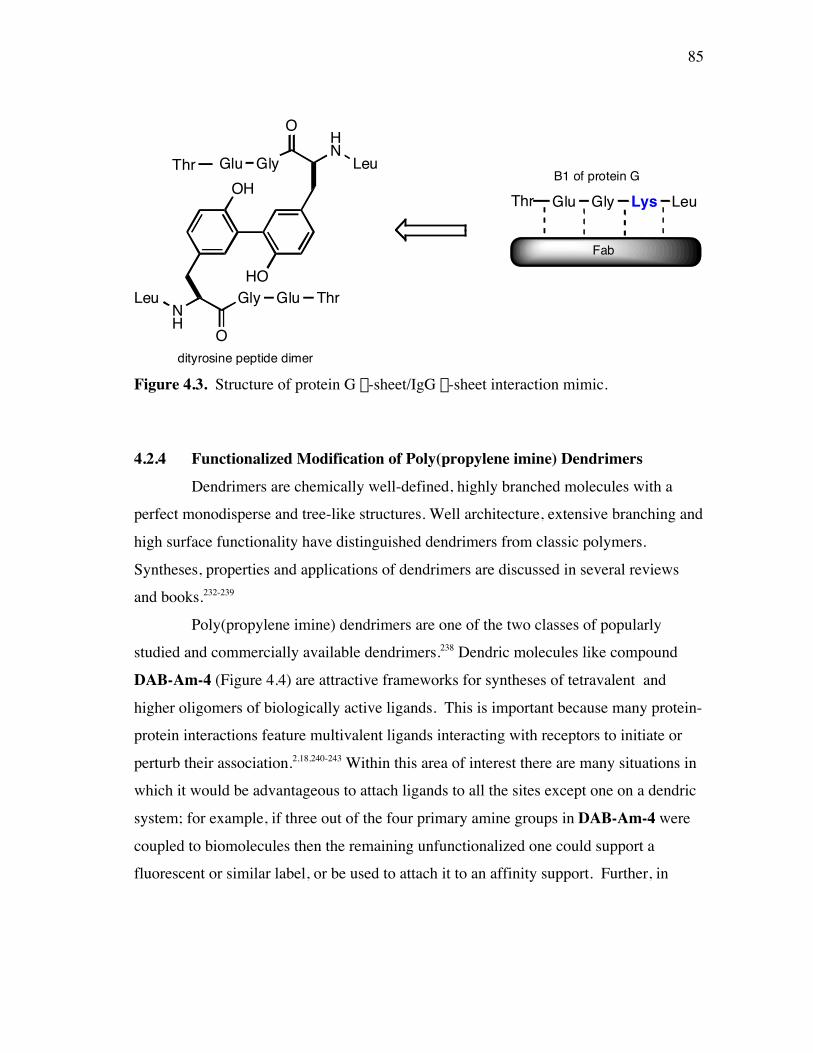


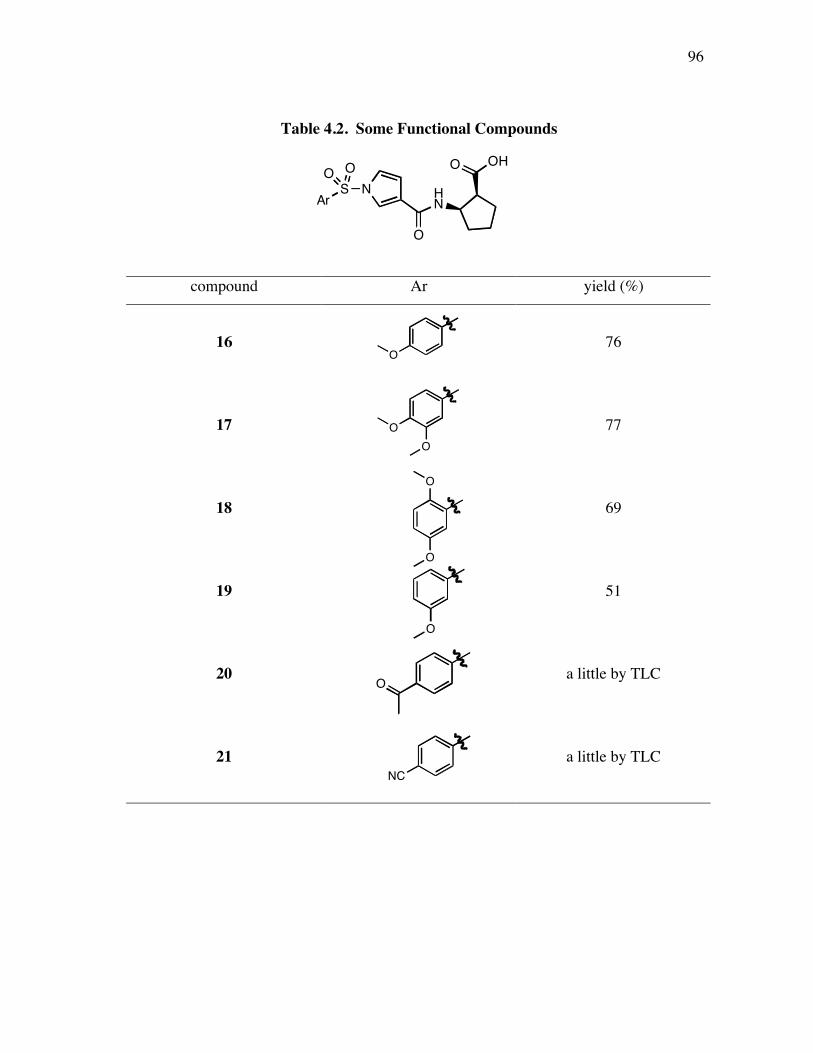


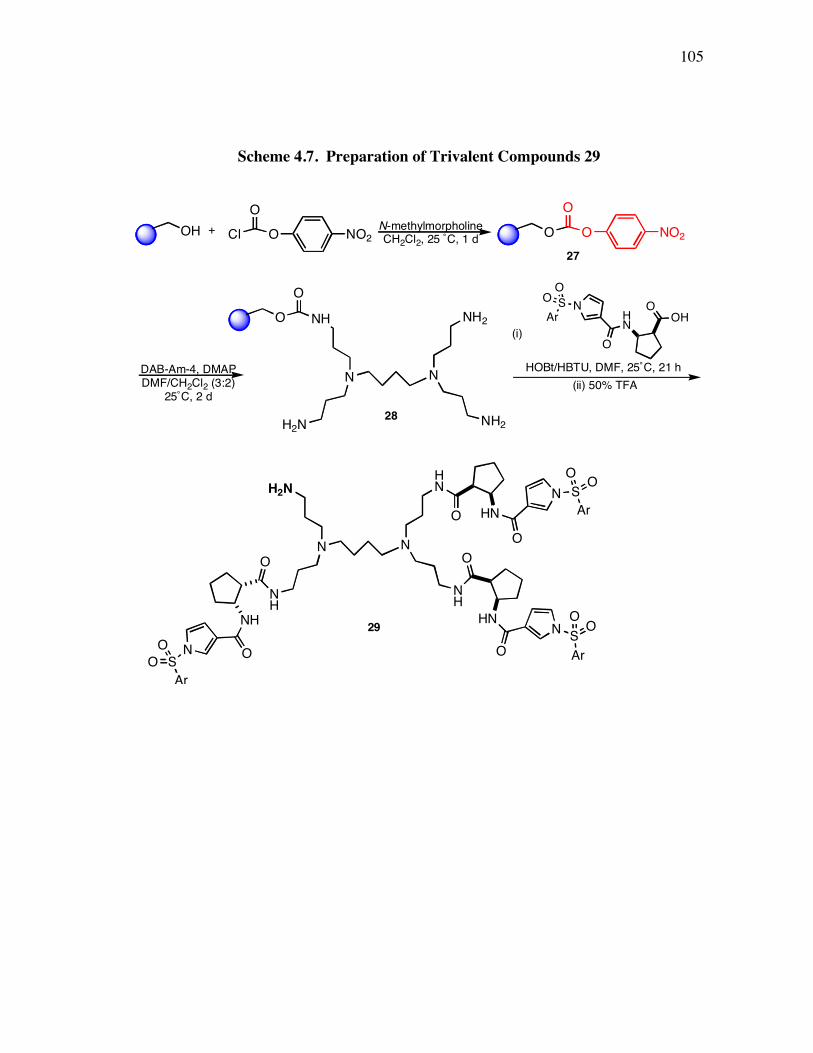


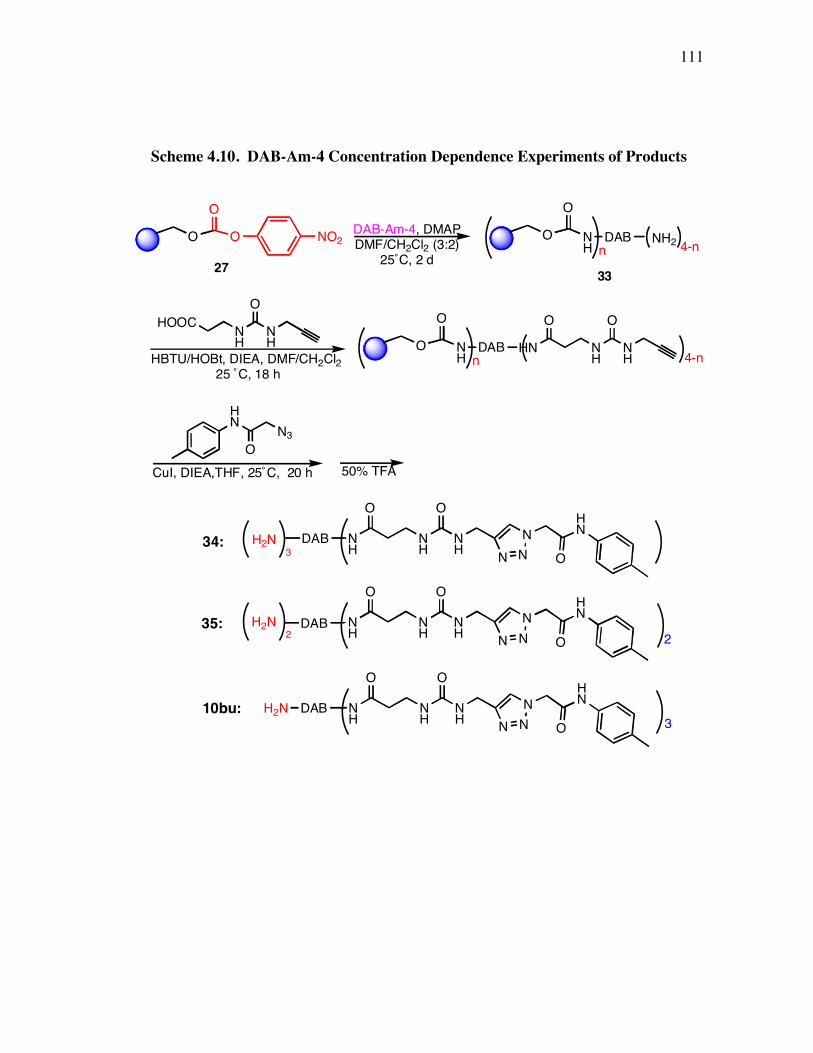


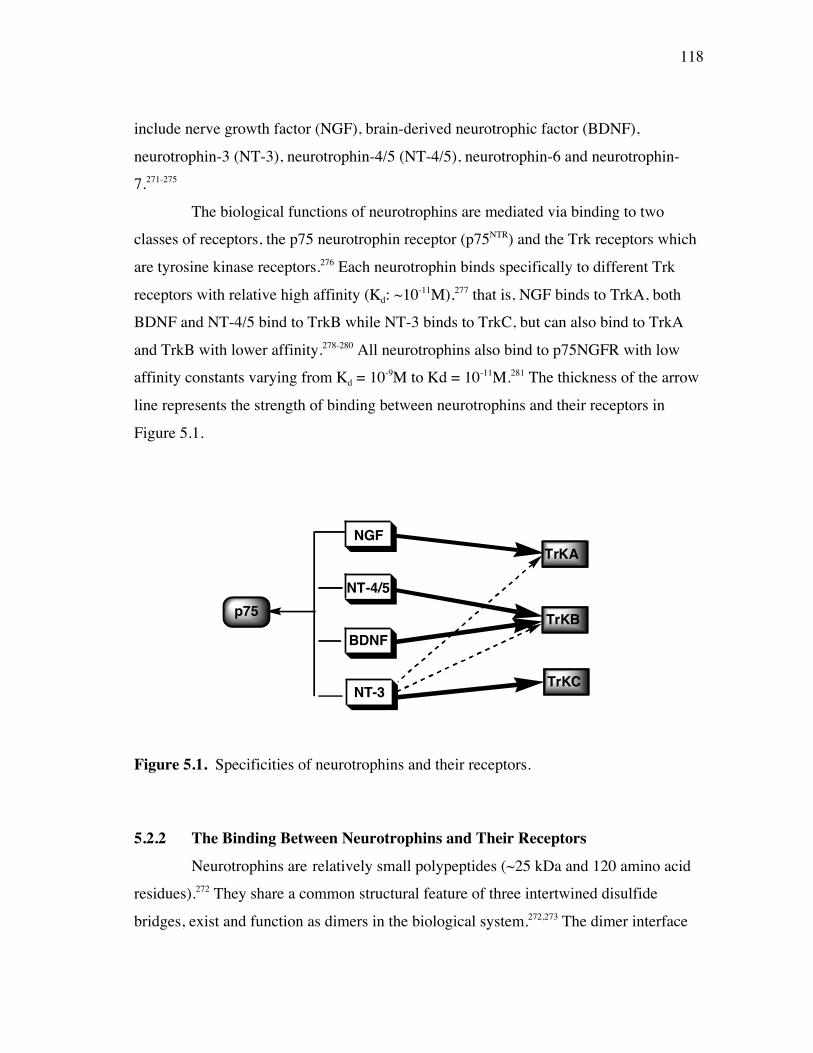


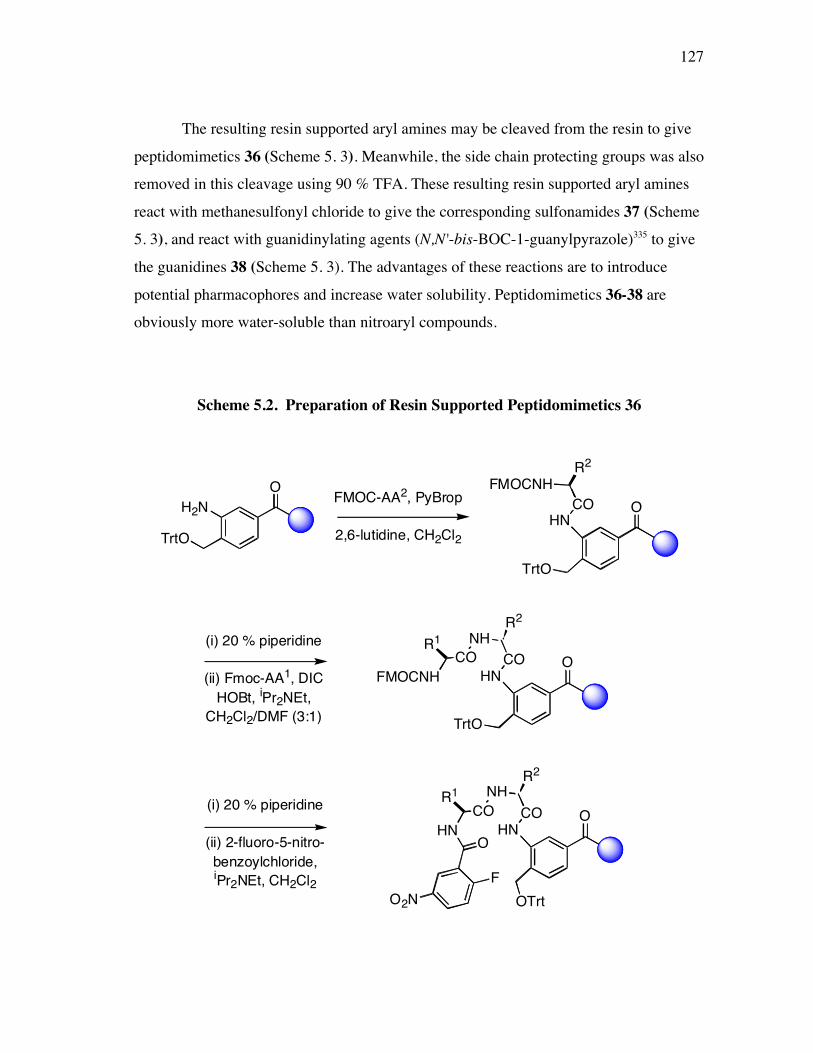


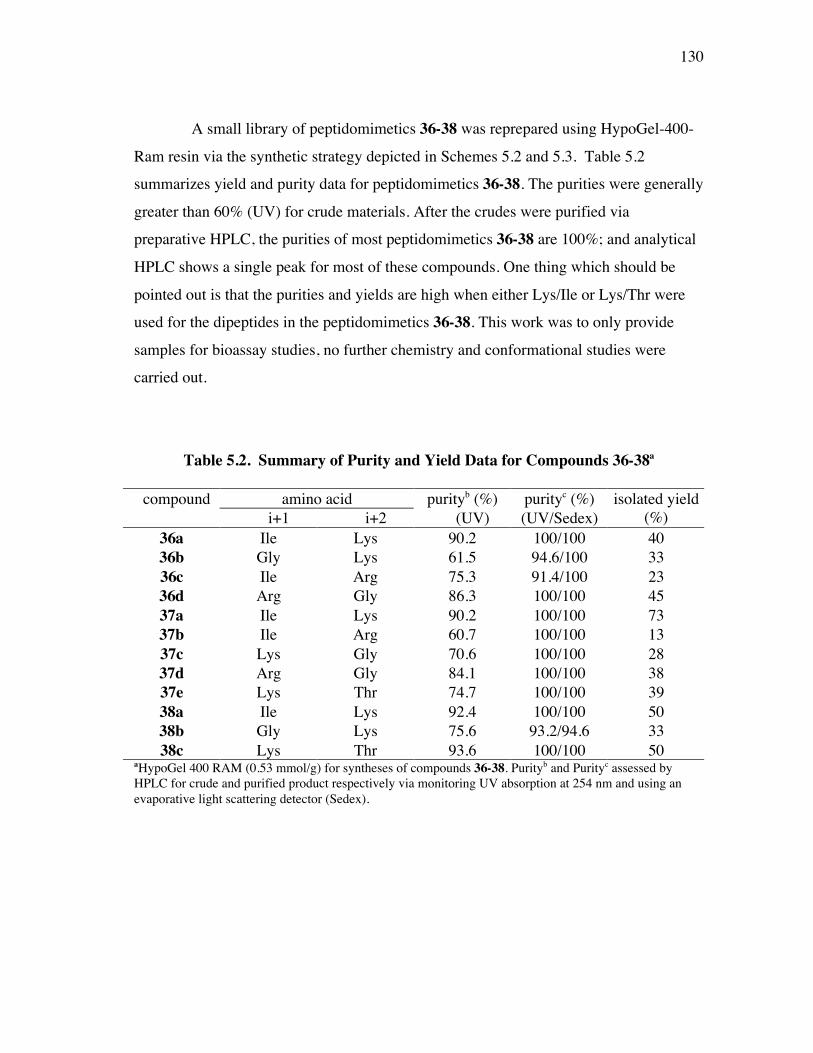


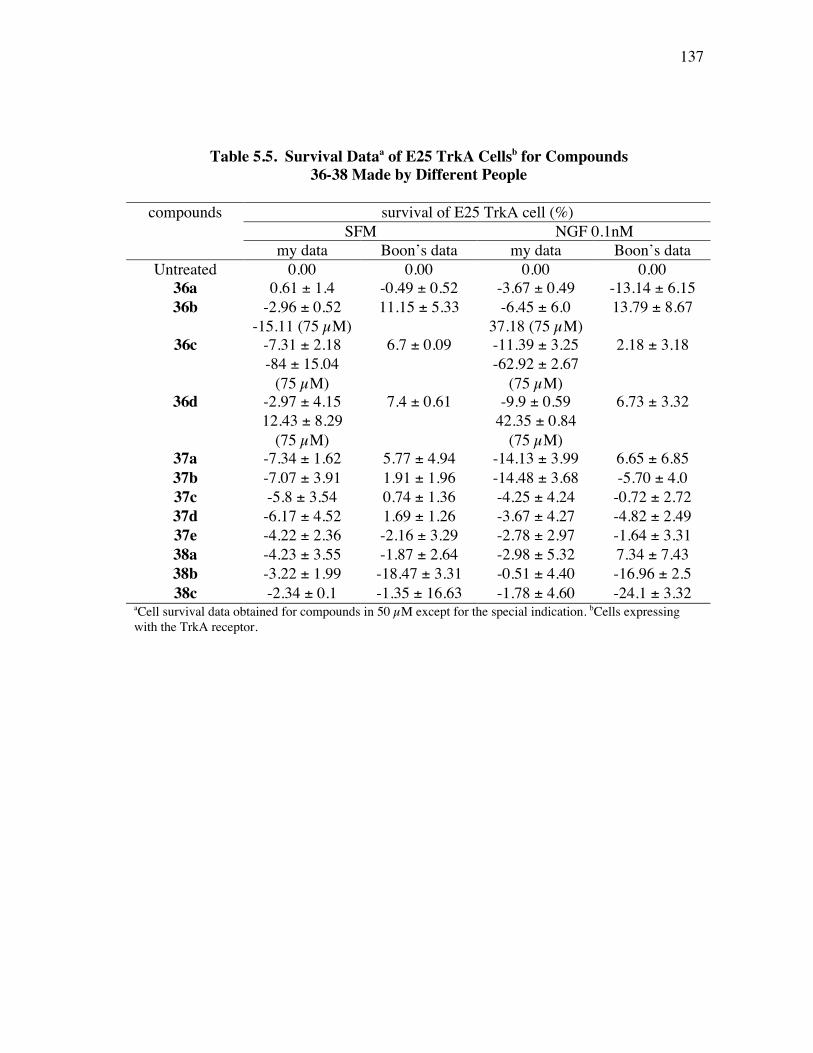

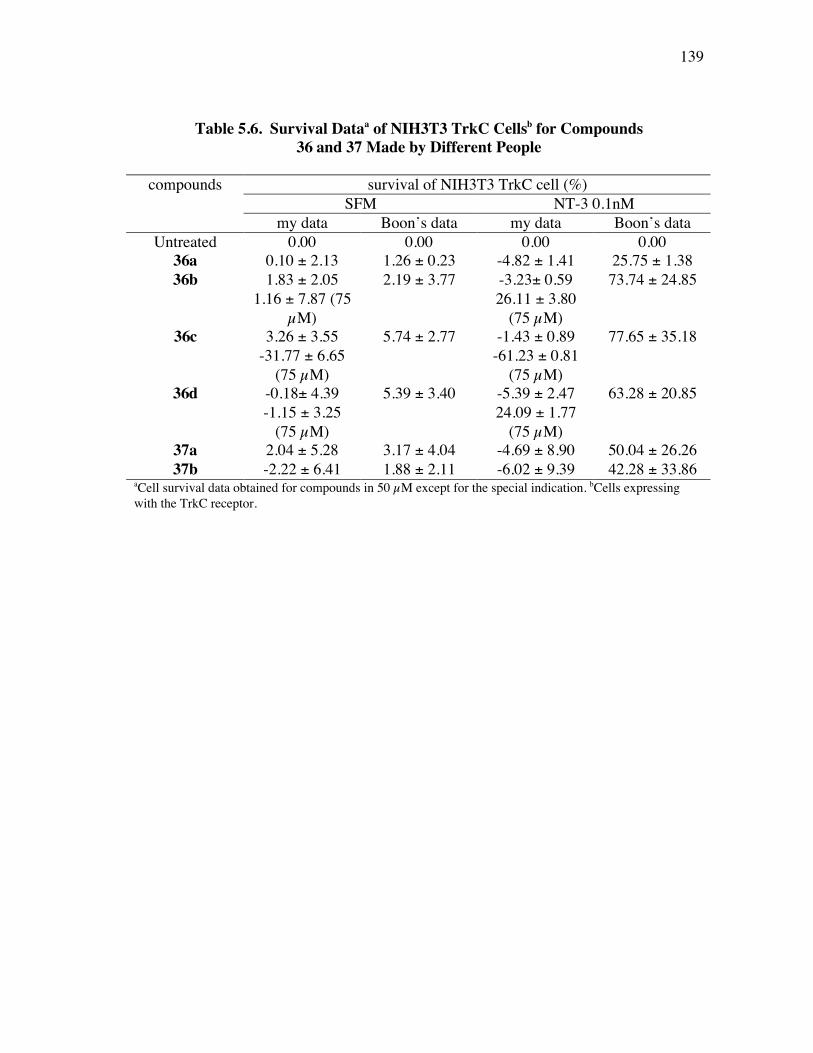
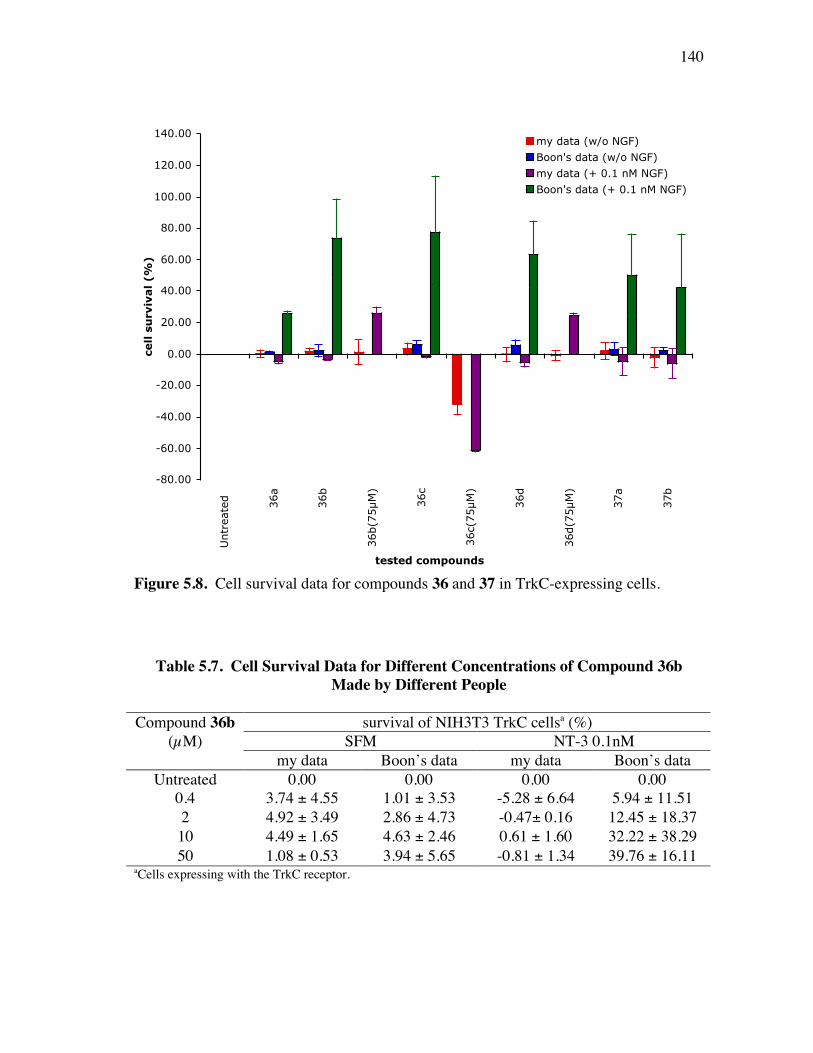
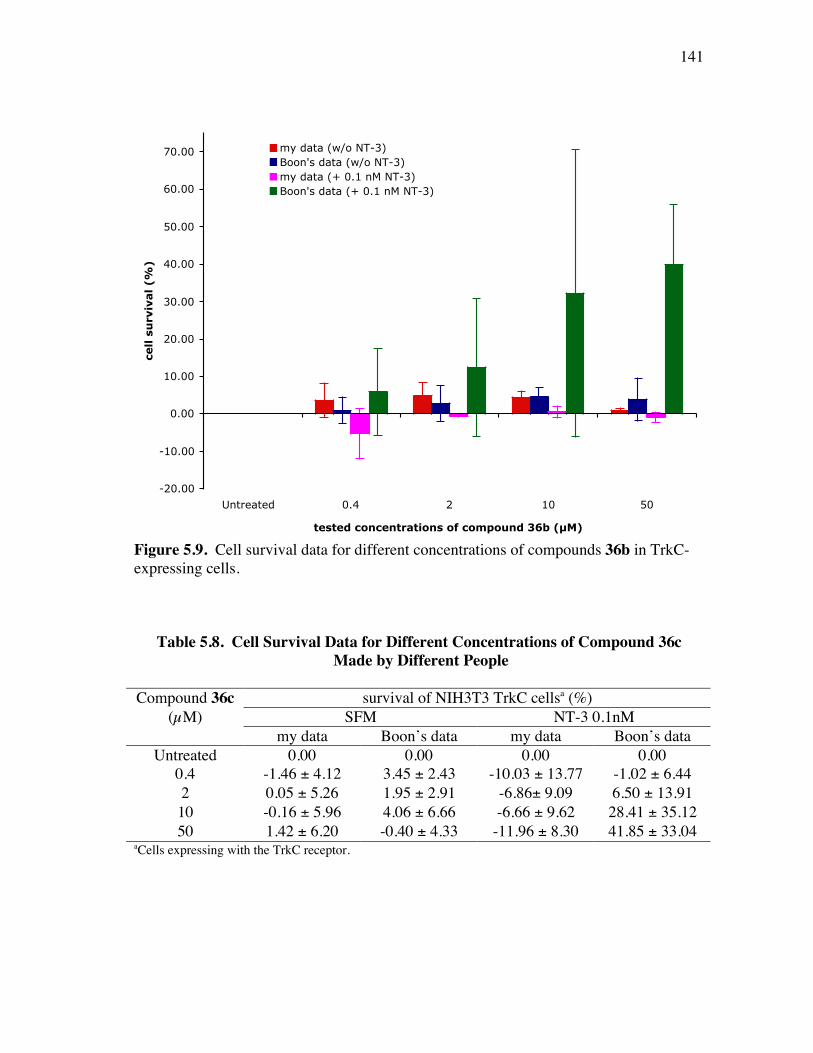


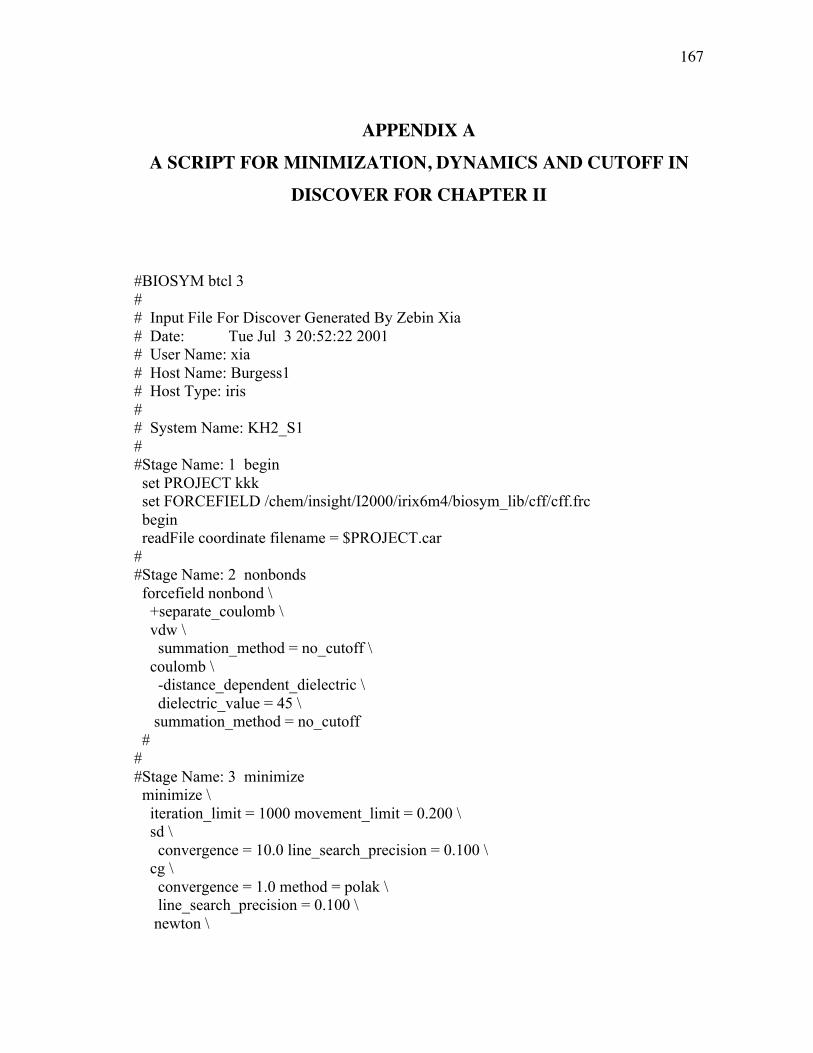


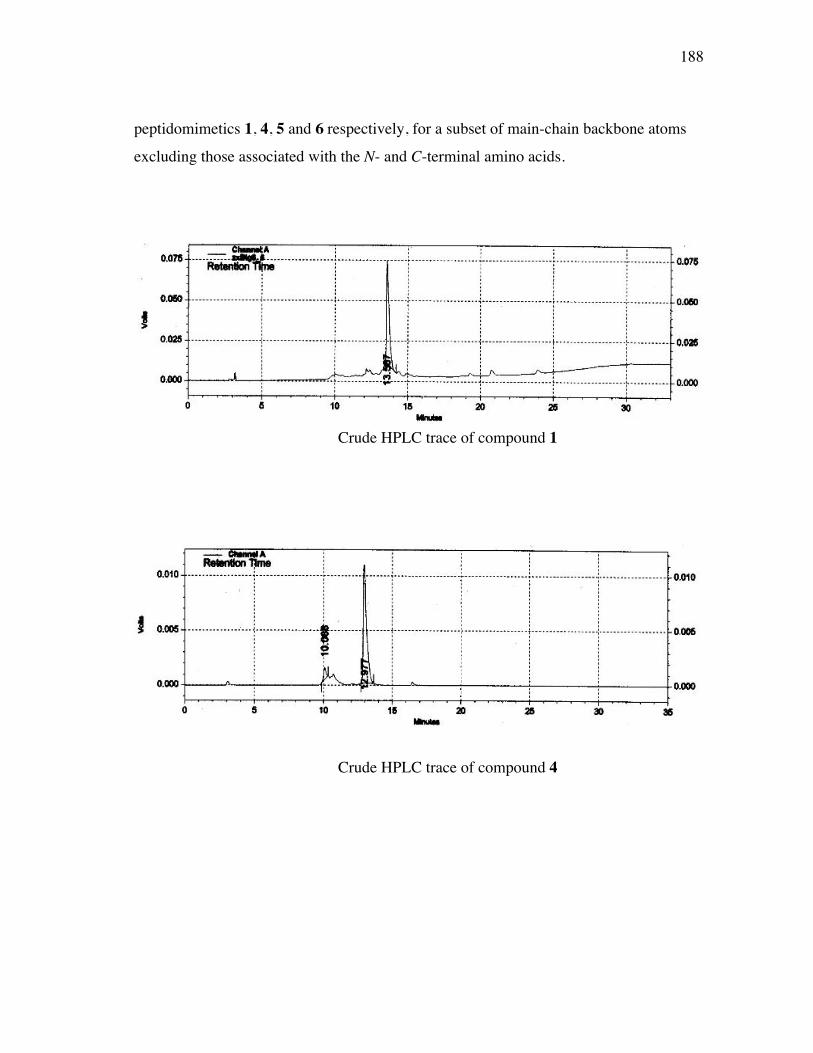


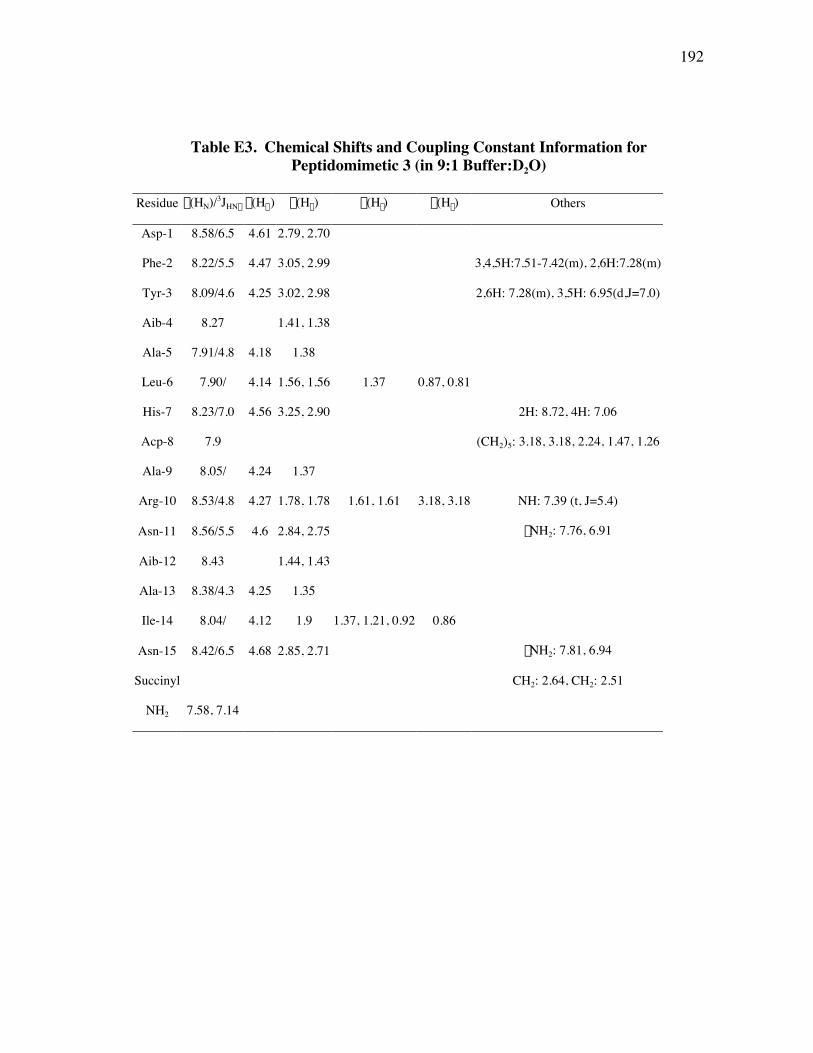


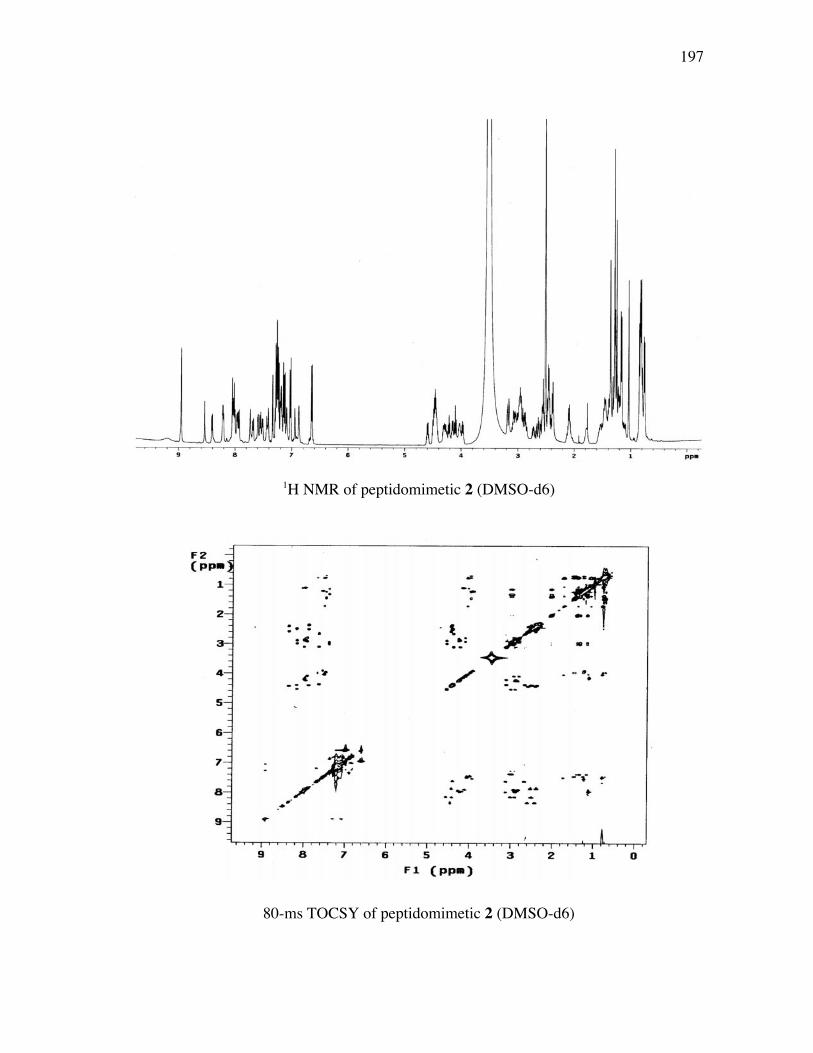

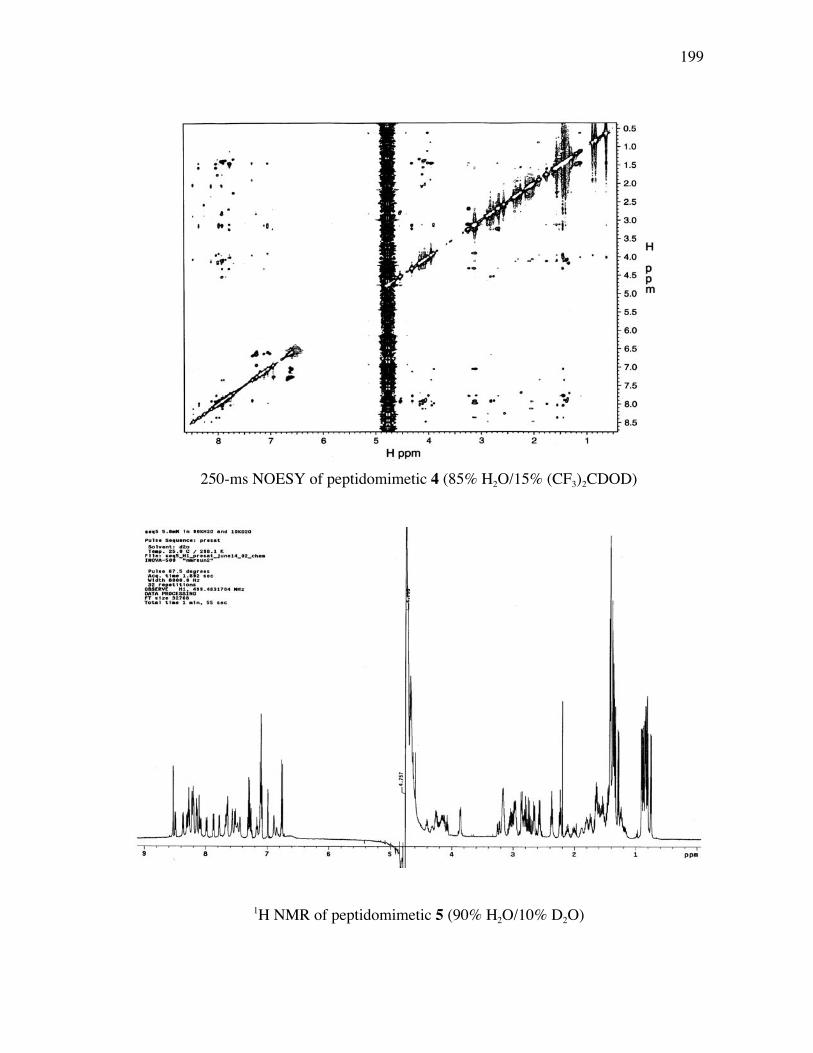


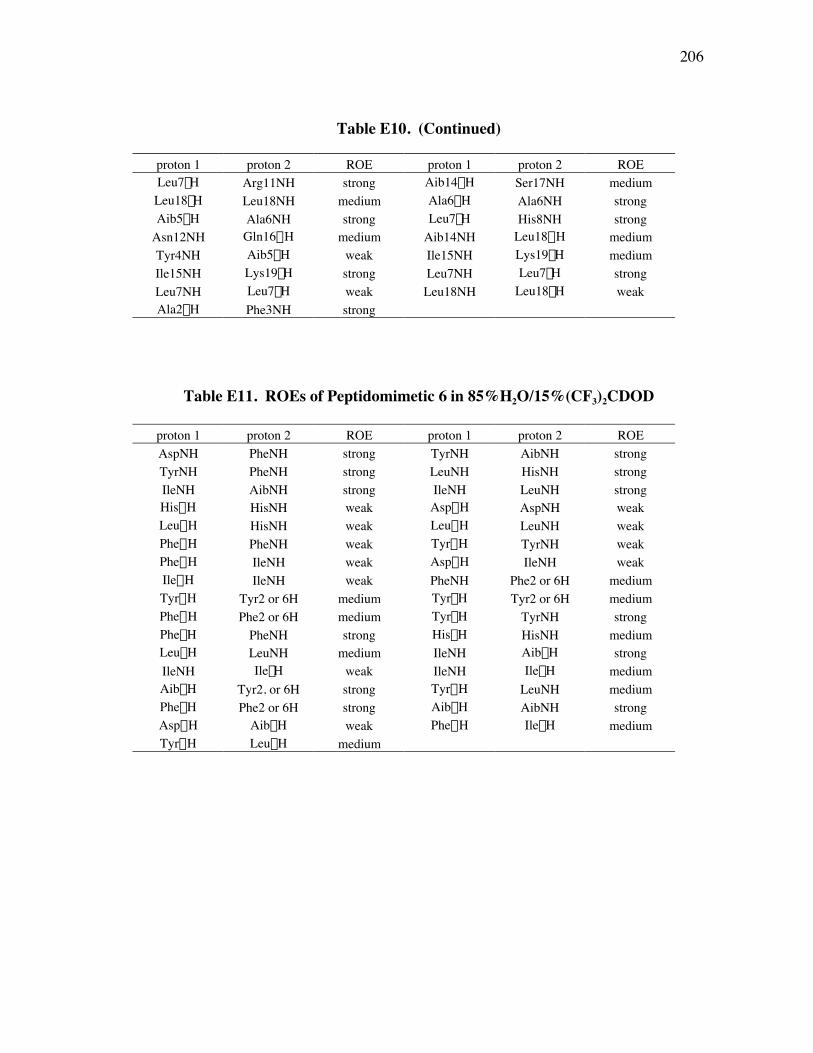


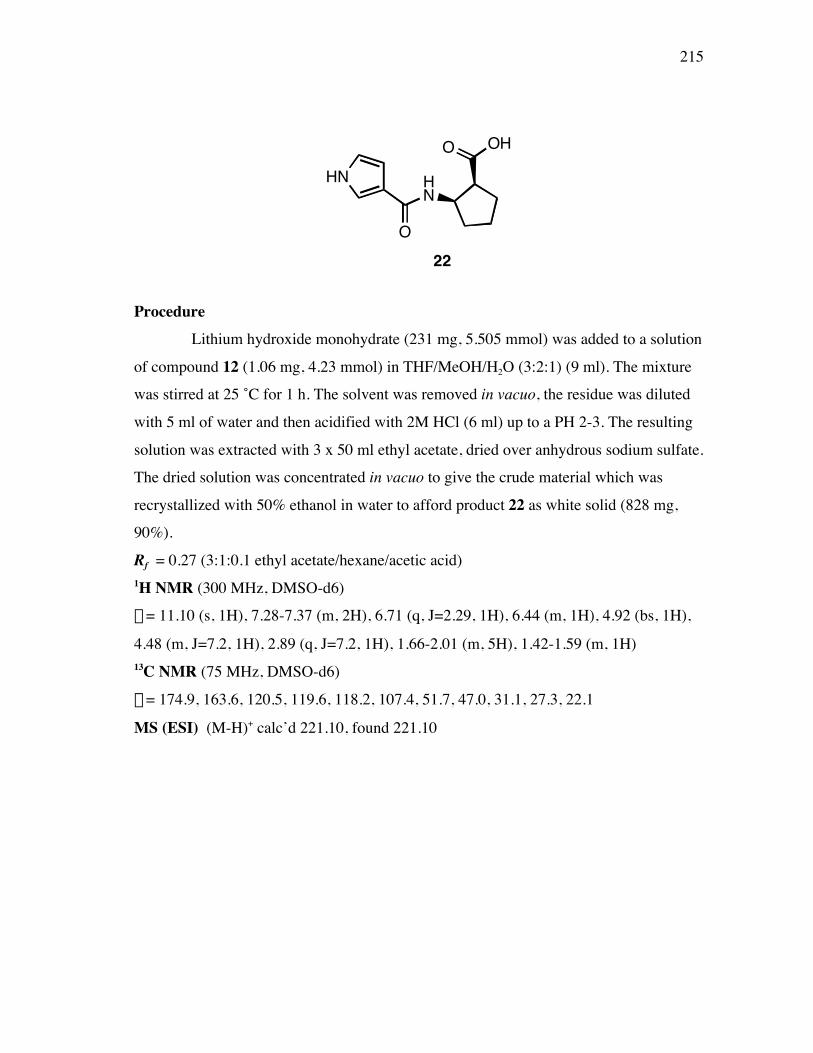


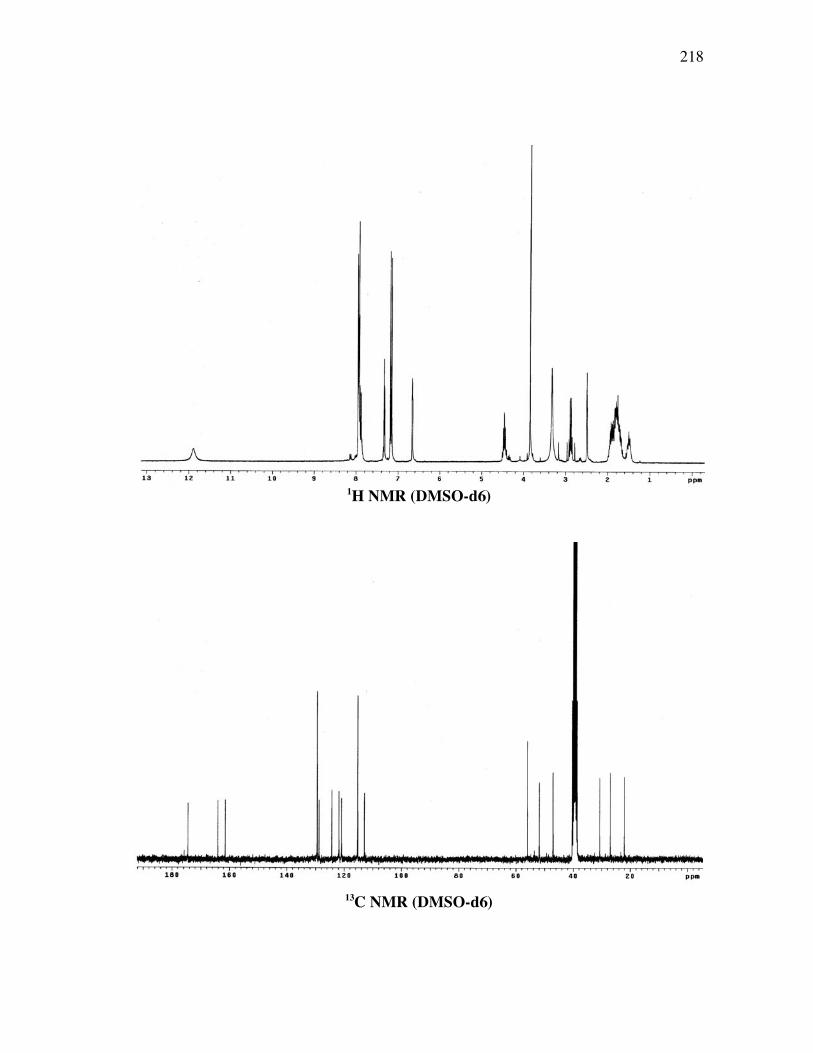

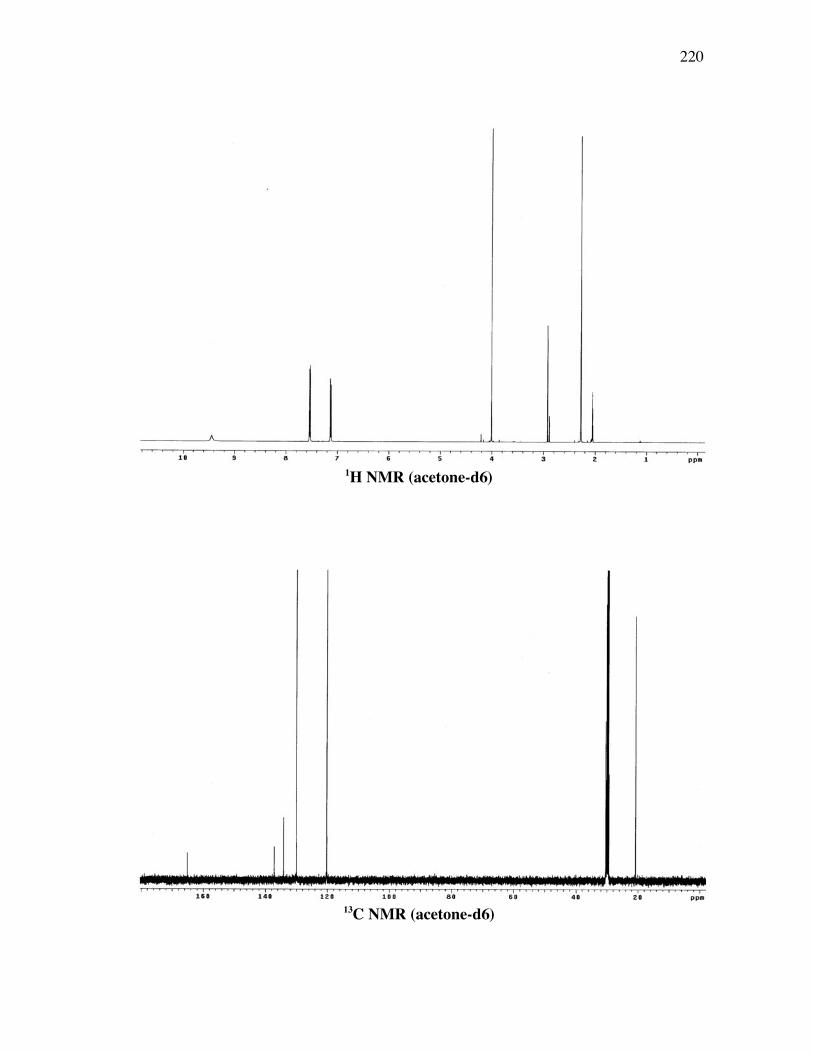


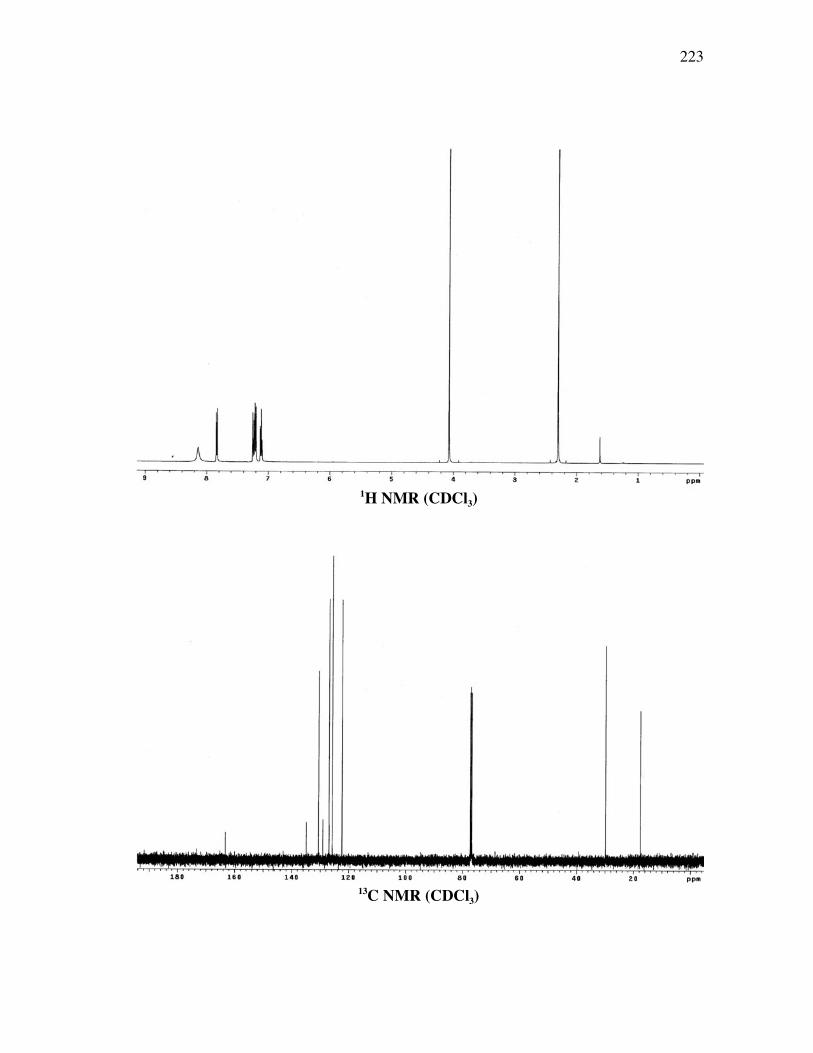


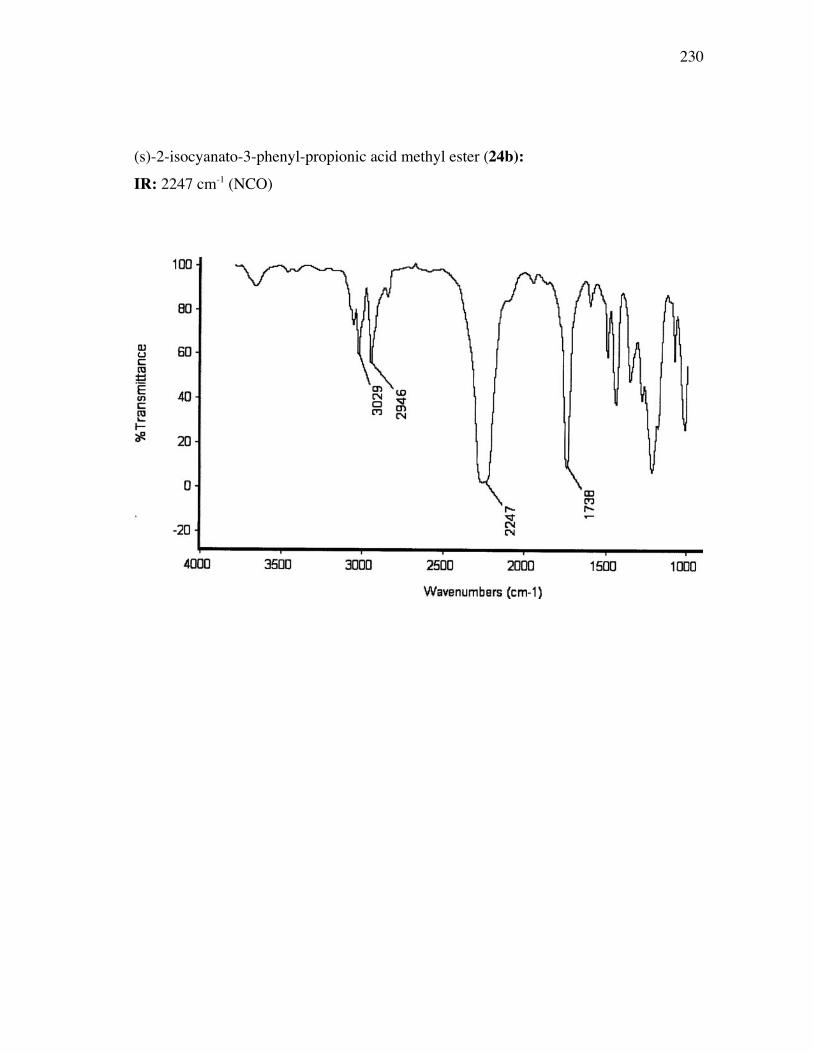


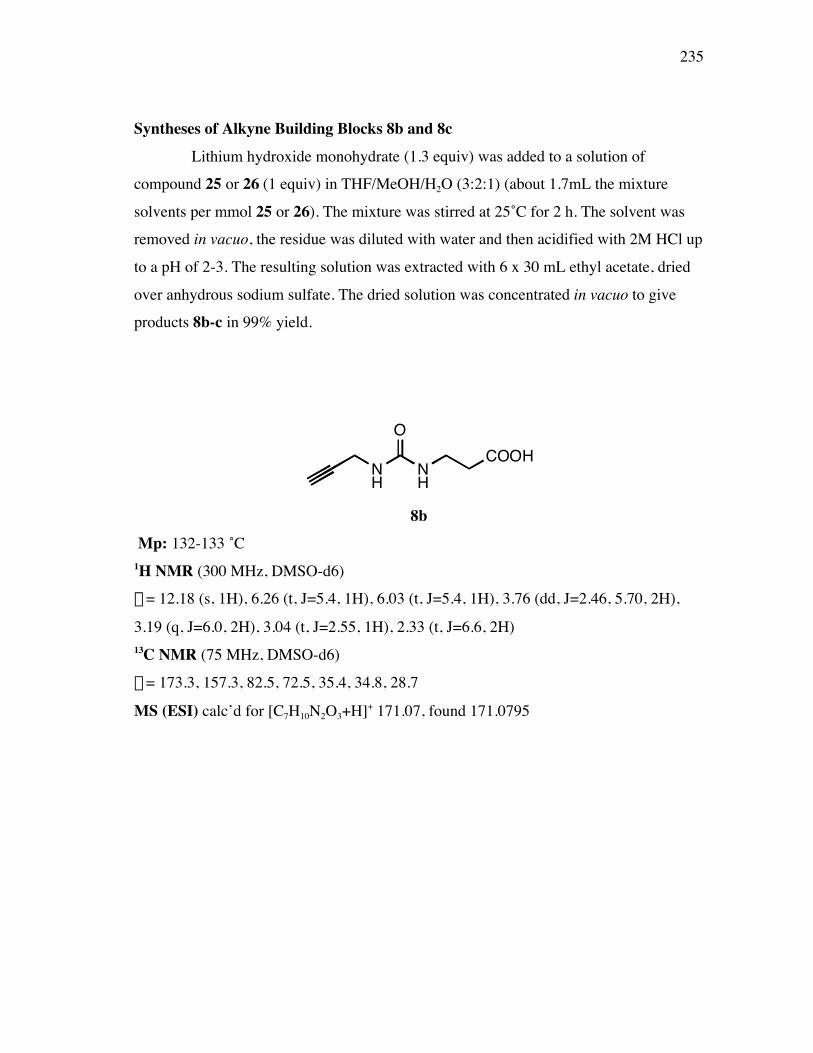


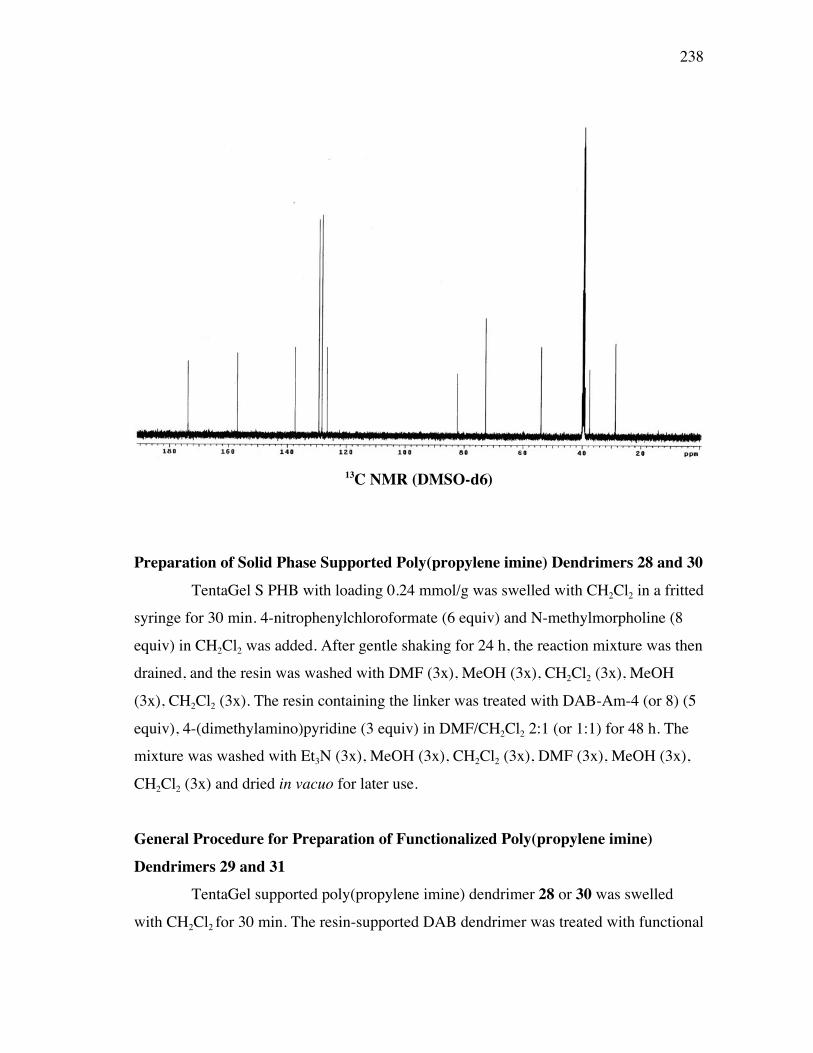


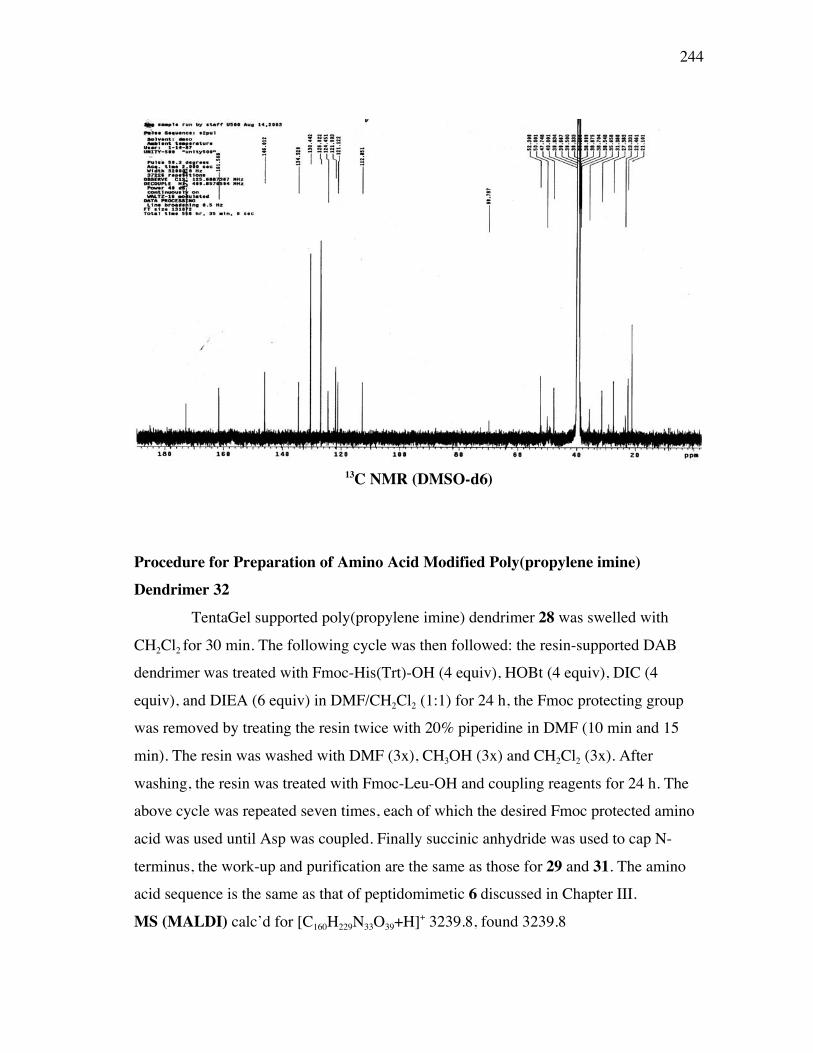


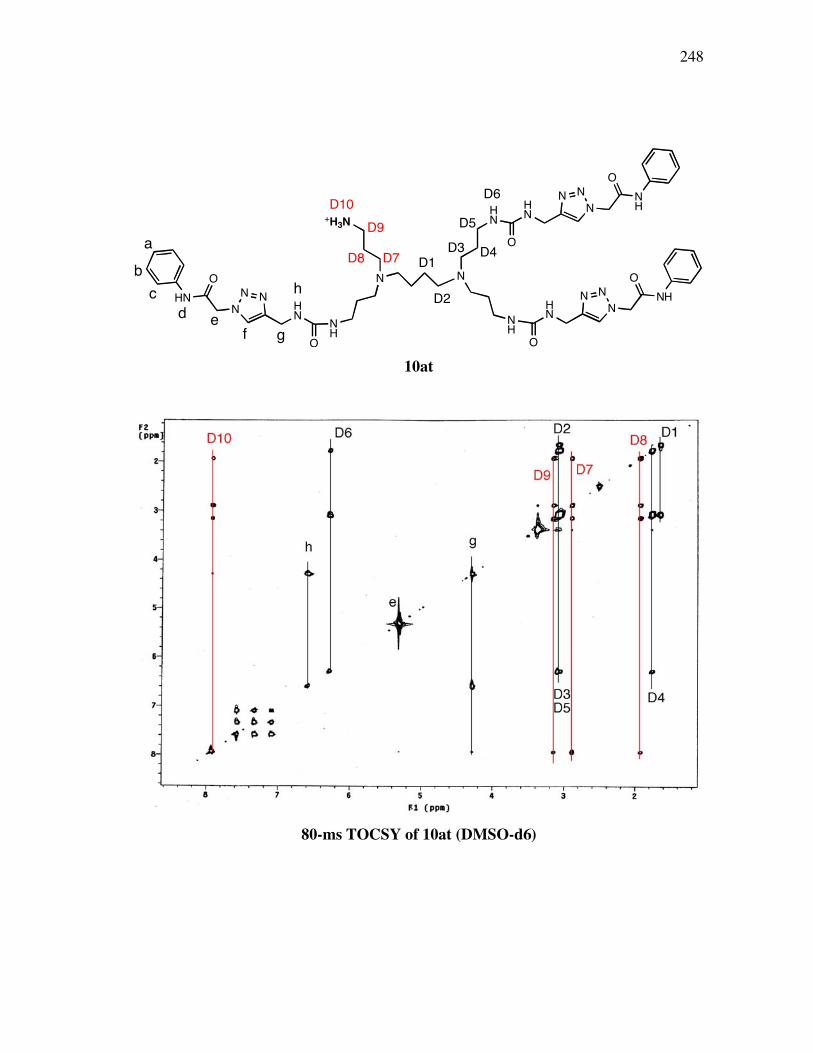


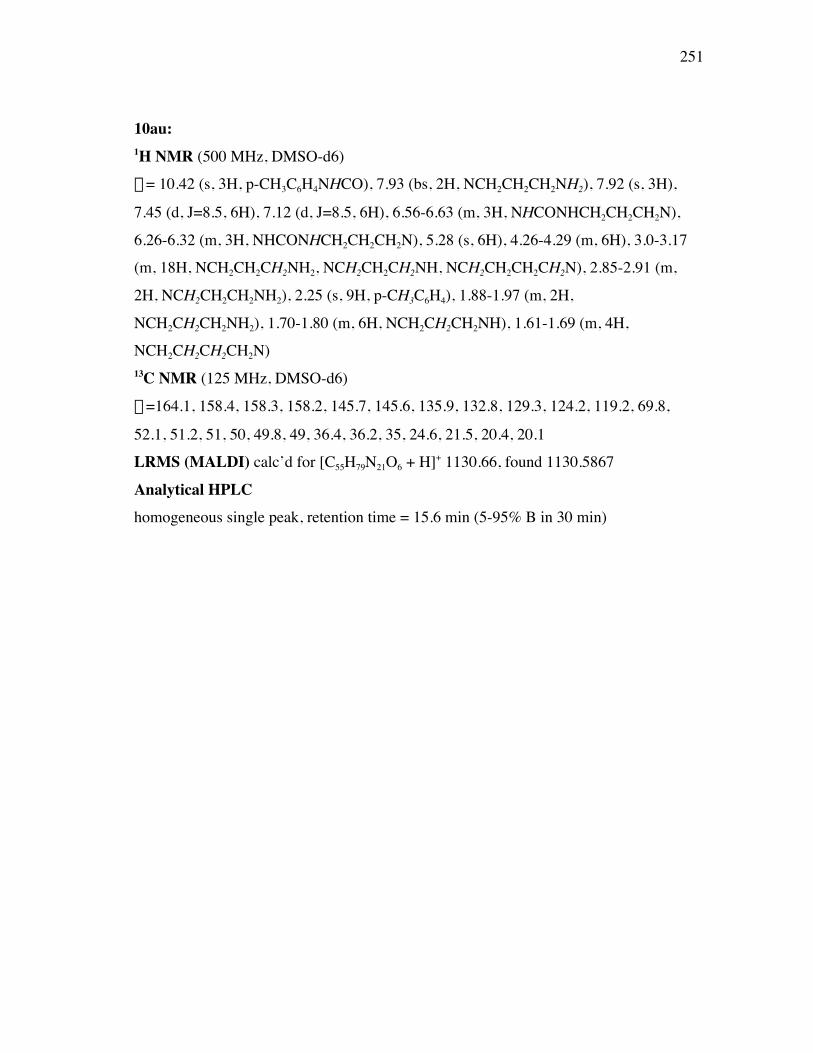


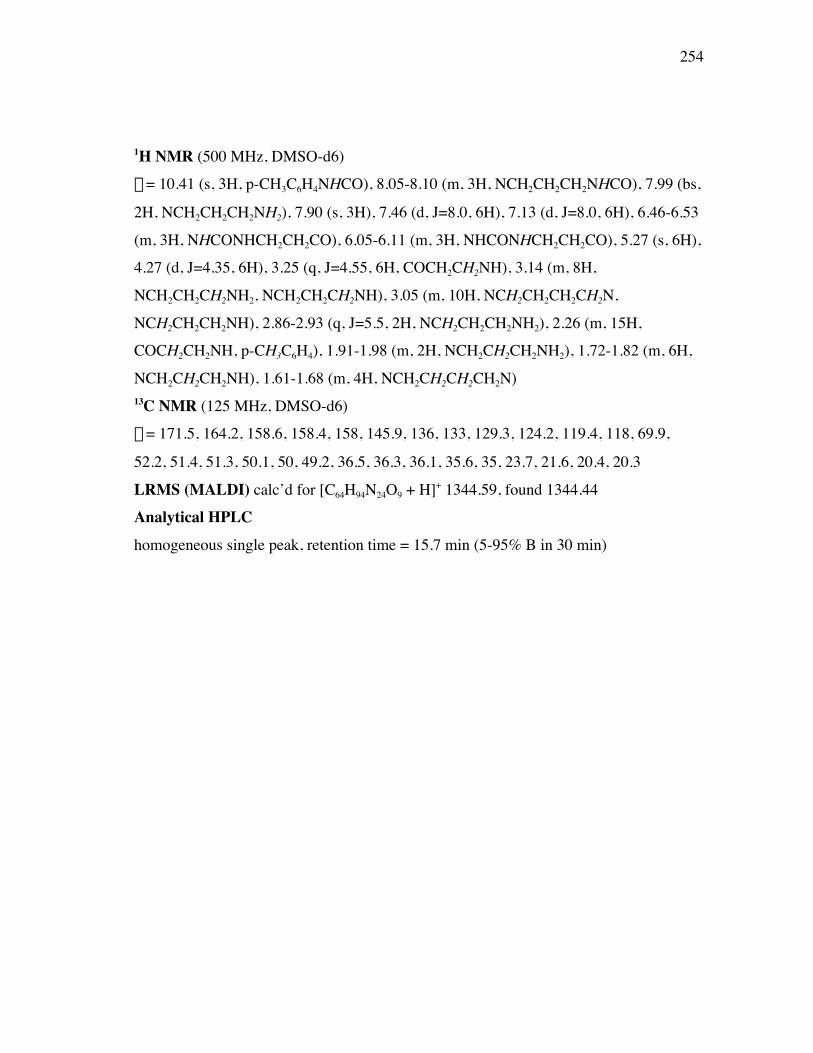
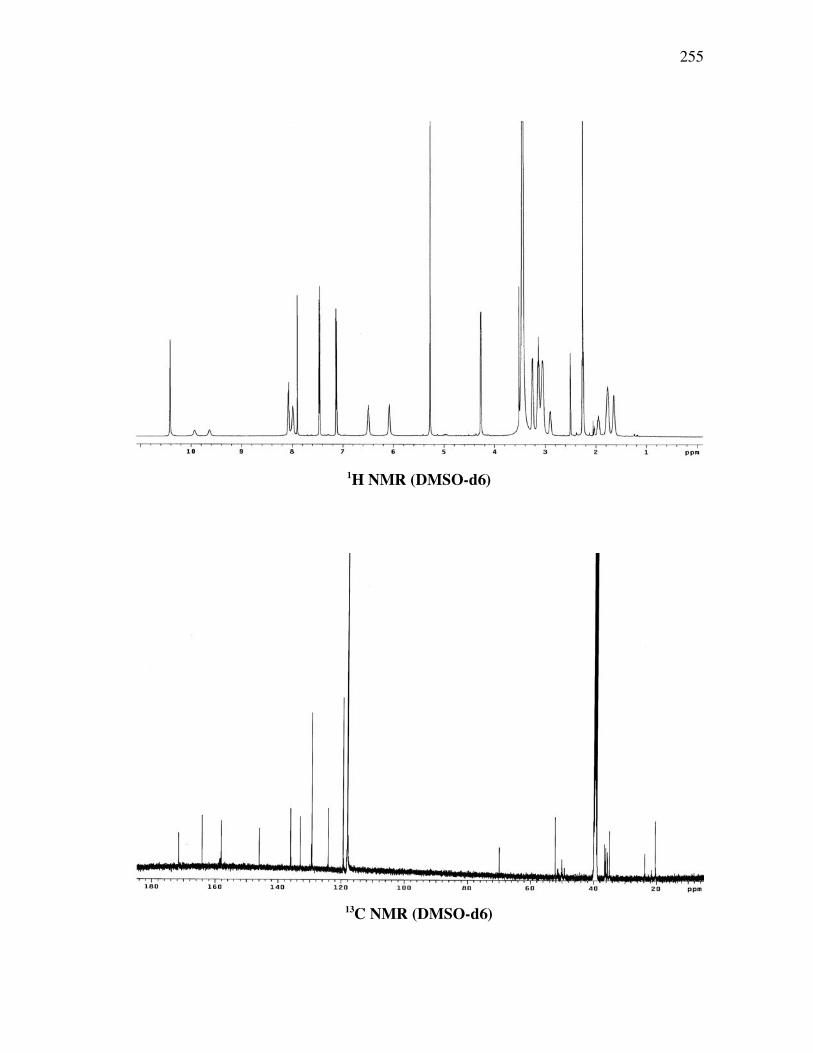


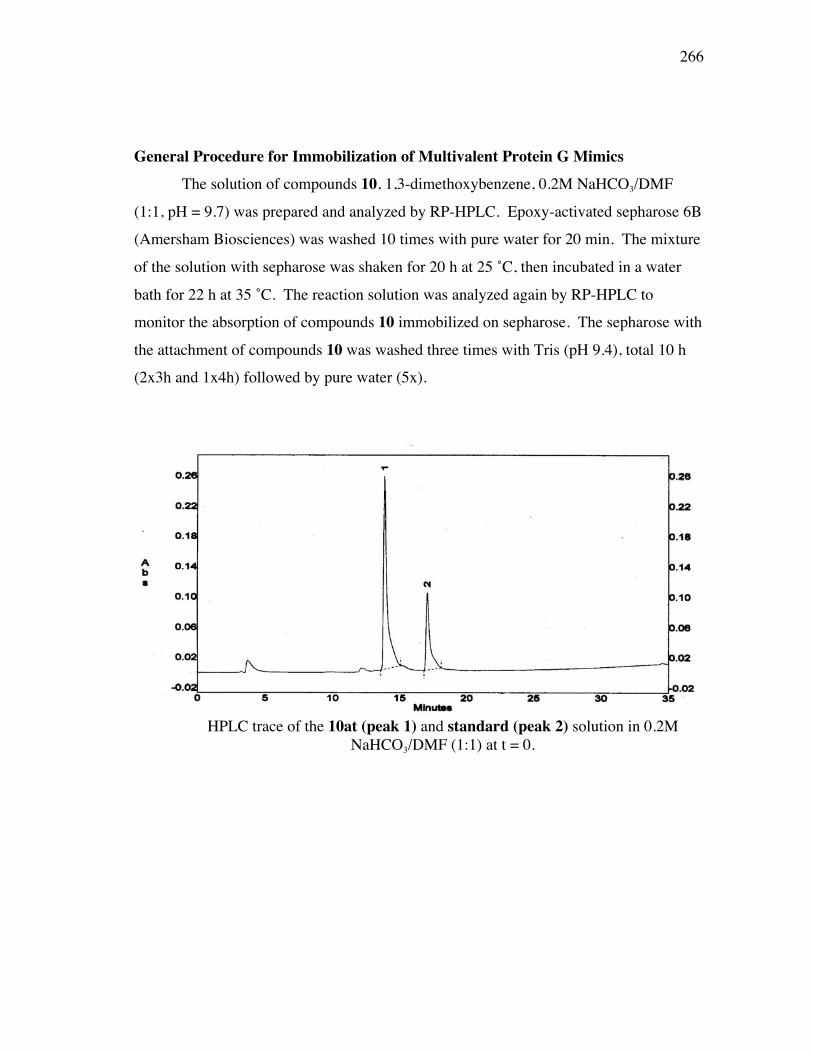


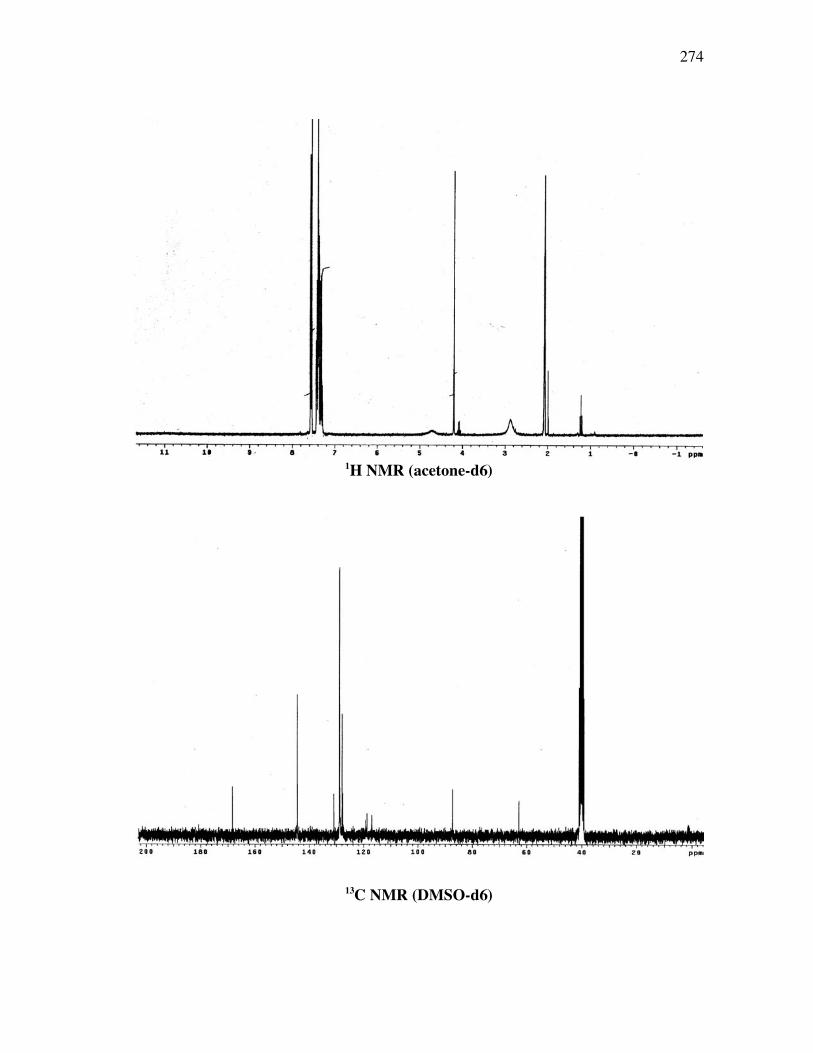


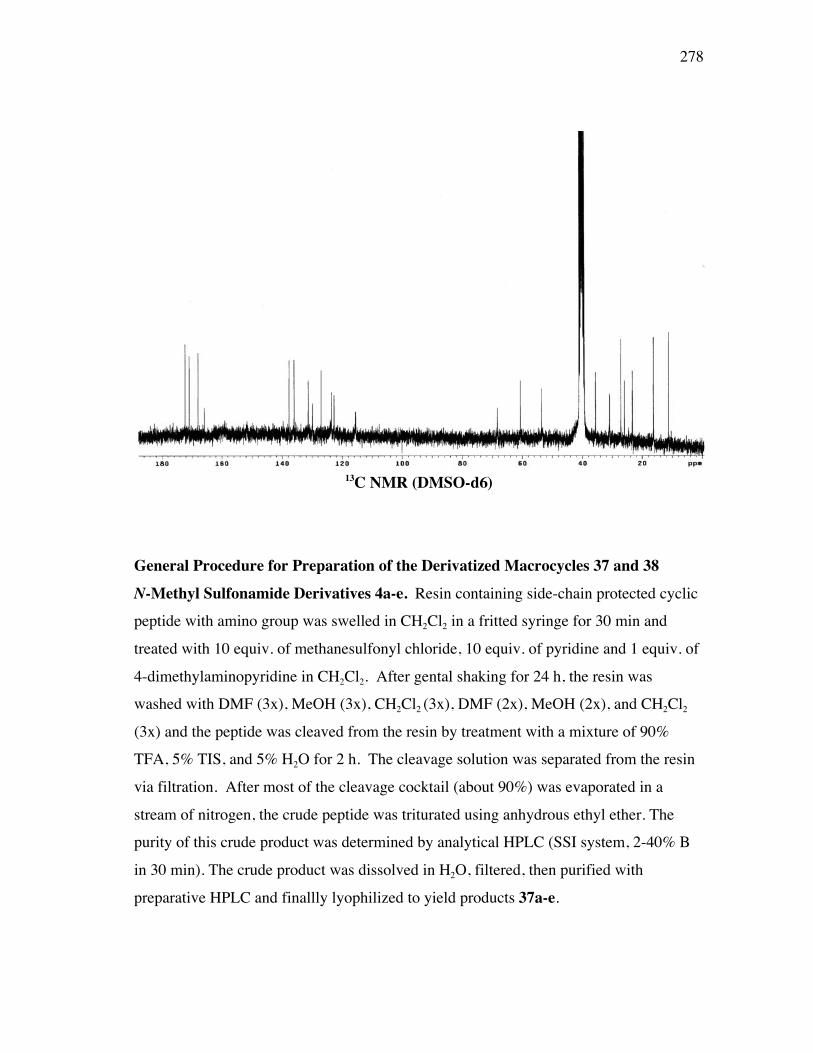


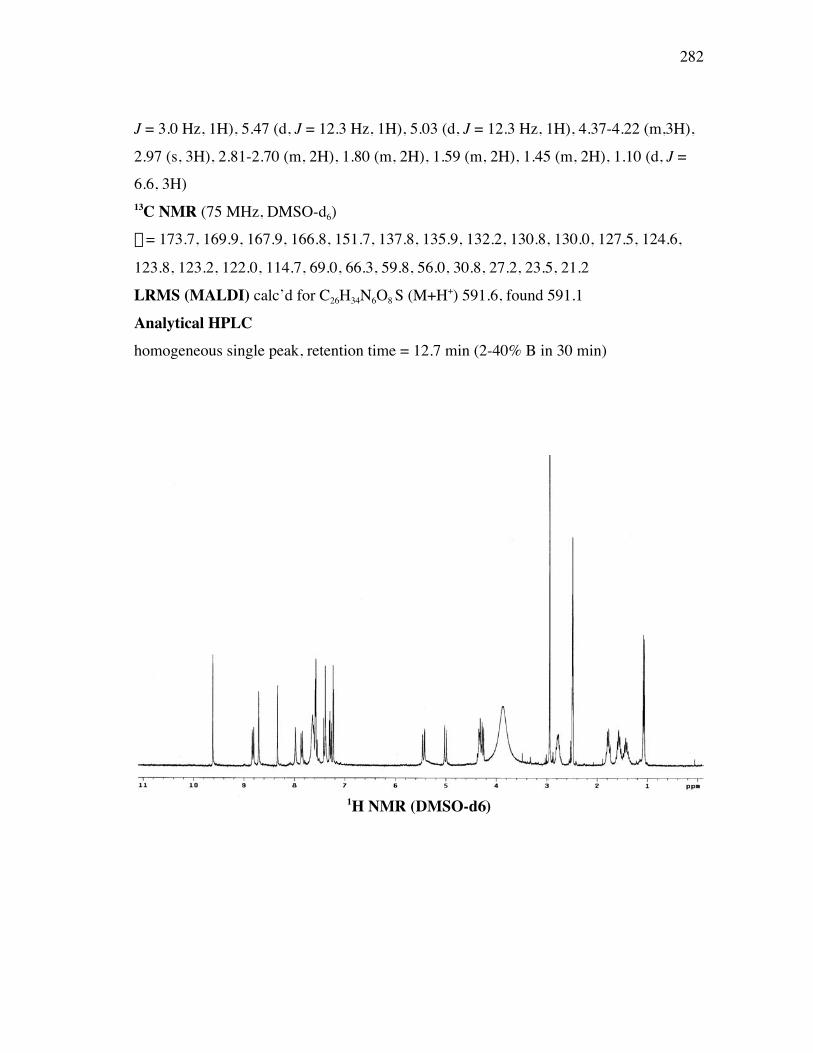

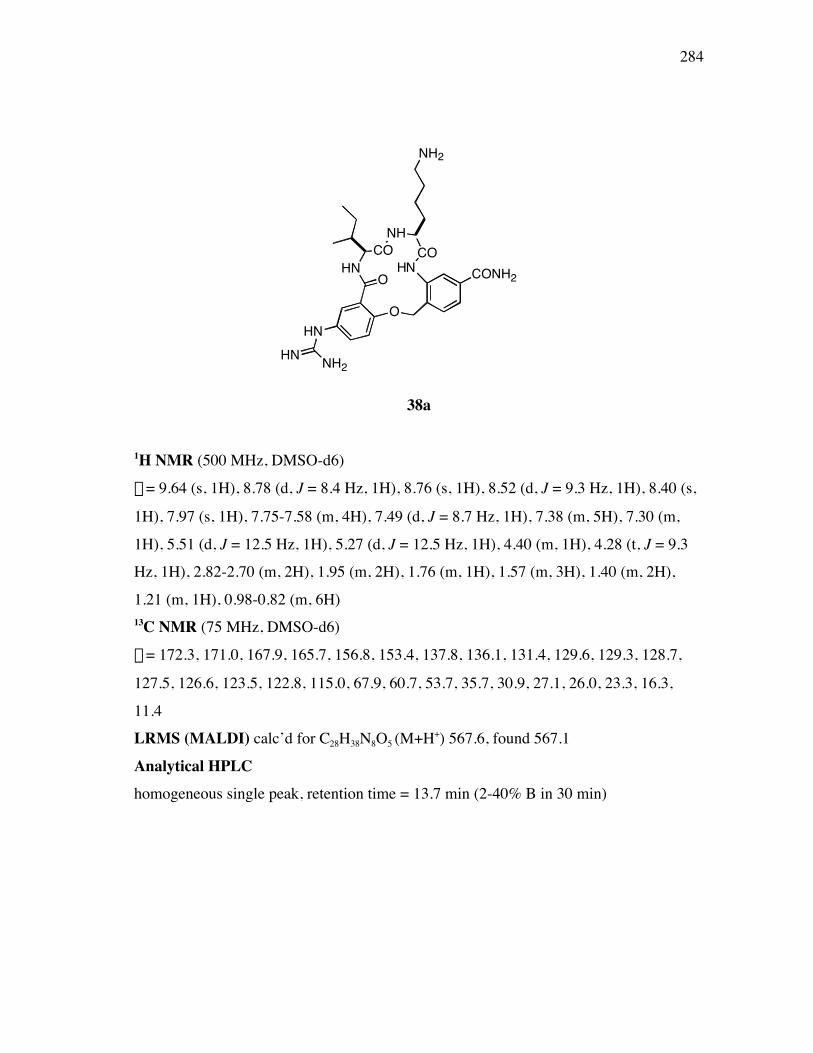


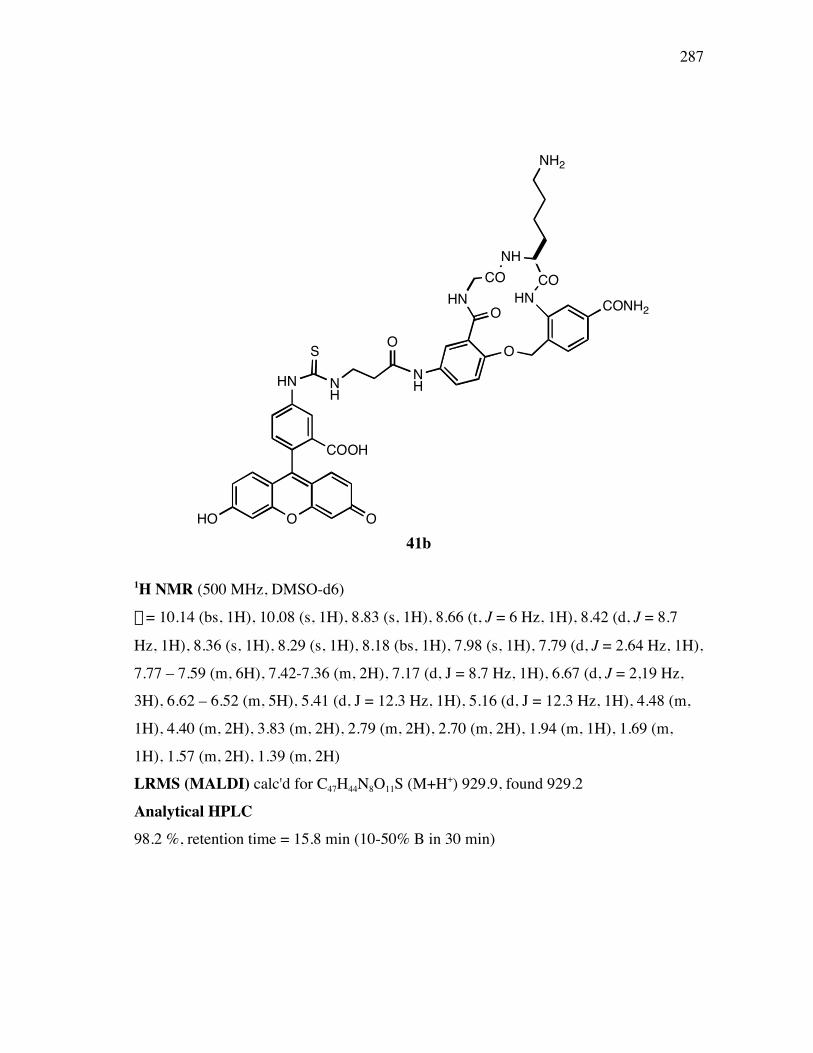


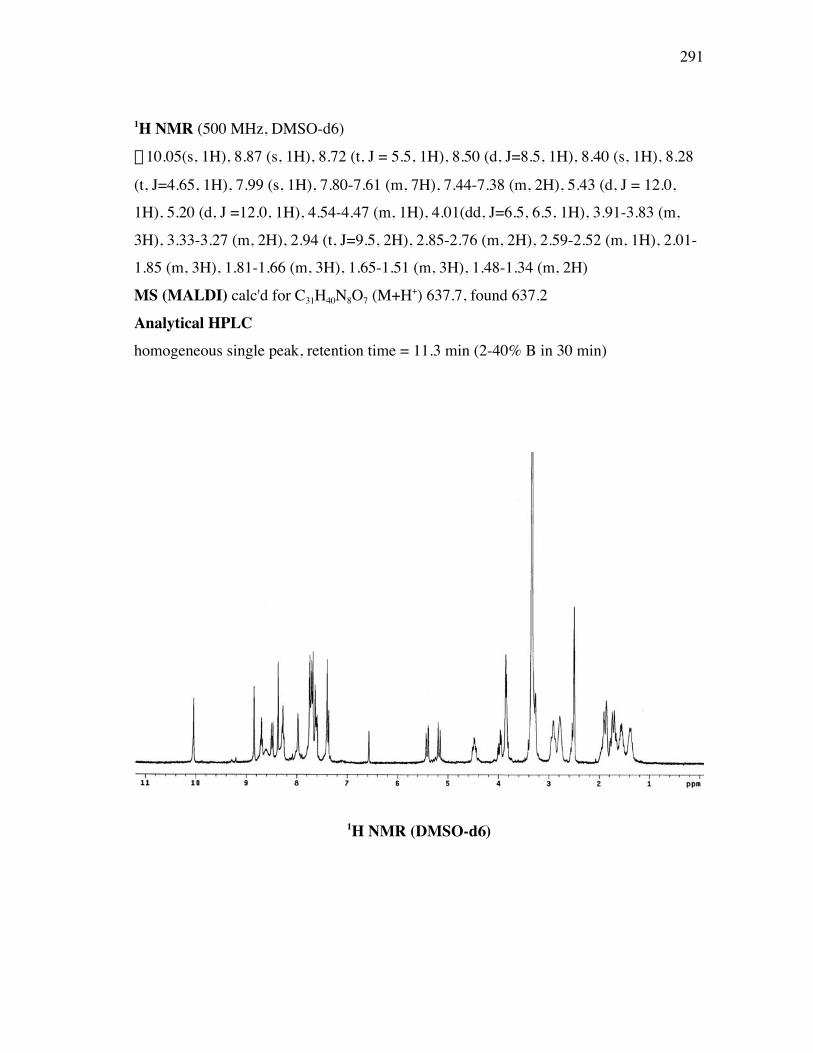

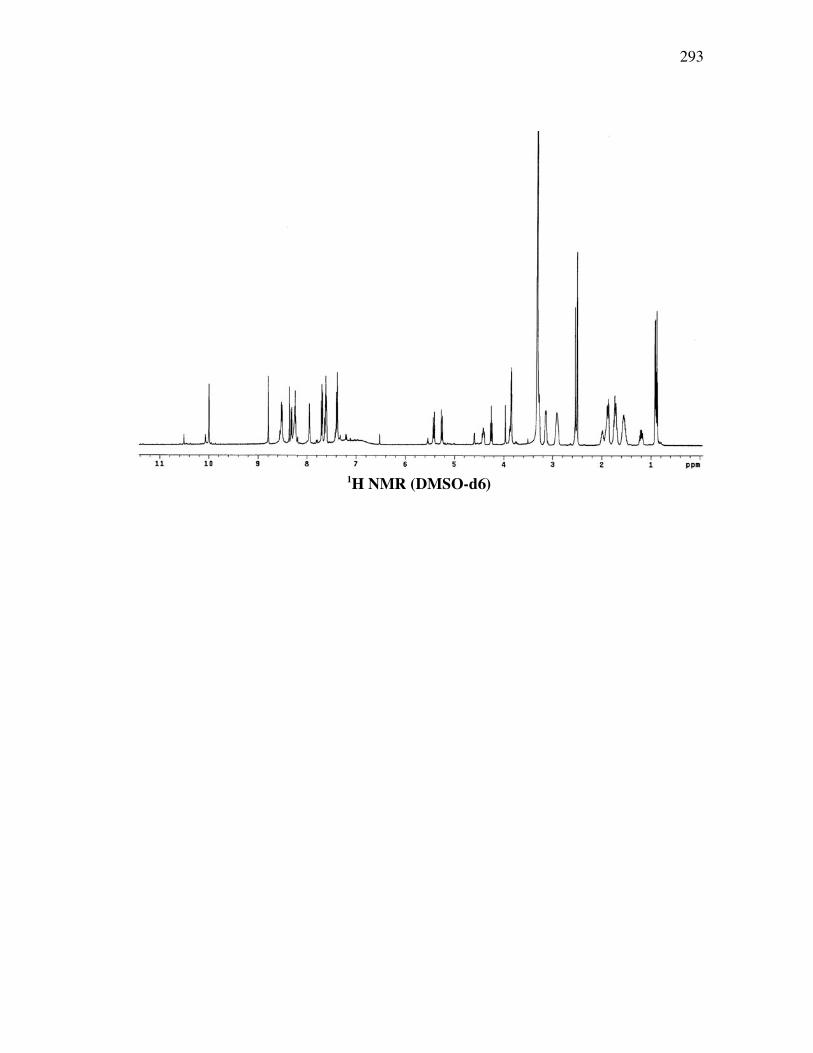


![Taqleed (Mimic) [English]](https://static.documents.pub/doc/80x56/577ce0831a28ab9e78b37d12/taqleed-mimic-english.jpg)


