Abstract According to the literature on social class analysis, both subjective andobjective dimensions should be considered, since the perception of social positioncan influence economic behaviour and choices. The aim of this paper is to investigateobjective and perceived social position inequality in six different countries from the1990s to the 2000s in order to find out whether these dimensions move together orare independent from each other. The results suggest that people perceive themselvesas more similar/dissimilar to other members of society than what income-based andother objective aspects show. In particular, considering the whole sample, evidenceof an increasing income distance between social groups is found, while we observeno increase in inequality in perceptions when controlling individual characteristics.Consequently, the dynamics of perceptions can help explain, for example, the empir-ical evidence regarding the lack of reaction to the rise of economic disparities andthe general emulative consumption behaviours associated with increasing inequalitydetected in some countries.
Keywords Inequality · Perceived social position · Social classes
According to the sociological literature, the analysis of social classes should takeinto account multiple dimensions and factors, such as income, wealth, relations ofproduction, lifestyle, education and occupation. Furthermore, many different authors(Hodge andTreiman 1968; Jackman and Jackman 1973;Wright and Singelmann 1982;Savage 2015) emphasise the role of individuals’ perceptions of their position in societyin their analysis of social classes. These sociologists argue that no study of social classcan be comprehensive enough if it does not take into account a person’s sense ofself, which may not coincide completely with objective reality and may influenceindividuals’ behaviour and choices.
By contrast, the economic literature often ignores many of these factors and optsfor analyses based on statistically measurable characteristics, such as income andconsumption. Despite the wide acceptance of the conceptualisations of class offeredby the sociological theory, in their empirical works economists tend to consider onlyrelative definitions and use the term “class” to refer to specific strata of the incomedistribution. This practice raises issues concerning the lack of both sound theoreticalassumptions and stable criteria to define and operationalise the theoretical concept of“class” and in particular the “middle class”. For example, comparing the results fromdifferent empirical studies can be difficult when the definition of the classes dependson the whole sample considered.
Despite these methodological issues, evidence from many studies lets us evaluatethe role of specific elements representing the “real” socio-economic aspects of indi-viduals’ life, while the role of perception is often neglected. In particular, these studiesdemonstrate that the evolution of living standards of different groups across societycan depend on real income growth over time, wealth and debts to finance consump-tion (Atkinson and Brandolini 2013), insecurity and vulnerability in income due togreater risks of unemployment and volatility in earnings (Torche and López-Calva2013; Krugman 2014; Ricci 2016).
The channels through which these aspects may have effects on individuals’ choicesare difficult to disentangle, and the purpose of this paper is not to go into this issue.In fact, the starting point of this study is the consideration that social class can beunderstood as both a subjective and an objective (at least in economic terms) phenom-enon. Furthermore, this paper aims to analyze how these two dimensions evolve. Inparticular, we are interested in analysing whether changes in the degree of inequalitywithin specific groups in terms of objective data are associated with similar changesin the perceptions of the members of the same groups by controlling variations inindividual characteristics. The hypothesis is that people could perceive to be similarto (different from) other members of their group when objective socio-economic datashow an increasing (decreasing) distance among them.
The empirical analysis refers to the changes that occurred in income distribution,socio-economic characteristics and subjective perception of social position withinsociety in six different countries:Germany, Italy, Poland,Norway, theUnitedKingdomand theUnited States. First, we analyse how the income distribution has evolved duringthe period 1994–2010on the basis of objective reality, by exploring income inequalitiesacross the whole population and considering different population subgroups. To this
123
Perceived Social Position and Objective Inequality: Do They… 283
aim we use the comparative distributional data sources available in the LuxembourgIncomeStudy. Then self perceptions are introduced, by analysing the changes occurredin subjective perceptions of social position and their determinants. The analysis aimsat finding out whether these changes are due to a variation in individual characteristicsor other unobservable factors.
The reported values of people’s social self perception from the International SocialSurvey Program (ISSP) are considered to investigate the main drivers of the inequalityin 1992 and 2009. The purpose of this analysis is to evaluate the different impact ofcovariates on people’s social perception. The analysis also aims to find out to whatextent the shape of the distribution of people into different classes depends on specificindividual features. The interaction between people’s perception and objective data ontheir socio-economic characteristics will permit to make some considerations on therole of perception in people’s real behaviour and choices.
The paper is organised as follows. In the next section a review of the literatureon perception of people’s position in society and its determinants is provided. InSect. 3, data and methodological choices are briefly presented. Then, empirical resultsare discussed (Sect. 4). Finally, Sect. 5 draws some conclusions on the relationshipbetween subjective perceptions of personal position in society and measured objectiveinequality.
2 Self Perceived Social Position and Objective Reality: A Reviewof the Literature
The importance of the perceptions of individuals of their position in society has beenemphasised by different studies, in particular in social classes’ analysis. Accordingto sociologists Hodge and Treiman (1968), Jackman and Jackman (1973), Wrightand Singelmann (1982), Savage (2015), a comprehensive analysis of social class hasto include the person’s sense of self, as it may be different from objective reality butdefinitely affecting behaviour and choices. Similarly, Akerlof andKranton (2000) con-sidered how identity affects economic outcomes. They incorporated the psychologyand sociology of identity into an economic model of behaviour. Furthermore, otherauthors (North 1990; Rizzello 2000), following Hayek’s intuitions, took the view thatknowledge is the fruit of an “endogenous construction” and that perception repre-sents the source of the unpredictability of behaviour and the cornerstone of economicchange.
The match between perception and reality can depend on many different elementsacross societies over time. Considering self perceived social position as the variablethat indicates people’s own opinions of their location in society, many authors inves-tigate the main drivers of the perceived position in society and the consequences onpeople’s values and attitudes.
From a theoretical point of view, Marx identified the relations of production asthe most influential factor of the individuals’ perception of the exterior world. So,as pointed out by Evans and Kelley (2004), there is a clear connection between theobjective conditions of production in a capitalist society and the workers’ conscious-ness of their position across the social scale (e.g. Marx 1844; Marx and Engels 1968,
123
284 C. A. Ricci
p. 37). Similarly, objective circumstances are relevant into subjective perceptions in theDurkheim’s approach to the study of society (1933, pp. 187–190, 256–263). However,Marx and Durkheim had different theories about the possible evolution of objectivecircumstances over time and, consequentially, of reflection on individuals’ self per-ception.
Some empirical analyses examined the relations between a number of factors, onboth a micro and macro level, and people’s own opinions of their location in society.One of the first studies was conducted by Hodge and Treiman 1968 who investigatedthe impact of different socioeconomic characteristics on the subjective social posi-tion declared. Their results suggested that education, main earner’s occupation, andfamily income are very influential on class identification but they also demonstratedthat patterns of acquaintance and kinship between various status groups influence theposition declared. According to this evidence, the two authors criticised the interesttheory of classes in sociology because this latter neglects the great range of between-class contacts and exaggerates the role of economic position in the formation ofclass consciousness. Vanneman and Pampel (1977) observed the relationship betweenoccupation and class self-identification. Their study concluded that people perceivethemselves as “working class” or “middle class” according to a manual-non manualworking dichotomy rather than to a continuous prestige scale. This result contributedto reorient the sociological debate between continuous and discontinuous models ofthe stratification system in favor of the latter. More recently, Yamaguchi and Wang(2002) considered the interplay between class identification and family/gender, test-ing the relationship between married women’s class identifications and their objectiveclass situations in the United States. What emerges is that class identification dependsequally on the spouses’ income but only the husband’s occupational prestige affectssubjective social class. Furthermore, men and women assign a different role to edu-cation when they assess the subjectively identified class.
The work of Evans and Kelley (2004) investigated subjective social status usingdata from surveys collected from representative national samples in 21 countries. Theauthors found that in all societies there is a pronounced tendency to see oneself asbeing in the middle, and this tendency holds in rich nations as well as in poor ones.The economic condition of individuals, the wealth of nations, and the national levelof unemployment all have substantial effects on subjective status, but their effects aremuted by the tendency to see oneself as being in the middle of the hierarchy withimportant implications for class identity and democracy.
Similarly, Paul Krugman in a recent article claimed that:
“One of the odd things about the United States has long been the immenserange of people who consider themselves to be middle class - and are deludingthemselves. Low-paid workers who would be considered poor by internationalstandards, say with incomes below half the median, nonetheless consider them-selves lower-middle-class; people with incomes four or five times the medianconsider themselves, at most, upper-middle-class” (Krugman 2014).
In order to explain this evidence,Kelley andEvans (1995) developed the “Referencegroup and Reality (R&R) – blend” hypothesis, according to which individuals develop
123
Perceived Social Position and Objective Inequality: Do They… 285
perceptions and self-images looking at their reference group, fairly homogeneous withrespect to themselves. This homogeneity means that most people are encouraged todeclare middle categories, overestimating the number of people with the same features(Kelley 1967; Kahneman et al. 1982). Lindemann’s empirical study (2007) is focusedon Estonian society to find out what kinds of assets and resources affect people’s opin-ion of their position in society. Coherently with some of the studies alreadymentioned,the analysis shows that, also in Estonia, income is the most important determinant inshaping people’s opinion of their social position. More interesting evidence is thatin Estonia the significant impact of age on subjective social status is confirmed, but,contrary to what is observable in the Western countries (Yamaguchi and Wang 2002),being younger increases the probability of identifying with the higher positions.
Furthermore, Andersen and Curtis (2012) using cumulative logit mixed modelsfitted to World Values Survey data from 44 countries explored the impact of eco-nomic conditions, both on the individual-level and the national-level, on social classidentification. Consistent with previous research, they found a positive relationshipbetween household income and class identification in all countries explored, thoughthis relationship varies substantially. They also found that income inequality has animportant polarising effect on class identification and, specifically, the relationshipbetween household income and class identity tends to be strongest in countries with ahigh level of income inequality.
Another significant analysis was conducted by Lora and Fajardo (2011, 2015) whoprovided a set of comparisons between objective (based on statistically measurablecharacteristics such as income and consumption) and subjective definitions of middle-class using data from the 2007 World Gallup Poll. Seven objective income-baseddefinitions of social class were contrasted with a self-perceived social status measure.One of the conclusions is that mismatches between the objective and the subjectiveclassification of social class result from the fact that self-perceived social status isassociated not just with income, but also with personal capabilities, interpersonalrelations, financial and material assets, and perceptions of economic insecurity.
Overall, literature quantified the impact of different socioeconomic characteristicson the subjective social position declared and observed in different cases a significantmismatch between objective and subjective dimension. Moreover, authors stressed therelevance of subjective perceptions of position across society to influence economicoutcomes and well-being. According to this framework, the aim of this paper is toextend the analysis from the level of people’s self-declared position in society to theinequality observed within this variable in order to assess whether changes in thedegree of inequality within socioeconomic groups in terms of objective circumstancesare associated with similar changes in the perceptions of the members of the samegroups.
3 Data and Methodological Choices
The analysis of the evolution of incomes distribution in six different coun-tries (Germany, Italy, Norway, Poland, the United Kingdom and the UnitedStates) is based on the comparable cross-country data provided by LIS via the
123
286 C. A. Ricci
Luxembourg Income Study (2015) (LIS). European countries are selected in orderto give an assessment across a range of welfare and labour market regimes in Europe.In order to analyse income dynamics from the beginning of the 1990s to the 2000s,observations of the waves between 1994 and 2010 have been selected. Coherentlywith the definition that is standard in the LIS literature (Gornick and Jäntti 2013), weconsider disposable household income which is the sum of all total monetary and nonmonetary (goods and services) payments received by the household or its individualmembers at annual or more frequent intervals, that are available for current consump-tion and that do not reduce the net worth of the household net of income taxes andsocial security contributions. Some non-monetary incomes that may be important areomitted because they are not available in the LIS microdata. These sources of incomesinclude imputed rents, non-cash public transfers (in essence, the value of public ser-vices), non-cash private income (such as the value of in- kind employer-providedbenefits), and unrealized capital gains. As reported by LIS, they are excluded fromdisposable household income because these sources are rarely available in the incomemicrodata and, when available, they are calculated with widely varying methodolo-gies. For example, transfers are very hard to evaluate on the individual level and thusare typically only available on the macro-level. Thus, an analysis of these sourcescannot be included in this study.
Not being able to know how income is divided between householdmembers, familyincome rather than an individual measure is used. Considering that the same yearlyincome provides a higher standard of living for a single-person family than it does forindividuals belonging to larger families, family income is adjusted by family size usingthe square root of household size. Disposable incomes have been inflated to within-country 2010 prices using national consumer price indices for all items (IXOB) fromOECD and have been converted to international dollars using the PPPs for Actual Indi-vidual Consumption (A01) in 2010 from OECD. Furthermore, according to Atkinsonand Brandolini (2013), to minimize the impact of outliers all records with zero incomeare dropped, the bottom cut-off is 1 % of the mean of equivalent disposable incomewhile top cut-off is 10 times the median of unadjusted disposable income.
To investigate perception and its evolution on the basis of individuals’ charac-teristics, data is drawn from the International Social Survey Programme (ISSP), acontinuing annual programme of cross-national collaboration on surveys coveringtopics important for social science research. The ISSP Social Inequality module dealswith different attitudes towards income inequality, views on earnings and incomes,legitimation of inequality, career advancement by means of family background andnetworks, social cleavages and conflict among groups, and the current and past socialposition.
For the aims of this research observations are selected from the second and the fourthsurvey, referred to 1992 and 2009 respectively, fromwhich a question on the subjectiveposition on the social scale and socioeconomic characteristics of the respondents canbe drawn. Unfortunately, if ISSP also includes questions for income, this variablewas not considered in this research given the difficulty to obtain comparable data.1
1 The ISSP asks for income classes but classes are not equal across countries.
123
Perceived Social Position and Objective Inequality: Do They… 287
Selecting individuals of our six countries (for which the data is comparable across allvariables) and excluding the individuals for which at least one variable of the analysisis missing, the observations in the sample are 7601 for the first period and 6603 for thesecond period. Internal weights, supplied by the ISSP to achieve distributions on keyvariables that are consistent with those found in the populations, are used in analysingthe survey data.
The main variable of interest, Subjective Social Position, is the reported answer tothe question:
In our society there are groups which tend to be towards the top and groups whichtend to be towards the bottom. Below is a scale that runs from bottom to top. Wherewould you put yourself now on this scale?
In all countries, social strata were labeled consecutively from 1 to 10 with 1 at thebottom and 10 at the top, as a categorical ordered variable.
The approach to investigate incomes, individual characteristics and perceptions andtheir changes over time is composed of three steps. The first step observes individualincome distributions in different periods considering the Gini indices across the wholepopulation and different subgroups from1994 to 2010. Then, the analysis of perceptionis carried out in two different steps to identify and quantify the contribution of a set ofcovariates in levels and over time change of perception inequality. First, we investigatehow age, gender, education, status and profession increase or decrease the varianceusing the Recentered Influence Function (RIF) regressions for two time periods (1992and 2009) and the Gini index of the variable “declared position on social scale” . Then,we identify and quantify the role of the covariates in shaping the evolution of subjectivesocial position inequality over time, by means of the decomposition method proposedby Fortin et al. (2011) which is a generalisation of the Oaxaca–Blinder procedure andcan be applied to any distributional parameter other than the mean. The proceduresapplied are described in the following sections.
3.1 Self Perceived Social Position Inequality: The Decomposition Approach
In this section it is shown how to formally break down changes in the distribution ofthe variable subjective social position into the contribution of each group of covariatesusing the recentered influence function (RIF) regression approach introduced by Firpoet al. (2009).
This method is adopted since the aim is to extend the traditional literature analysisfrom the level of people’s self-declared position in society to the inequality observedwithin this variable for two different years 1992 and 2009. The procedure is similarto the Oaxaca–Blinder decomposition for the mean of a distribution (Oaxaca 1973;Blinder 1973) but, instead of recurring to a standard regression, the RIF-regressionsallow us to perform the same kind of decomposition for any distributional parameterfor which an influence function can be computed, including the variance and the Giniindex.
Let Yi1 be the declared position of an individual iobserved in period 1, and Yi0 thecorresponding value in period 0. For each individual i the category declared acrossthe social scale is given by Yi = Yi1 · Ti + Yi0 · (1 − Ti ), where Ti = 1 if the
123
288 C. A. Ricci
individual i is observed in period 1 and Ti = 0 otherwise. In a standard Oaxaca–Blinder decomposition, the overall differences in means over time �
μo = μ1 − μ2
are broken down into two different components, the first related to the change inthe returns of the set of covariates, defined the coefficient or structure effect �
μS and
usually called the “unexplained” effect in Oaxaca decompositions, and the seconddetermined by the different distribution of the covariates, the composition effect �μ
X .The detailed decomposition allows to subdivide the contribution of each covariate tothese two effects into the respective contributions of each covariate, �μ
S,K and �μX,K .
Fortin et al. (2011) proposed the RIF-regression method that allows us to perform adetailed decomposition for any distributional statistics for which an influence functioncan be computed. A RIF-regression is similar to a standard regression but the depen-dent variable Y, is replaced by the (re-centered) influence function of the statistic ofinterest. The RIF is the sum of the distributional parameter of interest and the influencefunction I F(y; v). This latter measures the relative effect of a small perturbation in theunderlying outcome distribution on the statistic considered, detecting the contributionof each observation to the distributional parameter of interest.
Because the expected value of the RIF(y; v) coincides with the statistic of interest,the law of iterated expectations permits to express the distributional parameter v interms of the conditional expectations of the RIF on the covariates X :
ν = E [RI F(Y ; ν)] = EX {E[RI F(Y ; ν)|X ]} (1)
E [RI F(Y ; ν)|X ] = Xγ ν (2)
where the parameter γ ν can be estimated by the OLS regression.In this way, it is possible to decompose the overall difference over time of ν,
�νO = ν1 − ν0 into a coefficient (�ν
S) and composition effect (�νX ), �ν
O = �νS + �ν
Xwhere:
�νS = E [X |T = 1]′ (γ ν
1 − γ ν0 ) (3)
�νX = (E [X |T = 1] − E[X |T = 0])′γ ν
0
However, a limitation of this decomposition, as discussed in Barsky et al. (2002), isthat it provides consistent estimate only in the case of a linear specification of theconditional expectation, like it is expressed in Eq. (2). The solution to this problemhas been proposed by Fortin et al. (2011) that suggested using a (non-parametric)reweighted approach as in DiNardo et al. (1996) to decompose the different effects.Indeed, by reweighting it is possible to construct a counterfactual distribution FYC
A(·)
that replaces the marginal distribution of X for group A with the marginal distributionof X for group B using a reweighting factor �(X) = Pr(T=1|X)/Pr(T=1)
Pr(T=0|X)/Pr(T=0) .In the case of two different periods, we may be interested in what would be the
distribution of the variable investigated at time 0 if individuals had the same X’s astime 1: applying this procedure it is possible to obtain a distribution of X’s in the firstperiod equal to the distribution in the second period, so that observations that wererelatively more likely in the first year than in the last are weighted up and observationsthat are relatively less likely are weighted down.
123
Perceived Social Position and Objective Inequality: Do They… 289
Than it is possible to estimate the counterfactual mean X̄01 and the counterfactualcoefficients γ̂ ν
01 from the regression of the RIF (y; v) on the reweighted sample. Con-sequently, the difference γ̂ ν
1 − γ̂ ν01 reflects a true change in the relationship that links
the covariates to the outcome.In practice, they are estimated by constructing a third sample, which in this case
will be the sample of individuals at time 1 with the weights of individuals at time 0,sample 01.
The detailed reweighted decomposition is thus obtained by running two Oaxaca–Blinder decompositions (Fortin et al. 2011):
1. a decomposition with sample 0 and sample 01 to get the pure composition effect,2. a decomposition with sample 1 and sample 01 to get the pure coefficient effect.
So, the first effect can be divided into a pure composition effect (�νX,p) and a
component measuring the specification error (�νX,e):
�νX,R = (X̄01 − X̄0)γ̂
ν0 + X̄01(γ̂
ν01 − γ̂ ν
0 ) (4)
�νX,R = �ν
X,p + �νX,e
While the second effect can be expressed as:
�νS,R = X̄1(γ̂1ν − γ̂ ν
01) + (X̄1 − X̄01)γ̂ν01 (5)
�νS,R = �ν
S,p + �νS,e
So, the overall change is given by:
�νO = �ν
X,p + �νS,p (6)
In the final stage, the two components are further divided into the contribution ofeach explanatory variable using novel recentered influence function (RIF) regressions.These regressions estimate directly the impact of the explanatory variables on thedistributional statistic of interest.
4 Empirical Results
4.1 Disposable Income Inequality
Thefirst step forward to assess the evolution of objective conditions is to detect incomesinequality in six countries from 1994 to 2010 by calculating the Gini indices ondisposable household incomes whose values are reported in Table 1. What emerges isthat, on the one hand, different values of these indices are observable across countriesthat reflect different shapes of the income distributions and can be imputed to quitedifferent social regulations and provisions and different approaches towards socialpolicy. In every wave, the United States and the United Kingdom show the highestvalues of the indices, followed by Italy, Poland, Germany and Norway. On the otherhand, a general tendency towards an increasing inequality is observable during the
123
290 C. A. Ricci
Table 1 Gini index for disposable household incomes
1994/1995 1999/2000 2004 2007/2008 2010
Germany 0.284 0.279 0.289 0.301 0.299
Italy 0.339 0.341 0.341 0.326 0.327
Norway 0.262 0.269 0.273 0.271 0.271
Poland 0.310 0.285 0.312 0.311 0.315
United Kingdom 0.348 0.357 0.355 0.346 0.342
United States 0.371 0.369 0.380 0.380 0.384
Own calculation on weighted household income data from LIS
period from 1994 to 2012 for Germany, Norway, Poland and the United States whileItaly and the United Kingdom show a modest decline of the values of the indices.
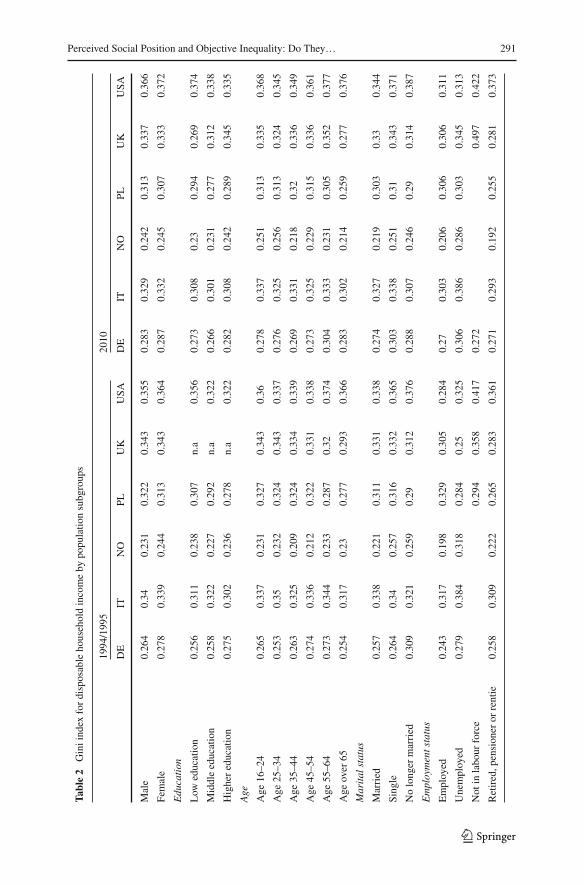
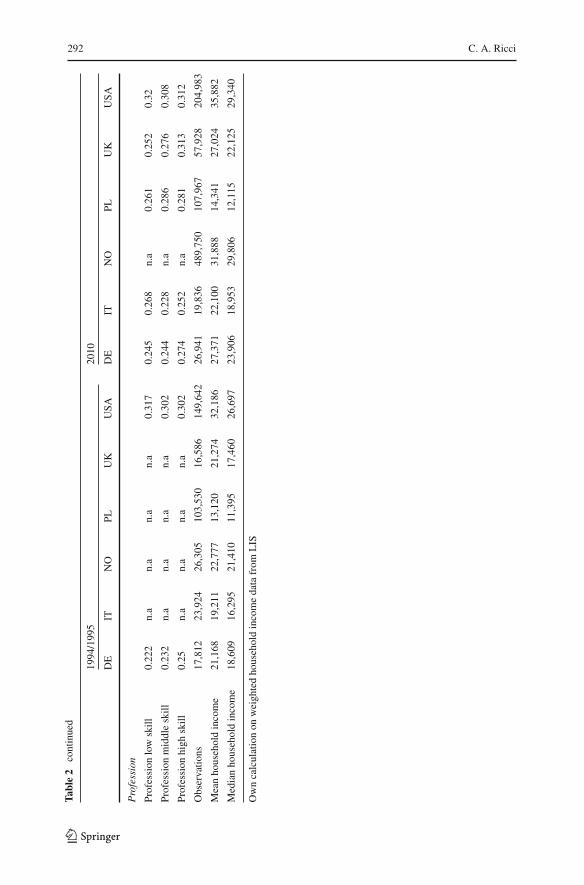
To lookmore in depth at how incomeshave evolvedduring the period considered andto account for individual characteristics, a focus on the whole population of the sampleis provided for the first and the last year of the waves by attributing to each personthe equivalent income of the household to which he or she belongs. Table 2 reportsGini indices calculated across different population subgroups. Groups are identifiedaccording to sex, education attainment, age, marital status, occupational status andtype of profession. Due to data limitation some information is missing and mean andmedian incomes are reported in the last two rows of the table.
What emerges is that theGini coefficients significantly increased formost subgroupsin every country, with the exception of Italy and Poland, which suggests a risinginequality within different groups.
It is important to notice that a significant increase in inequality (more than 4 %within each group) between 1994/1995 and 2010 is observable in particular in twocases. First, in Germany when groups are formed according to their professional skilllevels. Second, in the United States, when groups are formed on the basis of theireducation attainments. This means that educational attainment and professional skilllevels represent factors that are less likely to create homogenous groups in terms ofincomes.
Finally, numbers reveal that incomes distributions are significantly different in termsofmedian and average income across countries. However, some common evidence canbe detected coherently with what emerged from the synthetic measures of inequality.In particular, average and median incomes significantly increase both in Europeancountries and the USA but a further investigation (not reported here for short) revealsthat rising income gaps can be detected between groups especially in the UnitedKingdom and the United States.
4.2 Self Perceived Social Position Inequality: Descriptive Findings
Coherently with some of the previously overviewed literature, the preliminary analysisto investigate how individuals of our sample tend to locate themselves across a socialscale reveals thatmost people tend to locate themselves in themiddle categories and the
123
Perceived Social Position and Objective Inequality: Do They… 291
Table2
Giniind
exfordisposableho
useholdincomeby
popu
latio
nsubg
roup
s
1994
/199
520
10
DE
ITNO
PLUK
USA
DE
ITNO
PLUK
USA
Male
0.26
40.34
0.23
10.32
20.34
30.35
50.28
30.32
90.24
20.31
30.33
70.36
6
Female
0.27
80.33
90.24
40.31
30.34
30.36
40.28
70.33
20.24
50.30
70.33
30.37
2
Edu
cation
Low
education
0.25
60.31
10.23
80.30
7n.a
0.35
60.27
30.30
80.23
0.29
40.26
90.37
4
Middleeducation
0.25
80.32
20.22
70.29
2n.a
0.32
20.26
60.30
10.23
10.27
70.31
20.33
8
Highereducation
0.27
50.30
20.23
60.27
8n.a
0.32
20.28
20.30
80.24
20.28
90.34
50.33
5
Age
Age
16–2
40.26
50.33
70.23
10.32
70.34
30.36
0.27
80.33
70.25
10.31
30.33
50.36
8
Age
25–3
40.25
30.35
0.23
20.32
40.34
30.33
70.27
60.32
50.25
60.31
30.32
40.34
5
Age
35–4
40.26
30.32
50.20
90.32
40.33
40.33
90.26
90.33
10.21
80.32
0.33
60.34
9
Age
45–5
40.27
40.33
60.21
20.32
20.33
10.33
80.27
30.32
50.22
90.31
50.33
60.36
1
Age
55–6
40.27
30.34
40.23
30.28
70.32
0.37
40.30
40.33
30.23
10.30
50.35
20.37
7
Age
over
650.25
40.31
70.23
0.27
70.29
30.36
60.28
30.30
20.21
40.25
90.27
70.37
6
Marital
status
Married
0.25
70.33
80.22
10.31
10.33
10.33
80.27
40.32
70.21
90.30
30.33
0.34
4
Sing
le0.26
40.34
0.25
70.31
60.33
20.36
50.30
30.33
80.25
10.31
0.34
30.37
1
Nolong
ermarried
0.30
90.32
10.25
90.29
0.31
20.37
60.28
80.30
70.24
60.29
0.31
40.38
7
Employmentstatus
Employed
0.24
30.31
70.19
80.32
90.30
50.28
40.27
0.30
30.20
60.30
60.30
60.31
1
Unemployed
0.27
90.38
40.31
80.28
40.25
0.32
50.30
60.38
60.28
60.30
30.34
50.31
3
Not
inlabo
urforce
0.29
40.35
80.41
70.27
20.49
70.42
2
Retired,p
ension
eror
rentie
0.25
80.30
90.22
20.26
50.28
30.36
10.27
10.29
30.19
20.25
50.28
10.37
3
123
292 C. A. Ricci
Table2
continued
1994
/199
520
10
DE
ITNO
PLUK
USA
DE
ITNO
PLUK
USA
Profession
Profession
lowskill
0.22
2n.a
n.a
n.a
n.a
0.31
70.24
50.26
8n.a
0.26
10.25
20.32
Profession
middleskill
0.23
2n.a
n.a
n.a
n.a
0.30
20.24
40.22
8n.a
0.28
60.27
60.30
8
Profession
high
skill
0.25
n.a
n.a
n.a
n.a
0.30
20.27
40.25
2n.a
0.28
10.31
30.31
2
Observatio
ns17
,812
23,924
26,305
103,53
016
,586
149,64
226
,941
19,836
489,75
010
7,96
757
,928
204,98
3
Meanho
useholdincome
21,168
19,211
22,777
13,120
21,274
32,186
27,371
22,100
31,888
14,341
27,024
35,882
Medianho
useholdincome
18,609
16,295
21,410
11,395
17,460
26,697
23,906
18,953
29,806
12,115
22,125
29,340
Owncalculationon
weightedhouseholdincomedatafrom
LIS
123
Perceived Social Position and Objective Inequality: Do They… 293
highest share of people answers category 5 or 6 in every country (Fig. 1). On average,after a time span of 17 years, the subjective social position declared has slightlyincreased, passing from a mean of 5.10 observed in 1992 to a mean of 5.30 in 2009.Some differences emerge across countries: for example, it is interesting to observethat in 1992 in Poland a significant percentage of people mentioned the low values ofthe scale in their answers and then compare this data with a significant variation ofanswers’ distribution after less than 20 years. In Italy, individual perception of theirposition across society has deteriorated significantly since an increasing number ofpeople in 2009 declared to be located at the bottom of the social scale. Furthermore,in the United States more than 45 % of the population believe to be located after themiddle of the social scale declaring the same value 6.
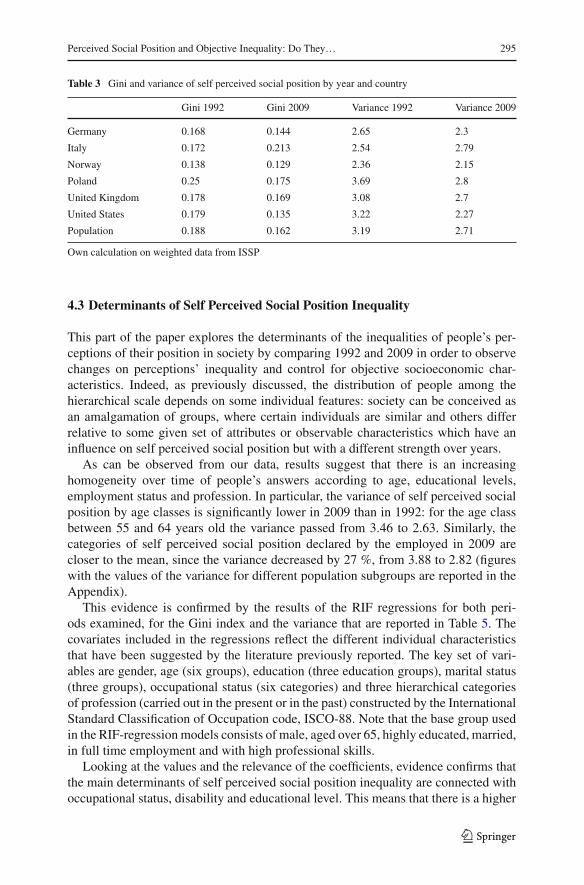
All this evidence can be resumed looking at two different measures of dispersion,the variance and the Gini index, whose values are reported in Table 3 for 1992 and2009. The variance and the Gini index of the variable “declared position” are calcu-lated across countries and the whole population to explore the inequalities in people’ssocial perception of their position across society. Both these distributional parametersdecreased in the period considered in every country (Table 3): on average the variancediminished by around 15 %, from 3.19 to 2.71, while the Gini index reduced from0.18 to 0.162 (with a reduction of 10 %). In particular, also countries where incomepolarization increases during nearly the same period like Germany, Norway, Polandand the USA show a significant decrease of the variance and the Gini index for theanswers on social position perceived. In Italy, the variance and the Gini calculated onthis variable increase in 2009 despite the decrease of income polarization observed bydifferent economic studies and the analysis on disposable household income reportedin the previous paragraph.
Furthermore, it is possible to observe that answers’ dispersion is the highest inPoland both in 1992 and 2009 followed by the USA, the UK, Germany and Italy in1992 and Italy, the UK, Germany and the USA in 2009. Norway shows the lowestdispersion in both years.
Finally, in order to providemore detail on the data, Table 4 reports the distribution ofthe selected covariates across our sample in the two periods and the mean of subjectivesocial position declared within each category.
As can be easily predicted and coherentlywith results of other empirical analysis, onaverage the highest values are declared by high skill professionals and high educatedwhile unemployed, disabled and low educated declare the lowest values. In general,comparing the two years, a small increase of the mean values can be detected for allthe groups of people considered.
Looking at the differences between the two sample, it is possible to observe that: (i)the percentage of postsecondary educated has grown to 37 % in 2009 compared to the18.8% of 1992 increasing the average level of education; (ii) the proportion of the totalpopulation in different age groups has significantly changed, since the percentage ofpeople over 45 increased and the proportion of youth has fallen; (iii) the shares of thewidowed, the separated, the divorced (included in the variable “no longer married”)and of those single increased, while the percentage of married fell from 67.6 to 57 %;(iv) regarding the employment status, there is a lower percentage of unemployed thatpassed from 5.5 % in the year 1992 to 4.6 % in 2009.
123
294 C. A. Ricci
Fig.1
Distributionof
selfperceivedsocialpositio
nby
year
andcountry
123
Perceived Social Position and Objective Inequality: Do They… 295
Table 3 Gini and variance of self perceived social position by year and country
Gini 1992 Gini 2009 Variance 1992 Variance 2009
Germany 0.168 0.144 2.65 2.3
Italy 0.172 0.213 2.54 2.79
Norway 0.138 0.129 2.36 2.15
Poland 0.25 0.175 3.69 2.8
United Kingdom 0.178 0.169 3.08 2.7
United States 0.179 0.135 3.22 2.27
Population 0.188 0.162 3.19 2.71
Own calculation on weighted data from ISSP
4.3 Determinants of Self Perceived Social Position Inequality
This part of the paper explores the determinants of the inequalities of people’s per-ceptions of their position in society by comparing 1992 and 2009 in order to observechanges on perceptions’ inequality and control for objective socioeconomic char-acteristics. Indeed, as previously discussed, the distribution of people among thehierarchical scale depends on some individual features: society can be conceived asan amalgamation of groups, where certain individuals are similar and others differrelative to some given set of attributes or observable characteristics which have aninfluence on self perceived social position but with a different strength over years.
As can be observed from our data, results suggest that there is an increasinghomogeneity over time of people’s answers according to age, educational levels,employment status and profession. In particular, the variance of self perceived socialposition by age classes is significantly lower in 2009 than in 1992: for the age classbetween 55 and 64 years old the variance passed from 3.46 to 2.63. Similarly, thecategories of self perceived social position declared by the employed in 2009 arecloser to the mean, since the variance decreased by 27 %, from 3.88 to 2.82 (figureswith the values of the variance for different population subgroups are reported in theAppendix).
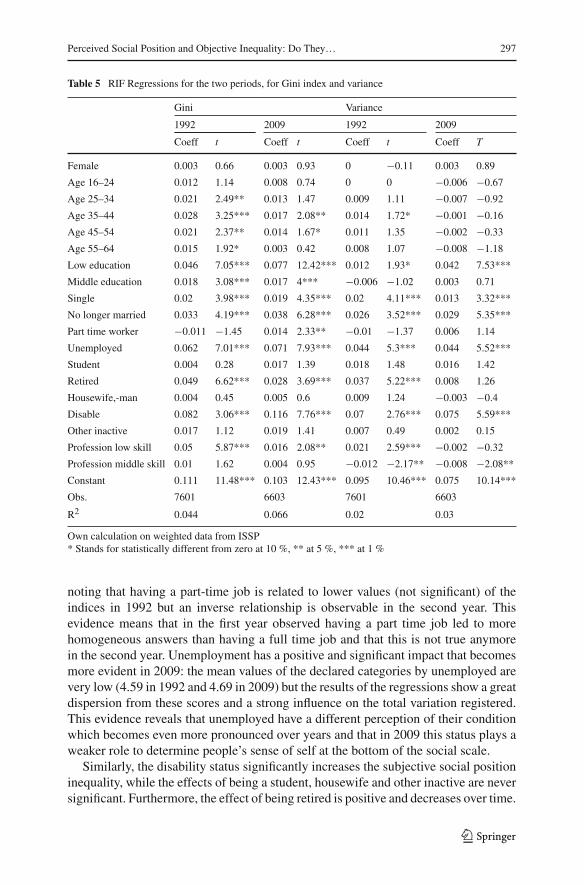
This evidence is confirmed by the results of the RIF regressions for both peri-ods examined, for the Gini index and the variance that are reported in Table 5. Thecovariates included in the regressions reflect the different individual characteristicsthat have been suggested by the literature previously reported. The key set of vari-ables are gender, age (six groups), education (three education groups), marital status(three groups), occupational status (six categories) and three hierarchical categoriesof profession (carried out in the present or in the past) constructed by the InternationalStandard Classification of Occupation code, ISCO-88. Note that the base group usedin the RIF-regressionmodels consists of male, aged over 65, highly educated, married,in full time employment and with high professional skills.
Looking at the values and the relevance of the coefficients, evidence confirms thatthe main determinants of self perceived social position inequality are connected withoccupational status, disability and educational level. This means that there is a higher
123
296 C. A. Ricci
Table 4 Composition of the sample and mean of self perceived social position
Composition1992
Mean of selfperceivedsocial positiondeclared 1992
Composition2009
Mean of selfperceivedsocial positiondeclared 2009
Female 0.520 5.179 0.514 5.482
Education
Low education 0.372 4.787 0.158 4.675
Middle education 0.438 5.273 0.471 5.392
Higher education 0.188 6.086 0.371 6.106
Age
Age 16–24 0.076 5.304 0.071 5.506
Age 25–34 0.229 5.384 0.158 5.524
Age 35–44 0.225 5.294 0.199 5.654
Age 45–54 0.170 5.285 0.203 5.608
Age 55–64 0.139 5.048 0.182 5.588
Age over 65 0.133 5.015 0.173 5.343
Marital status
Married 0.676 5.281 0.570 5.685
Single 0.255 5.207 0.319 5.395
No longer married 0.069 5.040 0.110 5.250
Employment status
Full time worker 0.523 5.414 0.524 5.829
Part time worker 0.087 5.361 0.108 5.419
Unemployed 0.055 4.594 0.046 4.695
Student 0.027 5.849 0.024 5.705
Retired 0.202 4.869 0.208 5.253
Housewife,-man 0.083 5.313 0.054 5.347
Disable 0.005 4.668 0.015 4.309
Other inactive 0.018 4.993 0.020 5.031
Profession
Profession low skill 0.099 4.703 0.088 4.903
Profession middle skill 0.739 5.140 0.640 5.365
Profession high skill 0.163 6.055 0.272 6.172
Observations 7601 6603
Own calculation on weighted data from ISSP
heterogeneity of the answers than the base groups when groups are formed by peoplewith disability, unemployed or people with a low educational level.
The regression results when using the Gini coefficient as the dependent variableshow that the effect of low education increasedwith time since the association betweenthis covariate, which increases the dispersion of theGini, and ourmeasure of inequalityis higher in 2009 than in 1992. Considering the occupational status, it is well worth
123
Perceived Social Position and Objective Inequality: Do They… 297
Table 5 RIF Regressions for the two periods, for Gini index and variance
Gini Variance
1992 2009 1992 2009
Coeff t Coeff t Coeff t Coeff T
Female 0.003 0.66 0.003 0.93 0 −0.11 0.003 0.89
Age 16–24 0.012 1.14 0.008 0.74 0 0 −0.006 −0.67
Age 25–34 0.021 2.49** 0.013 1.47 0.009 1.11 −0.007 −0.92
Age 35–44 0.028 3.25*** 0.017 2.08** 0.014 1.72* −0.001 −0.16
Age 45–54 0.021 2.37** 0.014 1.67* 0.011 1.35 −0.002 −0.33
Age 55–64 0.015 1.92* 0.003 0.42 0.008 1.07 −0.008 −1.18
Own calculation on weighted data from ISSP* Stands for statistically different from zero at 10 %, ** at 5 %, *** at 1 %
noting that having a part-time job is related to lower values (not significant) of theindices in 1992 but an inverse relationship is observable in the second year. Thisevidence means that in the first year observed having a part time job led to morehomogeneous answers than having a full time job and that this is not true anymorein the second year. Unemployment has a positive and significant impact that becomesmore evident in 2009: the mean values of the declared categories by unemployed arevery low (4.59 in 1992 and 4.69 in 2009) but the results of the regressions show a greatdispersion from these scores and a strong influence on the total variation registered.This evidence reveals that unemployed have a different perception of their conditionwhich becomes even more pronounced over years and that in 2009 this status plays aweaker role to determine people’s sense of self at the bottom of the social scale.
Similarly, the disability status significantly increases the subjective social positioninequality, while the effects of being a student, housewife and other inactive are neversignificant. Furthermore, the effect of being retired is positive and decreases over time.
123
298 C. A. Ricci
Being single and no longer married (widowed, separated or divorced) has a significantand positive effect regardless the period considered that can be due to the highestheterogeneity (also in terms of perception) of people within these groups. Finally, theestimated RIF-coefficients associated with professional skills are not always statisti-cally different from zero and their impact decreases over time. However, it is possibleto state that in 2009 people with a middle skill profession declare more homogenousvalues of self perceived social position if compared with high skill professionals.
Considering the results for the variance, the majority of the evidence emerged fromthe analysis of the Gini index is confirmed since the coefficients that are significant inboth analyses always have the same sign and similar magnitude, given the differentscale between the two inequality indices. The differences between the two modelsregard the statistical significance of some coefficients. In some of these cases, wherejust one of the two coefficients is statistically different from zero, opposite signs ofthe value are observable.
4.4 Decomposition Results
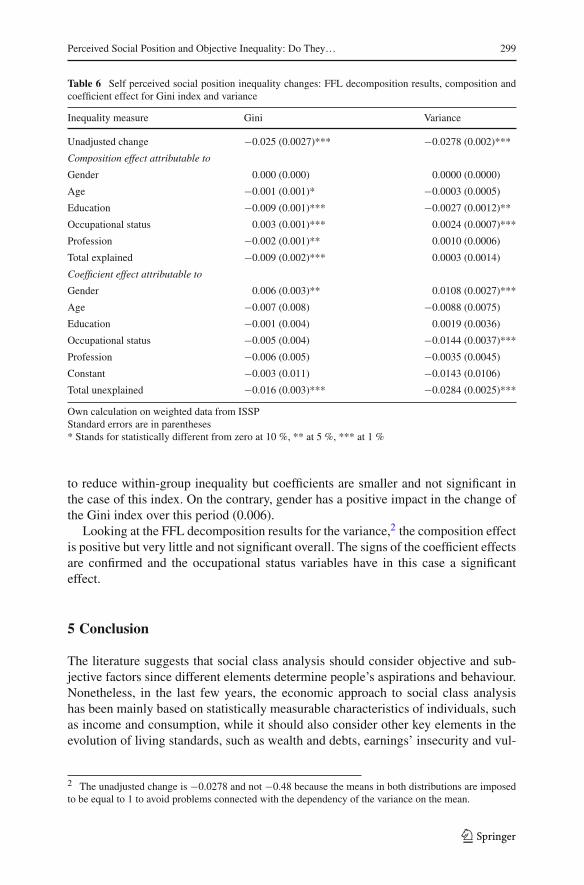
The observed changes in the distribution of the subjective social position inequalityover the last 17 years are decomposed into a composition effect due to differences inobservable covariates across population, and a structure effect due to differences inthe relationship that links the covariates to the outcome.
The results of decomposition analysis of the Gini index and the variance are pre-sented in Table 6.
To simplify the presentation of the results, the table reports the composition effectfor five sets of explanatory factors: gender, age, education, occupational status andprofession. Both composition effect and coefficient effect have contributed to thechange in the distribution of the categories declared by people on their location acrossa social scale between 1992 and 2009, but with a different strength.
Considering the impact on the change of the Gini index, the composition effectnegatively influences the variation of the inequality, while the coefficient effect has amuch stronger and negative impact. This means that if the distribution of the covariatesacross population had remained constant over time, the Gini would have decreasedanyway.
Looking at the composition effect, the decreased percentage of people with a loweducation in 2009 (from 37.2 % in 1992 to 15.8 % in 2009) significantly reduced thetotal variation of the Gini. On the contrary, the composition effect is positive in thecase of occupational status, but the effect is low.
Interesting evidence emerges from the analysis of the coefficient effect: as previ-ously noticed the total impact is negative and the results indicate that −0.016 of the−0.025 decline in the Gini variation due to this effect remains unexplained since itis given by the effect of the “constant” in Table 5. As defined in Fortin et al. (2011),in fact, the change in intercepts represents the change in the distribution for the basegroup used in the RIF-regression analysis. Then that component of the decompositioncan be interpreted as the residual (or within-group) change for the base group. Alsothe effects of age, profession and occupational status contribute in the same direction
123
Perceived Social Position and Objective Inequality: Do They… 299
Table 6 Self perceived social position inequality changes: FFL decomposition results, composition andcoefficient effect for Gini index and variance
Occupational status 0.003 (0.001)*** 0.0024 (0.0007)***
Profession −0.002 (0.001)** 0.0010 (0.0006)
Total explained −0.009 (0.002)*** 0.0003 (0.0014)
Coefficient effect attributable to
Gender 0.006 (0.003)** 0.0108 (0.0027)***
Age −0.007 (0.008) −0.0088 (0.0075)
Education −0.001 (0.004) 0.0019 (0.0036)
Occupational status −0.005 (0.004) −0.0144 (0.0037)***
Profession −0.006 (0.005) −0.0035 (0.0045)
Constant −0.003 (0.011) −0.0143 (0.0106)
Total unexplained −0.016 (0.003)*** −0.0284 (0.0025)***
Own calculation on weighted data from ISSPStandard errors are in parentheses* Stands for statistically different from zero at 10 %, ** at 5 %, *** at 1 %
to reduce within-group inequality but coefficients are smaller and not significant inthe case of this index. On the contrary, gender has a positive impact in the change ofthe Gini index over this period (0.006).
Looking at the FFL decomposition results for the variance,2 the composition effectis positive but very little and not significant overall. The signs of the coefficient effectsare confirmed and the occupational status variables have in this case a significanteffect.
5 Conclusion
The literature suggests that social class analysis should consider objective and sub-jective factors since different elements determine people’s aspirations and behaviour.Nonetheless, in the last few years, the economic approach to social class analysishas been mainly based on statistically measurable characteristics of individuals, suchas income and consumption, while it should also consider other key elements in theevolution of living standards, such as wealth and debts, earnings’ insecurity and vul-
2 The unadjusted change is −0.0278 and not −0.48 because the means in both distributions are imposedto be equal to 1 to avoid problems connected with the dependency of the variance on the mean.
123
300 C. A. Ricci
nerability, and subjective dimensions such as individuals’ perception of their socialposition.
The aim of this paper was to analyse whether changes in the degree of inequalitywithin specific groups in terms of objective data are associated with similar changesin the perceptions of the members of the various groups. More precisely, the focuswas on inequality in people’s self-declared position in society and its comparisonwith evidence in terms of income distributions and distribution of different individualcharacteristics.
The different steps of this research have outlined an interesting pattern. On the onehand, during the timeperiod considered, an increasingdistance between incomegroupsis observable.On theother hand, subjective social position inequality fell between1992and 2009. Looking at decomposition results evidence is found that this decline doesnot only depend on the changes of the distribution of the covariates across population.Indeed, a significant decrease of subjective social position inequality between groupsand within groups with different characteristics can be imputed to changes in therelationship between the covariates to the outcome. Looking at the whole picture thismeans that individual characteristics such as family disposable income, age, education,employment status and occupation play a weaker role in explaining the heterogeneityof people’s answers on their location across society. The case of the United States isemblematic: it is a high-inequality country with relatively low values of subjectivesocial position inequality.
These results can be explained in different ways. First, individuals can have falseperceptions of their incomes and their economic advantage or disadvantage comparedto others. Second, the perceived distances between members of society can dependon different undetectable factors (objective or subjective) that influence the senseof identity or alienation observable within a community and it can be distributedvery differently from income. This latter explanation, when evidence of an increasingincome distance between social groups is found, while no increase concerns inequalityin perceptions, is coherent with the “reference-groups hypothesis” according to whichthere is an increasing tendency for people to perceive themselves as being in themiddle.Authors such as Frank (2007), Layard (2005), and Graham (2007) connected thisattitude to the increasing role played by the relative social context in shaping people’saspirations and their consciousness of quality of life. Thus, results are consistent withwhat Evans and Kelley (2004) pointed out: reference group forces “mitigate ratherthan obliterate the subjective impact of social inequalities” (Evans and Kelley 2004,p. 29). On the contrary, opposite evidence was provided for the case of Italy. In thiscountry, an empirical evidence of stability in the income inequality is accompaniedby the worsening of confidence and expectations experienced by Italian householdsthat shows how results can also be affected by individual trajectory in terms of socialmobility as pointed out in other studies (Boeri and Brandolini 2004; Ricci 2016).
Indeed, according to this evidence there are some potential effects. In particular,these findings may describe a society within which trust and expectations about one’spersonal situation and those about the country situation donot differ across the differentincome classes, leading to general emulative behaviour despite increasing inequality(Golinelli and Parigi 2004; Levine et al. 2010). For instance, such reasoning couldexplain the observed decline in aggregate saving rates in the USA. Moreover, these
123
Perceived Social Position and Objective Inequality: Do They… 301
dynamics of perceptions may also explain the lack of reaction to the rise of economicdisparities which many authors are currently debating.
Consequently, the consideration of this variable can help understand different eco-nomic phenomena. In addition, the insights derived from the integrated approachfollowed in this paper point out that economic analysis should take into account vari-ous dimensions. Hence, future research in this direction should be encouraged.
Appendix
See Figs. 2, 3, 4, and 5.
Fig. 2 Variance of self perceived social position by profession
Fig. 3 Variance of self perceived social position by educational level
123
302 C. A. Ricci
Fig. 4 Variance of self perceived social position by occupational status
Fig. 5 Variance of self perceived social position by profession
References
Akerlof G, Kranton R (2000) Economics and identity. Q J Econ 115(3):715–753Andersen R, Curtis J (2012) The polarizing effect of economic inequality on class identification: evidence
from 44 countries. Res Soc Stratif Mobil 30(1):129–141Atkinson A, Brandolini A (2013) On the identification of the middle class. In: Gornick JC, Jäntti M (eds)
Income inequality economic disparities and the middle class in affluent countries. Stanford UniversityPress, Stanford
Barsky R, Bound J, Charles KK, Lupton JP (2002) Accounting for the black-white wealth gap: a nonpara-metric approach. J Am Stat Assoc 97(459):663–673
Blinder AS (1973) Wage discrimination: reduced form and structural estimates. J Hum Resour 8:436–455Boeri T, Brandolini A (2004) The age of discontent: Italian households at the beginning of the decade.
Giornale degli Economisti e Annali di Economia 63:155–193DiNardo J, Fortin NM, Lemieux T (1996) Labour market institution and the distributions of wage, 1973–
1992: a semiparametric approach. Econometrica 64:1001–1044Durkheim E (1933) The division of labour in society. Free Press, Glencore
123
Perceived Social Position and Objective Inequality: Do They… 303
Evans MDR, Kelley J (2004) Subjective social location: data from 21 nations. Int J Public Opin Res16(1):3–38
Firpo S, Fortin N, Lemieux T (2009) Unconditional quantile regressions. Econometrica 77(3):953–973Fortin N, Lemieux T, Firpo S (2011) Decomposition methods in economics. In: Ashenfelter O, Card D
(eds) Handbook of labor economics 4A. North Holland, AmsterdamFrank RH (2007) Falling behind. How rising inequality harms the middle class. University of California
Press, BerkeleyGraham C (2007) What happiness research can (and cannot) contribute to policy reforms: lessons from
research on Latin America and beyond, draft presented at the World Bank workshop fiscal incidenceand the middle class: implications for policy, June 5
Golinelli R, Parigi G (2004) Consumer sentiment and economic activity: a cross country comparison. J BusCycle Meas Anal 1(2):147–172
Gornick JC, Jäntti M (eds) (2013) Income inequality: economic disparities and the middle class in affluentcountries. Stanford University Press, Stanford
Hodge RW, Treiman DJ (1968) Class identification in the United States. Am J Sociol 73(5):535–547Jackman MR, Jackman R (1973) An interpretation of the relation between objective and subjective social
status. Am Sociol Rev 38:569–582Kahneman D, Slovic P, Tversky A (1982) Judgment under uncertainty: heuristics and biases. Cambridge
University Press, New YorkKelley HH (1967) Attribution theory in social psychology Nebraska. Simp Motiv 15:192–238Kelley J, Evans MD (1995) Class and class conflict in six western nations. Am Sociol Rev 60(2):157–178Krugman P (2014) Redefining the middle class, 14 February 2014. http://truth-out.org/Layard R (2005) Happiness: lessons from a new science, Penguin Press, New YorkLevine AS, Frank RH, Dijk O (2010) Expenditure cascades. Available at SSRN: http://ssrn.com/
abstract=1690612LindemannK (2007) The impact of objective characteristics on subjective social position. Trames 11:54–68Lora EA, Fajardo AG (2011) Latin American middle classes: the distance between perception and reality.
IDB Working Paper, N. IDB-WP-275Lora EA, Fajardo AG (2015) Feeling middle class and being middle class: what do subjective perceptions
tell us? Latin America’s emerging middle classes, pp 173–185Luxembourg Income Study (LIS) Database (2015) http://www.lisdatacenter.org (multiple countries; data
run in July 2015). LIS, LuxembourgMarx K (1844) [1972], Economic and philosophic manuscripts of 1844: selections. Trans Martin Milligan.
In: Tucker R (ed) The Marx–Engels reader. W.W. Norton, New YorkMarx K, Engels F (1968) The communist manifesto. Selected works. International Publishers, New YorkNorth DC (1990) Institutions, institutional change and economic performance. Cambridge University Press,
CambridgeOaxaca R (1973) Male–female wage differentials in urban labor markets. Int Econ Rev 14:693–709Ricci CA (2016) The mobility of Italy’s middle income group. PSL Q Rev 69(277)Rizzello S (2000) Economic change, subjective perception and institutional evolution. Metroeconomica
51(2):127–150Savage M (2015) Social class in the 21st century. Penguin Books, LondonTorche F, López-Calva L (2013) Stability and vulnerability of the Latin American middle class. In: Oxford
development studies. Taylor & Francis Journals, vol 41(4), pp 409–435Vanneman Pampel (1977) The American perception of class and status. Am Sociol Rev 42:422–437Wright EO, Singelmann J (1982) Proletarianization in theAmerican class structure. In: BurawoyM, Skocpol
T (eds) Marxist inquiries: studies of labor, class and states, supplement to the American Journal ofSociology, vol 88, pp 176–209
Yamaguchi K, Wang Y (2002) Class identification of married employed women and men in America. AmJ Sociol 108(2):440–475