51
Ben Campbell Asst. Prof. and Extension Economist Dept. of Agricultural and Res. Econ. University of Connecticut Perception and Misperception of Food Labelling: Local and Organic
Ben Campbell
Asst. Prof. and Extension Economist
Dept. of Agricultural and Res. Econ.
University of Connecticut
Perception and Misperception of Food
Labelling: Local and Organic
Collaborators Study 1 – Canadian Journal of Agricultural Economics, 2013 (Ontario Ministry of
Agriculture, Food and Rural Affairs, New Directions and Growing Forward
programs)
Sanelsio Mhlanga and Isabelle Lesschaeve, Vineland Research and Innovation Centre
Study 2 – International Food and Agribusiness Management Review, 2014
(USDA-Federal State Marketing Improvement Program)
Michigan State University,
Jennifer Dennis, Purdue University
Charlie Hall, Texas A&M University
Hayk Khachatryan, University of Florida
Chengyan Yue, University of Minnesota
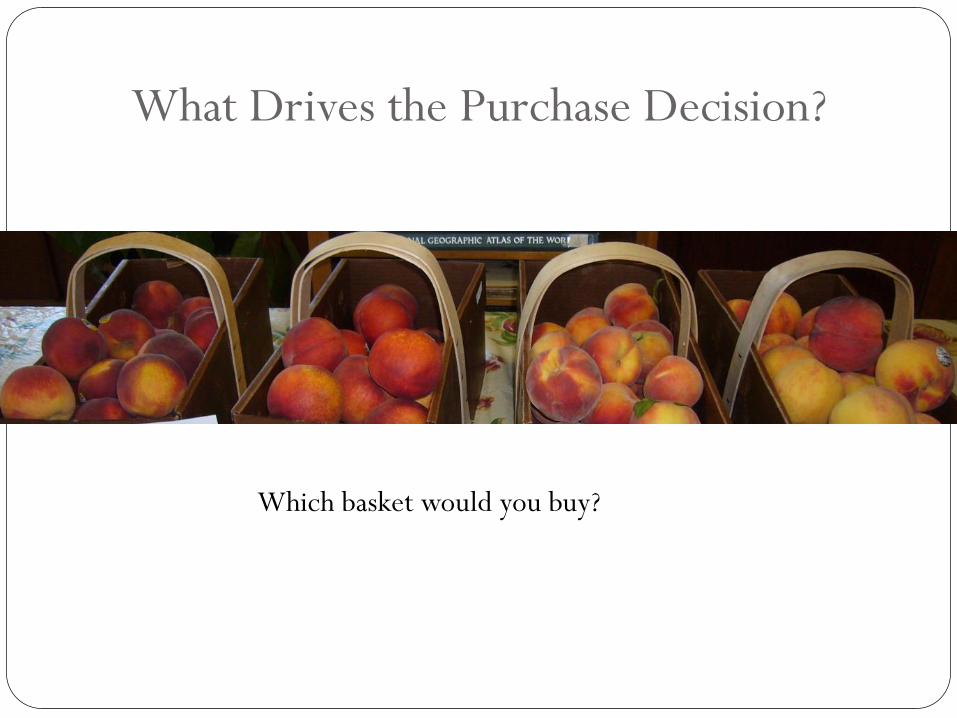
What Drives the Purchase Decision?
Which basket would you buy?

What Drives the Purchase Decision?
CA peaches QC organic peaches CA organic peaches QC peaches
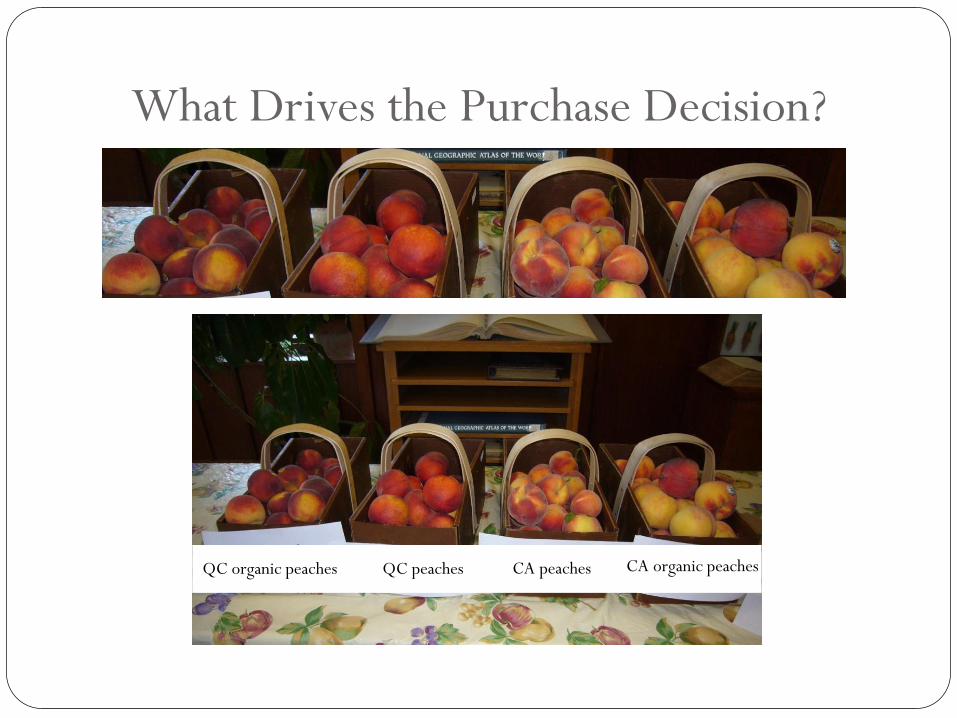
What Drives the Purchase Decision?
QC peaches CA organic peaches CA peaches QC organic peaches

What Drives the Purchase Decision?
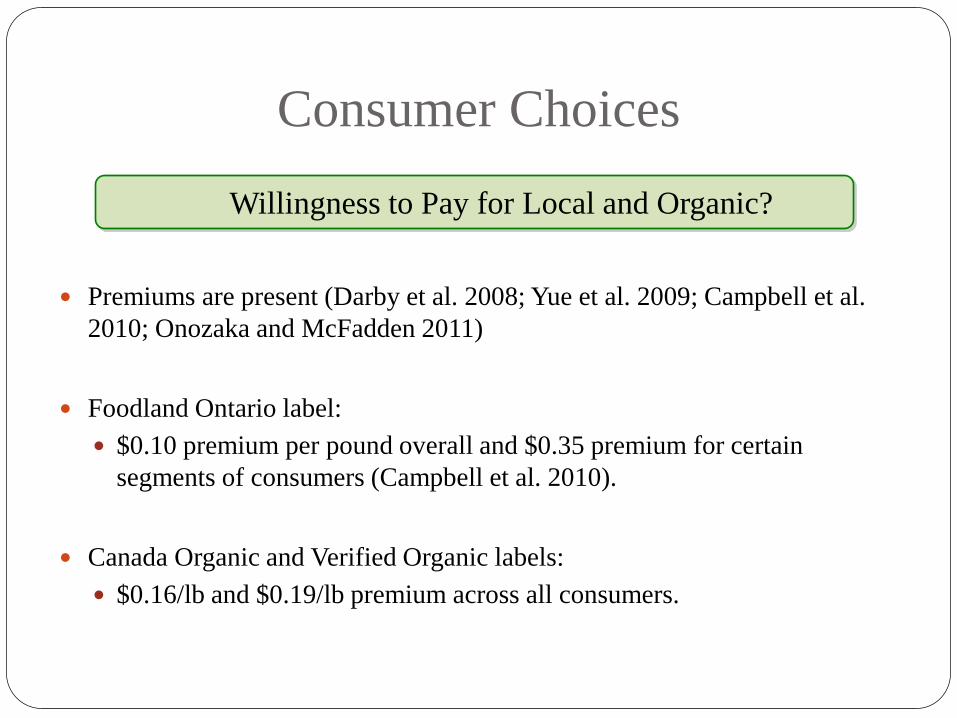
Consumer Choices
Premiums are present (Darby et al. 2008; Yue et al. 2009; Campbell et al.
2010; Onozaka and McFadden 2011)
Foodland Ontario label:
$0.10 premium per pound overall and $0.35 premium for certain
segments of consumers (Campbell et al. 2010).
Canada Organic and Verified Organic labels:
$0.16/lb and $0.19/lb premium across all consumers.
Willingness to Pay for Local and Organic?
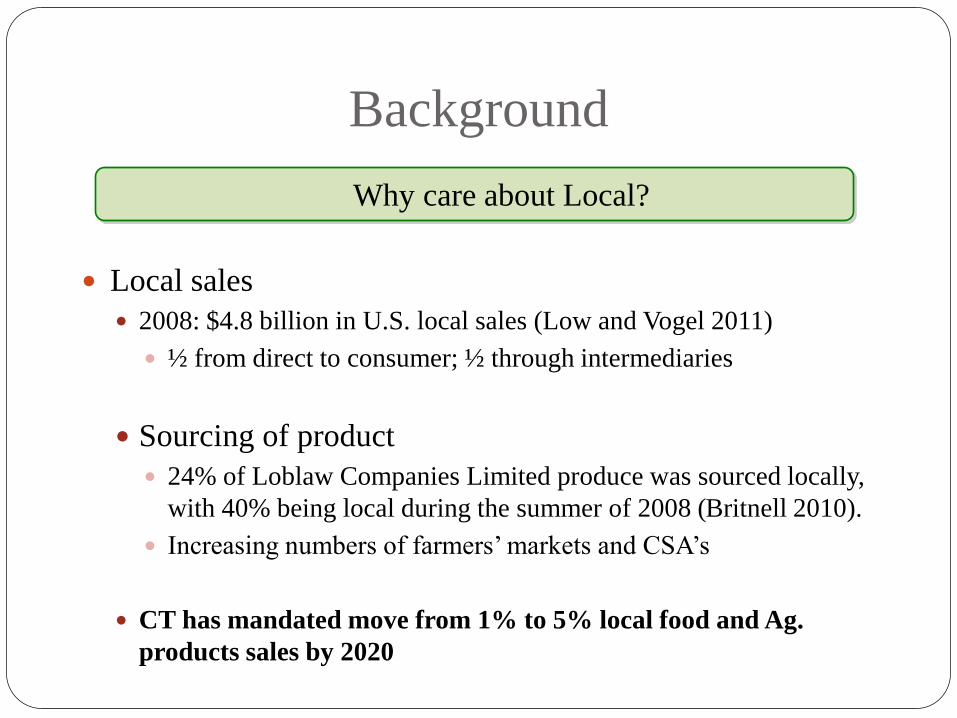
Background
Local sales
2008: $4.8 billion in U.S. local sales (Low and Vogel 2011)
½ from direct to consumer; ½ through intermediaries
Sourcing of product
24% of Loblaw Companies Limited produce was sourced locally,
with 40% being local during the summer of 2008 (Britnell 2010).
Increasing numbers of farmers’ markets and CSA’s
CT has mandated move from 1% to 5% local food and Ag.
products sales by 2020
Why care about Local?

Background
Local consumer is…. Positive indicator:
Higher income (Jekanowski et al. 2000; Brown 2003; Campbell et al. 2010)
Varying indicator:
Gender and higher education (Jekanowski et al. 2000; Brown 2003; Campbell et al. 2010)
Other factors: Environmental group members and involved in agriculture (Brown 2003)
Length of state residence and increased quality perceptions of local (Jekanowski et al. 2000)
Increased view of food being important and shopping at farmer’s market (Campbell et al. 2010)
Who Buys Local?

Introduction – Local food is…
• Darby et al (2008): freshness, support for local economy and farms, and
environmental sustainability.
• Yue et al (2009): freshness and safe to eat.
• Onozaka et al. (2010):
• health benefits and local economy most important
• seasonal availability of fresh produce as being limiting factors.
• Feagan et al (2004): shop at farmer’s markets are motivated by social
interactions, food freshness as well as support for local farmers.
Why Buy Local?

Background
Retail organic food market in 2008 (ERS and export.gov)
in Canada $1.5 billion
In the USA $22.9 billion
Market growth increasing, but at decreasing rate due to recession
Organic food imports: 80% (Canada); 15% (US)
OMAFRA (2009):
2007: 60% consumers bought some organic products
5% consumers buy 50% of all organic foods
Why care about Organic?
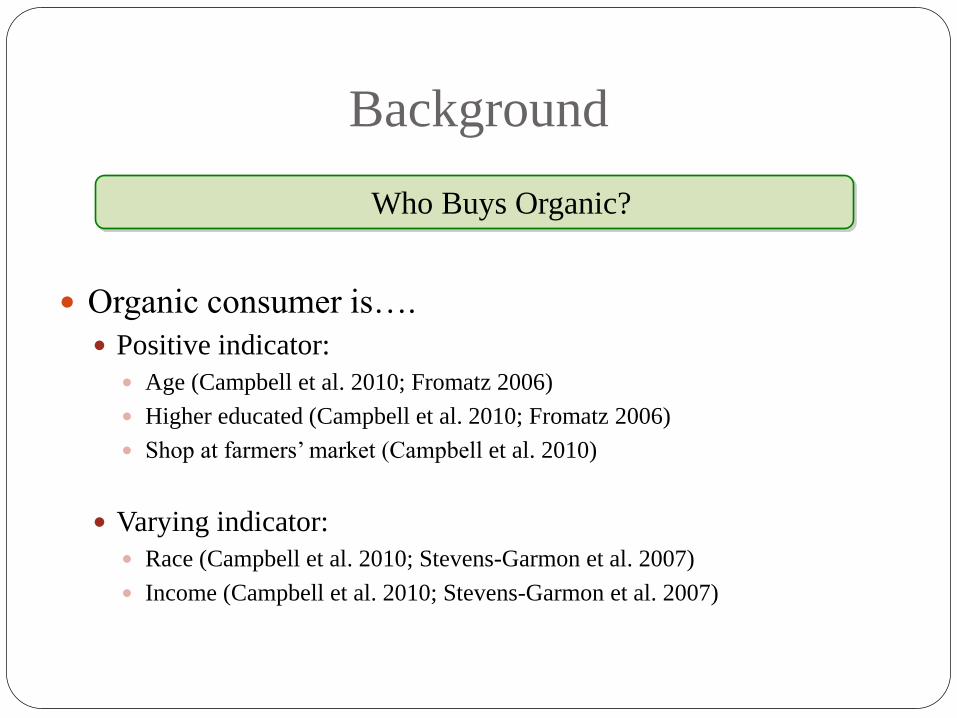
Background
Organic consumer is….
Positive indicator:
Age (Campbell et al. 2010; Fromatz 2006)
Higher educated (Campbell et al. 2010; Fromatz 2006)
Shop at farmers’ market (Campbell et al. 2010)
Varying indicator:
Race (Campbell et al. 2010; Stevens-Garmon et al. 2007)
Income (Campbell et al. 2010; Stevens-Garmon et al. 2007)
Who Buys Organic?
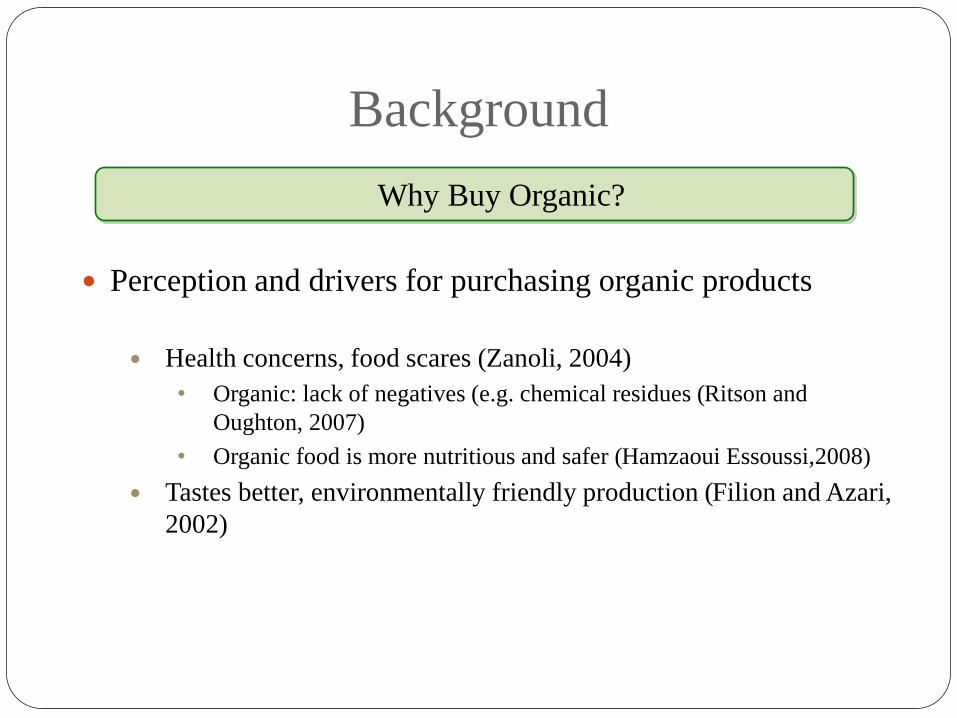
Background
Perception and drivers for purchasing organic products
Health concerns, food scares (Zanoli, 2004)
• Organic: lack of negatives (e.g. chemical residues (Ritson and
Oughton, 2007)
• Organic food is more nutritious and safer (Hamzaoui Essoussi,2008)
Tastes better, environmentally friendly production (Filion and Azari,
2002)
Why Buy Organic?
Background
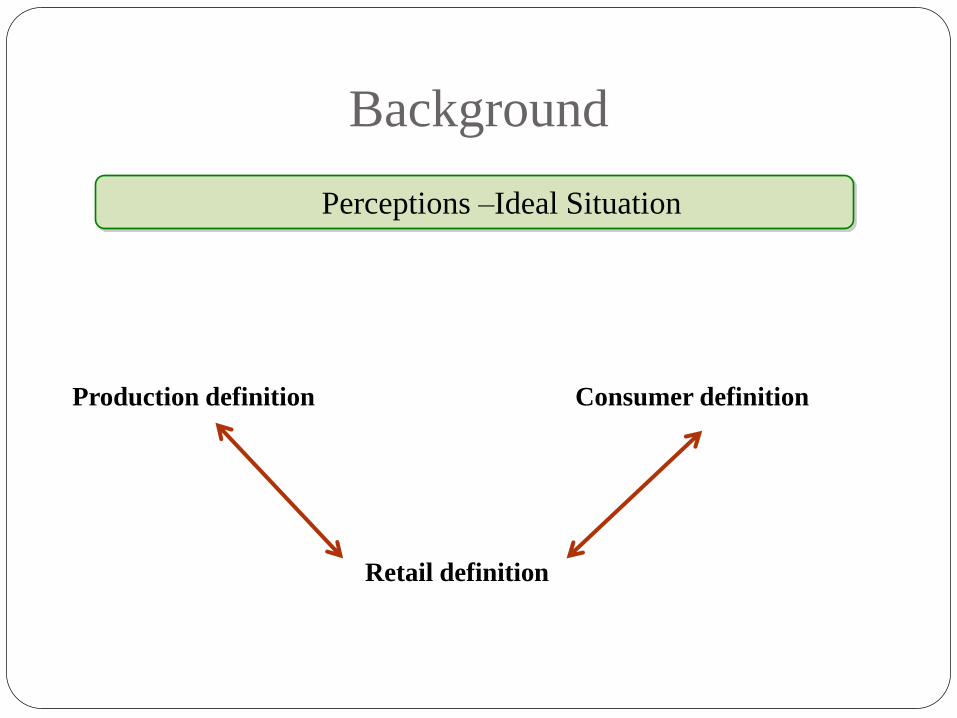
Perceptions –Ideal Situation
Production definition
Retail definition
Consumer definition

Background Canada’s organic food certification system ‘little more than an
extortion racket,’ report says - National Post 11/24/2012
340 comments:
“This is the second article I've seen recently condemning organic food. I have no doubt such articles are planted by big agra.” OnceProudCanadian
It doesn't "condemn organic" at all. It questions the *labelling* and claims of being organic.” steveintoronto
“And one thing the article fails to point out is that organic, by definition, also means (or I have read that it does) locally grown. We ought to be supporting local growers wherever possible.” CaringForThePlanet
“It has been known for years, that the "organic" label means nothing more than higher prices without any advantage over products not labelled thus. I stopped spending my $$$s for this stuff a long time ago. It's just a "feel-good" scam. No benefit to the healthy body & only slight to false pride.” rattler
Background
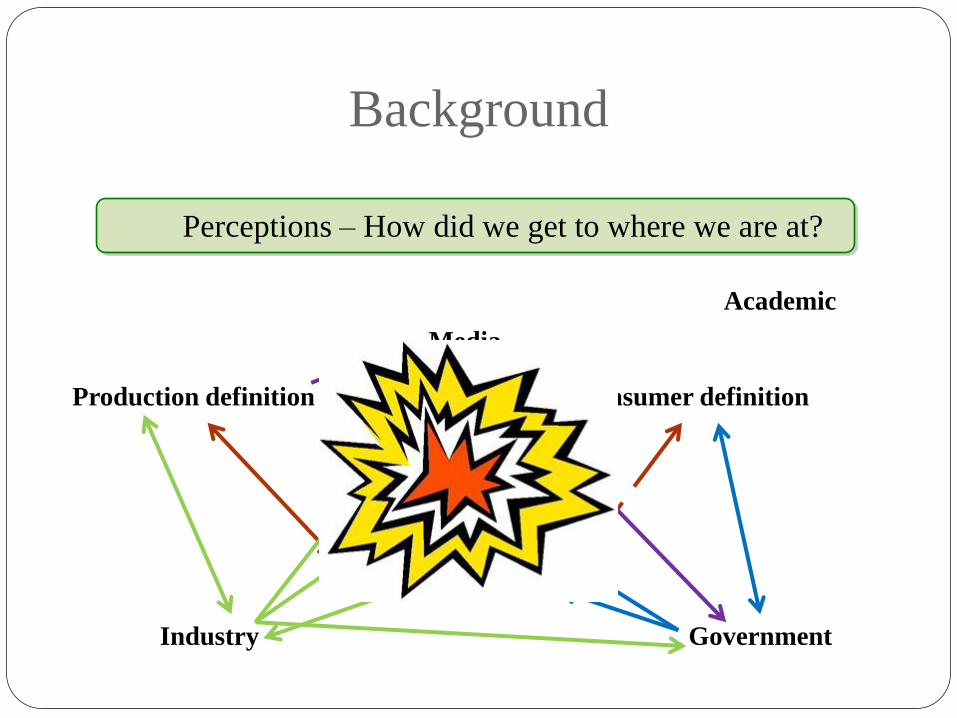
Perceptions – How did we get to where we are at?
Production definition
Retail definition
Consumer definition
Government Industry
Media
Academic
Background
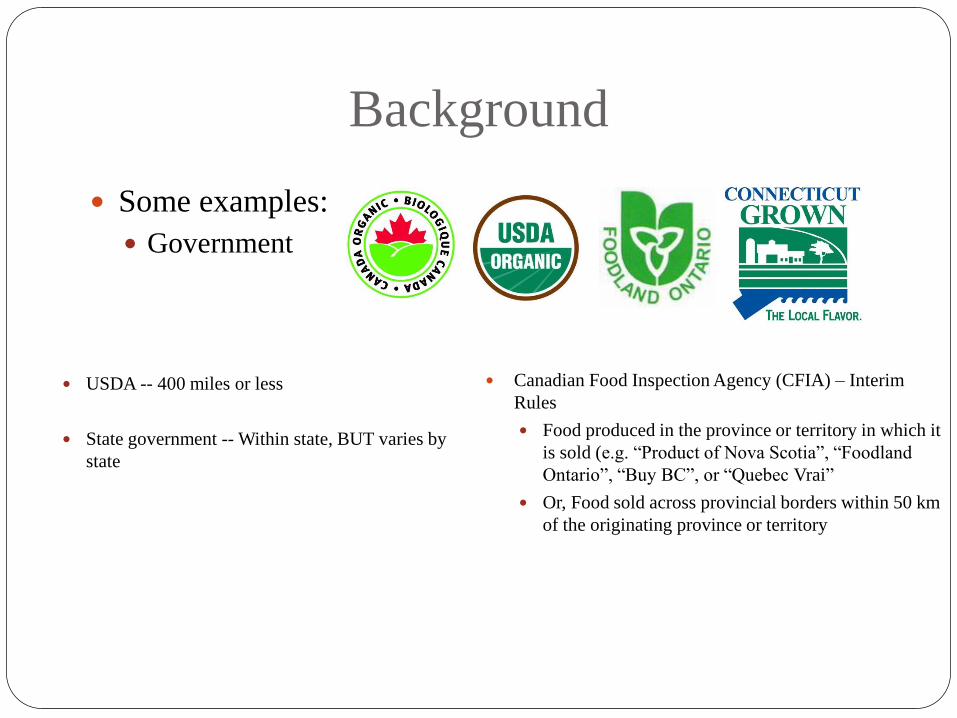
Some examples:
Government
USDA -- 400 miles or less
State government -- Within state, BUT varies by
state
Canadian Food Inspection Agency (CFIA) – Interim
Rules
Food produced in the province or territory in which it
is sold (e.g. “Product of Nova Scotia”, “Foodland
Ontario”, “Buy BC”, or “Quebec Vrai”
Or, Food sold across provincial borders within 50 km
of the originating province or territory

Background
Perceptions – How did we get to where we are at?
Some examples:
Government
Public
“Canada’s organic food certification system
‘little more than an extortion racket,’
report says” National Post, Nov. 2012 by
Adiran Humphreys
Literature Review
When It Comes To Buying Organic, Science And Beliefs Don't
Always Mesh by NPR
But many of you wrote in to us and to Morning Edition to let us know
you weren't happy with the study or our coverage of it. What about
environmental benefits? you asked. How could pesticide residues on
conventionally grown food not be bad for us? What about genetically
modified food? And, aren't you just shilling for the big food companies
http://www.npr.org/blogs/thesalt/2012/09/07/160681396/when-it-
comes-to-buying-organic-science-and-beliefs-dont-always-mesh
Background
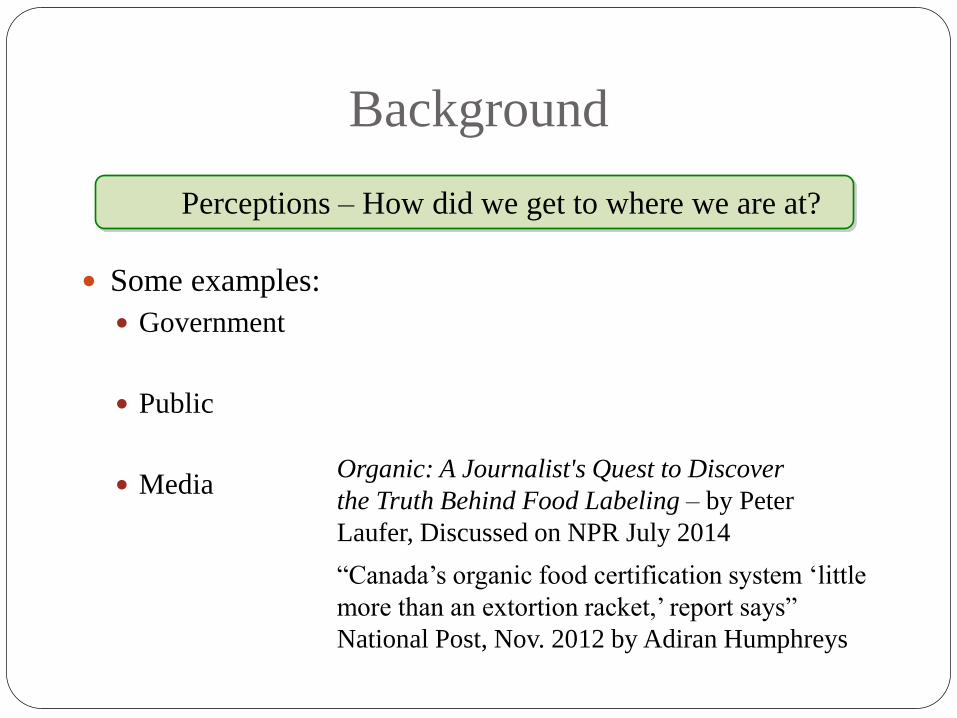
Perceptions – How did we get to where we are at?
Some examples:
Government
Public
Media
Organic: A Journalist's Quest to Discover
the Truth Behind Food Labeling – by Peter
Laufer, Discussed on NPR July 2014
“Canada’s organic food certification system ‘little
more than an extortion racket,’ report says”
National Post, Nov. 2012 by Adiran Humphreys
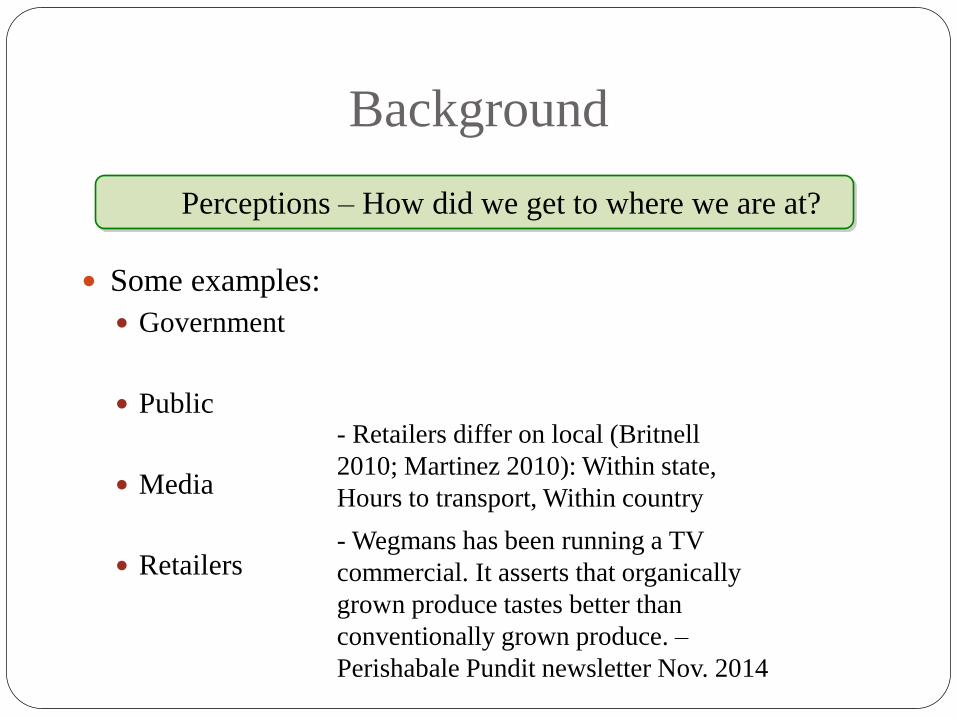
Background
Perceptions – How did we get to where we are at?
Some examples:
Government
Public
Media
Retailers
- Wegmans has been running a TV
commercial. It asserts that organically
grown produce tastes better than
conventionally grown produce. –
Perishabale Pundit newsletter Nov. 2014
- Retailers differ on local (Britnell
2010; Martinez 2010): Within state,
Hours to transport, Within country
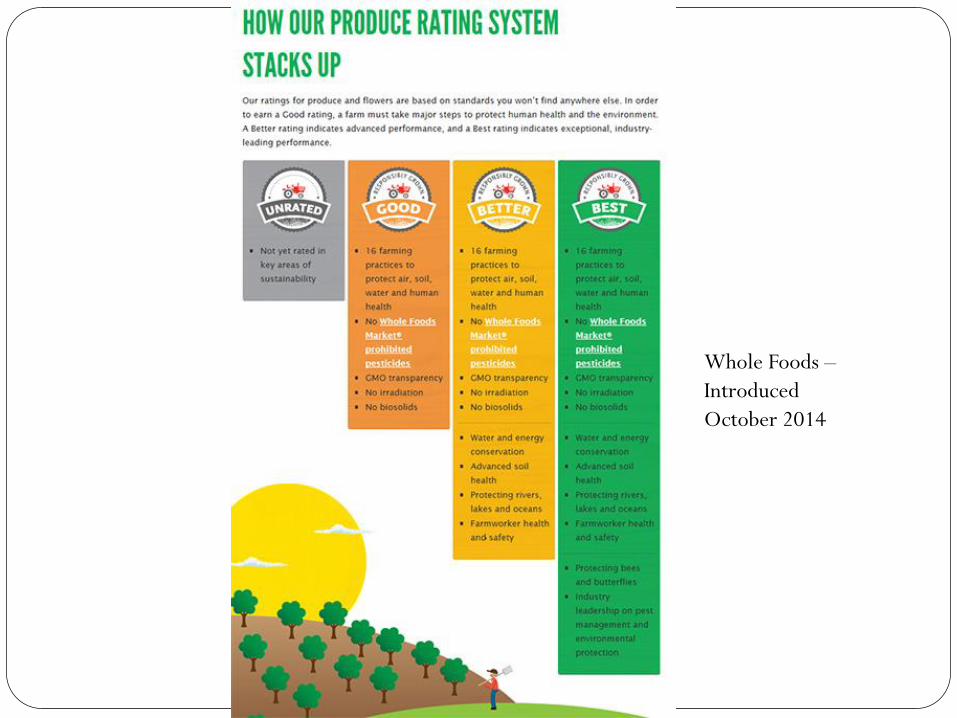
Whole Foods –
Introduced
October 2014
(Mis)Perceptions
So what do consumers think……
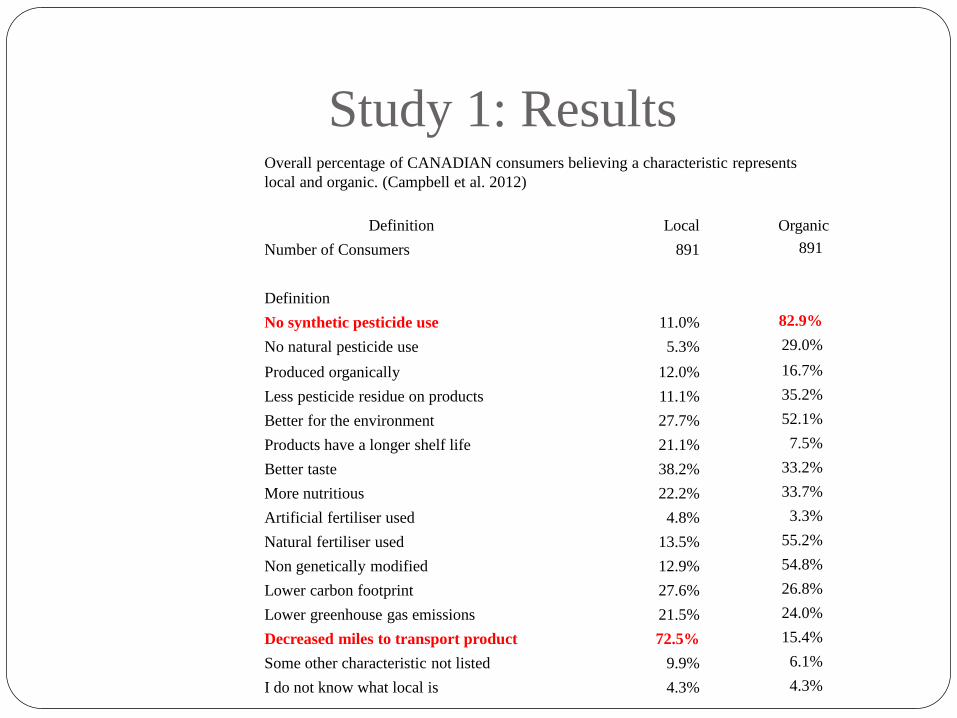
Study 1: Results Overall percentage of CANADIAN consumers believing a characteristic represents
local and organic. (Campbell et al. 2012)
Definition Local Organic
Number of Consumers 891 891
Definition
No synthetic pesticide use 11.0% 82.9%
No natural pesticide use 5.3% 29.0%
Produced organically 12.0% 16.7%
Less pesticide residue on products 11.1% 35.2%
Better for the environment 27.7% 52.1%
Products have a longer shelf life 21.1% 7.5%
Better taste 38.2% 33.2%
More nutritious 22.2% 33.7%
Artificial fertiliser used 4.8% 3.3%
Natural fertiliser used 13.5% 55.2%
Non genetically modified 12.9% 54.8%
Lower carbon footprint 27.6% 26.8%
Lower greenhouse gas emissions 21.5% 24.0%
Decreased miles to transport product 72.5% 15.4%
Some other characteristic not listed 9.9% 6.1%
I do not know what local is 4.3% 4.3%
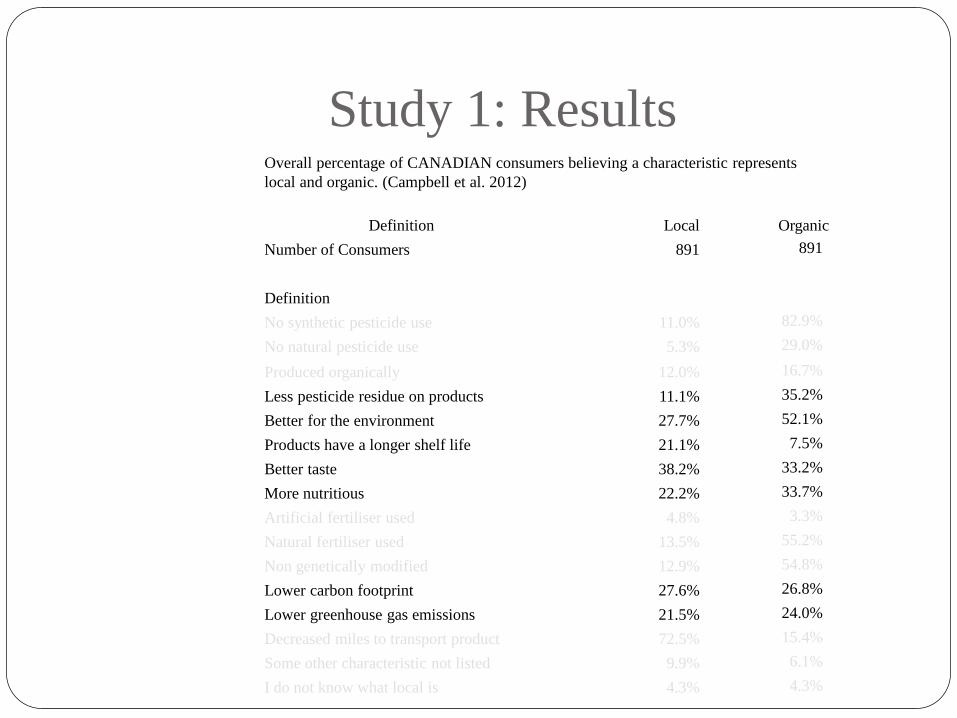
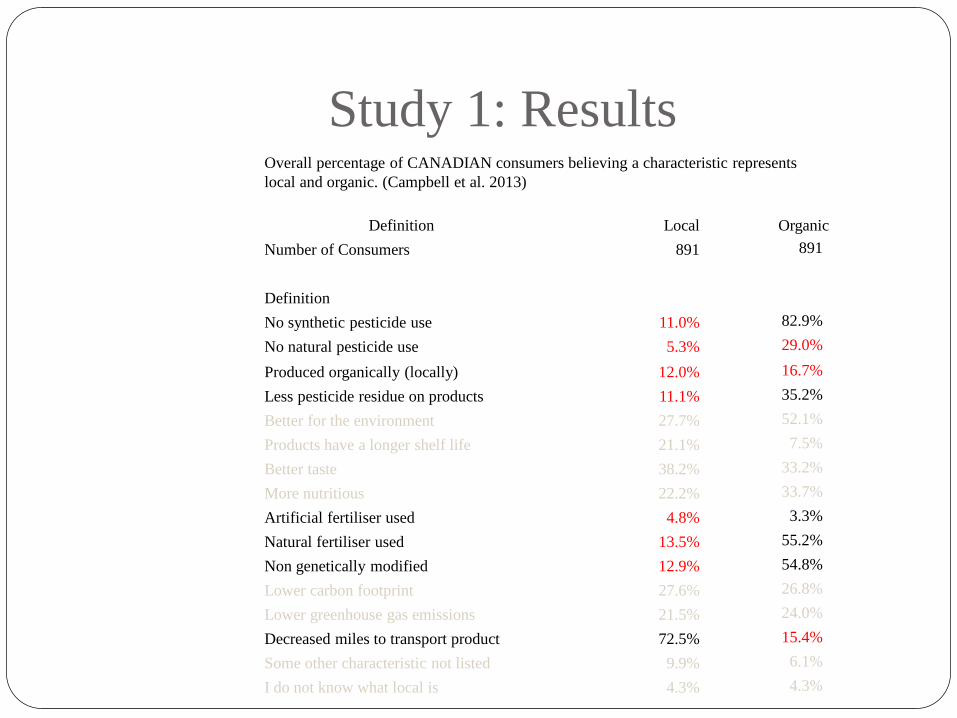
Study 1: Results Overall percentage of CANADIAN consumers believing a characteristic represents
local and organic. (Campbell et al. 2013)
Definition Local Organic
Number of Consumers 891 891
Definition
No synthetic pesticide use 11.0% 82.9%
No natural pesticide use 5.3% 29.0%
Produced organically (locally) 12.0% 16.7%
Less pesticide residue on products 11.1% 35.2%
Better for the environment 27.7% 52.1%
Products have a longer shelf life 21.1% 7.5%
Better taste 38.2% 33.2%
More nutritious 22.2% 33.7%
Artificial fertiliser used 4.8% 3.3%
Natural fertiliser used 13.5% 55.2%
Non genetically modified 12.9% 54.8%
Lower carbon footprint 27.6% 26.8%
Lower greenhouse gas emissions 21.5% 24.0%
Decreased miles to transport product 72.5% 15.4%
Some other characteristic not listed 9.9% 6.1%
I do not know what local is 4.3% 4.3%
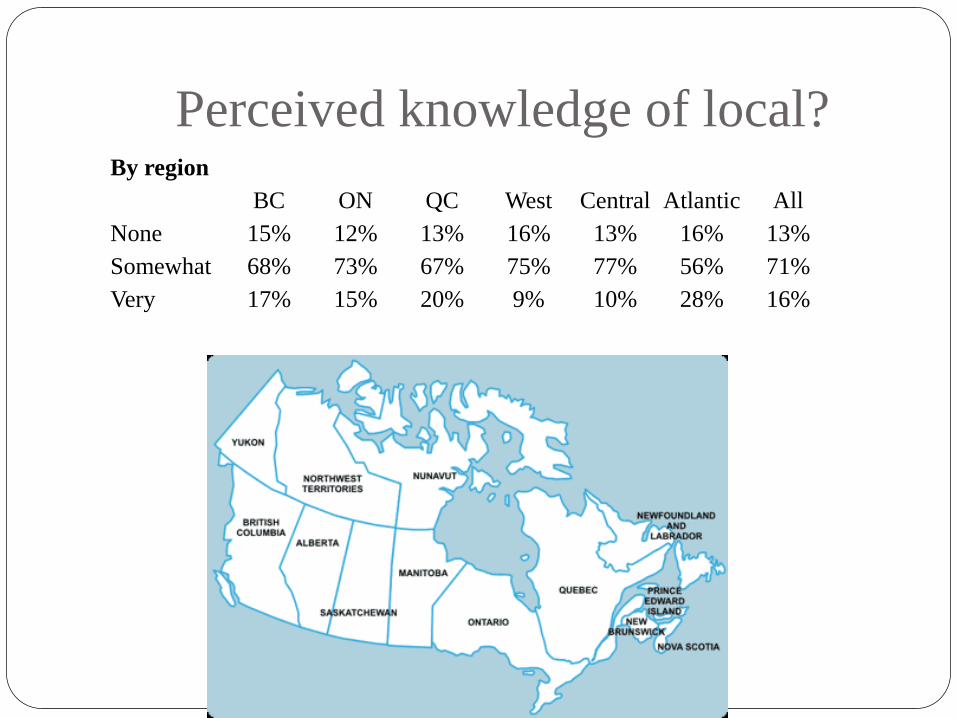
Perceived knowledge of local? By region
BC ON QC West Central Atlantic All
None 15% 12% 13% 16% 13% 16% 13%
Somewhat 68% 73% 67% 75% 77% 56% 71%
Very 17% 15% 20% 9% 10% 28% 16%
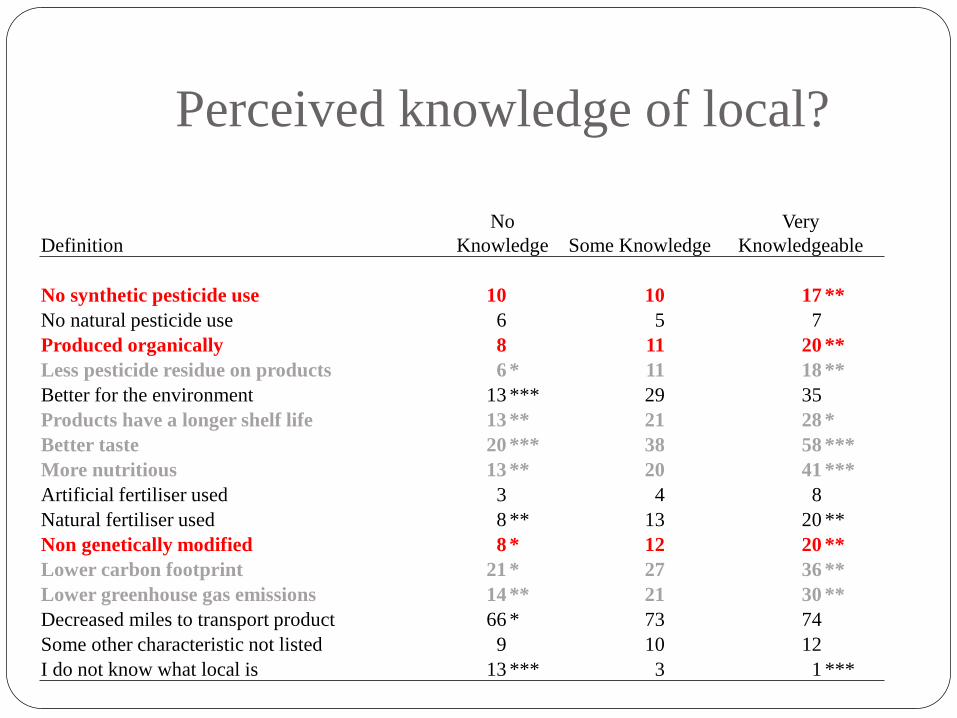
Definition
No
Knowledge Some Knowledge
Very
Knowledgeable
No synthetic pesticide use 10 10 17 **
No natural pesticide use 6 5 7
Produced organically 8 11 20 **
Less pesticide residue on products 6 * 11 18 **
Better for the environment 13 *** 29 35
Products have a longer shelf life 13 ** 21 28 *
Better taste 20 *** 38 58 ***
More nutritious 13 ** 20 41 ***
Artificial fertiliser used 3 4 8
Natural fertiliser used 8 ** 13 20 **
Non genetically modified 8 * 12 20 **
Lower carbon footprint 21 * 27 36 **
Lower greenhouse gas emissions 14 ** 21 30 **
Decreased miles to transport product 66 * 73 74
Some other characteristic not listed 9 10 12
I do not know what local is 13 *** 3 1 ***
Perceived knowledge of local?
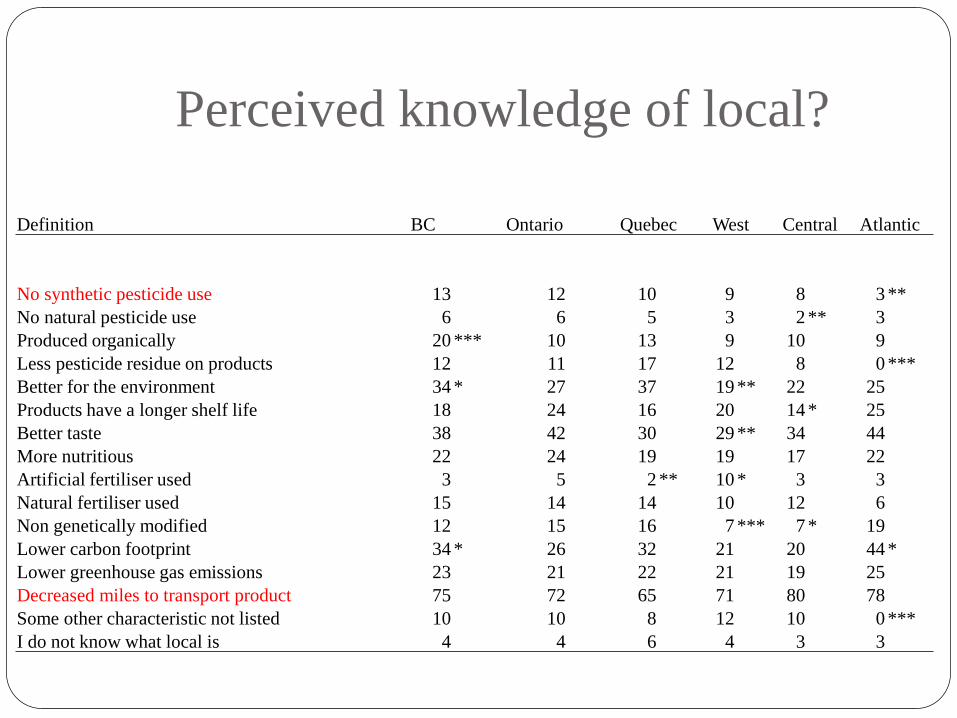
Definition BC Ontario Quebec West Central Atlantic
No synthetic pesticide use 13 12 10 9 8 3 **
No natural pesticide use 6 6 5 3 2 ** 3
Produced organically 20 *** 10 13 9 10 9
Less pesticide residue on products 12 11 17 12 8 0 ***
Better for the environment 34 * 27 37 19 ** 22 25
Products have a longer shelf life 18 24 16 20 14 * 25
Better taste 38 42 30 29 ** 34 44
More nutritious 22 24 19 19 17 22
Artificial fertiliser used 3 5 2 ** 10 * 3 3
Natural fertiliser used 15 14 14 10 12 6
Non genetically modified 12 15 16 7 *** 7 * 19
Lower carbon footprint 34 * 26 32 21 20 44 *
Lower greenhouse gas emissions 23 21 22 21 19 25
Decreased miles to transport product 75 72 65 71 80 78
Some other characteristic not listed 10 10 8 12 10 0 ***
I do not know what local is 4 4 6 4 3 3
Perceived knowledge of local?
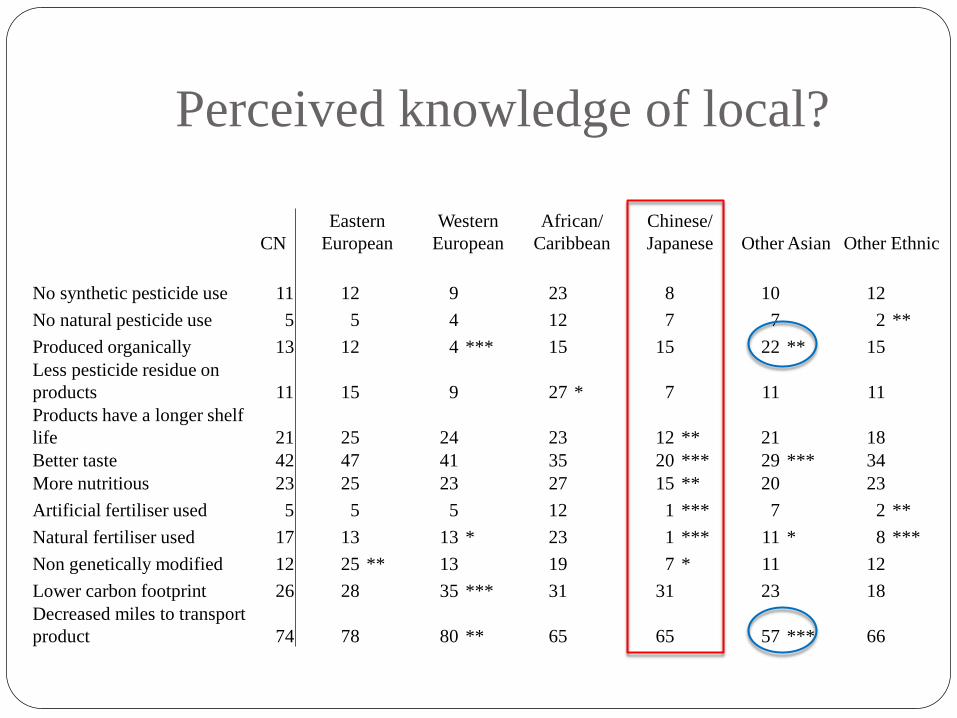
CN
Eastern
European
Western
European
African/
Caribbean
Chinese/
Japanese Other Asian Other Ethnic
No synthetic pesticide use 11 12 9 23 8 10 12
No natural pesticide use 5 5 4 12 7 7 2 **
Produced organically 13 12 4 *** 15 15 22 ** 15
Less pesticide residue on
products 11 15 9 27 * 7 11 11
Products have a longer shelf
life 21 25 24 23 12 ** 21 18
Better taste 42 47 41 35 20 *** 29 *** 34
More nutritious 23 25 23 27 15 ** 20 23
Artificial fertiliser used 5 5 5 12 1 *** 7 2 **
Natural fertiliser used 17 13 13 * 23 1 *** 11 * 8 ***
Non genetically modified 12 25 ** 13 19 7 * 11 12
Lower carbon footprint 26 28 35 *** 31 31 23 18
Decreased miles to transport
product 74 78 80 ** 65 65 57 *** 66
Perceived knowledge of local?
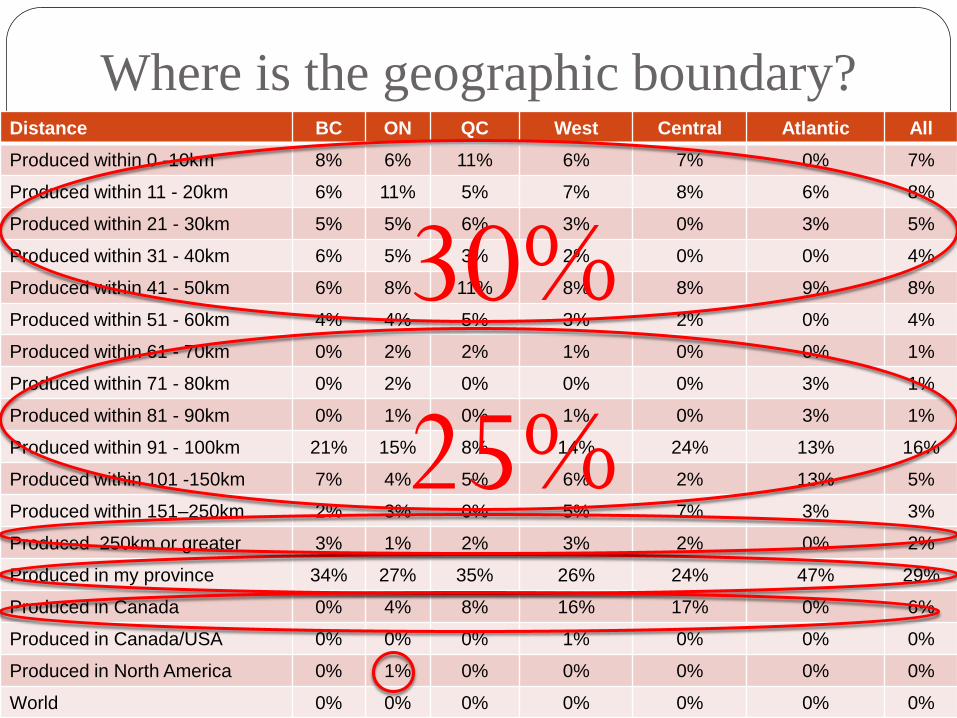
Distance BC ON QC West Central Atlantic All
Produced within 0 -10km 8% 6% 11% 6% 7% 0% 7%
Produced within 11 - 20km 6% 11% 5% 7% 8% 6% 8%
Produced within 21 - 30km 5% 5% 6% 3% 0% 3% 5%
Produced within 31 - 40km 6% 5% 3% 2% 0% 0% 4%
Produced within 41 - 50km 6% 8% 11% 8% 8% 9% 8%
Produced within 51 - 60km 4% 4% 5% 3% 2% 0% 4%
Produced within 61 - 70km 0% 2% 2% 1% 0% 0% 1%
Produced within 71 - 80km 0% 2% 0% 0% 0% 3% 1%
Produced within 81 - 90km 0% 1% 0% 1% 0% 3% 1%
Produced within 91 - 100km 21% 15% 8% 14% 24% 13% 16%
Produced within 101 -150km 7% 4% 5% 6% 2% 13% 5%
Produced within 151–250km 2% 3% 0% 5% 7% 3% 3%
Produced 250km or greater 3% 1% 2% 3% 2% 0% 2%
Produced in my province 34% 27% 35% 26% 24% 47% 29%
Produced in Canada 0% 4% 8% 16% 17% 0% 6%
Produced in Canada/USA 0% 0% 0% 1% 0% 0% 0%
Produced in North America 0% 1% 0% 0% 0% 0% 0%
World 0% 0% 0% 0% 0% 0% 0%
Where is the geographic boundary?
30%
25%

Consumer Profiles
• 50km or less:
• Demographic – lower income, not from Central or West,
not Eastern European
• Behaviour – none
• Geographic location: increased household size
Consumer Profiles
• 100 mile diet:
• Demographic – male, higher educated, not from Quebec
and not ethnic
• Behaviour – none
• Geographic location: growing area population, increased
household size

Consumer Profiles
• Within province:
• Demographic – lower educated, from BC, Quebec, and
Atlantic, Eastern European, Other Asian and
African/Caribbean
• Behaviour – shop at chain store but not farmers' markets,
food matters, purchase increased amounts of local
• Geographic location: younger, higher income areas
Consumer Profiles
• Within Canada:
• Demographic – not from BC, lived less time in Canada
• Behaviour – not "very knowledgeable,” shop at chain
store
• Geographic location: older, higher employment levels

Are There Differences?

Local Perception
Total U.S. Canada
Number 2517 1713 803
I do not know what local (organic) is 4% 4% 4%
Decreased miles to transport product 67% 65% 72% ***
Better for the environment 40% 37% 45% ***
Lower carbon footprint 35% 32% 41% ***
Lower greenhouse gas emissions 26% 23% 31% ***
Less pesticide residue on products 20% 21% 18%
No synthetic pesticide use 17% 17% 16%
Produced organically 23% 25% 20% ***
Artificial fertiliser used 3% 3% 3%
Natural fertiliser used 21% 21% 21%
No natural pesticide use 9% 10% 8%
Non genetically modified 22% 22% 23%
Products have a longer shelf life 23% 21% 26% ***
Better taste 44% 44% 44%
More nutritious 29% 28% 32% *
Higher prices 21% 20% 23% *
Some other characteristic not listed 5% 5% 6%
Results: Study 2
Given the varying meanings of local
and that they are often used
interchangeably, resulting in
confusion amongst consumers
(CPMA 2011).

Organic Perception
Total U.S. Canada
Number 2517 1713 803
I do not know what local (organic) is 3% 3% 3%
Decreased miles to transport product 12% 12% 14%
Better for the environment 53% 53% 53%
Lower carbon footprint 30% 30% 29%
Lower greenhouse gas emissions 24% 24% 24%
Less pesticide residue on products 51% 50% 52%
Produced locally 17% 17% 18%
No synthetic pesticide use 67% 67% 66%
Artificial fertiliser used 4% 5% 4%
Natural fertiliser used 61% 60% 64% *
No natural pesticide use 25% 26% 24%
Non genetically modified 57% 56% 59%
Products have a longer shelf life 9% 9% 10%
Better taste 36% 35% 37%
More nutritious 40% 41% 38%
Higher prices 54% 53% 57% **
Some other characteristic not listed 0% 0% 0%
Results: Study 2
Canadian Organic Growers (2011):
“Sadly, "local" and "organic" have
had the misfortune of entering our
vocabulary as separate concepts and
then getting jumbled into one,
unclear concept.”

Local: Accurate Definition
• Accurate – Decreased miles to transport
• Demographic – Older Caucasian females living in suburban
areas (compared to urban)
• Behavior – Heard of terms sustainable and eco-friendly,
purchase less organic produce, purchase more local produce
Local: Nutrition/Taste
• Nutrition/Taste – More nutritious/Better tasting
• Demographic
• Lower income (both) -- who buys and will pay premium?
• Older (better taste)
• Not urban (better taste)
• CANADIANS (more nutritious)
• Behavior – Heard of term eco-friendly, purchase MORE
organic produce

Local: Environmental
• Environmental – Better environment, lower carbon
footprint, lower greenhouse emissions
• Demographic – CANADIAN, younger, not suburban area,
Caucasian
• Behavior – Heard of terms sustainable and eco-friendly,
purchase MORE organic produce
Local: Environmental (Inaccurate)
• Environmental – Organic, no synthetic pesticide use, less
pesticide residue
• Demographic – Younger, rural, higher educated
• Behavior – Heard of term eco-friendly, purchase MORE
organic produce
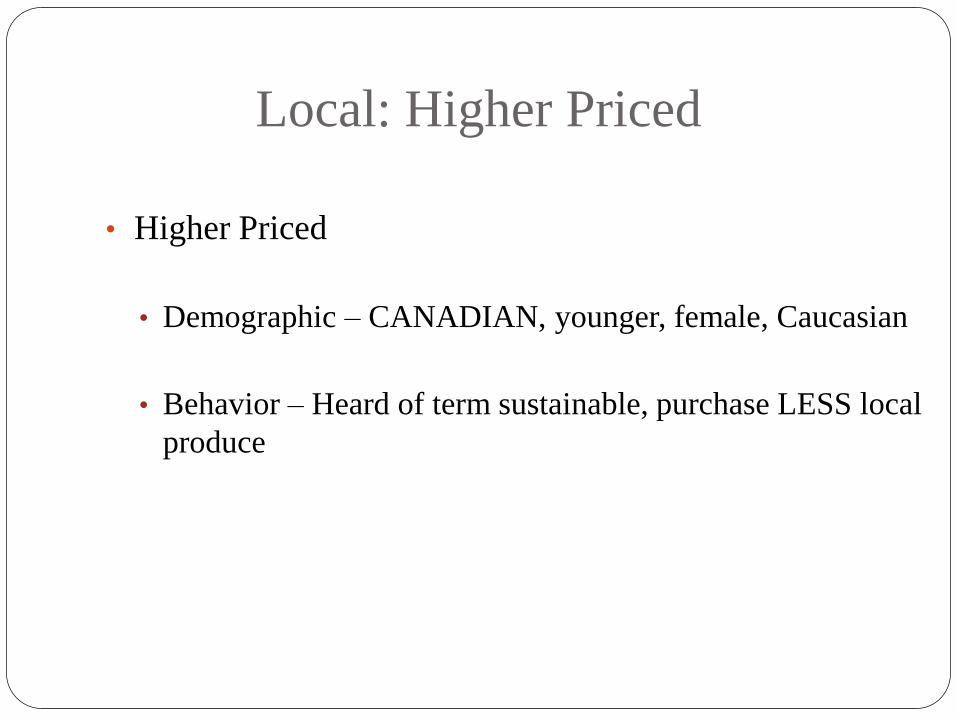
Local: Higher Priced
• Higher Priced
• Demographic – CANADIAN, younger, female, Caucasian
• Behavior – Heard of term sustainable, purchase LESS local
produce
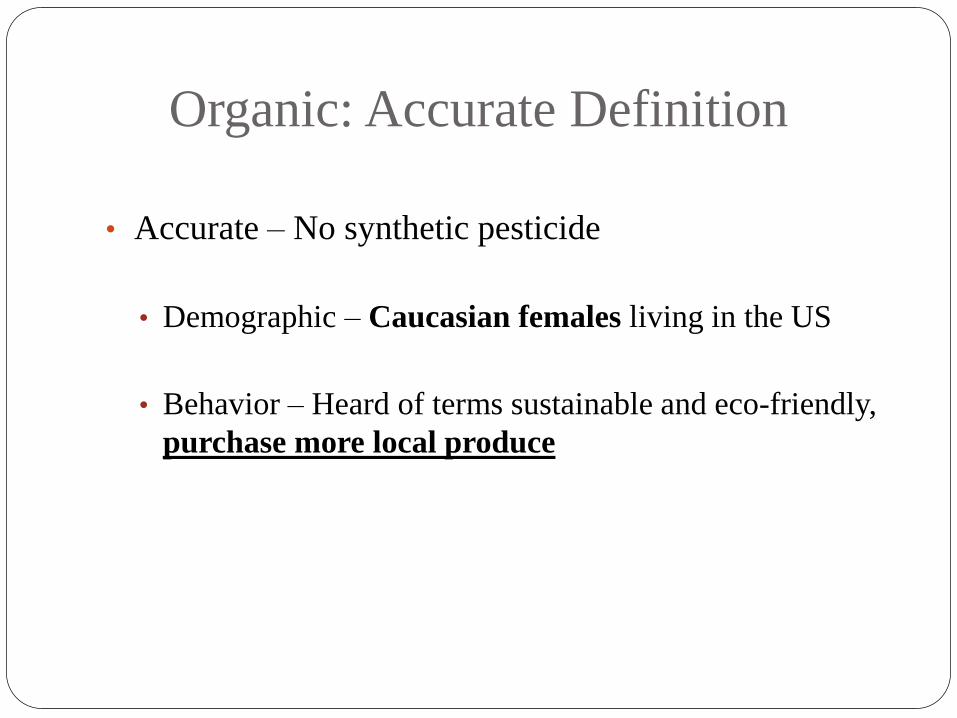
Organic: Accurate Definition
• Accurate – No synthetic pesticide
• Demographic – Caucasian females living in the US
• Behavior – Heard of terms sustainable and eco-friendly,
purchase more local produce
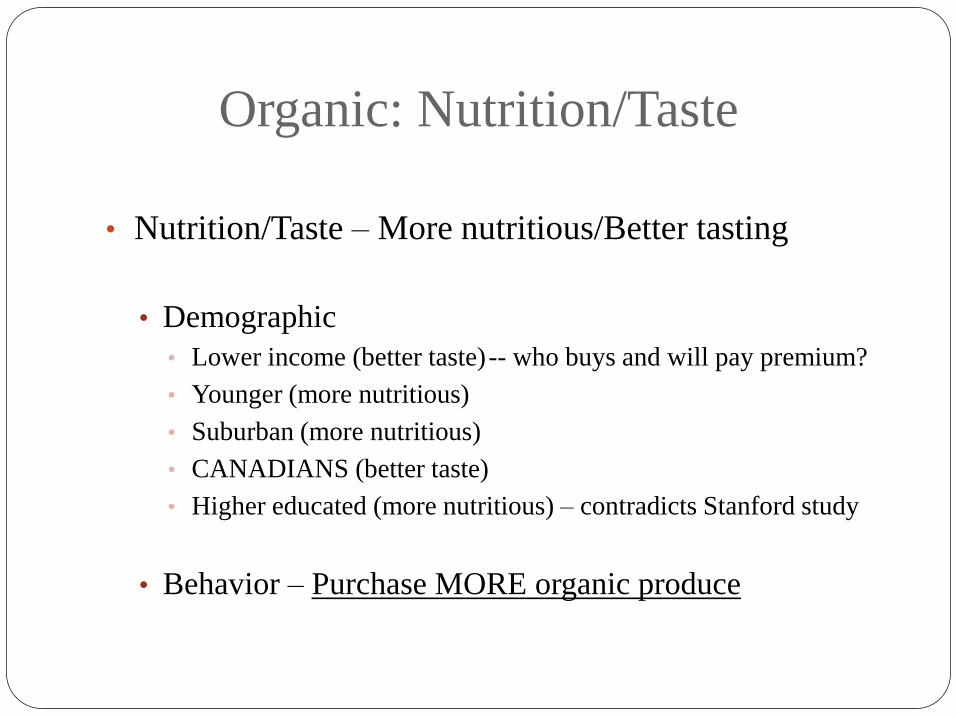
Organic: Nutrition/Taste
• Nutrition/Taste – More nutritious/Better tasting
• Demographic
• Lower income (better taste) -- who buys and will pay premium?
• Younger (more nutritious)
• Suburban (more nutritious)
• CANADIANS (better taste)
• Higher educated (more nutritious) – contradicts Stanford study
• Behavior – Purchase MORE organic produce

Organic: Environmental
• Environmental – Better environment, lower carbon
footprint, lower greenhouse emissions, less pesticide
residue
• Demographic – Lower incomes, Caucasian, higher education
• Behavior – Heard of terms sustainable and eco-friendly,
purchase MORE organic produce
•
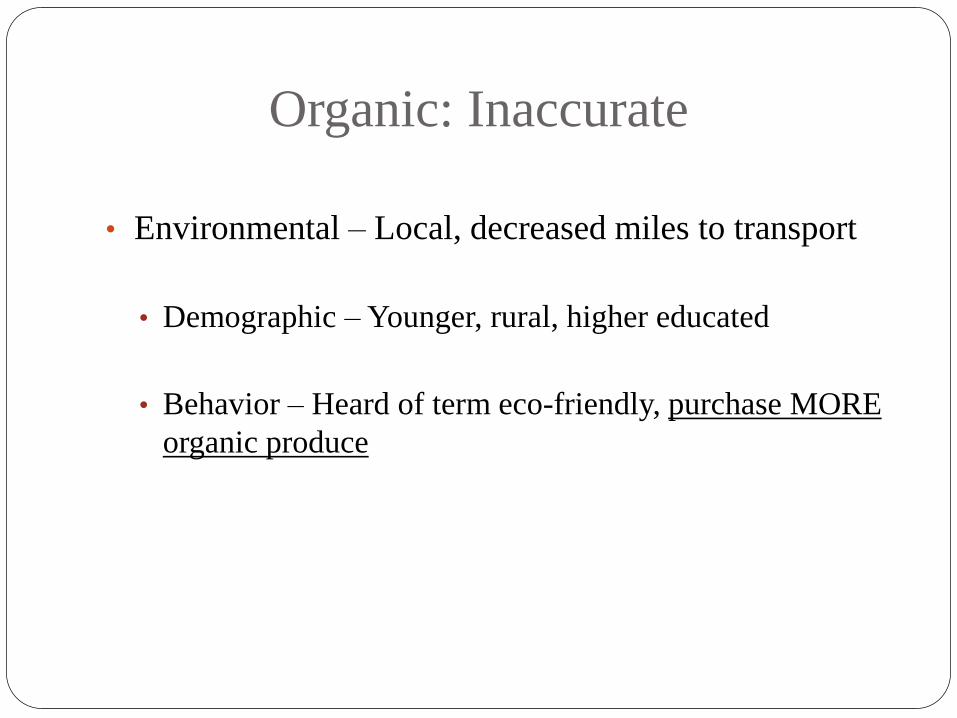
Organic: Inaccurate
• Environmental – Local, decreased miles to transport
• Demographic – Younger, rural, higher educated
• Behavior – Heard of term eco-friendly, purchase MORE
organic produce

Organic: Higher Priced
• Higher Priced
• Demographic – Live in urban area, female, Caucasian
• Behavior – Heard of term sustainable and eco-friendly,
purchase LESS organic produce
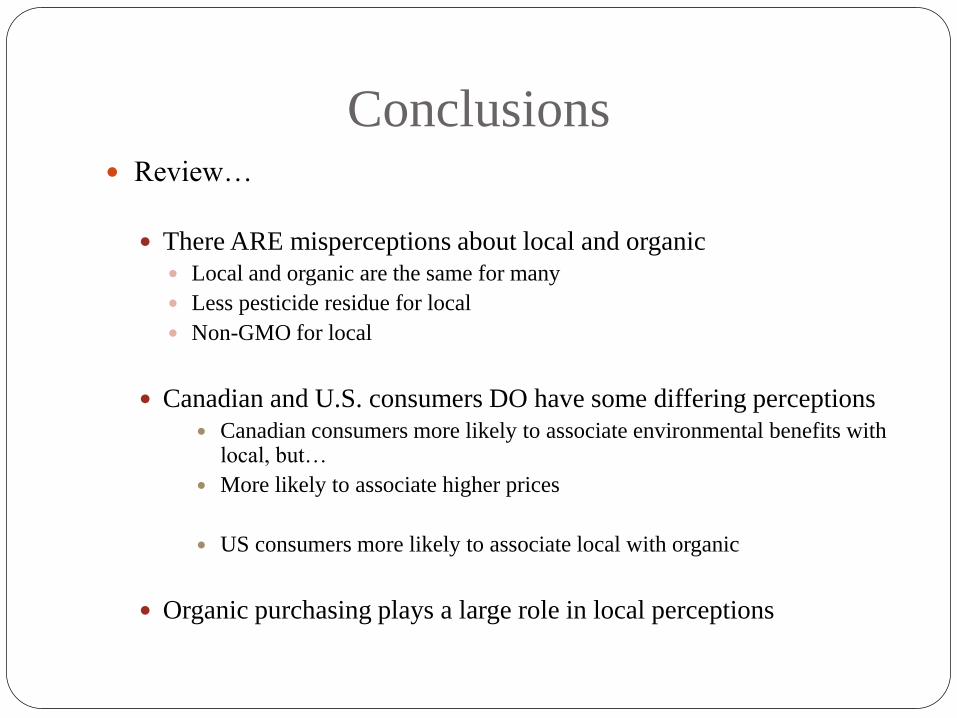
Conclusions Review…
There ARE misperceptions about local and organic
Local and organic are the same for many
Less pesticide residue for local
Non-GMO for local
Canadian and U.S. consumers DO have some differing perceptions
Canadian consumers more likely to associate environmental benefits with local, but…
More likely to associate higher prices
US consumers more likely to associate local with organic
Organic purchasing plays a large role in local perceptions

Conclusions
As a Value Chain member, why should you care what
is perceived as local and organic?
Because:
May alienate market (e.g. buy a Rolex but really a Rolax)
Creates efficiencies when understand market (e.g.
marketing)
Creates a better relationship with your clientele
Trust
Thank You


