20
Perceptions and Reality Bobby Duffy & Tom Frere-Smith JANUARY 2014 10 things we should know about attitudes to immigration in the UK
Perceptions and Reality
Bobby Duffy & Tom Frere-Smith
JANUARY 2014
10 things we should know about attitudes to immigration in the UK


Ipsos MORI has completed a major review of attitudes towards immigration for
Unbound Philanthropy (please see: www.ipsos-mori.com/immigration-review). The review is
designed to be as comprehensive and balanced as possible, to act as a resource for those
interested in public opinion on immigration.
This summary document picks out 10 key messages from the full review.
1. We weren’t always this worried about immigration…
National concern increased following the rise in numbers…
The surge in concern about immigration as a national issue in the early 2000s (as
measured by Ipsos MORI’s Issues Index) followed rather than preceded the increase in
immigrant numbers. In fact, there was a lag: it took a while for the public to notice and become
concerned about the steep increase in net migration from 1999 onwards.
Of course, the relationship is far from perfect, and it is not possible from this simple
pattern to say that the increase in numbers is directly driving views. But the relationship is clear
enough to conclude that the number of immigrants is important to public attitudes.
Perceptions and Reality 10 things we should know
about attitudes to immigration in the UK
Figure 1: Immigration as an important issue by UK net migration, 1974 - 2013
100
50
0
150
200
20
10
0
30
40250
300
-50
-100
Jan-
74Ja
n-75
Jan-
76Ja
n-77
Jan-
78Ja
n-79
Jan-
80Ja
n-81
Jan-
82Ja
n-83
Jan-
84Ja
n-85
Jan-
86Ja
n-87
Jan-
88Ja
n-89
Jan-
90Ja
n-91
Jan-
92Ja
n-93
Jan-
94Ja
n-95
Jan-
96Ja
n-97
Jan-
98Ja
n-99
Jan-
00Ja
n-01
Jan-
02Ja
n-03
Jan-
04Ja
n-05
Jan-
06Ja
n-07
Jan-
08Ja
n-09
Jan-
10Ja
n-11
Jan-
12Ja
n-13
% mentions of immigration/race relations as the most/another important issue to the British public
Net migration
DATE
THOUSANDS
%

Figure 2: Immigration as an important issue compared with other measures of concern about immigration, among the British public
40
30
20
50
60
70
80
90
10
0
Jan-
74N
ov-7
4S
ep-7
5Ju
l-76
May
-77
Mar
-78
Jan-
79N
ov-7
9S
ep-8
0Ju
l-81
May
-82
Mar
-83
Jan-
84N
ov-8
4S
ep-8
5Ju
l-86
May
-87
Mar
-88
Jan-
89N
ov-8
9S
ep-9
0Ju
l-91
May
-92
Mar
-93
Jan-
94N
ov-9
4S
ep-9
5Ju
l-96
May
-97
Mar
-98
Jan-
99N
ov-9
9S
ep-0
0Ju
l-01
May
-02
Mar
-03
Jan-
04N
ov-0
4S
ep-0
5Ju
l-06
May
-07
Mar
-08
Jan-
09N
ov-0
9S
ep-1
0Ju
l-11
May
-12
Mar
-13
% agree there aretoo many immigrants
in Britain
% agree Britain is indanger of being
swamped by peoplewith different cultures
% mentions ofimmigration/race relations
as the most/anotherimportant issue to the
British public
%
DATE
…but the majority have been against immigration for much longer…
However, many other measures of concern about immigration have relatively little
relationship with changes in net migration levels. Agreement with the statement that there
are “too many immigrants” was 63% in 1989 when immigration was barely registering on the
Issues Index and net migration figures were still low, as Figure 2 below shows. Going further
back, in 1978, up to 70% of the public agreed we were in danger of “being swamped” by
other cultures, when net migration was around 0.
This suggests that even if immigration is much reduced, we are still likely to see a high
baseline of concern when measuring views through these types of questions: nearly two-
thirds wanted a reduction in immigration in 1995 when net migration was running at around
60,000, so there is a good chance we will see agreement with these types of question
remain high even if the government can get back down to “tens of thousands”.
… and people started writing to their MPs before general concern rose
Figure 3 shows net migration levels and the Issues Index results against results from a
question on our regular survey of MPs, which asks them what issues their constituents have
raised with them (a measure of “MPs’ Postbag”). And it’s clear that the rising salience of
immigration reported by MPs appears to pre-date that seen in the Issues Index, and closely
matches net migration levels.
It is too strong to say that the MPs’ Postbag data provided an “early warning” of
coming national concerns, but it does suggest this more active group who make contact
with their MPs were quicker to spot immigration as an issue. Interestingly, we find no similar
relationship with other issues: for example, MPs’ Postbag data on crime closely follows
the peaks and troughs of national concern, and the consistently high contact with MPs on
housing issues seems to be unrelated to the level of national concern.

Perceptions and reality
Public attitudes to Immigration
10 things we should know aboutattitudes to immigration in the UK
2. People are massively wrong on many aspects of immigration…
…including the size of immigrant populations – but this partly reflects their concerns…
We have a very wrong
picture of the scale and
nature of immigration. In
Ipsos MORI’s most recent
survey on this, the public’s
average guess at what
proportion the foreign-born
population make up of
the UK is 31%, compared
with the official estimate
of around 13%, (which
increases to 14% if the
central estimate of illegal
migrants resident in the
UK is taken into accounti).
This is clearly massively
out – and while this has been seen across a number of studies, it is still important to remind
ourselves that on average people think that three in ten of the population are immigrants.
Figure 3: Immigration as an important issue by mentions of asylum/immigration/refugees tothe MPs’ postbag question, MPs’ Survey, 1983 - 2013
40
20
60
80
0
Jan-
83O
ct-8
3Ju
l-84
Apr
-85
Jan-
86O
ct-8
6Ju
l-87
Apr
-88
Jan-
89O
ct-8
9Ju
l-90
Apr
-91
Jan-
92O
ct-9
2Ju
l-93
Apr
-94
Jan-
95O
ct-9
5Ju
l-96
Apr
-97
Jan-
98O
ct-9
8Ju
l-99
Apr
-00
Jan-
01O
ct-0
1Ju
l-02
Apr
-03
Jan-
04O
ct-0
4Ju
l-05
Apr
-06
Jan-
07O
ct-0
7Ju
l-08
Apr
-09
Jan-
10O
ct-1
0Ju
l-11
Apr
-12
Jan-
13
% mentions ofasylum/immigration/refugees (MP’s postbag)
% mentions ofimmigration/race relations as the most/another important issue to the British public
Net migration
DATE
%
-50
0
50
100
150
200
250 THOUSANDS
0
10
20
30
40
50
60
70
80
90
100
Family
Work
Asylum/other
Study
%
PERCEPTION & ACTUAL
Figure 4: ‘Imagined immigration’ vs actual composition of long-term international migration 2011
Share of mentions ONS estimates, 2011
When you think about 'immigrants', which of these types of people do you normally have in mind?
And these misperceptions are also clear in our view of the make-up of immigrants.
The most mentioned are refugees or asylum-seekers, despite these being the least common
immigrant type. The least mentioned group were people who come here to study, when in fact
students were the largest category of migrant to the UK in 2011. The actual proportions and
survey responses are compared in Figure 4 (with the survey responses rebased to represent
the share of mentions, to give a clearer idea of relative focus).
So we hugely overestimate the scale of the immigrant population, and our “imagined
immigration”ii is focused on groups we are more negative about.
However, we need to be careful to avoid simple conclusions that if we could inform
people more effectively about the real scale and nature of immigration that this would
shift views significantly. This is not just because of the challenge with this message being
heard and believed – although it’s worth noting that when we tell people the real scale of
immigration in surveys, the most common response is to not believe the figures.
More importantly, we need to recognise that cause and effect in these type of estimation
questions is complex – we partly overestimate the groups that worry us because they worry us,
not the other way round. Social psychologists call this “emotional innumeracy”: we don’t just
have “accuracy goals” in mind when answering them, we also have “directional goals”: whether
consciously or not, we may be expressing our concern as much as trying to get the right answer.
The important practical point here is that “myth-busting” exercises are likely to have limited
impact on concern. But equally we shouldn’t give up on better informing the public. There is
a significant danger in accepting that our inaccurate picture of immigration is fine because it
partly reflects our concerns and emotional reactions: this is just as partial as the view that if we
just informed people fully they will all come to a more “rational” view of immigration.
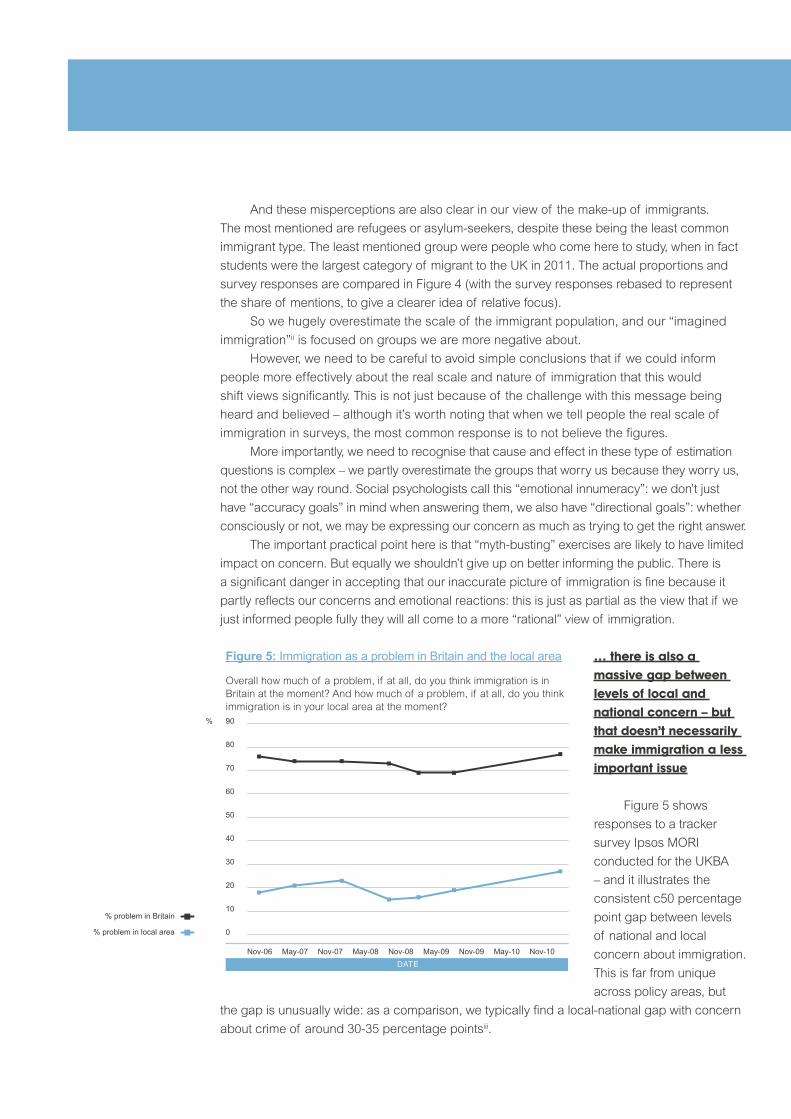
… there is also a massive gap between levels of local and national concern – but that doesn’t necessarily make immigration a less important issue
Figure 5 shows
responses to a tracker
survey Ipsos MORI
conducted for the UKBA
– and it illustrates the
consistent c50 percentage
point gap between levels
of national and local
concern about immigration.
This is far from unique
across policy areas, but
the gap is unusually wide: as a comparison, we typically find a local-national gap with concern
about crime of around 30-35 percentage pointsiii.
Figure 5: Immigration as a problem in Britain and the local area
Overall how much of a problem, if at all, do you think immigration is in Britain at the moment? And how much of a problem, if at all, do you think immigration is in your local area at the moment?
Nov-06 May-07 Nov-07 May-08 Nov-08 May-09 Nov-09 May-10 Nov-10
40
30
20
50
60
70
DATE
10
0
% problem in Britain
% problem in local area
80
90%
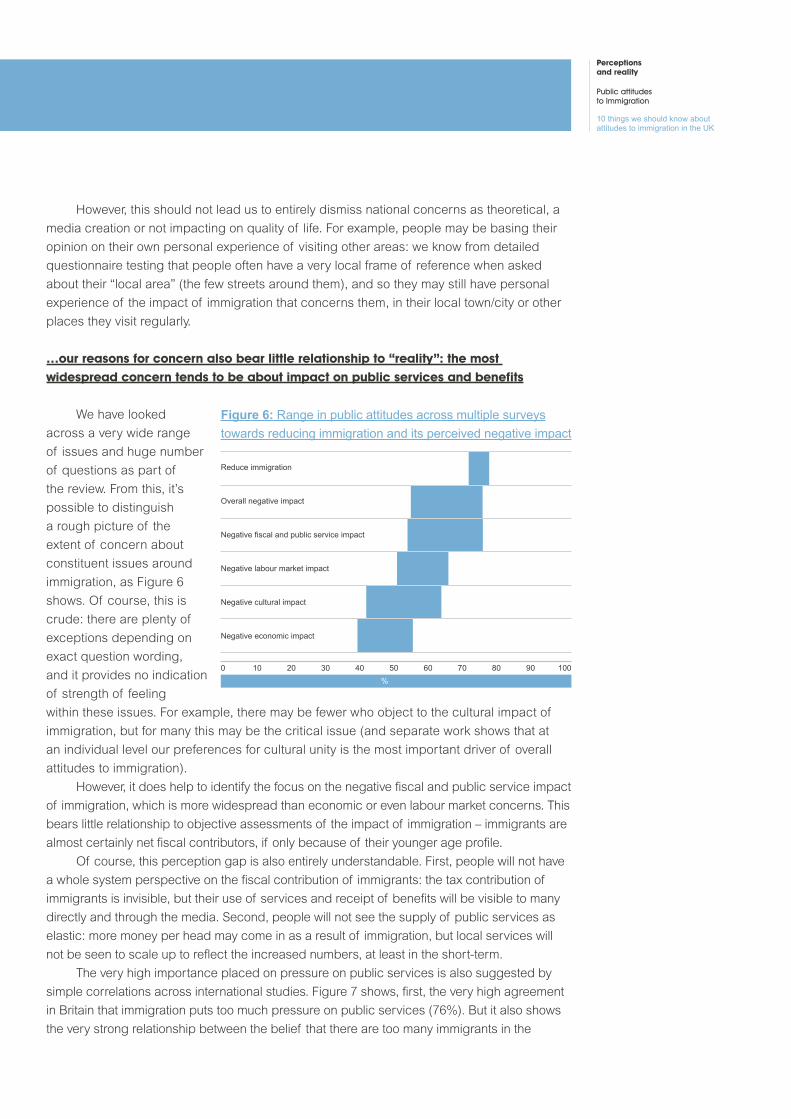
Figure 6: Range in public attitudes across multiple surveys towards reducing immigration and its perceived negative impact
Negative economic impact
Negative cultural impact
Negative labour market impact
Negative fiscal and public service impact
Overall negative impact
Reduce immigration
%0 10 20 30 40 50 60 70 80 90 100
However, this should not lead us to entirely dismiss national concerns as theoretical, a
media creation or not impacting on quality of life. For example, people may be basing their
opinion on their own personal experience of visiting other areas: we know from detailed
questionnaire testing that people often have a very local frame of reference when asked
about their “local area” (the few streets around them), and so they may still have personal
experience of the impact of immigration that concerns them, in their local town/city or other
places they visit regularly.
…our reasons for concern also bear little relationship to “reality”: the most widespread concern tends to be about impact on public services and benefits
We have looked
across a very wide range
of issues and huge number
of questions as part of
the review. From this, it’s
possible to distinguish
a rough picture of the
extent of concern about
constituent issues around
immigration, as Figure 6
shows. Of course, this is
crude: there are plenty of
exceptions depending on
exact question wording,
and it provides no indication
of strength of feeling
within these issues. For example, there may be fewer who object to the cultural impact of
immigration, but for many this may be the critical issue (and separate work shows that at
an individual level our preferences for cultural unity is the most important driver of overall
attitudes to immigration).
However, it does help to identify the focus on the negative fiscal and public service impact
of immigration, which is more widespread than economic or even labour market concerns. This
bears little relationship to objective assessments of the impact of immigration – immigrants are
almost certainly net fiscal contributors, if only because of their younger age profile.
Of course, this perception gap is also entirely understandable. First, people will not have
a whole system perspective on the fiscal contribution of immigrants: the tax contribution of
immigrants is invisible, but their use of services and receipt of benefits will be visible to many
directly and through the media. Second, people will not see the supply of public services as
elastic: more money per head may come in as a result of immigration, but local services will
not be seen to scale up to reflect the increased numbers, at least in the short-term.
The very high importance placed on pressure on public services is also suggested by
simple correlations across international studies. Figure 7 shows, first, the very high agreement
in Britain that immigration puts too much pressure on public services (76%). But it also shows
the very strong relationship between the belief that there are too many immigrants in the
Perceptions and reality
Public attitudes to Immigration
10 things we should know aboutattitudes to immigration in the UK

country and this concern about the impact of migrants on public services. This relationship
cannot demonstrate any causal link and is only based on a very small number of country cases
- but it is stronger than similar cross-analysis on other issues.
The surveys we’ve reviewed suggest there is little consensus on discriminating against
immigrants in the labour market once they are in the UK: for example, in one survey 45% say
that British companies should prioritise British workers, but 47% say that they should give jobs
to those with the best skills and qualifications, even if British workers lose out.
However, people are much more willing to discriminate on immigrants’ access to welfare
benefits and even broader support from public services and the state. This may be explained
by our strong sense of fairness, which focuses us on the requirement for people to contribute
before taking out (which applies to native-born groups too). The strength of feeling among the
public about this aspect of the impact of immigration is added to by the widespread sense that
immigrants are actually prioritised over the native population.
3. We have very different views about different types of immigration
An important limitation of the large majority of survey data on attitudes to “immigration”
is that they attempt to sum up views under a single and undefined label, leaving each
respondent to answer on the basis of their own unstated conception of who “immigrants” are
- which, as we have seen, will often be inaccurateiv.
A good illustration of this is seen in the fact that, in two different questions, a majority of
us believe that “immigrants” both take jobs from native workers and create jobs. This is not
because people are stupid, they will just have a different mental image of immigrants when
answering the different questions.
Figure 7: Relationship in European countries between the view that there are too many immigrants and the view that immigrants place too much pressure on services
20 8030 40 50 60 70
% AGREE IMMIGRATION HASPLACED TOO MUCH PRESSURE
ON PUBLIC SERVICES
% AGREE THERE ARE TOO MANY IMMIGRANTS IN OUR COUNTRY
60
0
20
30
40
50
90
70
80
100
10
R2 = 0.82
Poland
Hungary
SpainUK
Italy
Sweden
Belgium
France
Germany
So we need to treat all of these general questions with caution, while not dismissing the
concerns they clearly reflect. In particular, we need to look carefully at the less common but
important studies on views of specific immigrant groups. These show that immigrants’ labour
market position, skill level, likelihood of drawing on state resources, their country of origin, their
ethnicity, length of stay and legality all affect how we view them.
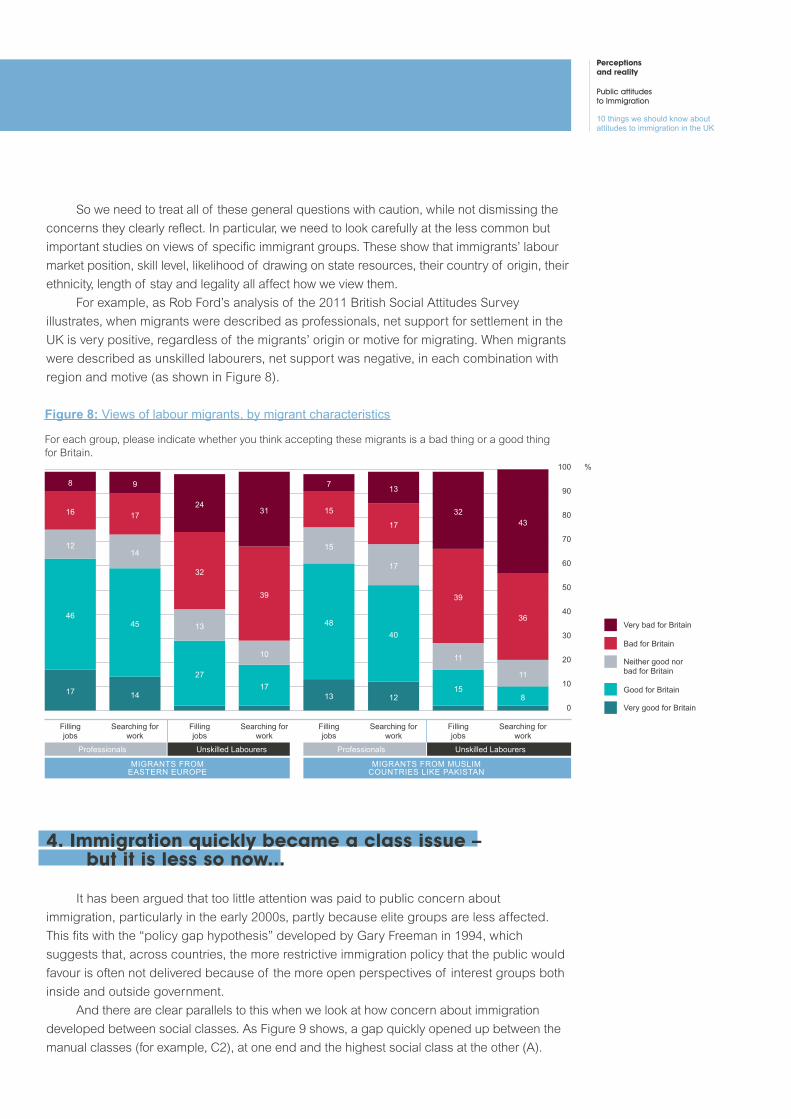
For example, as Rob Ford’s analysis of the 2011 British Social Attitudes Survey
illustrates, when migrants were described as professionals, net support for settlement in the
UK is very positive, regardless of the migrants’ origin or motive for migrating. When migrants
were described as unskilled labourers, net support was negative, in each combination with
region and motive (as shown in Figure 8).
4. Immigration quickly became a class issue – but it is less so now...
It has been argued that too little attention was paid to public concern about
immigration, particularly in the early 2000s, partly because elite groups are less affected.
This fits with the “policy gap hypothesis” developed by Gary Freeman in 1994, which
suggests that, across countries, the more restrictive immigration policy that the public would
favour is often not delivered because of the more open perspectives of interest groups both
inside and outside government.
And there are clear parallels to this when we look at how concern about immigration
developed between social classes. As Figure 9 shows, a gap quickly opened up between the
manual classes (for example, C2), at one end and the highest social class at the other (A).
Figure 8: Views of labour migrants, by migrant characteristics
0
10
20
30
40
50
60
70
80
90
100
17
46
12
16
8
14
45
14
17
9
27
13
32
24
17
10
39
31
13
48
15
15
7
12
40
17
17
13
15
11
39
32
8
11
36
43
Fillingjobs
Searching forwork
Fillingjobs
Searching forwork
Unskilled LabourersProfessionals Unskilled LabourersProfessionals
Fillingjobs
Searching forwork
Fillingjobs
Searching forwork
%
MIGRANTS FROMEASTERN EUROPE
MIGRANTS FROM MUSLIMCOUNTRIES LIKE PAKISTAN
Bad for Britain
Very bad for Britain
Good for Britain
Neither good nor bad for Britain
Very good for Britain
For each group, please indicate whether you think accepting these migrants is a bad thing or a good thing for Britain.
Perceptions and reality
Public attitudes to Immigration
10 things we should know aboutattitudes to immigration in the UK

However, this gap was somewhat closed later in the 2000s, and by 2013, there was much less
difference between the classes.
…but different income groups have different reasons for concern…
However there are very different reasons given for concern, depending on economic
and social class factors, as our new analysis of the Citizenship Survey suggests (as shown
Figure 9: Differences by social grade in importance of immigration over time
What would you say is the most important issue/other important issues facing Britain today? % RACE REALTIONS/
IMMIGRATION/IMMIGRANTS
YEAR
20
15
10
25
30
35
40
45
5
0
50
1996 1997 1998 1999 2000 2001 2002 2003 2004 2005 2006 2007 2008 2009 2010 2011 20132012
A
B
C1
C2
D
E
Figure 10: Reasons given among people who view immigration as a problem in Britain, by income
And why do you think the number of immigrants coming to Britain nowadays should be reduced? Why else?
Benefits/public services
Jobs
Housing
%
4426
1940
2820
3828
1639
3421
3736
1730
3610
2442
722
448
Under £5,000
£5,000-£9,999
£10,000-£14,999
£15,000-£19,999
£20,000-£29,999
£30,000-£49,999
£50,000-£74,999
£75,000 or more
in Figure 10). For example, concern about immigrants as a drain on public service resources
rises significantly with income, while job-related concern declines as income rises. Concern
about housing is at a similar level for those with incomes below £30,000 per year, and
significantly lower for those with incomes above that level.
On the one hand, this is very explainable, as better-off groups are less likely to be
affected by the employment and housing pressures that immigrants are seen to bring for
others. But it also highlights the slightly counter-intuitive point that it is actually the better-
off who are most likely to say the reason for their concern is immigrants’ impact on public
services and benefits.
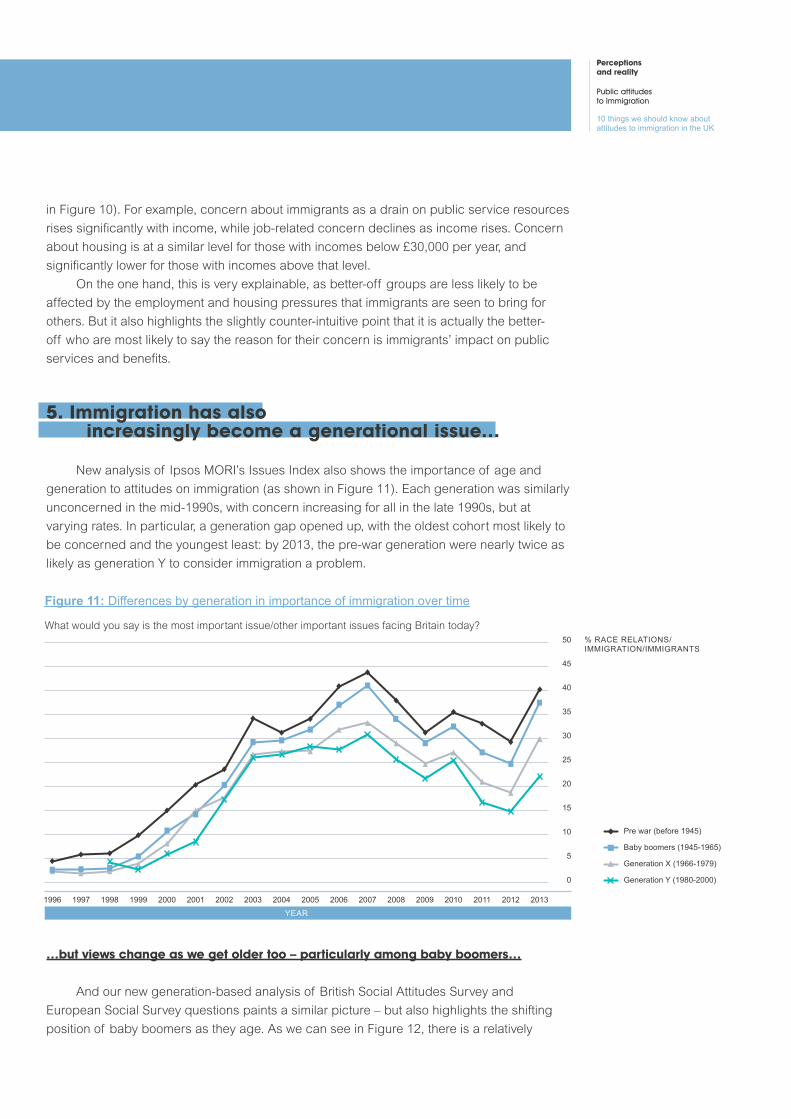
5. Immigration has also increasingly become a generational issue…
New analysis of Ipsos MORI’s Issues Index also shows the importance of age and
generation to attitudes on immigration (as shown in Figure 11). Each generation was similarly
unconcerned in the mid-1990s, with concern increasing for all in the late 1990s, but at
varying rates. In particular, a generation gap opened up, with the oldest cohort most likely to
be concerned and the youngest least: by 2013, the pre-war generation were nearly twice as
likely as generation Y to consider immigration a problem.
…but views change as we get older too – particularly among baby boomers…
And our new generation-based analysis of British Social Attitudes Survey and
European Social Survey questions paints a similar picture – but also highlights the shifting
position of baby boomers as they age. As we can see in Figure 12, there is a relatively
Figure 11: Differences by generation in importance of immigration over time
What would you say is the most important issue/other important issues facing Britain today?
20
15
10
25
30
35
40
45
50
5
0
1996 1997 1998 1999 2000 2001 2002 2003 2004 2005 2006 2007 2008 2009 2010 2011 20132012
% RACE RELATIONS/IMMIGRATION/IMMIGRANTS
YEAR
Pre war (before 1945)
Baby boomers (1945-1965)
Generation X (1966-1979)
Generation Y (1980-2000)
Perceptions and reality
Public attitudes to Immigration
10 things we should know aboutattitudes to immigration in the UK
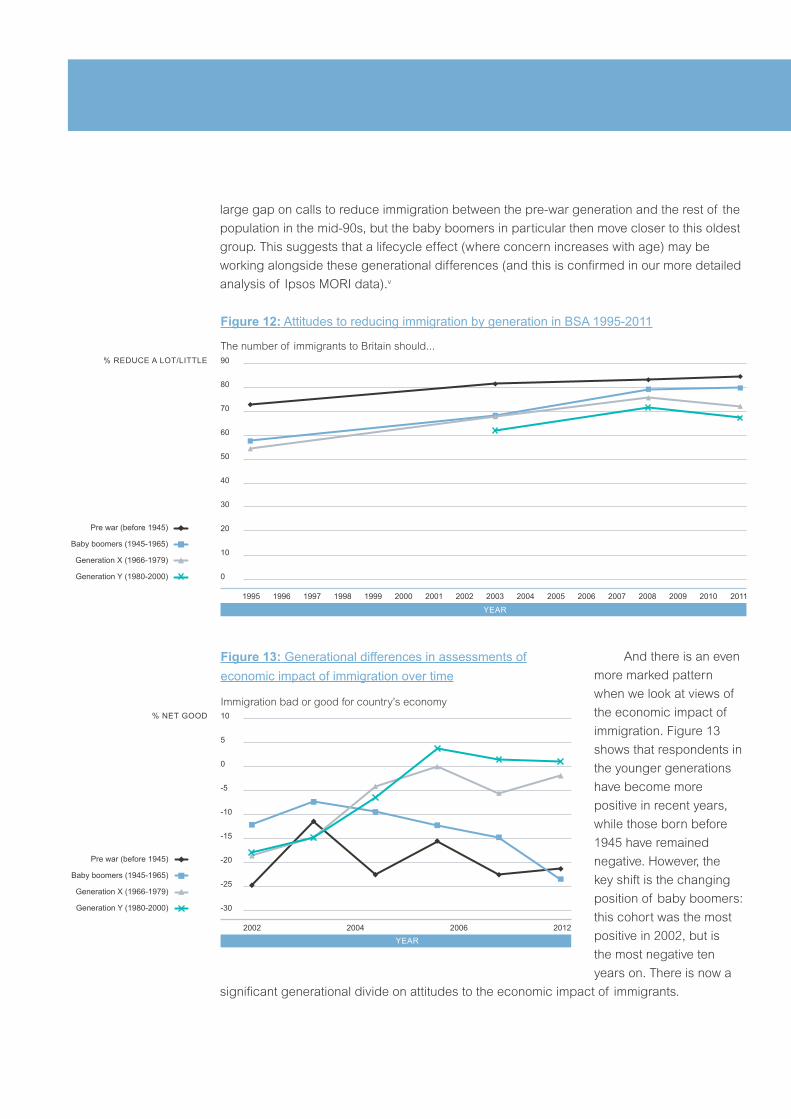
large gap on calls to reduce immigration between the pre-war generation and the rest of the
population in the mid-90s, but the baby boomers in particular then move closer to this oldest
group. This suggests that a lifecycle effect (where concern increases with age) may be
working alongside these generational differences (and this is confirmed in our more detailed
analysis of Ipsos MORI data).v
And there is an even
more marked pattern
when we look at views of
the economic impact of
immigration. Figure 13
shows that respondents in
the younger generations
have become more
positive in recent years,
while those born before
1945 have remained
negative. However, the
key shift is the changing
position of baby boomers:
this cohort was the most
positive in 2002, but is
the most negative ten
years on. There is now a
significant generational divide on attitudes to the economic impact of immigrants.
Figure 12: Attitudes to reducing immigration by generation in BSA 1995-2011
The number of immigrants to Britain should...
40
30
20
50
60
70
80
YEAR
90
10
0
1995 1997 1998 1999 2000 2001 2002 2003 2004 2005 2006 2007 2008 2009 20101996 2011
Pre war (before 1945)
Baby boomers (1945-1965)
Generation X (1966-1979)
Generation Y (1980-2000)
% REDUCE A LOT/LITTLE
Figure 13: Generational differences in assessments of economic impact of immigration over time
2002 2004 2006
Immigration bad or good for country’s economy
2012
-10
-15
-20
-5
0
5
10
-25
-30
% NET GOOD
Pre war (before 1945)
Baby boomers (1945-1965)
Generation X (1966-1979)
Generation Y (1980-2000)
YEAR

6. Where we live matters too...
Using the 2010/11 Citizenship Survey, we have grouped respondents by their local
authority into 12 clusters of area types developed by the Home Officevi. Figure 14 confirms
that White Britons living in the “Superdiverse” and “Cosmopolitan London/periphery”
clusters are least likely to want to reduce immigration a lot, whilst “Northern manufacturing
and industrial towns” and areas of “low migration” are amongst the keenest to see
immigration reduced a lot (as seen in other work, areas with less experience of migration
tend to be more worried).
However, those most in favour of reducing immigration “a lot” are White Britons living in
“asylum dispersal areas”. These are areas with high worklessness and high social housing
levels where the perceived threat of competition for resources from asylum seekers is likely
to be keenly felt (places like Bolton, Portsmouth, Swansea and Rotherham).
…but even in “cosmopolitan” and “superdiverse” areas the majority still call for reductions in immigration
However, perhaps the most striking pattern in this analysis is that even in already-
diverse areas that are best equipped according to this classification, still around two thirds
of the population would like to reduce immigration levels – although this is much more likely
to be only “a little”.
Figure 14: Attitudes on the level of immigration among White British people born in the UK, by twelve clusters created from Home Office cluster analysis
Do you think the number of immigrants coming to Britain nowadays should be increased a lot, increased a little, remain the same as it is, reduced a little, or reduced a lot?
Asylum Dispersal Areas
Industrial and Manufacturing Towns
Low Migration Small Towns and Rural Areas
Migrant Worker Towns and Countryside
New, Large Freestanding and Commuter Towns
Diverse Conurbation Centres
Rural and Coastal Retirement Towns
ProsperousSmall Towns
London Suburbs and Satellite Towns
High Turnover Provincial and Student Towns
Superdiverse London
Cosmopolitan London and Periphery
Reduced a little
Reduced a lot
Increased a little
Remain the same as it is
Increased a lot15 16 67
14 20 64
14 22 63
13 23 62
14 24 61
16 22 60
15 25 59
18 25 55
21 25 53
25 24 47
26 33 38
26 34 34
0 5025 75 100%
Perceptions and reality
Public attitudes to Immigration
10 things we should know aboutattitudes to immigration in the UK

7. Immigrants worry about immigration too, particularly those who’ve been here for 20+ years
The attitudes of
immigrants themselves
towards reducing
immigration also shift
over time – and they
tend to become closer
to the average for the UK
population the longer they
have been in the country.
For example, 70% of
those immigrants who
arrived pre-1970 call for
at least some reduction
in immigration (as shown
in Figure 15). While this is
not quite as high as the
aggregate national picture,
it is much closer to it than
recent immigrant groups.
Indeed, there seems
to be something of a
step-change in attitudes
between the 1991-2000 immigrants and the 1971-1990 immigrants, where a clear majority
of the latter are in favour of reductions, while the more recent group are closer to those
who have arrived since 2000 in their attitudes. This may be a function of both length of
time in the UK and the different types of immigrants that arrived during these periods.
8. The newspaper we read says a lot about our attitudes to immigration – although it may not cause them
Our new analysis of the salience of immigration by newspaper readership in Figure 16
shows we now have a wider dispersal of views on immigration by newspaper readership than
any other variable we have been able to identify – with Daily Mail and Express readers at one
end and Guardian readers at the other. It is worth noting that Mail and Express readers did not
have significantly higher levels of concern about immigration in the mid-1990s: there does not
seem to be something innate in readers of these papers to view immigration as a top issue
regardless of conditions.
Of course, the patterns in the following chart may also partially reflect differences in
the make-up of readers of these newspapers, and it is therefore more meaningful to look
at variations after controlling for other characteristics. Ipsos MORI attempted to do this in a
Figure 15: Attitudes to the level of immigration by people not born in the UK and their year of arrival
Do you think the number of immigrants coming to Britain nowadays should be increased a lot, increased a little, remain the same as it is, reduced a little, or reduced a lot?
0
10
20
30
40
50
60
70
80
90
100
Allrespondents
Before1970
1971-1990 1991-2000 2001-2005 2006 topresent
28
22
48
33
31
32
5
46
21
25
7
49
24
13
7
58
17
11
21
24
53
Reduced a little
Reduced a lot
Increased a little
Remain the same as it is
Increased a lot
%
YEAR OF ARRIVAL AMONG FOREIGN BORN RESPONDENTS

study from 2005 and one key point stood out: newspaper readership is much more likely to
be significantly related to concern about immigration, after controlling for other demographic
differences, than any other issue measured (including health services, defence/terrorism,
education and crime). Indeed, the four most important predictors of concern about
immigration were all whether people read particular newspapers.
This still does not prove a causal effect (people partly choose newspapers that reflect
their already formed views), but it seems clear that there is a reinforcing interaction between
the public, politicians and the media, with cause and effect running in all directions.
However, some media coverage does seem to unreasonably exaggerate and scare-
monger - and there is enough evidence to suggest that the media have an independent
effect on views of immigration and therefore that the accuracy and balance of their coverage
needs careful scrutiny.
9. We like targets, but have little faith the government will meet them
Around eight in ten of the population have agreed that the government should set
strict limits on the number of immigrants since we started asking this question back in 2006.
When people are asked about the specifics of what these limits should be, answers are less
consistent – but the general theme of “fewer” is clear.
Figure 16: Differences by newspaper readership in importance of immigration over time
30
0
5
10
15
20
25
45
35
40
Daily Mirror
Daily Telegraph
The Guardian
The Independent
Daily Star
Daily Express
Daily Mail
The Sun
The Times
None of these
% RACE RELATIONS/IMMIGRATION/IMMIGRANTS
1996 1997 1998 1999 2000 2001 2002 2003 2004 2005 2006 2007 2008 2009 2010 2011 2012 2013
YEAR
50
55
60
What would you say is the most important issue/other important issues facing Britain today?
Perceptions and reality
Public attitudes to Immigration
10 things we should know aboutattitudes to immigration in the UK

It is no surprise then that there is similarly widespread support for the government’s
current pledge to reduce net migration to “tens of thousands”. But it is also clear that people
doubt the government will be able deliver this – an almost identical proportion of around
eight in ten think it is unlikely (as shown in Figure 17). This varies between the supporters of
the different parties, but it is notable that a majority of Labour and LibDem voters still support
the aim, and a majority of Conservative voters don’t believe it will be achieved.
This lack of faith may reflect the poor rating of government policy and implementation:
around seven in ten have consistently rated government as poor between 2006-2013.
However, some may also doubt the government’s ability to deliver because they are
conscious of our lack
of national control over
a large proportion of
immigration, particularly
the third that originate
from the EU. And this is
something that particularly
bothers UK residents:
we have much greater
support for national
sovereignty on immigration
and border control
than other countries.
Expectations are therefore
high – and can only be
currently met by reducing
aspects of immigration
that are relatively lower
concerns to people or that
they positively support
(and that have positive
economic benefits), such
as students and skilled
workers.
10. UKIP supporters have broken away in their level of concern
Finally, it is worth highlighting the changing position of party supporters on their
levels of concern about immigration over time, using new analysis from Ipsos MORI’s
political aggregate dataset. Figure 18 suggests three key points. First, UKIP voters actually
started with similar levels of concern about immigration to Conservative voters in 2002 (the
first time there were sufficient UKIP voters to identify separately). However, since then they
Figure 17: Level of support for and confidence in David Cameron’s pledge to reduce immigration to the “tens of thousands”
Nov-11 Jan-12 Oct-12 Dec-12
40
30
20
50
60
70
DATE
10
0
Support David Cameron's pledge to reduce net
immigration into Britain from hundreds of thousands to
"tens of thousands"
Unlikely that David Cameron will be able to deliver the
pledge to reduce net immigration into Britain from
hundreds of thousands to "tens of thousands"
80
90
% 100
%
Support
Unlikely
Conservative
93
63
Labour
73
85
Liberal Democrats
72
70
December 2012

have grown away from the Conservatives and all other voters in their immigration focus.
This will no doubt be partly due to UKIP’s shifting emphasis, but also a refinement of their
supporter base, as they have attracted more supporters who have a particular concern
about this issue.
Second, it is notable how closely Labour and LibDem supporters have tracked
throughout the entire period, with LibDem supporters a long way from supporters of their
Coalition partners.
And finally, those who say they are undecided on how to vote tend to be closer to
Labour and LibDem views than the Conservatives.
Figure 18: Differences by voting intention in importance of immigration over time
% RACE RELATIONS/IMMIGRATION/IMMIGRANTS
What would you say is the most important issue/other important issues facing Britain today?
30
0
5
10
15
20
25
35
40
Liberal Democrats
UK Independence Party
Would not vote
Undecided
Conservative
Labour
1996 1997 1998 1999 2000 2001 2002 2003 2004 2005 2006 2007 2008 2009 2010 2011 2012 2013
YEAR
70
45
50
55
60
65
75
Perceptions and reality
Public attitudes to Immigration
10 things we should know aboutattitudes to immigration in the UK
Figure 1: Office for National Statistics; Ipsos MORI Issues Index
Figure 2: Ipsos MORI Issues Index; Ipsos MOR/Gallup polling
Figure 3: Office for National Statistics; Ipsos MORI Issues Index; Ipsos MORI MPs’ Survey
Figure 4: ONS Long-term International Migration Estimates; Ipsos MORI/Oxford Migration
Observatory, September 2011
Figure 5: Ipsos MORI/UKBA, 2006-2009; Ipsos MORI, February 2011
Figure 6: British Social Attitudes; European Social Survey; Transatlantic Trends; Citizenship Survey;
Ipsos MORI; YouGov
Figure 7: Ipsos Global @dvisor, June 2011
Figure 8: British Social Attitudes, 2011
Figure 9: Ipsos MORI Issues Index
Figure 10: Citizenship Survey, 2010/11
Figure 11: Ipsos MORI Issues Index
Figure 12: Ipsos MORI reanalysis of British Social Attitudes
Figure 13: European Social Survey, 6 rounds 2002-2012
Figure 14: Citizenship Survey, 2010/11; Home Office, Social and Public Service Impacts of
Migration at the Local Level (July 2013)
Figure 15: Citizenship Survey, 2010/11
Figure 16: Ipsos MORI Issues Index
Figure 17: YouGov/Sunday Times, November 2011, January 2012 October 2012, December 2012
Figure 18: Ipsos MORI Issues Index
Report sources
i. Gordon, I. Scanlon, K. Travers, T. Whitehead, C. (2009) Economic impact on the London and UK
economy of an earned regularisation of irregular migrants to the UK.GLA Economics, Greater
London Authority, London. Their central estimate for the number of irregular migrants in the UK in
2007 was 618,000.
ii. Blinder, S. (2013) Imagined Immigration: The Impact of Different Meanings of ‘Immigrants’ in
Public Opinion and Policy Debates in Britain. Political Studies.
iii. For example Ipsos MORI/RSS, June 2013, http://www.ipsos-mori.com/Assets/Docs/Polls/ipsos-
mori-rss-kings-perils-of-perception-topline.pdf
iv. Crawley, H. (2005) Evidence on Attitudes to Asylum and Immigration: What We Know, Don’t Know
and Need to Know. COMPAS Working Paper WP-05-23, Centre on Migration, Policy and Society.
v. Ipsos MORI (2013) Understanding Society: Generations.
vi. Home Office, Social and Public Service Impacts of Migration at the Local Level, July 2013.
End notes


Bobby Duffy
Managing Director,
Ipsos MORI Social Research
Institute and Visiting Senior
Research Fellow, King’s
College London
Tom Frere-Smith
Research Manager,
Ipsos MORI Social Research
Institute
Further information
The full review – Perceptions and Reality: Public Attitudes to Immigration – is available at
www.ipsos-mori.com/immigration-review.
For further information, please contact:


