Perceptual audio data concealment and watermarking scheme using direct frequency domain substitution C.M.M. Tio, I.V. McLoughlin and R.W. Adi Abstract: A method is described for perceptually transparent data concealment and watermarking in audio. The proposed system replaces redundant and imperceptible frequency components with hidden data. A psychoacoustic model is used to identify suitable frequency locations for data hiding. Such a method is complicated by the windowing and overlapping requirements used for signal conditioning. The proposed system uscs data Ripping in place of windowing and incorporates a novel data detection scheme with adaptive weighting to increase the robustness of the watermark transmission. The resistance of the watermarking system to filtering, amplitude scaling and additive white noise is measured and results presented. 1 Introduction The insertion of hidden data into digital audio signals has received considerable research attention in recent years. Methods fall into two broad categories based on the applications of data concealment and watermarking, aims which are not necessarily compatible. Applications of both in audio include: Proof of authorship of musical works. A musician can embed a unique digital signature in his music that will identify it as his work. Authentication of secret voice messages used in military and intelligence operations. A pre-determined secret key can be embedded in a speech message for the receiver to verify that the message was indeed sent by Allied forces. Taniperproofing of musical works. A watermarking scheme that is very low in robustness can be used in a positive way. A digital signature can be embedded in the audio signal. As such a system would he very sensitive to distortion, any modifications made to the signal will make the detection of the digital signature impossible. Data augmentation of audio recordings. Ancillary infor- mation such as artist name, song title and artistic details can he embedded into the audio. (0 IEE. 2002 iZE Pmrrrdings online no. 20020664 Dol: I 0. I049Iip-vis:20020664 Paper first received lXfh September 2000 and in revised fonn 18th July 2002 C.M.M. Tio is with Mindmaker Pte Lld, 31 fntemational Business Park. I.V. McLuughlin is with Tait Electronic$ Ltd, Group Rcsearch, PO Box 1645, Bumside, Christchurch, New Zealand R.W. Adi is with the School of Computer Enginccing, Nanyang Technological University. Nanyang Avenoe. Singapore 639798 I€€ Pm.-Mr. Image Sigd P~ocos., WI i49, Nu. 6, Decendw 2002 803-04 cmive R~SOWW, singiipore 609921 Svnchronisation of audio signals with external devices or media. Cue signals embedded in an audio stream can he used for controlling images in a multimedia presentation. Certain applications require that the embedded infonna- tion remain intact even after processing, while others may require that any processing irreversibly destroys the infor- mation. All applications mentioned here require that distor- tion added to the audio signal is either imperceptible or does not degrade quality. Many methods have been devel- oped in both the frequency and time domain, with the former advantageous in that they are bettcr able to operate on a perceptual basis, and thus meet the imperceptibility criteria. This paper describes such a frequency domain method based on direct insertion in the frequency domain. Typically, direct insertion in the frequency domain is plagued by complications causcd by the use of overlapping windows [I] for signal conditioning. Each modification ofan FFT coefficient will affect two or more adjacent frames when 50% overlap is used. The localisation of such modifications is difficult. Moreover, direct modification of a series of FFT coefficients is equivalent to multiplication with a rectangular window in the frequency domain. This translates to convolu- tion with a sinc function in the time domain. When these modifications are overlapped and added in the time domain, the concealed data will he distorted to an extent where the decoding process is non-trivial. Existing frequency domain audio watermarking systems [2-61 often consist of a psychoacoustic model, spread spectrum and hypothesis testing techniques, and report encouraging results. However, hypothesis testing [5] is unsuitable for data concealment since it merely affirms the presence or absence of a watermark. The value of the watermark is not explicitly determined. Thus, detection requires prior knowledge of the watermark. The proposed system, however, directly substitutes spec- tral coefficients with hidden data. Upon decoding, hidden data is determined explicitly. Such a system is suitable for data hiding as well as watermarking. The authors consider that the optimum solution to the dis- tortion caused hy overlapping and windowing is to remove 335
Transcript
Perceptual audio data concealment and watermarking scheme using direct frequency domain substitution
C.M.M. Tio, I.V. McLoughlin and R.W. Adi
Abstract: A method is described for perceptually transparent data concealment and watermarking in audio. The proposed system replaces redundant and imperceptible frequency components with hidden data. A psychoacoustic model is used to identify suitable frequency locations for data hiding. Such a method is complicated by the windowing and overlapping requirements used for signal conditioning. The proposed system uscs data Ripping in place of windowing and incorporates a novel data detection scheme with adaptive weighting to increase the robustness of the watermark transmission. The resistance of the watermarking system to filtering, amplitude scaling and additive white noise is measured and results presented.
1 Introduction
The insertion of hidden data into digital audio signals has received considerable research attention in recent years. Methods fall into two broad categories based on the applications of data concealment and watermarking, aims which are not necessarily compatible. Applications of both in audio include:
Proof of authorship of musical works. A musician can embed a unique digital signature in his music that will identify it as his work.
Authentication of secret voice messages used in military and intelligence operations. A pre-determined secret key can be embedded in a speech message for the receiver to verify that the message was indeed sent by Allied forces.
Taniperproofing of musical works. A watermarking scheme that is very low in robustness can be used in a positive way. A digital signature can be embedded in the audio signal. As such a system would he very sensitive to distortion, any modifications made to the signal will make the detection of the digital signature impossible.
Data augmentation of audio recordings. Ancillary infor- mation such as artist name, song title and artistic details can he embedded into the audio.
(0 IEE. 2002 iZE Pmrrrdings online no. 20020664 Dol: I 0. I049Iip-vis:20020664 Paper first received lXfh September 2000 and in revised fonn 18th July 2002 C.M.M. Tio is with Mindmaker Pte Lld, 31 fntemational Business Park.
I.V. McLuughlin is with Tait Electronic$ Ltd, Group Rcsearch, PO Box 1645, Bumside, Christchurch, New Zealand R.W. Adi is with the School of Computer Enginccing, Nanyang Technological University. Nanyang Avenoe. Singapore 639798
I€€ Pm.-Mr. Image S i g d P~ocos. , W I i49, Nu. 6, Decendw 2002
803-04 cmive R ~ S O W W , singiipore 609921
Svnchronisation of audio signals with external devices or media. Cue signals embedded in an audio stream can he used for controlling images in a multimedia presentation.
Certain applications require that the embedded infonna- tion remain intact even after processing, while others may require that any processing irreversibly destroys the infor- mation. All applications mentioned here require that distor- tion added to the audio signal is either imperceptible or does not degrade quality. Many methods have been devel- oped in both the frequency and time domain, with the former advantageous in that they are bettcr able to operate on a perceptual basis, and thus meet the imperceptibility criteria. This paper describes such a frequency domain method based on direct insertion in the frequency domain.
Typically, direct insertion in the frequency domain is plagued by complications causcd by the use of overlapping windows [I] for signal conditioning. Each modification ofan FFT coefficient will affect two or more adjacent frames when 50% overlap is used. The localisation of such modifications is difficult. Moreover, direct modification of a series of FFT coefficients is equivalent to multiplication with a rectangular window in the frequency domain. This translates to convolu- tion with a sinc function in the time domain. When these modifications are overlapped and added in the time domain, the concealed data will he distorted to an extent where the decoding process is non-trivial.
Existing frequency domain audio watermarking systems [2-61 often consist of a psychoacoustic model, spread spectrum and hypothesis testing techniques, and report encouraging results. However, hypothesis testing [5] is unsuitable for data concealment since it merely affirms the presence or absence of a watermark. The value of the watermark is not explicitly determined. Thus, detection requires prior knowledge of the watermark.
The proposed system, however, directly substitutes spec- tral coefficients with hidden data. Upon decoding, hidden data is determined explicitly. Such a system is suitable for data hiding as well as watermarking.
The authors consider that the optimum solution to the dis- tortion caused hy overlapping and windowing is to remove
335
the process from the system completely. An alternative technique, developed for geophysical analysis is employed instead: data flipping [2,7] replaces the signal conditioning function performed by windowing. With data Ripping, the frames do not need to be overlapped, allowing spectral modifications to be localised to a single frame. To increase robustness, an additional novel spectral encoding scheme is incorporated.
2 System description
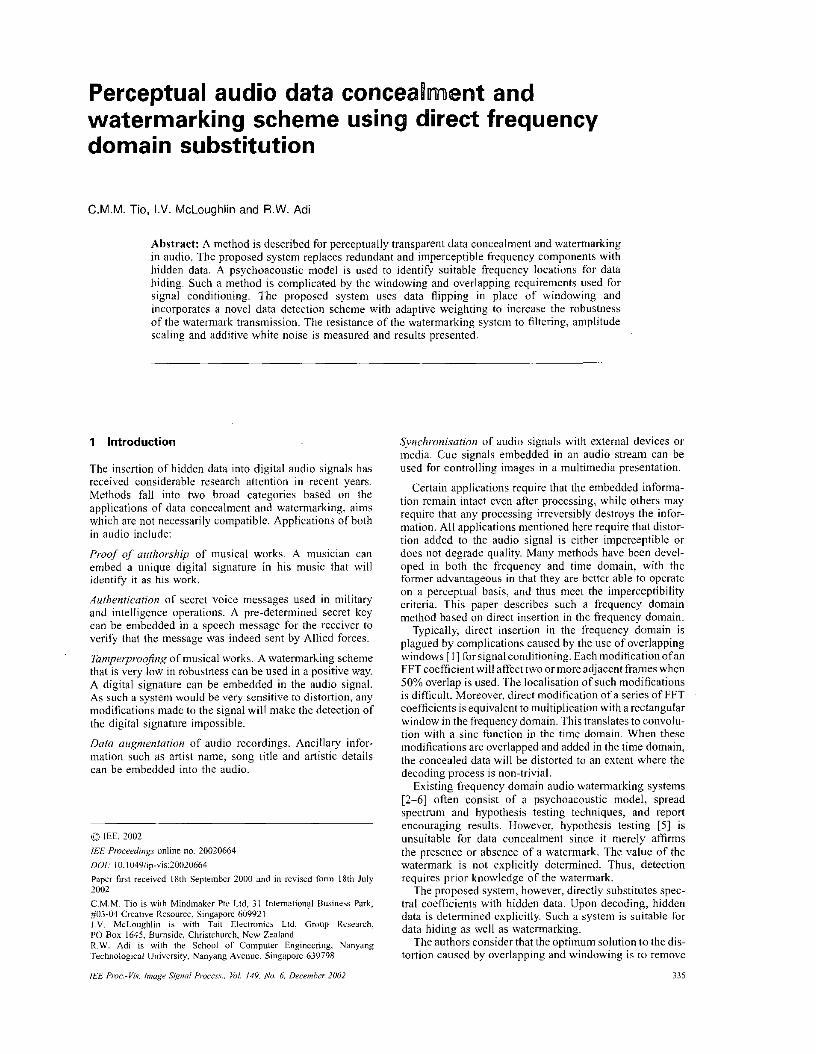
2.1 General overview The proposed system (Fig. 1) conceals data directly in fre- quency regions identified as inaudible by a psychoacoustic model. During encoding, 1024 audio samples are processed per frame. The input frame is first conditioned by data flipping [2,7] before an FFT [SI is applied. The output of the FFT is used by the psychoacoustic model to calculate a masking threshold [9] S,>$. This measurement is used to identify suitable areas in the frequency-power continuum for transparent data hiding. Corruption of such regions will not cause audible distortion as they are niaskcd by nearby frequencies.
Prior to insertion, data to be hidden is repeated and interleaved to increase robustness. Next, the interleaved data is embedded into the audio spectrum with a novel spectral encoding scheme (Section 2.3) using the masking threshold as a reference. An inverse FFT is performed on the output from this embedding block and the time-domain result is dithered [ I O ] to correct for quantisation errors. The result of the dithering is the final output from the encoder. The 16-bit processed audio output can then be transmitted or stored.
Decoding is an analogous process. The audio signal is divided into frames of 1024 samples. After data Ripping,
encode
processed audio frame decode
dataflip
weighting generator
detect
de-interleave. majority vote
1
i embedded data
Fig. 1 S w t m block diagram
336
an FFT is applied to yield a spectral frame containing hidden data. The hidden data locations are determined using the same psychoacoustic model as in the encoder. The hidden data is decoded with the help of an adaptive weighting curve (Section 2.5.2) to emphasisc recovery from frequency regions that have survived transmission. Finally, the data is de-interleaved and un-rcpcated to give the original hidden data (or watermark).
2 2 Psychoacoustic model The clioscn psychoacoustic model is an adaptation of the MPEG layer 1 psychoacoustic model 2 [ I I ] . I t calculates the masking threshold S,,, to estimate the degree of frequency masking [I21 at each spectral location. In thc simplest scheme, FFT coefficients at spectral locations where the signal power falls below the masking threshold can be substituted with hidden data. The psychoacoustic considcrations ensure that any distortion caused by embed- ding hidden data is not audible. Although this psycho- acoustic model has been well proven [ I l l , it has the disadvantage that data hidden using this scheme is unlikely to survive the process of MPEG compression. However, if surviving MPEG compression is required, a progressive backing off from the MPEG masking threshold would allow data to he hidden at the expense of quality reduction over and above that of MPEG compression.
2.3 Spectral embedding scheme The modification of spectral lines during embedding can result in non-integer time-domain values which are typi- cally truncated to 16 or 24 bits. The quantisation error changes the values ofthe hidden data and shifts the masking threshold slightly for the decoding process.
A further factor that presents difficulty in decoding is that changes in masking threshold naturally result from the insertion of data into the spectrum. To ensure error-free decoding, it was found necessary to employ a tolerancing scheme. The scheme divides the spectral magnitude space into several signalling regions separated sufficiently to cater for changes in absolute decoded value between encoding and decoding.
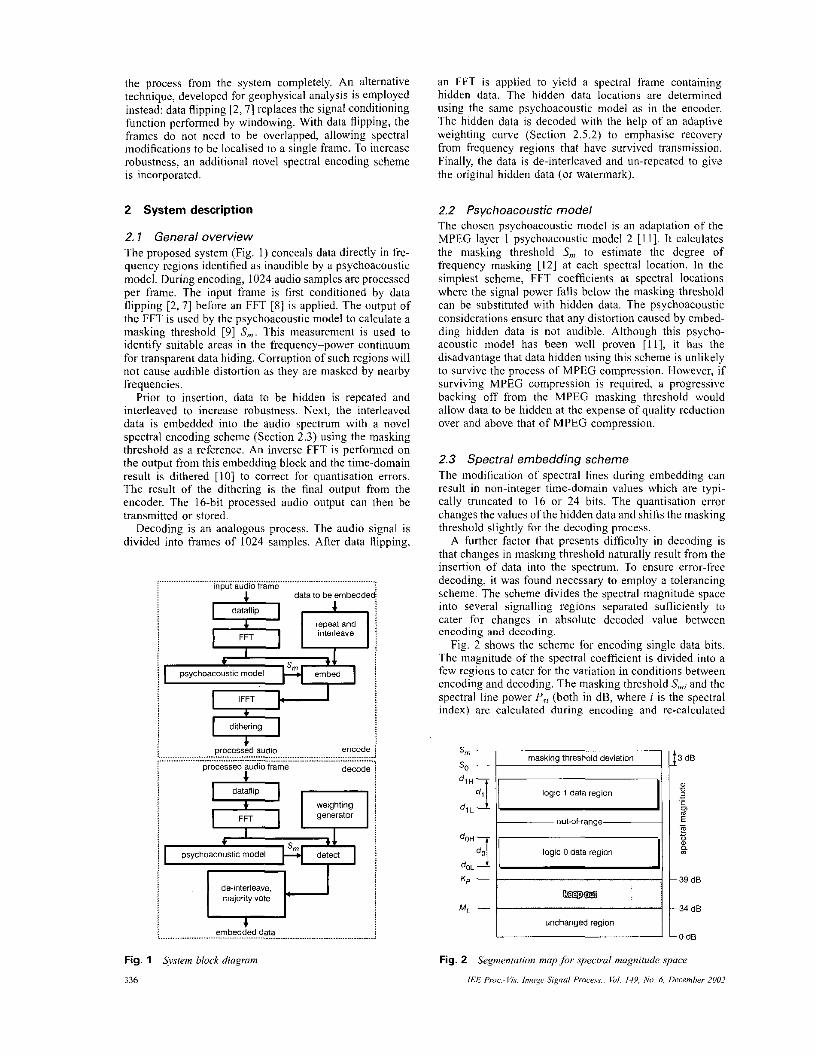
Fig. 2 shows the scheme for encoding single data bits. The magnitude of the spectral coefficient is divided into a few regions to cater for the variation in conditions between encoding and decoding. The masking threshold S,,,; and the spectral line power P,; (both in dB, where i is the spectral index) arc calculated during encoding and re-calculated
during dccoding. Let the values calculated during encoding be S,,,, and P.Ti, and the values calculated during decoding be S:8,j and P.tj.
The masking threshold deviation rcgion solves the shifted masking threshold problem by introducing a toler- ance for SnZ;. During encoding, Psi < S,,; is the criteria for data hiding to occur at the spectral location i. At the decoding end, the criteria is modified by the addition of a tolerance SMD. The condition P:; < $,,; ~ SMD detects the presence of hidden data at index i (this inference can be made by constraining the encoder to ensure that the power of every altcrcd spectral line is less than $,,, - SMD).
Experimentation using many audio signal types reveals that the shift in masking threshold between encoding and decoding (Le. the variation in S,,;) never exceeds 3 dB for error-free transmission.
Similar experimentation determined the maximum spec- tral magnitude variation caused by quantisation errors. For example, when the magnitude of a spectral line is set to 0 during encoding, the corresponding decoded magnitude can be slightly greater than 0. To avoid ambiguity, no data hiding should take place when the available spectral magnitude space is less than this variation. MINLEVEL is the empirically determined minimum level at which data hiding can take place, currently 34 dB.
Variation in P.vj will cause problems when dctcrmining the inequality P(; > MINLEVEL during decoding. To solve this problem, a keep-out region is enforced.
During cncoding, any spectral line that has a power value between M,. and K p (Fig. 2) will have its value reset to zero. Effectively, any spectral line that falls within the keep-out region is transferred to the unchanged region. This will ensure a definite safety margin between spectral lines that have hiddcn data encoded and the minimum level at which data hiding takes place. Since the method adjusts only spectral lines that are themselves inaudible, zeroing lines will have little impact on audio quality.
The number of data levels that a single spectral line (FFT coefficient) can encode is govcmcd by robustness consid- erations. If robustness is unimportant, more data levels, and consequently more bits, can be cncnded per spectral line. In the proposed watermarking system, resistance to deliberate attack is of paramount importance. Thcrcfore each line encodes only one bit. During encoding, data levels dl and dr, represent the symbols 1 and 0 respectively. Upon decoding, if the recovered data falls within the range of d , , , and dlL, a symbol 1 is decoded; if the recovered data falls within the range ofd,,,, and duL, a symbol 0 decoded. Any decoded values that do not fall within thcsc two ranges indicates an error, and the spectral location will be logged. This log is used to adaptively adjust the decoder weighting (Section 2.52).
I 1.0-
0.8-
r : & 0.6- L a D
2.4 Signal conditioning Two forms of signal conditioning are required. The first is windowing 1131 rcquired prior to FFT. The second is to stabilise the masking threshold by reducing energy diffcr- ences before and after encoding.
2.4.7 Data flipping: Data flipping [2,7] replaces conventional windowing. It enforces periodicity in order to alleviate Gibbs phenomenon [XI normally associated with a rectangular window. Data flipping creates a frame of 2N samples from an original frame of N samples by mirroring the time-domain values about the Nth sample. Using this method, spectral modifications can he perfor- med directly on the spectrum prior to resynthesis.
IEE Pm.-Vir. lniosc Sipd Pmcess., b l . 149. No. 6, December 2002
... wkh dimer
2.4.2 Maintaining constant partition energy: The partition energy as defined in [ I I] is directly related to the masking threshold S, . Spectral modifications will change partition energy and therefore S,,z. To minimise changes in S,, it is necessary to keep the energy in a partition constant before and after modification. During encoding, the net change in partition energy is monitored, and is compensated by a corresponding change in ampli- tude scaling at the FFT output.
2.4.3 Dithering: Conservation of cnergy between the time and spectral domains implies that the power change caused by quantisation in the time domain will lead to loss/gain of spectral power, consequently affecting par t - tion power. Dithering [14, I O ] is applied to reduce the power difference before and after encoding: during quanti- sation, an accumulator tracks fractional loss or gain due to rounding each sample. When the accumulator reaches a value of + I or -1, the ncxt integer is incremented or decremented accordingly and the accumulator reset. This compensates for power differences, Fig. 3 illustrates the effect of dithering on the partition power difference for a typical audio Signal. It shows that dithering reduces the partition power difference, especially for low to mid-range frequencies.
2.5 Robustness control Several error correcting capabilities arc employed to improve watermark robustness.
2.5.7 lnterleaving and repeating: The system encodes a 25-hit watermark over 10.6 s of stereo 16-bit 44.1 kHr audio. Each watermark hit is repeated 16 times to yield a 16 by 25-bit matrix. This is then interleaved [IS, 161 using a 20 by 20 interleave matrix. After repeating and interleaving, each bit is spread across five consecutive frames. During dccoding, the reverse process takes place. Repeating the bits corrects random errors whilc interlcav- ing counteracts burst crrors. Burst errors are relatively common since decoding is sensitive to masking threshold variation. A small perturbation in threshold can result in a burst of incorrectly identified data.
Most signal processing operations tested resulted in significant variation in the calculated masking threshold. lnterleaving and repeating is therefore crucial to ensure correct watermark detection.
Fig. 3 per.fiunzr
Efecl ofqplying ditheriRg to redrice total power change
337
2.5.2 Use of weighting curve for decoding: Most forms of processing tend to affect certain frequencies more than others. In particular, low frequency components contribute more power and are therefore typically more robust than high frcquencies. A weighting curve is employed to de-emphasise hidden data recovered from frequency regions likely to have experienced greater degra- dation. For experimental purposes, an inverse exponential curve ( W ; = I ,024-') has becn used, significantly increas- ing the robustness of the system to many of the distortion tests of Scction 3.
Ideally, the weighting curve should correspond to the channel characteristics betwccn cncodcr and decoder, such as the inverse exponential weighting curve to most tests in Section 3. However, without the luxury of a priori channel characteristic knowledge, it has been found that analysis of out-of-range decoded bit values (data levels that do not fall within the tolerance bands as described in Section 2.3) obtained at the decoder can be used to define adaptively an appropriate weighting curve. For example, if there are consistently more out-of-range values at high frequencies, transmission probably included a low-pass filter element. Therefore, a weighting curve that emphasises low frequen- cies should be used.
2.5.3 Scalable hidden data levels: To increase robustness, hidden data levels are calculated from the masking threshold S,,, as shown in Fig. 2. The avai- lable FFT spectral magnitude space (Le. that space between the minimum level keep-out region and the masking threshold lower deviation), is divided into two equal portions. During decoding, a spectral line tagged by the psychoacoustic model as usable, which has a value falling in the higher portion denotes a value of 1, while the lower denotes a 0. If the encoded audio signal is amplified, the value of S, will also vary proportionately. In this case, the relative relationship between the data levels for 1 and 0 is preserved and accurate decoding is still possible.
Detection of the two data lcvels is performed within tolerance bands for each (Fig. 2). This helps to eliminate spurious hidden data produced by signal distortion, and enables disallowed regions to indicate erroneous recovery (and hence an error-to-frequency mapping used to adapt the weighting of recovered bits).
3 Results
The systcm dcscribed has becn found resistant to many deliberate signal processing attacks. Tests are presented here to quantify the resistance of the system to amplitudc scaling, filtering and additive white noise. In cdch investi- gation, random 25-bit watermarks were encoded in 10 audio clips of approximately 15 s each covering a wide genre of music. Each plotted data point is an average of six mns of the test set. Each investigation is performed twice; once with the basic inverse exponential weighting curve (as described in Section 2.5.2) and once without.
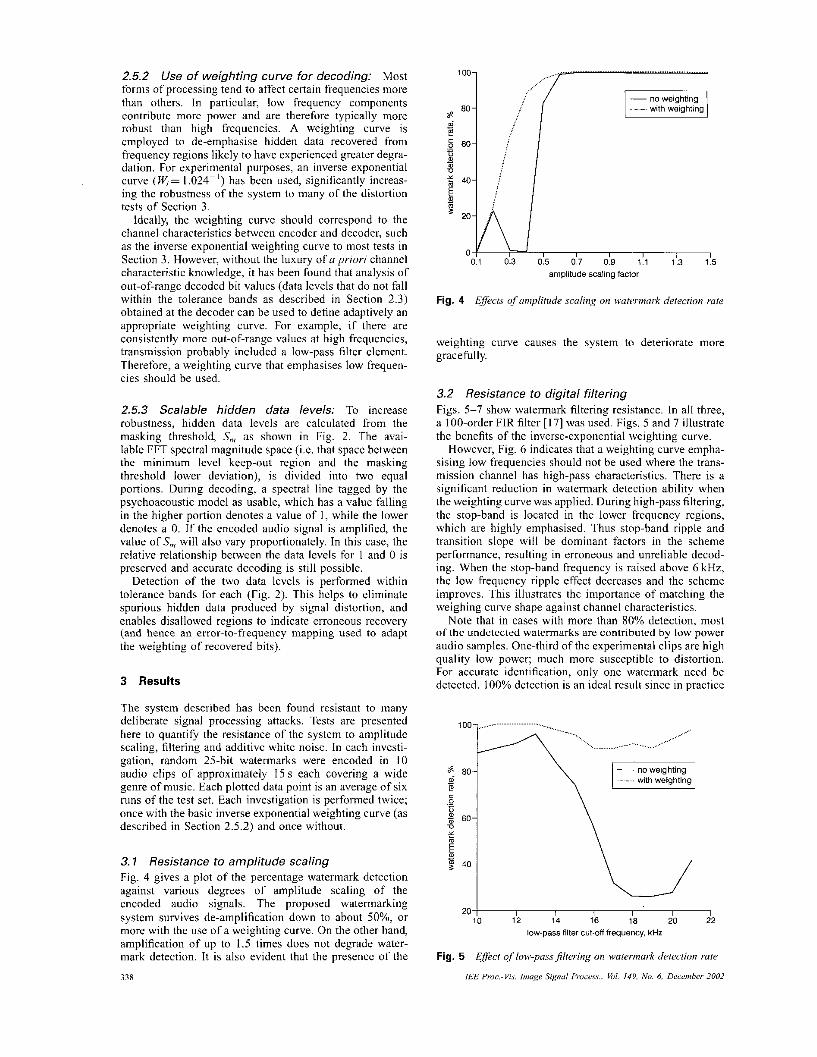
3.7 Resistance to amplitude scaling Fig. 4 gives a plot of the percentage watermark detection against various degrees of amplitude scaling of the cncoded audio signals. The proposed watermarking system survives de-amplification down to about SO%, or more with the use of a weighting curve. On the other hand, amplification of up to 1.5 times does not degrade water- mark detection. It is also evident that the presencc of the
338
100
80 s 5 E E 60
I
.. m D - * 40
t, E I
20
0 I
. ... ... ... with weighting
I , I 0.3 0.5 0.7 0.9 1.1 1.3 1.5
amplitude scaling fador
Fig. 4 Effect& qf amplitude scolrng o n watcrmork detection rale
weighting curve causes the system to deteriorate more gracefully.
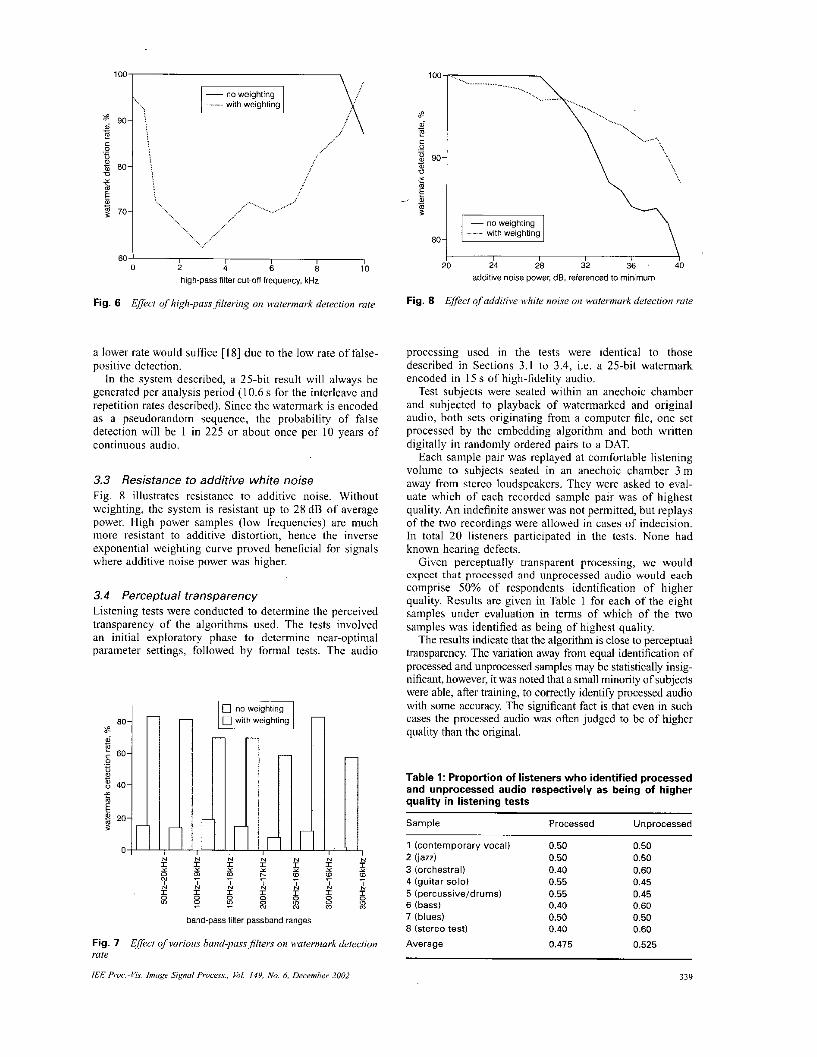
3.2 Resistance to digital filtering Figs. 5-7 show watennark filtering resistance. In all three, a 100-order FIR filter [ 171 was used. Figs. 5 and 7 illustrate the benefits of the inverse-exponential weighting curve.
However, Fig. 6 indicates that a weighting curve empha- sising low frequencies should not be used where the trans- mission channel has high-pass characteristics. There is a significant reduction in watermark detection ability when the weighting curve was applied. During high-pass filtering, the stop-band is located in the lower frequency regions, which are highly emphasised. Thus stop-band ripple and transition slope will be dominant factors in the scheme performance, resulting in erroneous and unreliable decod- ing. When the stop-band frequency is raised above 6 kHr, the low frequcncy ripple effect decreases and the scheme improves. This illustrates the importance of matching the weighing curve shape against channel cliaracteristics.
Note that in cases with more than 80% detection, most o f thc undctccted watermarks are contributed by low power audio samples. One-third of thc experimental clips are high quality low power; much more susceptible to distortion. For accurate identification, only one watermark need be detected. 100% detection is an ideal result since in practice
With werghling
20 I I , I I , I 10 12 14 16 18 20 22
low-pass filler cut-off frequency, kHz
Fig. 5 Effect uflowpassfilrering on wawmoik detection rule
IEE Pruc.~V;s. f m q e Signal Pwcc~r.. Ed 14Y. Nr,. 6. December 2002
- no weighting -...... with weighting
2 4 6 8 to high-pass fiiter curofl frequency, kHz
Effect qf liigh-pussj/teri~ig on watermark dereclion rate Fig. 6
a lower rate would suffice [IS] due to the low rate o f false- positive detection.
In thc system described, a 25-hit result will always hc generated per analysis period (10.6 s for the interleave and repetition rates described). Since the watermark is encoded as a pseudorandom sequence, the probability of false detection will be 1 in 225 or about once per I O years of continuous audio.
3.3 Resistance to additive white noise Fig. X illustrates resistance to additivc noise. Without weighting, the systcm is resistant up to 28 dB o f average power. High power samples (low frequencies) are much more resistant to additive distortion, hence the inverse exponential wcighting curve proved beneficial for signals where additive noise power was higher.
3.4 Perceptual transparency Listening tests were conducted to determine the perceived transparency of the algorithms used. The tests involved an initial exploratory phase to determine near-optimal parameter settings, followed by formal tests. The audio
t E 3
!
!
band-pass filter passband ranges
Fig. 7 rate
Effect of wrioru hanrl-pass.filters on u~aremmrk detection
I&? Prm~l'is. Imoge 9gnnol Prucerr, Lbt. I I Y , rVo. 6. Decemher 2002
Fig. 8 Effect qfuddilive white noise on wrrrermork detection rule
processing used in the tests were identical to those described in Sections 3.1 to 3.4, i.e. a 25-bit watermark encoded in 15 s of high-fidelity audio.
Test subjects were seated within an anechoic chamber and subjected to playback of watermarked and original audio, both sets originating from a computer file, one set processed by the embedding algorithm and both written digitally in randomly ordered pairs to a DAT.
Each sample pair was replayed at comfortable listening volume to subjects seated in an anechoic chamber 3 m away from stereo loudspeakers. They were asked to eval- uate which of each recorded sample pair was of highest quality. An indefinite answer was not permitted, but replays of the two recordings were allowed in cases of indecision. In total 20 listeners participated in the tests. None had known hearing defects.
Given perceptually transparent processing, we would expect that proccsscd and unprocessed audio would each comprise 50% of respondents identification of higher quality Results are given in Table 1 for each of the eight samples under evaluation in terms of which of the two samples was identified as being of highest quality.
The results indicate that the algorithm is close to perceptual transparency. The variation away from equal identification of processed and unprocessed samples may he statistically insig- nificant, however, it was noted that a small minority of subjects were able, afler training, to correctly identify processed audio with some accuracy. The significant fact is that even in such cases the processed audio was often judged to he of higher quality than the original.
Table 1: Proportion of listeners who identified processed and unprocessed audio respectively as being of higher quality in listening tests
Fig. 9 Original audio ~.ovef001777 ogainsi time (tup) plofted "long- side the dif&rnce henveen 1hi.r and rhe processed datu (bonum) io the sunre lineor scale
Despite the acuity of certain listeners, the majority of test subjects reinforced the results by indicating informally that they could not distinguish any difference between each of the sample pairs.
An often used but perceptually irrelevant, objective metric is spectral distortion. Tests applied to various audio samples indicate that this figure, measured frame-by-frame between original and processed audio, avera es 5 8 x IO-' dB2 with a worst case figure of 4.0 x 10⁻⁴dB and vanance 8.2 x
A time-domain plot of the difference between a typical processed and unprocessed audio sample is given in Fig. 9, where the process is extended for illustrative purposes to load a maximum amount of data into the signal. It can be seen that, following the principles of psychoacoustics, the largest changes caused by processing tend to be directed towards periods o f time in which audio amplitude is greatest.
B ' .
4 Discussion
4.7 Phase shiff caused by data flipping Data flipping adds the original spectrum tu its phase shifted conjugate. If R(k) is the original spectrum, data flipping followed by an FFT [ 2 ] would yield the following spectral response:
This phase interference has an effect on spectral modifica- tions. It was discovered that the decoded spectral magni- tude decreases (compared to the encoded value) with increasing spectral index k. A proportionality between the magnitude decrease and k lcads to the realisation that the magnitude to be encoded should be distributed across both real and imaginary parts according to the value of k. To prevent reduction in the decoded spectral magnitude, the following adjustment factors are needed:
n - k k and 9= J7~ (2)
n ~ k)' + k
where c is the encoded spectral line magnitude and
72 and f arc the real and imaginary parts of the spectral line rcpresenting a hidden bit. This scaling ensures that there will be no significant magnitude change between encoding and decoding.
5 Conclusions
An audio data concealment and watermarking system has bccn dcmonstratcd that uses direct substitution of FFT coefficients. This allows a perceptual model to be inte- grated directly into the process. Use of a psychoacoustic model reduces the possibility of introducing audible arte- facts, however, it also reduces system robustness since the calculation of masking threshold is highly sensitive to signal distortion. The proposed system uses error correct- ing and alleviation techniques such as repetition, interleav- ing and error de-emphasis with an adaptive weighting curve to increase robustness. The system is signilicantly resistant to amplitude scaling, filtering and additive white noise to an extent that detection is possible even when the carrier audio is highly degraded. Using a weighting curve, most music clips can be subjected to 70% de-amplification followed by I O kHz low-pass filtering followed by 34 dB additive white noise to yield 100% watermark detection.
6 Acknowledgments
The authors are pleased to acknowledge the support of the Singapore Government Applied Research Funding Grant no RG47/98 towards this research.
7 References
I RABINER, L.R.. and SCHAFER, R.W.: 'Digital processing of speech signals' (Pientice-Hall, 1978)
2 CHEH. P.: 'Design " f a windowless digital filter using FFTalgonthm'. A Stanford Lincar Accclcivfor Cenfre Publication
3 GARCIA, A.R.: 'Digital walcmvilrking ofaudio signals using a psychoa- coustic auditow modcl and sorcad mectmm theow'. 107th AES-
6 TEWFIX. A.H., HAMDY. K.N., and BONEY. L.: 'Digital watermarks for audio signals', lEEE Mu/mm/io, 1996
9 ZWICKER. E., and ZWICKER. U.T.: 'Audio engineering and psychoa- coustics: matching signals to the filial receiver. the human auditory syslcm'.J Atrdio Eng Soc.. tYY1,39,(3), pp. 115-126
10 LIPSHITZ. S.P., WANNAMAKER. R.A.. and VANDERKOOY, J.: 'Quantization and dither: a thearctical survcy', J. Audio En8. Soc., 1992.40, (5) . pp. 355-375
11 ISO/IEC lntemational Standard IS I 1172-3: 'Information Technology - coding ofmoving pictuies and associated audio for digital storage media at up to about 1.5 Mbits/s - Part 3: Audio'
12 ZWICKER. E., and FASTL. H.: 'Psychoacoustics: facts and models'
13 LINDQUIST, C.S.: 'Adaptive & digital signal processing: with digital
14 POHLMANN. K.C.: 'Principles of digital audio' (RlcGraw-Hill, 1995) I5 LEE, C.L.H.: 'Error carrccting block codes' (Artech House, 2000) 16 RHEE, M.Y.: 'Error correcting coding thrury' IMcGraw Hill, 1989) 17 OPPENHEIM. A.V. SCHAFER. R.W.. and BUCK. J.R.: 'Discrete-time