Perceptual Rhythms Rufin VanRullen CNRS, CENTRE DE RECHERCHE CERVEAU ET COGNITION UNIVERSITE DE TOULOUSE, FRANCE Abstract It is increasingly evident that brain function involves oscillatory activity in various frequency bands. This realization encouraged psychologists to consider that perception and cognition may operate periodically, as a succession of cycles mirroring the underlying oscillatory cycles. This idea, related to the age-old notion of discrete perception, has resurfaced in recent years, fueled by advances in neuroscientific techniques. Contrary to earlier views of discrete perception as a unitary sampling rhythm affecting all perceptual and cognitive functions, contemporary evidence points not to one but several rhythms of perception that may depend on the sensory modality, the task, the stimulus, the brain region(s) involved, or the state of the subject. In the visual domain for example, a sensory alpha rhythm (~10Hz) may co-exist with at least one more rhythm performing attentional sampling around 7Hz. How these multiple periodic functions coordinate with each other, and how internal sampling rhythms coordinate with overt sampling behavior, are key questions for the future. Key Terms: Discrete Perception, Brain Oscillations, Phase, Frequency, Vision, Audition, Somatosensation, Attention Introduction Is perception discrete or continuous? Our senses experience the world in an apparently seamless perceptual flow, but that impression may just be an illusion: were that stream broken, interrupted at regular intervals, would we even notice such discontinuities? Cinematographic and digital sampling of video and audio sources are simple demonstrations that, as long as interruptions are brief and frequent enough, perception remains mostly unaffected (VanRullen, Zoefel, & Ilhan, 2014; Zoefel, Reddy Pasham, Bruers, & VanRullen, 2015). So, might the brain itself break its own sensory processes into 1
Transcript
Perceptual Rhythms Rufin VanRullen CNRS, CENTRE DE RECHERCHE CERVEAU ET COGNITION UNIVERSITE DE TOULOUSE, FRANCE
Abstract It is increasingly evident that brain function involves oscillatory activity in various frequency bands. This realization encouraged psychologists to consider that perception and cognition may operate periodically, as a succession of cycles mirroring the underlying oscillatory cycles. This idea, related to the age-old notion of discrete perception, has resurfaced in recent years, fueled by advances in neuroscientific techniques. Contrary to earlier views of discrete perception as a unitary sampling rhythm affecting all perceptual and cognitive functions, contemporary evidence points not to one but several rhythms of perception that may depend on the sensory modality, the task, the stimulus, the brain region(s) involved, or the state of the subject. In the visual domain for example, a sensory alpha rhythm (~10Hz) may co-exist with at least one more rhythm performing attentional sampling around 7Hz. How these multiple periodic functions coordinate with each other, and how internal sampling rhythms coordinate with overt sampling behavior, are key questions for the future.
Introduction Is perception discrete or continuous?
Our senses experience the world in an apparently seamless perceptual flow, but that impression may just be an illusion: were that stream broken, interrupted at regular intervals, would we even notice such discontinuities? Cinematographic and digital sampling of video and audio sources are simple demonstrations that, as long as interruptions are brief and frequent enough, perception remains mostly unaffected (VanRullen, Zoefel, & Ilhan, 2014; Zoefel, Reddy Pasham, Bruers, & VanRullen, 2015). So, might the brain itself break its own sensory processes into
1
rapidly recurring fragments? Introspection cannot directly answer this question, since continuous inputs and rapidly discretized ones essentially give rise to indistinguishable percepts. Other scientific approaches, however, can be applied to address this question, and the present chapter is intended to review the existing literature. Surrendering the futile pursuit of an exhaustive review, I shall put an emphasis on recent results investigating the potential role of brain oscillations in this sensory discretization –hence the notion of “perceptual rhythms”.
A brief History of Discrete Perception
Discrete Perception in the 19th century Before the advent of modern brain research, questioning the temporal
organization of cognitive processes was mainly the quest of philosophers and early psychologists. Among the first philosophers to explicitly consider the possibility and implications of discrete mental processing epochs was Karl Ernst von Baer (Whitlock, 2009). He estimated that humans can enjoy between 6 and 10 “life moments” each second –a particularly astute guess, as will be seen in the following sections. He further reasoned that this number could be significantly smaller or larger for different animal species. In an influential address delivered in 1860 to the Russian Entomological Society, von Baer speculated about the phenomenology of imaginary beings whose perceptions would unfold 1,000 times faster or slower than ours (von Baer, 1860). The same “thought experiment” was echoed by Friedrich Nietzsche (as translated in (Nietzsche & Whitlock, 2001)) and later by William James, one of the forefathers of modern psychology (James, 1890):
“Suppose we were able, within the length of a second, to note 10,000 events distinctly, instead of barely 10, as now [...]. The motions of organic beings would be so slow to our senses as to be inferred, not seen. The sun would stand still in the sky, the moon be almost free from change, and so on. But now reverse the hypothesis and suppose a being to get only one 1000th part of the sensations that we get in a given time [...]. Winters and summers will be to him like quarters of an hour. Mushrooms and the swifter-growing plants will shoot into being so rapidly as to appear instantaneous creations; [...] the motions of animals will be as invisible as are to us the movements of bullets and cannon-balls [...].” (Vol I, p 639)
But no direct evidence for discrete perception existed at the time, and even James did not pursue this notion much further:
2
“Consciousness, then, does not appear to itself chopped up in bits. Such words as ‘chain’ or ‘train’ do not describe it fitly as it presents itself in the first instance. It is nothing jointed; it flows. A ‘river’ or a ‘stream’ are the metaphors by which it is most naturally described.” (Vol I, p 239)
Early 20th century: the cinematograph and the electroencephalograph
The state of the matter changed dramatically at the turn of the century, however, with the invention of the cinematograph. The cinema was the obvious illustration that it was possible, after all, to create a continuous ‘stream’ of perception out of a series of still snapshots. Henry Bergson, for example, wrote on “The cinematographic mechanism of thought, and the mechanistic illusion” (Bergson, 1911):
“We take snapshots, as it were, of the passing reality [...] Perception, intellection, language so proceed in general. […] we hardly do anything else than set going a kind of cinematograph inside us.” (p 332)
The relevance of the cinema as a metaphor for sensory perception became even more limpid a few years later, with Berger’s first reports of electro-encephalographic (EEG) recordings in human subjects, laden with oscillatory activity (Berger, 1929). What could this prominent alpha (~10Hz) rhythm be, but an electrical signature of the recurring “snapshots” of perception? Berger’s work was followed up by prominent physiologists, such as Lord Adrian (Adrian & Yamagiwa, 1935).
Cybernetics Interrupted by World War II, the story resumed with a significant
development in the form of digital computers, and the accompanying emergence of the Cybernetics movement, aimed at replicating brain processes in digital machines. In his founding monograph, Norbert Wiener, one of the fathers of cybernetics, evoked constraints faced by artificial sensory systems. In so doing, he linked the alpha rhythm to a recurring perceptual sweep or “scanning” process (Wiener, 1948):
The scanning apparatus should have a certain intrinsic period of operation which should be identifiable in the performance of the brain. [...] In fact, it has the order of frequency appropriate for the alpha rhythm of the brain, as shown in
3
electroencephalograms. We may suspect that this alpha rhythm is associated with form perception, and that it partakes of the nature of a sweep rhythm, like the rhythm shown in the scanning process of a television apparatus. (p 164)
A related hypothesis was independently put forward by Walter Pitts and Warren McCulloch, two other founders of Cybernetics. They envisioned a large-scale artificial neural network that would emulate biological form perception. In this network, a process equivalent to the alpha brain rhythm was intended to periodically scan the activities of individual neurons, like the sweep of a radar on a screen (Pitts & McCulloch, 1947):
“If our model fits the facts, this alpha-rhythm performs a temporal ‘scanning’ of the cortex which thereby gains, at the cost of time, the equivalent of another spatial dimension in its neural manifold.” (p 133).
Perceptual moments and brain oscillations Thus began a “golden age” for discrete perception. The hypotheses put
forward by the cyberneticists generated a wave of enthusiasm in the scientific community, particularly among physiologists and experimental psychologists, who set out to demonstrate the theory.
John Stroud, for instance, formalized a psychological counterpart to Wiener, Pitts and McCulloch’s “cortical scanning” idea, which he dubbed the “psychological moment” of perception (Stroud, 1956). He suggested that this moment, the indivisible unit of psychological time, was around 100ms. Numerous experimental studies were conducted, which have already been summarized in review articles of the same epoch (White, 1963; Shallice, 1964; Harter, 1967) as well as more recent surveys (VanRullen & Koch, 2003; VanRullen & Dubois, 2011). Without going into unnecessary detail (and keeping in mind that those studies that are still relevant today shall be addressed in subsequent sections of this chapter), it is noteworthy that many of these psychological findings revolved around the measurement of a time window during which successive stimuli are perceptually integrated. For example, under some conditions two sensory events are perceived as simultaneous if they appear within less than 50ms of each other (Hirsh & Sherrick, 1961; Kristofferson, 1967). Temporal numerosity judgments reach a ceiling around 10-12 events per second, meaning that faster cycling sequences are still judged to contain 10-12 events per second (White, 1963; White & Harter, 1969). When a composite stimulus (e.g. 4 flashing lights) is repeated in a cycle of total duration under approximately 125ms, all component events appear simultaneous, regardless of the relative timing between them (Lichtenstein, 1961). Perception of causal relations between two sensory events also presents an
4
apparent minimal window of ~70ms during which all stimuli appear causally linked, and a maximal window of ~140ms beyond which causality perception is hardly ever reported (Michotte, 1963; Shallice, 1964). To proponents of the discrete perception theory, such windows of integration of about 100ms were manifestations of Stroud’s “perceptual moments”, like a series of cinematographic snapshots recurring at a rate of ~10Hz1.
Unfortunately, it was later recognized that these windows of integration do not directly validate discrete perception. Instead, they can be more trivially explained as a form of “low-pass” temporal sensitivity, a mere “blur” of the mental timeline that was alternately referred to as “travelling moment” (Allport, 1968) or “iconic persistence” (Di Lollo & Wilson, 1978). Importantly, the blurred mental timeline may still unfold continuously, rather than discretely.
Electrophysiological methods were also employed at the time to investigate discrete perception, by linking parameters of EEG (and more specifically, alpha) rhythmic activity to behavioral measurements. Indeed, discrete perception theory predicts that changes in the frequency of alpha oscillations (mainly recorded between different individuals) or in the phase of such oscillations (recorded at different moments from the same individual) should be accompanied by significant perceptual changes. When the frequency accelerates or slows down, so should our perceptual abilities. When a stimulus occurs at one or the opposite phase of the oscillatory cycle, its processing may be entirely confined to a single perceptual moment, or broken up into successive moments. Worse, a very brief stimulus might even fall in the interval between two successive moments, and fail to be effectively registered; at the opposite phase of the cycle the same stimulus would be processed optimally, giving rise to improved accuracy and faster reaction times. And as expected, reaction times were found to depend on both alpha frequency (Surwillo, 1961, 1964) and alpha phase at stimulus onset (Callaway & Yeager, 1960; Dustman & Beck, 1965). Similarly, temporal judgments of simultaneity were related to both alpha frequency (Kristofferson, 1967) and phase (Varela, Toro, John, & Schwartz, 1981).
But these findings also had pitfalls. Alpha frequency differences between individuals, for example, co-vary with numerous other factors such as age (Surwillo, 1964) or intelligence (Vogel & Broverman, 1964), which might in turn influence reaction times and other behavioral measures. The link between alpha frequency and perceptual moment duration was thus tenuous at best. In addition, the successful findings of EEG alpha phase dependence of perception were also accompanied by negative reports (Walsh, 1952) and failed replications (Gho & Varela, 1988). In short, the jury was still out on discrete perception.
1 Similar findings of perceptual simultaneity thresholds with temporal integration windows around 30ms prompted Ernst Pöppel to suggest the existence of discrete “system states” at 30Hz, rather than 10Hz (Poppel, 1997).
5
Discrete perception: reloaded
Brain rhythms, plural Meanwhile, human and animal electrophysiology continued to progress and
gradually came out of the spell of the alpha rhythm. Other brain rhythms, in just about every frequency band (within the limits afforded by biophysical constraints), were discovered and explored. Barring a decade-long obsession with the gamma rhythm (~30-80Hz) in the 1990s, it is now widely accepted that brain oscillations are present, often simultaneously, in multiple brain regions and networks, and at multiple frequencies. These rhythms have been linked to numerous perceptual and cognitive functions, as already described in several literature reviews, of which only a few can be cited here (Varela, Lachaux, Rodriguez, & Martinerie, 2001; Schnitzler & Gross, 2005; Buzsaki, 2006; Roopun et al., 2008; Kopell, Kramer, Malerba, & Whittington, 2010; Arnal & Giraud, 2012; Giraud & Poeppel, 2012; Siegel, Donner, & Engel, 2012; Thut, Miniussi, & Gross, 2012; Fries, 2015). This expansion of the realm of brain rhythms has two important implications for the issue of discrete perception.
1. First (and just as argued previously concerning the alpha rhythm), whenever a particular perceptual or cognitive function is found to be associated with a specific brain rhythm, it must then involve an ensemble of neurons whose activity is modulated periodically by this brain rhythm. It logically follows that the perceptual or cognitive function under study should operate periodically (or “rhythmically”, or “cyclically”), i.e. as a sequence of successive episodes with well-defined "on" and "off" periods (or, at least, with more favorable and less favorable moments). This entails again the notion of a "perceptual rhythm".
2. Second (and contrary to the reigning “alpha” dogma), such periodicities should logically also be present simultaneously at multiple frequencies, in multiple brain networks contributing to multiple cognitive functions.
A paradigm shift Consequently, a paradigm shift appears to be needed in order to properly
explore the potentially periodic nature of perception. We must stop searching for a single period encompassing all of our conscious perception, i.e., we must abandon the notion of a unique “psychological moment”. Several perceptual and cognitive rhythms can operate in parallel, at different frequencies and/or with different
6
phases2. This upheaval has already begun, a revamped scientific approach in which the simplistic interrogation “is perception discrete?” has been replaced by the more pragmatic experimental questions:
1. Which perceptual and cognitive functions operate rhythmically, and which do not?
2. What are the corresponding frequencies? 3. How are they related? Much progress has been made in recent years on the first two questions, as
will be developed in detail in the following sections. Answering the third, and arguably the most fascinating question, may still require the collection of many more data points until a clear pattern emerges (see “Future Directions”).
Terminology Here I will equivalently use the terms “perceptual rhythm”, “cycle”, or
“periodicity” to refer to the main situation of interest, that of a perceptual function whose outcome is periodically modulated following the cycles of a given brain rhythm. I will henceforth reserve the term “discrete perception” for those specific situations (a subset of all perceptual rhythms) in which the perceptual variable that oscillates is directly related to temporal parsing. Temporal parsing can be defined as the determination of temporal relations between events, such as simultaneity, temporal order, apparent motion, etc. These temporal relations are first in line to be affected by discrete frames or snapshots chopping up the perceptual stream. These two situations, perceptual rhythms and discrete perception, can thus be thought of as a “moderate” and a “radical” versions of the original “cinematographic perception” idea. The former situation metaphorically relates to the shutter of the camera opening and closing periodically; the latter to the static property of each snapshot, namely that no temporal information can ever unfold within one snapshot –only between snapshots3.
2 The opposite logic was put forward by Geissler, who attempted to reconcile various reports of perceptual periodicity at distinct frequencies by postulating a unique “quantum” of perception around 4.5ms (or ~220Hz), from which all periodicities would derive via harmonic relations (Geissler, 1987). 3 The necessity of representing static information within each discrete snapshot is not incompatible, however, with the neural representation of sensory attributes that are computed by differentiation over a certain time interval, such as visual motion and flicker, auditory pitch, inter-aural time differences, etc. It only requires that these temporal attributes be derived before the discretization occurs (possibly by making use of specialized low-level neural populations). Then the corresponding neural activity need not be updated within a given snapshot, only between successive ones. In the words of Francis Crick and Christof Koch, motion can be ‘painted’ onto each static snapshot (Crick & Koch, 2003).
7
Periodicities in vision Nature of evidence for Perceptual Rhythms
It seems only fitting to begin this review of perceptual periodicities by listing evidence in the visual domain, which has traditionally been the modality of choice for such investigations. Most of the evidence to date concerns perceptual rhythms of the visual sense, but this does not imply that periodicities do not also affect other senses –only that less effort has been spent looking for them. Non-visual periodicities will be addressed in the next sections.
There are two independent classifications that can be applied to this body of literature. First, what classes or subtypes of visual processes have been found to operate rhythmically? As will be seen shortly, so many distinct visual functions fit the bill that this classification nearly encompasses all of vision; yet it may prove particularly useful in a long-term effort to relate perceptual function to rhythmic frequency (see Future Directions). The second distinction concerns the nature of experimental evidence that can be drawn to demonstrate perceptual periodicities. As discussed previously, some initially compelling observations were eventually hampered by alternative interpretations, and it thus seems critical to make sure that the evidence presented here is reliable. For this reason, I have chosen to organize the narrative of this review according to this second classification, i.e. according to the type of experimental evidence. The different classes of perceptual functions affected by periodicities will nonetheless become evident as the list unfolds in the following pages. The full list itself is presented in Table 1, explicitly detailing for each study the perceptual or physiological variable under scrutiny as well as the nature of experimental evidence; and obviously, the observed frequency of rhythmicity.
In a sense, and as argued above, any of the many thousands of published studies relating sensory perception and brain rhythms can be taken as evidence for periodicities in perception; but this experimental evidence can turn out to be more or less direct, and a line must then be drawn somewhere. For example, as explained in the Introduction, the existence of a temporal integration window of perception is certainly compatible with, but does not constitute direct evidence for discrete perception. Neither does the mere correlation between the amplitude of a brain rhythm and any given perceptual variable –the rhythm, after all, might just be an epiphenomenon (or, as put by John Lisman: “if you kick your trash can, it will oscillate at its resonant frequency, and the brain may be no different” (Lisman, 2007)). By the same token, I chose to leave aside (potentially relevant) studies measuring phase-amplitude coupling between different rhythms, phase coherence between electrodes or brain regions, and local coupling between phase and neuronal firing. Only a link between perception (or at least, large-scale
8
markers of perception such as EEG, MEG or BOLD responses) and oscillatory phase per se –i.e., the precise phase value of the rhythm at a given moment in time- and, in some situations, oscillatory frequency, can be considered as direct evidence for rhythmic perception. (The logic behind these assertions will be developed in the corresponding sections below). Similarly, we must initially choose to ignore studies where the perceptual periodicity is driven (or “entrained”) by an obvious periodicity in the stimulus itself, as such experiments only provide indirect information about the intrinsic (or natural, spontaneous) rhythmicity of perceptual processes. This criterion rules out a vast number of potentially significant studies (e.g. (Lakatos, Karmos, Mehta, Ulbert, & Schroeder, 2008)), but it appears justified at least in the context of a first cautious review of direct experimental evidence for periodic perception. In fact, this criterion will turn out to be even more restrictive for the auditory domain, in which most observations of perceptual periodicities are driven or entrained, particularly in the context of speech processing (Large & Jones, 1999; Lakatos et al., 2008; Schroeder & Lakatos, 2009; Giraud & Poeppel, 2012; Thorne & Debener, 2013; VanRullen et al., 2014). The same criterion will also exclude findings of perceptual periodicities tied to rhythmic overt sampling, such as caused by micro-saccades in vision (Bosman, Womelsdorf, Desimone, & Fries, 2009; Chen, Ignashchenkova, Thier, & Hafed, 2015; Lowet, Roberts, Bosman, Fries, & de Weerd, 2015), whisking in rodent somatosensation (Deschenes, Moore, & Kleinfeld, 2012; Kleinfeld, Deschenes, Wang, & Moore, 2014), or sniffing in olfaction (Uchida, Kepecs, & Mainen, 2006; Smear, Shusterman, O'Connor, Bozza, & Rinberg, 2011). Yet the relation between overt sensory sampling and internal (covert) perceptual rhythms is undoubtedly important (Schroeder, Wilson, Radman, Scharfman, & Lakatos, 2010), and will need to be considered eventually (see Future Directions). Overall, these strict criteria probably leave aside a large number of experiments that are in fact germane to the question of rhythmic perception; nonetheless, numerous experimental observations already satisfy these strict criteria, and this can only reinforce our confidence in the reality of perceptual rhythms.
With the above criteria, we are left with 5 general classes of experimental evidence for perceptual rhythms. Each of these will be discussed in turn in the following sections. Along the way, entries of Table 1 (‘Studies demonstrating a periodicity in visual perception or visual processing’) will be addressed at the opportune time.
9
Perceptual/physio-logical variable Nature of evidence Spec. Freq.
(Hz) Spont? Reference V
isio
n
Threshold Perception (low-contrast flash, masked
target, TMS phosphene, illusory percepts)
Oscillation in perceptual accuracy Hum. 33 yes Latour (1967)
BOLD response EEG phase dependence Hum. 10 yes Scheeringa et al (2011)
fMRI network connectivity EEG phase dependence Hum. 7 yes Hanslmayr et al (2013)
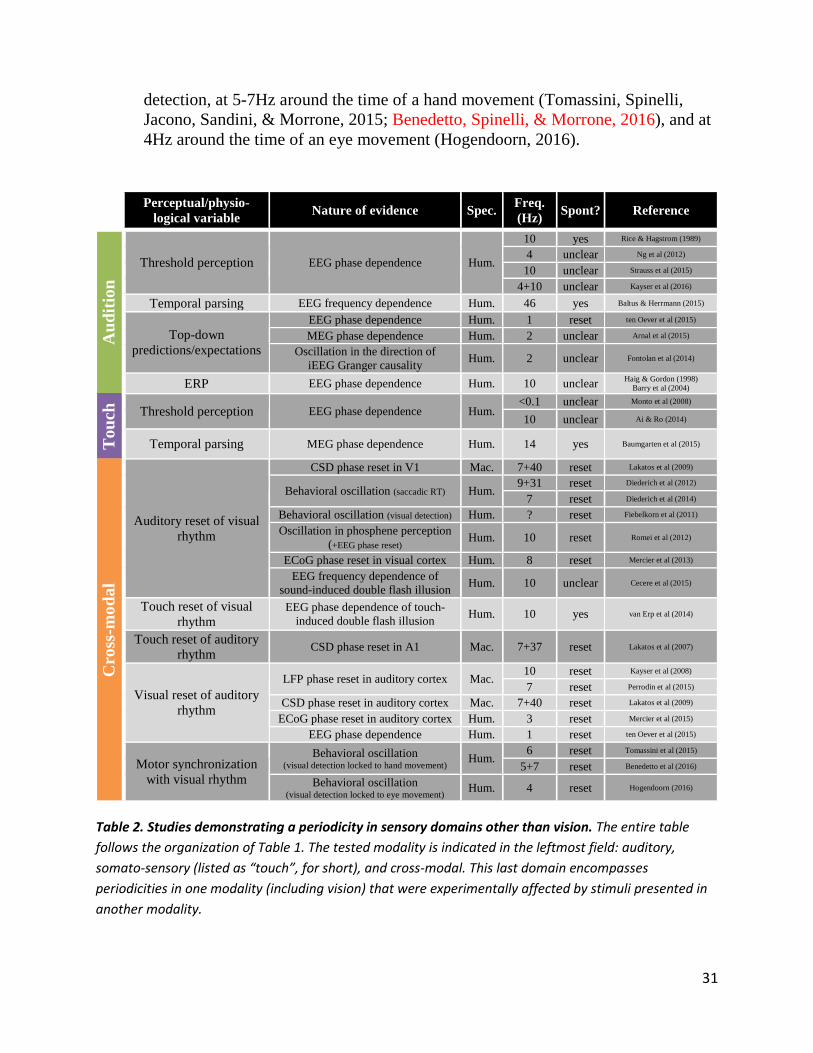
Table 1. Studies demonstrating a periodicity in visual perception or visual processing. Each entry corresponds to a single study, organized according to the following fields (from left to right): 1. perceptual/physiological variable demonstrating a rhythmicity; 2. nature of evidence; 3. species; 4. frequency of rhythmicity (rounded to the nearest integer; peak frequency is listed when available, otherwise middle frequency of the relevant band; multiple periodicities reported in a single study are listed as x+y+z+…); 5. "Spont?" indicates whether the underlying rhythm was spontaneously produced ('yes') or whether it might have been reset by sensory stimulation ('reset'); in some cases where a resetting event or stimulus was present but did not necessarily affect the conclusion, 'unclear' is mentioned; 6. Bibliographic reference. Note that studies can be listed more than once, when they entail multiple sources of evidence and/or explore multiple perceptual or physiological variables. For obvious reasons, the table does not list negative findings (see Current Limitations). The table is continued from the previous page, with the field header carried over at the top.
Phase-dependent perception and behavior Arguably the most persuasive evidence for rhythmic perception can be
derived from studies relating trial-by-trial variations in perception to trial-by-trial differences in the exact phase of a brain oscillation at the moment the stimulation occurred (VanRullen, Busch, Drewes, & Dubois, 2011). Indeed, ‘a perceptual function whose outcome is periodically modulated following the cycles of a given brain rhythm’ is the precise working definition of rhythmic perception that I suggested earlier (see Introduction). When carried out properly, i.e. using randomized inter-trial durations to guarantee that the stimulus onset is unpredictable, these experiments are powerful tools to measure perceptual periodicities produced by spontaneous, naturally occurring brain rhythms. This tool can be applied to any electrophysiological signal (EEG, MEG, LFP, etc.) and for any perceptual or cognitive function. It is thus no surprise that this type of evidence accounts for more than half of the experimental observations of rhythmic perception to date (as listed in Tables 1 and 2).
In the visual domain, the phase of brain oscillations at various frequencies has already been related to trial-by-trial fluctuations in threshold-level perception (Nunn & Osselton, 1974; Busch, Dubois, & VanRullen, 2009; Mathewson, Gratton, Fabiani, Beck, & Ro, 2009; Busch & VanRullen, 2010; Dugue, Marque,
11
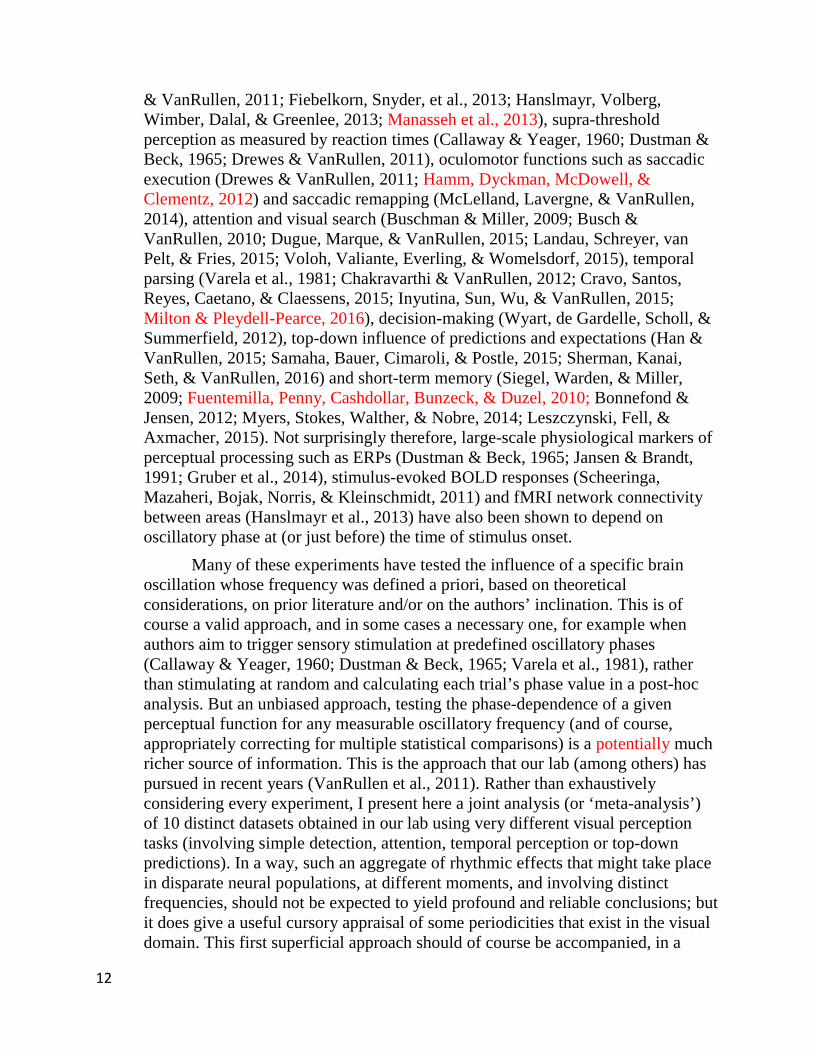
& VanRullen, 2011; Fiebelkorn, Snyder, et al., 2013; Hanslmayr, Volberg, Wimber, Dalal, & Greenlee, 2013; Manasseh et al., 2013), supra-threshold perception as measured by reaction times (Callaway & Yeager, 1960; Dustman & Beck, 1965; Drewes & VanRullen, 2011), oculomotor functions such as saccadic execution (Drewes & VanRullen, 2011; Hamm, Dyckman, McDowell, & Clementz, 2012) and saccadic remapping (McLelland, Lavergne, & VanRullen, 2014), attention and visual search (Buschman & Miller, 2009; Busch & VanRullen, 2010; Dugue, Marque, & VanRullen, 2015; Landau, Schreyer, van Pelt, & Fries, 2015; Voloh, Valiante, Everling, & Womelsdorf, 2015), temporal parsing (Varela et al., 1981; Chakravarthi & VanRullen, 2012; Cravo, Santos, Reyes, Caetano, & Claessens, 2015; Inyutina, Sun, Wu, & VanRullen, 2015; Milton & Pleydell-Pearce, 2016), decision-making (Wyart, de Gardelle, Scholl, & Summerfield, 2012), top-down influence of predictions and expectations (Han & VanRullen, 2015; Samaha, Bauer, Cimaroli, & Postle, 2015; Sherman, Kanai, Seth, & VanRullen, 2016) and short-term memory (Siegel, Warden, & Miller, 2009; Fuentemilla, Penny, Cashdollar, Bunzeck, & Duzel, 2010; Bonnefond & Jensen, 2012; Myers, Stokes, Walther, & Nobre, 2014; Leszczynski, Fell, & Axmacher, 2015). Not surprisingly therefore, large-scale physiological markers of perceptual processing such as ERPs (Dustman & Beck, 1965; Jansen & Brandt, 1991; Gruber et al., 2014), stimulus-evoked BOLD responses (Scheeringa, Mazaheri, Bojak, Norris, & Kleinschmidt, 2011) and fMRI network connectivity between areas (Hanslmayr et al., 2013) have also been shown to depend on oscillatory phase at (or just before) the time of stimulus onset.
Many of these experiments have tested the influence of a specific brain oscillation whose frequency was defined a priori, based on theoretical considerations, on prior literature and/or on the authors’ inclination. This is of course a valid approach, and in some cases a necessary one, for example when authors aim to trigger sensory stimulation at predefined oscillatory phases (Callaway & Yeager, 1960; Dustman & Beck, 1965; Varela et al., 1981), rather than stimulating at random and calculating each trial’s phase value in a post-hoc analysis. But an unbiased approach, testing the phase-dependence of a given perceptual function for any measurable oscillatory frequency (and of course, appropriately correcting for multiple statistical comparisons) is a potentially much richer source of information. This is the approach that our lab (among others) has pursued in recent years (VanRullen et al., 2011). Rather than exhaustively considering every experiment, I present here a joint analysis (or ‘meta-analysis’) of 10 distinct datasets obtained in our lab using very different visual perception tasks (involving simple detection, attention, temporal perception or top-down predictions). In a way, such an aggregate of rhythmic effects that might take place in disparate neural populations, at different moments, and involving distinct frequencies, should not be expected to yield profound and reliable conclusions; but it does give a useful cursory appraisal of some periodicities that exist in the visual domain. This first superficial approach should of course be accompanied, in a
12
second step, by a more detailed consideration of the similarities and differences between perceptual rhythms measured for different visual functions (see Future Directions).
The meta-analysis depicted in Figure 1 reveals highly significant modulations of perceptual outcome by pre-stimulus EEG phase in a rather restricted range of frequencies, roughly between 5 and 15Hz. Such modulations imply that, for a number of visual functions, there is a succession of ‘good’ phases (at which the function is more efficient, eventually leading to an optimal perceptual outcome) and ‘bad’ phases (at which the function is less efficient, eventually leading to sub-optimal perception); this cyclic alternation is already visible in spontaneous EEG oscillations, before the stimulus is even shown. In other words, several visual functions seem to operate periodically, as an ongoing succession of “perceptual cycles”.
Figure 1. Meta-analysis of 10 independent EEG studies of phase-dependent perception from our lab. All studies had in common: 9 to 18 observers; a randomized inter-stimulus interval, guaranteeing unpredictable stimulus onset and an overall uniform distribution of pre-stimulus EEG oscillatory phases across trials; between 4,000 and 75,000 trials overall; an identical stimulus on each trial, but variable perceptual outcome, as reported by the observer. This dependent perceptual variable was different in each study: threshold detection (Busch et al., 2009), threshold detection with attentional manipulation (Busch & VanRullen, 2010), TMS phosphene detection (Dugue et al., 2011), visual search (Dugue et al.,
13
2015), saccadic execution (Drewes & VanRullen, 2011), saccadic remapping (McLelland et al., 2014), temporal parsing as measured by the flash-lag effect (Chakravarthi & VanRullen, 2012) or by a temporal reversal illusion (Inyutina et al., 2015), top-down influence of predictions and expectations (Han & VanRullen, 2015; Sherman et al., 2016). In each study, the statistical analysis involved a comparison of EEG phase distributions between trials yielding distinct perceptual outcomes, separately for every time point around stimulus onset (marked by time 0) and for every oscillatory frequency, from 4 to 50Hz. Significant effects in the time-frequency map thus imply that one phase of the EEG oscillation at the corresponding time and frequency point tended to produce one perceptual outcome, while the opposite phase was associated with the alternative outcome. Note that results were obtained from different groups of electrodes across studies (not shown). The 10 studies were combined using Fisher’s method (Fisher, 1925); the combined p-value represents the probability of observing a similar result if the null hypothesis (no influence of phase on perceptual outcome) was true for all 10 studies. Though the meta-analysis integrates disparate visual functions (essentially, apples and oranges), a consistent pattern is present at frequencies between 5 and 15Hz (left, mean spectral profile of significance across the pre-stimulus period, arbitrary unit axis starting at zero significance, i.e. p=1), with a maximum just before stimulus onset (bottom, mean time course of significance across frequencies, arbitrary unit axis starting at zero significance or p=1). Furthermore, the spectral profile presents two individual peaks at frequencies of 7 and 11Hz.
A number of methodological considerations are in order to properly interpret findings of EEG phase-dependent perception (VanRullen, 2016). One first concern is that pre-stimulus effects could in fact reflect stimulus-evoked activity, smeared back in time due to the spectral analysis. Indeed, phase estimates depend on filtering operations using sliding windows (or “wavelets”) of non-negligible duration (typically, about 3 times the period of the oscillation of interest). Therefore, it is important to verify that the measured pre-stimulus phase differences occur well before (i.e, more than one ½ window duration before) any measurable stimulus evoked responses –and to replicate the analysis using shorter windows otherwise. All but two of the studies included in Figure 1 satisfied this criterion; for the two remaining studies it thus remains conceivable that the observed pre-stimulus phase differences were affected, in part, by differences in stimulus-evoked responses (Drewes & VanRullen, 2011; Chakravarthi & VanRullen, 2012). Overall, however, it is overwhelmingly clear that perception-related phase differences can also exist in strictly spontaneous EEG oscillations.
Another, complementary concern is that the peak phase differences are often observed well before stimulus onset (typically 100-400ms before); rhythmic perception, on the other hand, should predict that the most influential phase for perception is the one recorded at stimulus onset (i.e., at time 0) or even slightly later, when stimulus information reaches the relevant neuronal population(s). This discrepancy is due to the fact that the precise sequence of causal relations existing at the neural level (instantaneous phase affects neural processing, which in turn influences stimulus-evoked responses and eventually, the perceptual outcome) is temporally blurred by the spectral decomposition (as explained before). Stimulus-
14
evoked responses, even when they are modulated according to perceptual outcome, still display highly similar phases across trials (Makeig et al., 2002). This phase similarity smears back in time, concealing the previous phase differences. In the end, the peak phase difference is registered slightly earlier than it should, that is, slightly earlier than time 0 (see Figure 1).
One final methodological remark is that this “phase-dependent perception” approach, at least with EEG, does not allow inferring which precise oscillatory phase value (e.g. trough, peak, zero-crossing…) is optimal for perception, for two reasons. First, the polarity of the phase measured at the scalp can be reversed relative to the polarity of underlying cortical oscillations; whether this reversal occurs depends on several factors such as neural source location, laminar organization and cortical folding. Second, the spontaneous phase measured before stimulus onset has no direct causal influence on perceptual processing: it is only a proxy for the true, causally relevant phase value that will be present at a later time, when the relevant neural population begins to process sensory information. (This latter phase value, as explained previously, is not directly accessible since it is masked by stimulus-evoked activity). Unfortunately, the two phase values (the one recorded before stimulus onset, and the one that will directly affect perception some time later) are tightly related, but by an indefinite phase lag which depends on the exact latency of neurons participating in the visual process under study. As this latency can vary considerably between different individuals and/or different brain functions, and cannot easily be estimated with EEG, the optimal phase value of the perceptual cycle will probably remain a question for future invasive recording studies.
The demonstrated existence of a significant relation between spontaneous oscillatory phase and perceptual outcome does not, in itself, indicate how much of the trial-by-trial variability in perception is explained by changes in the initial phase of the perceptual cycle. It turns out that in many studies this amount is relatively small, on the order of 10-20%. That is, for stimuli falling around the optimal phase, the observed perceptual performance, in a variety of tasks, is about 10% higher than average, and ~10% lower at the opposite phase. While this modulation is clearly not all-or-none, as the notion of “rhythmic perception” might seem to imply, it is also not unexpectedly small, in particular when considering signal-to-noise ratio. For one thing, noise might significantly contribute to the observer’s decision –sometimes they might simply guess or respond randomly, and oscillatory phase cannot be expected to predict their response in this case. But most importantly, noise is a notoriously severe limitation of single-trial electrophysiological measurements, meaning that our readings of the EEG phase value on each trial may often end up far from the truth. The real amount of performance modulation along the perceptual cycle, therefore, remains unknown.
To conclude, it is interesting to note that the spectral profile of perceptual cycles across the 10 studies summarized in Figure 1 is restricted (there are hardly
15
any periodicities above 20 Hz), and presents two well-separated peaks at frequencies of 7Hz and 11Hz. Neither the type of visual functions investigated in those studies (see Table 1), nor the scalp topography of the phase effects (not shown here) reveal a clear-cut dichotomy between periodicities found at 7Hz vs. 11Hz. However, there seems to be an emerging pattern in this wealth of data, in that many studies reporting periodicities around 7Hz tend to involve visual attention and engage fronto-central electrodes (Busch et al., 2009; Busch & VanRullen, 2010; Chakravarthi & VanRullen, 2012; McLelland et al., 2014; Dugue et al., 2015), while those reporting cycles around 11Hz often implicate occipital channels, and might thus relate more directly to sensory aspects of visual perception (Drewes & VanRullen, 2011; Dugue et al., 2011; McLelland et al., 2014; Sherman et al., 2016). Nonetheless, this emerging distinction between a ~11Hz (alpha-band) peripheral or sensory sampling rhythm and a ~7Hz (theta-band) central or attentional sampling rhythm remains speculative, and will need to await further confirmation (see Future Directions).
Frequency-dependent perception Just as the notion of perceptual rhythms predicts a relationship between
oscillatory phase and perceptual performance, a similar prediction can be made about oscillatory frequency. When a postulated perceptual rhythm is faster or slower, the associated perceptual process should also accelerate or slow down in a measurable way. Unfortunately, as we have seen before, a between-subject correlation between brain oscillatory frequency and general perceptual, cognitive or motor abilities (e.g. as measured by RT) can potentially be accounted for by incidental factors (e.g. age, intelligence, hormonal levels, anatomical differences such as brain size or myelination, etc.). Therefore, while such correlations (Surwillo, 1961, 1964; Klimesch, Doppelmayr, Schimke, & Pachinger, 1996) are certainly compatible with rhythmic perception, in general they cannot be taken as direct evidence.
The case is different, however, when the perceptual function under study involves temporal parsing, i.e. the determination of temporal relations between events. Indeed, within the context of rhythmic perception, a change of oscillatory frequency, as measured electrophysiologically, is equivalent to a change in the “frame rate” of perception (to employ again the cinematographic metaphor). This should logically result in a commensurable change in temporal parsing performance, in other words, an improvement or decrement in temporal resolution. Of course, the possibility of an indirect relation mediated by other factors still exists (as it does for any correlational evidence), but the logical argument for a direct connection is persuasive enough in this case. Kristofferson, for example, found a clear correlation between individual alpha rhythm frequency and the “two-flash fusion threshold”, the critical temporal interval below which two successively presented flashes are consistently perceived as one. Subjects with
16
slower alpha rhythms exhibited inferior temporal resolution, as if their less frequent perceptual “frames” made the two successive flashes more likely to wind up in the same frame, and thus be perceived as simultaneous (Kristofferson, 1967). Samaha and Postle recently replicated this finding, but additionally revealed a within-subject correlation, such that for a given subject the exact alpha frequency recorded before each trial was slightly faster or slower when the subject judged the trial as two events vs. one event, respectively (Samaha & Postle, 2015). In this case, all potential confounding factors linked to individual differences can be eliminated, making this frequency-dependent perception result a particularly solid demonstration of rhythmic perception. Bear in mind, in addition, that the rhythmicity of temporal parsing has also been demonstrated by other means (see Table 1), including phase-dependent perception approaches (Varela et al., 1981; Chakravarthi & VanRullen, 2012; Wutz, Weisz, Braun, & Melcher, 2014; Cravo et al., 2015; Inyutina et al., 2015; Morand, Gross, & Thut, 2015; Milton & Pleydell-Pearce, 2016).
Perceptual echoes So far, we have encountered pre-stimulus electrophysiological correlates of
rhythmic perception in the oscillatory phase or frequency recorded before a very brief stimulus (a single flash, or sometimes a rapid pair of flashes). As mentioned already, these analyses of spontaneous oscillatory activity cannot easily be extended to the post-stimulus period, because electrophysiological signals there are dominated by the evoked response, which tends to impart a stereotyped phase and frequency content to every trial. So, can perceptual cycles also be uncovered in the post-stimulus period? What if the stimuli are not simple flashes, but long-lasting or continuous sequences? Do brain rhythms also modulate perception cyclically in this case? If they do, how many cycles would be found to encode a single transient event in the sequence? Would the event only be represented in the next available cycle, and then quickly forgotten, or would the brain carry over a “memory” of this event from cycle to cycle –and if so, for how many cycles? One method that we have used to address these questions involves cross-correlation.
We recorded EEG while observers viewed dynamic sequences (6.25s long) randomly modulated in luminance. The cross-correlation between the stimulus luminance sequence on each trial and the corresponding EEG was computed to reveal the so-called “impulse response function”, the average brain response to each unit luminance increment (Lalor, Pearlmutter, Reilly, McDarby, & Foxe, 2006). As expected, the early part of this response resembled a classic VEP (visual-evoked potential); to our surprise, the cross-correlations also presented a sizeable occipital oscillation at ~10Hz, persisting at delays well above ½ of a second for all observers, and even beyond one second for some of them. The oscillation differed in phase and peak frequency across subjects, but was stable and reproducible for each subject. In fact, the oscillation peak frequency was
17
highly correlated, on a subject-by-subject basis, with the individual alpha frequency recorded during rest (p<0.005). In addition, this oscillation vanished when the EEG recorded on a given trial was cross-correlated against the stimulus presented on a different one, implying that the ~10Hz oscillation in cross-correlations was not an artefactual consequence of basic EEG properties, but a genuine brain response to visual inputs. The existence of significant correlations between stimuli and subsequent EEG responses at delays of up to 1s, waxing and waning at 10 cycles/s or so, indicates that the visual system "echoes" or "reverberates" the stimulus sequence at this frequency. Therefore, we referred to these oscillatory cross-correlation functions as "perceptual echoes".
The discovery of such long-lasting perceptual echoes has fundamental implications for our understanding of brain function. First, it indicates that the visual system carries an internal representation of its inputs for much longer durations than previously thought –indeed, the traditional view based on VEP experiments holds that visual responses only last between 300 and 500ms (Kooi & Bagchi, 1964; Ciganek, 1969; Hillyard, Teder-Salejarvi, & Munte, 1998), whereas the perceptual echoes can persist for more than 1s. Second, it lends further support for the notion that perception is cyclic, and that brain rhythms take an important part in shaping it. But this time, the perceptual cycles are not uncovered in spontaneous oscillations of the pre-stimulus period, but during stimulus processing itself, while the random luminance sequence is physically unfolding on the screen. Finally, it indicates that perceptual cycles are not independent entities (as would be the snapshots of a camera): visual information is shared or “carried over” between successive cycles. Arguably, this could be part of the brain’s strategy to conceal the discreteness of its operations, and stitch together a continuous sensory experience from a sequence of rhythmically sampled inputs.
Behavioral oscillations Electrophysiology is not the only tool that can be used to probe perceptual
rhythms: behavioral and psychophysical measurements can also be employed. I have already mentioned the temporal integration window that can be measured psychophysically, and that was long held to mirror the “psychological moment” –until researchers realized that this conclusion was not directly warranted (see Introduction). Around the same time, psychologists started observing periodicities in reaction time histograms (Venables, 1960; Latour, 1967; Harter & White, 1968; Poppel & Logothetis, 1986; Dehaene, 1993). These periodicities were taken to reflect the underlying rhythms of perception, under the necessary assumption that these perceptual rhythms were “reset” by the onset of the visual stimulus (otherwise the reaction times, which are measured in reference to stimulus onset, could bear no relation to the perceptual cycles). Depending on the studies, the reaction time oscillations could be found not only in the expected “alpha”
18
frequency range (Venables, 1960), but also at higher frequencies, all the way to 100Hz (Latour, 1967).
One limitation of periodicities measured in reaction times is that they can be explained by a brain rhythm affecting either the sensory processing of the stimulus, or the motor component of the response (or both). That limitation does not apply to periodicities measured directly at the level of sensory perception. Indeed, although the first reports of oscillations in perceptual accuracy (e.g. detection threshold) date back to the 1960s (Latour, 1967), over the last few years this approach has been successfully applied in a number of behavioral studies. In their simplest form, these studies usually employ (at least) two separate stimuli, one to reset the (postulated) perceptual oscillation and serving as a temporal reference, and another to probe the state of this perceptual oscillation, by measuring perceptual accuracy at various times after the reference. A key aspect of these paradigms is the need to sample perception with relatively high temporal resolution, i.e. using a large set of reference-probe temporal intervals. The behavioral performance time course can then be analyzed through spectral methods that are traditionally reserved for electrophysiological signals.
Using variations of this method, several authors have recently measured behavioral periodicities in attention (Landau & Fries, 2012; Fiebelkorn, Saalmann, & Kastner, 2013; Dugue & VanRullen, 2014; Song, Meng, Chen, Zhou, & Luo, 2014; Dugué, McLelland, Lajous, & VanRullen, 2015; Huang, Chen, & Luo, 2015). While some of these studies were consistent with previous reports of rhythmic attentional sampling around 7Hz (VanRullen, Carlson, & Cavanagh, 2007; Busch & VanRullen, 2010), others reported lower periodicities, around 3-4Hz (Landau & Fries, 2012; Fiebelkorn, Saalmann, et al., 2013; Song et al., 2014; Huang et al., 2015). However, it has been argued that in those latter studies the display and task instructions, either explicitly or implicitly, could have encouraged the possibility of dividing attention between two objects or locations (VanRullen, 2013). If attention does operate periodically, it could then have focused on each object or location during alternate cycles, with the result that the periodicity measured at any one location would actually be half of the intrinsic rhythm of attention. Compatible with this interpretation, recent studies have found a proportional decrease of attentional temporal resolution (Holcombe & Chen, 2013) and temporal aliasing frequency (Macdonald, Cavanagh, & VanRullen, 2013)(see next section) when attention went from a single target to multiple targets. In short, the reported 3-4Hz periodicities could remain consistent with attention sampling around 7Hz (VanRullen et al., 2007; VanRullen, 2013).
Finally, this methodological approach based on behavioral oscillations has also permitted to reveal periodicities in visual object and scene recognition processes: specifically, face identification around 10-15Hz (Blais, Arguin, & Gosselin, 2013), and natural scene categorization around 5Hz (Drewes, Zhu, Wutz, & Melcher, 2015).
19
Illusory flicker and aliasing If there are perceptual cycles in vision, they should not only influence
whether or not we see something that is physically there (as in the previous examples of behavioral and electrophysiological modulations of perceptual accuracy), but they might also result in our seeing something that is not there at all –a perceptual illusion. More specifically, in at least some situations a stationary or continuous visual scene should give rise to a (false) impression of flicker or resonance; this has been reported in psychophysical tasks, geometric illusions, or as a side effect of certain hallucinogenic and prescription drugs. In addition, moving stimuli at certain speeds should be affected by distortions due to temporal aliasing. These illusory phenomena are described in more detail below.
Figure 2. Three illusory phenomena indicative of perceptual rhythms in the visual domain. a. The continuous wagon wheel illusion: A moving periodic stimulus sampled by a discrete system (e.g. a movie camera) can be perceived as if it moved backwards, due to a phenomenon known as "temporal aliasing". Under specific conditions, reversed motion can also be perceived with a moving stimulus that is perfectly
20
continuous (such as a physically rotating wheel in daylight illumination). The temporal aliasing causing this "continuous" version of the illusion may be due to periodic sampling occurring in the brain. Experimental work has placed the frequency of this sampling around 13Hz. b. The triple-flash illusion: two successive flashes separated by a critical time interval (on the order of 100ms) are often reported as 3 flashes. The illusory 3rd flash could be due to a reverberation of visual responses at ~10Hz. c. The flickering wheel illusion: Even though the wheel is stationary, its center is often seen to flicker, especially when the eyes move around the stimulus (as happens for example when reading this legend, or visually exploring different parts of the figure). The flicker is directly related to oscillations in the alpha range (~10Hz). This illusion thus represents a unique way to reveal to our consciousness the oscillations that constantly take place in the brain but normally remain unnoticed.
Temporal aliasing: the continuous Wagon Wheel Illusion My first personal encounter with compelling experimental evidence for
rhythmic perception was the continuous version of the “wagon wheel illusion”, or in short, the c-WWI (Figure 2a). The engineering term “aliasing” denotes a distortion artifact that occurs when signals are sampled by a discrete or periodic system: when the sampling resolution is under a critical limit (the "Nyquist rate") the signal will be encoded erroneously. This is true for any signal, including those sampled in the temporal domain; therefore, temporal aliasing can theoretically be used as a signature of periodic perceptual phenomena.
The “wagon wheel illusion” occurs when the input signal is a periodic visual pattern in continuous motion (such as a rotating wheel): due to aliasing, the pattern appears to move in the wrong direction. This is often observed in movies, because of the discreteness of the cinematograph, already alluded to in the Introduction. Yet a similar perceptual effect has also been reported under continuous conditions of illumination, e.g. in daylight (Schouten, 1967; Purves, Paydarfar, & Andrews, 1996; VanRullen, Reddy, & Koch, 2005). In this case, however, because no artificial device is imposing a periodic sampling of the stimulus, the illusion must be caused by aliasing within the visual system itself. Thus, this "c-WWI" has been interpreted as direct evidence that the visual system samples motion information periodically (Purves et al., 1996; Andrews, Purves, Simpson, & VanRullen, 2005; Simpson, Shahani, & Manahilov, 2005; VanRullen, Reddy, et al., 2005).
There are many arguments supporting this "discrete" interpretation of the c-WWI. First, the illusion occurs in a very specific range of stimulus temporal frequencies, compatible with discrete sampling at a rate around 13Hz (Purves et al., 1996; Simpson et al., 2005; VanRullen, Reddy, et al., 2005). This critical frequency remains unchanged when manipulating the spatial frequency of the stimulus (Simpson et al., 2005; VanRullen, Reddy, et al., 2005) or the type of motion employed, i.e. rotation vs. translation motion, or first-order vs. second-order motion (VanRullen, Reddy, et al., 2005), exactly as would be expected
21
according to the discrete sampling idea. Finally, EEG correlates of the perceived illusion confirm these psychophysical findings and point to an oscillation in the same frequency range around 13Hz (VanRullen, Reddy, & Koch, 2006; Piantoni, Kline, & Eagleman, 2010). Altogether, these data suggest that (at least part of) the motion perception system proceeds by sampling its inputs periodically, at a rate of 13 samples (or “snapshots”) per second. These findings, together with another report of behavioral oscillation around 12Hz (Morand et al., 2015), thus make up the “Motion perception” entries of Table 1.
There are, of course, alternative accounts of the phenomenon. First, it is noteworthy that the illusion is not instantaneous, and does not last indefinitely, but is instead a bistable phenomenon, which comes and goes with stochastic dynamics; such a process implies the existence of a competition between neural mechanisms supporting the veridical and the erroneous motion directions (Blake & Logothetis, 2002). Within this context, the debate centers around the source of the erroneous signals: some authors have argued that they arise not from periodic sampling and aliasing, but from spurious activation of low-level motion detectors (Kline, Holcombe, & Eagleman, 2004; Holcombe, Clifford, Eagleman, & Pakarian, 2005) or from motion adaptation processes that would momentarily prevail over the steady input (Holcombe & Seizova-Cajic, 2008; Kline & Eagleman, 2008). I find these accounts unsatisfactory, because they do not seem compatible with the following experimental observations: (i) the illusion is always maximal around the same temporal frequency, whereas the temporal frequency tuning of low-level motion detectors differs widely between first and second-order motion (Hutchinson & Ledgeway, 2006); (ii) not only the magnitude of the illusion, but also its spatial extent and its optimal temporal frequency –which we take as a reflection of the system's periodic sampling rate– are all affected by attentional manipulations (VanRullen, Reddy, et al., 2005; VanRullen, 2006; Macdonald et al., 2013); in contrast, the amount of motion adaptation could be assumed to vary with attentional load (Chaudhuri, 1990; Rezec, Krekelberg, & Dobkins, 2004), but probably not the frequency tuning of low-level motion detectors; (iii) motion adaptation itself can be dissociated from the wagon wheel illusion using appropriate stimulus manipulations; for example, varying stimulus contrast or eccentricity can make the motion aftereffects (both static and dynamic versions) decrease while the c-WWI magnitude increases, and vice-versa (VanRullen, 2007) (iv) finally, the brain regions responsible for the c-WWI effect, repeatedly identified in the right parietal lobe (VanRullen et al., 2006; VanRullen, Pascual-Leone, & Battelli, 2008; Reddy, Remy, Vayssiere, & VanRullen, 2011), point to a higher-level cause than the mere adaptation of low-level motion detectors.
Disentangling the neural mechanisms of the continuous wagon wheel illusion is an ongoing affair, which was already the topic of an entirely separate review (VanRullen, Reddy, & Koch, 2010). To summarize, the reversed motion signals are likely to originate as a form of aliasing due to periodic temporal
22
sampling by attention-based motion perception systems, at a rate of ~13Hz; the bistability of the illusion is due to the simultaneous encoding of the veridical motion direction by other (low-level, or "first-order") motion perception systems.
Finally, one might justifiably wonder whether temporal aliasing could be used to reveal the periodic nature of other sensory functions than visual motion perception. While this idea is valid in theory, it is challenged in practice by the low temporal resolution of most sensory functions (VanRullen & Dubois, 2011). Imagine a rapidly (and periodically) changing sensory attribute, such as the color or the shape of an object. If perceptual processing of this attribute operates rhythmically (for the sake of argument, say around 10Hz), then temporal aliasing predicts a reversal of the perceived direction of change for rates above the Nyquist frequency of the corresponding rhythm (i.e., above 5Hz). However, such a reversal can only be measured if the observer’s temporal sensitivity for this attribute actually exceeds the Nyquist frequency; otherwise, the rapid change is perceived as a blur with no clear direction, and hence no clear reversal. Unfortunately, it turns out that fluctuations in most visual attributes (except fluctuations in spatial position, i.e., motion perception) cannot be reliably processed above 3-4Hz (Holcombe, 2009). Thus, rhythmic perception of these attributes may well happen, but would remain undetectable to a temporal aliasing approach (VanRullen & Dubois, 2011). As a side note, the above logic can be reversed to speculate that the surprisingly low temporal sensitivity of our perceptual systems for many attributes (shape, color, inter-attribute binding) could have evolved to protect these systems against perceptual aliasing errors introduced by the rhythmicity of their inner workings.
The triple flash illusion In 1989, Bowen reported that two flashes presented in close succession
could sometimes be perceived as a sequence of three flashes (Bowen, 1989). He explained that the effect could be due to a superposition of oscillatory responses to each of the two flashes, i.e. a form of reverberation: when the delay between flashes (SOA: stimulus-onset asynchrony) matches the period of the oscillation, the superposition will result in an enhancement of a later part of the oscillation that would normally be damped; when this enhancement crosses the threshold of perception, a third flash is (erroneously) perceived (Figure 2b).
One of our own studies (Miconi, Roumy, & VanRullen, 2011) replicated Bowen's, and pointed to an optimal SOA of about 100ms on average, but variable across subjects. At the optimal SOA, many subjects perceived the illusory third flash on about 50% of the trials. The illusion was also found to persist when the two inducing flashes were shown dichoptically (i.e. each flash to a separate eye): thus, the third flash results from the superposition of responses occurring at or beyond primary visual cortex –where binocular integration begins.
23
Exploring the role of oscillations in the triple-flash illusion is a promising avenue for the study of perceptual cycles. Indeed, this illusion implies that the response of the brain to simple flashes of light is oscillatory in nature. This conclusion is well in line with the “perceptual echoes” mentioned previously. Further, it reveals that ongoing oscillations do not have a mere modulatory influence on perception, but a real driving impact, with the potential to make you perceive something that is not there –the third flash.
The flickering wheel The driving influence of ongoing brain rhythms is also demonstrated by
The center of a static wheel stimulus made up of 30-40 spokes is sporadically experienced as flickering regularly (Figure 2c). Although the flicker occurs most strongly during small eye movements performed while the stimulus is in the visual periphery (such as when reading text above or below the wheel), we could show that stimulus motion relative to the retina is not crucial to perceive the illusory flicker. Indeed, comparable amounts of flicker are also experienced on the afterimage of the wheel, produced after a few seconds' exposure to the stimulus pattern followed by instant removal –yet by definition this afterimage is stationary on the retina4. Our experiments also probed the frequency of apparent flicker. First, during a perceptual matching task the illusory flicker most strongly resembled an equivalent physical flicker at ~9Hz. Second, we recorded EEG while observers continuously reported the occurrence of perceived flicker. Only the occipital alpha band (~10Hz) of the EEG oscillation displayed a time course compatible with flicker reports: when alpha amplitude was strong, the probability of reporting flicker increased.
Therefore, this flickering illusion appears to be a unique way to experience the alpha rhythms that constantly occur in the brain, but normally remain unnoticed. Because of the vividness and irrefutability of the illusion, it is particularly suitable for demonstration purposes, and to explain to the general public the notion of "perceptual rhythms". There are other dynamic effects occurring with purely static displays, such as Leviant's "enigma" figures (Zeki, Watson, & Frackowiak, 1993; Troncoso, Macknik, Otero-Millan, & Martinez-Conde, 2008) or the "scintillating grid" (Schrauf, Lingelbach, & Wist, 1997), but the regularly flickering nature of this illusion makes it a unique tool to probe the perceptual correlates of brain oscillations.
4 This can be experienced directly by fixating for about 20 seconds on the letter 'c' next to Figure 2c, and then quickly moving the gaze to an empty page: the center of the afterimage should look as if it is 'pulsating' before it vanishes.
24
The trailing effect Before the discovery of the “flickering wheel illusion”, the direct
experience of one’s own brain oscillations was an extravagance reserved for users of certain hallucinogenic drugs, such as LSD (lysergic acid diethylamide). After ingestion of the drug, users typically report a distortion of perceptual continuity akin to stroboscopic perception, which has been dubbed the “trailing effect” (Asher, 1971) –because of the discrete trails left behind by moving objects during the episode. Trailing is a fascinating phenomenon in its own right (Dubois & VanRullen, 2011), not limited to hallucinogens but also induced by certain prescription anti-depressants, and whose pharmacology may thus inform us on the molecular mechanisms of perceptual rhythms. For present purposes, suffice it to say that this effect can be understood as a form of sensory resonance similar to the “flickering wheel” illusion. Based on a large sample of first-person reports collected from past LSD users, and after asking them to match their remembered experience with computer simulations of the trailing effect, we determined that the rate of flicker during trailing could be approximately 15Hz (Dubois & VanRullen, 2011).
Summary: perceptual rhythms in vision This brief tour of experimentally measured periodicities in the visual
domain hopefully makes it clear that perceptual rhythms are not just an oddity, but actually a pervasive element of visual processing. Nearly all aspects of vision have been shown to fluctuate periodically at one rate or another (with perhaps the notable exception of color vision, conspicuously absent from Table 1).
The frequencies involved in these periodicities are summarized in Figure 3, showing a histogram of reports (i.e., entries of Table 1) as a function of rhythmic frequency. The dominance of alpha rhythms is evident, with nearly 40% of studies reporting a periodicity in visual perception at 10Hz. But part of this dominance is likely due to a vicious cycle, in which the apparent 10Hz bias in the literature encourages authors to specifically test that frequency. Many of the studies reviewed here did not even investigate other frequencies; while such studies validly establish the existence of a significant periodicity, they certainly provide an incomplete picture of it. In addition, authors can also be swayed by the standardized (but somewhat arbitrary) codification of brain rhythms to report any effect peaking somewhere between 7 and 13Hz as an “alpha” effect, and thus ascribe it a center frequency of 10Hz. In sum, how much of the sharp spike of reported periodicities at 10Hz is real, and how much is caused by various biases, remains to be determined.
Figure 3 also suggests the existence of a second peak in visual periodicities at 7Hz (about 15% of reports). When comparing Table 1 entries reporting 7Hz vs.
25
10Hz periodicities, no evident distinction stands out. Speculatively, however, one might relate 7Hz rhythms to attentional processes, and 10Hz periodicities to more sensory or peripheral ones, as suggested earlier in relation to Figure 1. Such a distinction would be consistent with the well-established prevalence of alpha rhythms (around 10Hz) in sensory processes of the occipital lobe, and with a large number of findings compatible with attentional periodicities around 7Hz (VanRullen et al., 2007; Busch & VanRullen, 2010; Landau & Fries, 2012; Fiebelkorn, Saalmann, et al., 2013; Holcombe & Chen, 2013; VanRullen, 2013; McLelland et al., 2014; Song et al., 2014; Dugue et al., 2015; Dugué et al., 2015; Huang et al., 2015; Landau et al., 2015; Voloh et al., 2015).
Figure 3. Frequency distribution of perceptual rhythms reported in the literature. Studies listed in Table 1 (visual periodicities) are represented in blue, studies from Table 2 (other: auditory, somatosensory, cross-modal periodicities) in red. Any given study is only counted once, even when it corresponds to multiple table entries. In addition, when a study reports multiple distinct periodicities, the corresponding frequencies are given a proportionally lower weight in the histogram. This means that the area under each histogram is equal to the number of studies in the corresponding table. Although the total number of studies in the visual domain clearly exceeds those in other domains (χ2(1)=12.5, p<0.001), the shapes of the two frequency profiles are not significantly different (Kolmogorov-Smirnov test, p=0.56).
26
Periodicities in other modalities Auditory domain
The investigation of perceptual cycles in audition is an intricate affair (VanRullen et al., 2014). There is, on the one hand, a cornucopia of experimental data and theories linking auditory perception and brain rhythms, possibly more so (proportionately, at least) than in the visual domain. On the other hand, an overwhelming majority of these findings are linked to the notion of oscillatory entrainment, whereby the brain’s rhythms are adjusted, passively or actively, to track the rhythmic structure of the auditory environment (Large & Jones, 1999; Luo & Poeppel, 2007; Lakatos et al., 2008; Schroeder & Lakatos, 2009; Luo, Liu, & Poeppel, 2010; Ghitza, 2011; Ghitza, Giraud, & Poeppel, 2012; Giraud & Poeppel, 2012; Henry & Obleser, 2012; Kayser, Ince, & Panzeri, 2012; Neuling, Rach, Wagner, Wolters, & Herrmann, 2012; Peelle & Davis, 2012; Gross et al., 2013; Peelle, Gross, & Davis, 2013; Zion-Golumbic et al., 2013; Ding & Simon, 2014; Doelling, Arnal, Ghitza, & Poeppel, 2014; Henry, Herrmann, & Obleser, 2014; Kosem, Gramfort, & van Wassenhove, 2014; Nozaradan, 2014; Kayser, Wilson, Safaai, Sakata, & Panzeri, 2015; Millman, Johnson, & Prendergast, 2015; Zoefel & VanRullen, 2015b, 2015a). The dominant periodicities involved in this entrainment phenomenon are in the delta (1-4Hz), theta (4-8Hz) and gamma bands (30-80Hz) (Poeppel, 2003; Lakatos et al., 2005; Ghitza, 2011; Giraud & Poeppel, 2012; Luo & Poeppel, 2012; Gross et al., 2013; Ding & Simon, 2014; Zoefel & VanRullen, 2015a). This neural phase entrainment, for example in the context of speech processing, can confer a periodicity to auditory perceptual sensitivity (Lakatos et al., 2008; Henry & Obleser, 2012; Saoud et al., 2012; Henry et al., 2014; Hickok, Farahbod, & Saberi, 2015; Kayser, Wilson, et al., 2015; Zoefel & VanRullen, 2015b). However, this periodicity is inherently confounded by physical fluctuations in the auditory input: is auditory perception modulated because the critical neuronal oscillations are in an optimal vs. sub-optimal phase of their cycle, or because the entraining auditory rhythm in the environment is physically covering vs. unmasking the auditory target? Disentangling these (non-exclusive) sources of periodic auditory modulation in entrainment paradigms is a thorny issue (Di Liberto, O'Sullivan, & Lalor, 2015; Kayser, Ince, Gross, & Kayser, 2015; Zoefel & VanRullen, 2015b, 2015a). Overall, there is a distinct possibility that perceptual rhythms do exist in the auditory domain, but not in a spontaneous state; rather, they may rely on rhythmic inputs from the auditory environment to arise and exert their cyclic modulation on perception (Schroeder & Lakatos, 2009; Thorne & Debener, 2013; VanRullen et al., 2014). Given the criteria listed earlier for ‘direct’ evidence of perceptual rhythms (see Periodicities in vision), we shall leave aside the realm of entrained periodicities, and focus now on the (much scantier) evidence for spontaneous perceptual cycles in audition. But
27
keep in mind that perceptual rhythms certainly also exist in the auditory system, yet under a radically different form.
Do spontaneous perceptual cycles also occur in audition? Previous attempts at measuring auditory perceptual echoes (İlhan & VanRullen, 2012) or the pre-stimulus EEG phase dependence of auditory ERPs and target detection for a simple but unpredictable stimulus in a silent background (Rice & Hagstrom, 1989; Haig & Gordon, 1998; Barry et al., 2004; Zoefel & Heil, 2013; VanRullen et al., 2014) have not always replicated the clear periodicities observed in the visual system. One key difference is that natural auditory inputs are defined primarily as temporal fluctuations: vocal or musical pitch, speech phoneme distinction or speech recognition all require processing fine-grained temporal information at different scales. Thus, any periodic sampling or reverberation of sensory inputs, while harmless in the visual domain (think of a movie at a slow frame rate of ~10Hz –hesitant but recognizable), would disrupt time-sensitive auditory signals and render them unintelligible (VanRullen et al., 2014). This argument, however, only explains why auditory inputs should not be sampled rhythmically during early processing stages, where input temporal structure is critical. Auditory perceptual cycles may still be observed with more complex semantic attributes, such as speech content, auditory source identity or stream segregation (Zion-Golumbic et al., 2013), voice recognition (etc.) –in other words, higher-level auditory properties whose neural representation may evolve more slowly than, and independently of, the fine-grained temporal structure of auditory inputs. In line with this idea, we recently demonstrated (Zoefel et al., 2015) that part of the impairment in speech recognition observed when speech sounds are down-sampled (e.g., down to 16 samples per second) in their input domain (wavelet, or “cochlear” representation) can be effectively recovered by human listeners when the same amount of down-sampling is applied instead on a more complex or “high-level” representation (LPC vocoding, equivalent to “cortical” encoding). This suggests that auditory perception could in fact be robust to rhythmic perceptual sampling, but only if this periodicity was applied at a relatively late stage of processing, after the highly time-sensitive basic auditory features have been extracted. In keeping with this suggestion, an EEG phase dependence of auditory detection has recently been reported at 10Hz for lexical decisions in a speech recognition context (Strauss, Henry, Scharinger, & Obleser, 2015), as well as around 4Hz for simple targets embedded in arrhythmic but natural sound sequences (Ng, Schroeder, & Kayser, 2012), which might have incited a “high-level” processing context (Henry & Herrmann, 2012). EEG phase at theta (2-6Hz) and alpha (7-14Hz) frequencies was also found to modulate the higher, decision-related stages of auditory pitch and intensity discrimination tasks, respectively (Kayser, McNair, & Kayser, 2016).
Similarly, EEG and MEG phase-dependent effects were reported at 1-2Hz for high-level auditory processes involved in the generation of predictions about auditory inputs or their timing (Arnal, Doelling, & Poeppel, 2015; Ten Oever, van
28
Atteveldt, & Sack, 2015). These findings are also consistent with a recent experiment reporting that the direction of information flow through auditory cortex (as determined by applying Granger causality on iEEG data) alternated rhythmically between bottom-up and top-down directions, at a rate of ~2Hz (Fontolan, Morillon, Liegeois-Chauvel, & Giraud, 2014); this indicates again that top-down predictions influence auditory processing periodically. Note that equivalent periodicities in top-down information transfer (stimulus expectations, predictive coding) have been described for the visual domain, but at consistently higher frequencies between 5 and 10Hz (Han & VanRullen, 2015; Samaha et al., 2015; Sherman et al., 2016). Finally, one study has explored the correlation (across individuals) between temporal parsing of auditory inputs and EEG rhythm frequency (measured with ASSRs: auditory steady-state responses), and found a significant relation at gamma frequency, with a mean around 46Hz (Baltus & Herrmann, 2015). This is to be compared with an equivalent visual study reporting significant across- and within-subjects correlations between temporal parsing and alpha (~10Hz) EEG frequency (Samaha & Postle, 2015).
In summary, auditory perception seems to be intimately linked to brain rhythms, via the notion of oscillatory entrainment. However, there are far fewer reports of spontaneous periodicities, occurring in the absence of a driving rhythm in the auditory environment. Those few existing studies suggest that perceptual rhythms are more likely to affect high-level than basic auditory features and processes. The frequencies of reported auditory periodicities cover a wide range, from 1Hz to more than 40Hz, including a number of observations around 10Hz. The number of data points are insufficient, however, for a quantitative comparison with the frequencies of periodicities found in vision.
Somato-sensory domain There are three notable studies that explored the dependence of somato-
sensory perception on EEG and MEG oscillatory phase. Two of them tested the detection of tactile stimuli at perceptual threshold, and found periodicities at “infra-slow” (<0.1Hz) EEG frequencies (Monto, Palva, Voipio, & Palva, 2008), as well as in the alpha (10Hz) EEG band (Ai & Ro, 2014). The third study reported that temporal parsing of two successive tactile stimuli was determined (in part) by MEG oscillatory phase around 14Hz (Baumgarten, Schnitzler, & Lange, 2015). It is interesting to note that, just like in vision and audition, in these tactile experiments the magnitude of perceptual modulation by oscillatory phase did not exceed 20%.
29
Cross-modal domain A number of recent demonstrations of perceptual periodicities cannot easily
be classified as visual, auditory or tactile, because they actually involve two of these modalities. I have thus listed them separately here (and in Table 2) as ‘cross-modal’ studies. In all cases, these cross-modal findings involve a stimulus in one modality resetting the phase of brain rhythms, and thus the accompanying perceptual rhythmicity, in another. For example, a sound might reset the phase of visual cortex rhythms; such an auditory reset of visual rhythms has been reported in monkey V1 electrophysiological recordings, at 7 and 40Hz (Lakatos et al., 2009); in human intracranial recordings of occipital cortex, at 8Hz (Mercier et al., 2013); and at 10Hz, in measurements of human occipital cortex excitability via EEG and TMS phosphenes (Romei, Gross, & Thut, 2012). In turn, similar visual rhythms phase-reset by sound were found to occasion behavioral oscillations, as measured using saccadic reaction times, at 7Hz (Diederich, Schomburg, & van Vugt, 2014), 9Hz and 31Hz (Diederich, Schomburg, & Colonius, 2012). Behavioral oscillations following auditory reset were also reported in threshold-level visual detection performance, but the temporal resolution in that study did not allow the authors to isolate the frequency of oscillation (Fiebelkorn et al., 2011). Finally, the temporal window of the sound-induced double-flash illusion (in which two sounds paired with a single flash cause the illusory perception of a double-flash) was recently shown to correlate with individual EEG alpha (~10Hz) frequency (Cecere, Rees, & Romei, 2015).
A compatible result was also described for a very similar cross-modal illusion, but this time involving two tactile stimuli that produce the illusory perception of a visual double-flash (even though, again, only a single visual stimulus was actually presented). The authors reported an EEG phase dependence, around 10Hz, of the likelihood of perceiving this touch-induced double-flash illusion (van Erp, Philippi, de Winkel, & Werkhoven, 2014).
Auditory rhythms, just like visual ones, can also be reset by stimuli in other modalities. Tactile stimuli, for example, can reset oscillatory phase in monkey A1 at 7Hz and 37Hz (Lakatos, Chen, O'Connell, Mills, & Schroeder, 2007). Similarly, visual stimuli have been found to phase-reset auditory cortex oscillations in monkeys around 7Hz (Lakatos et al., 2009; Perrodin, Kayser, Logothetis, & Petkov, 2015), 10Hz (Kayser, Petkov, & Logothetis, 2008) and 40Hz (Lakatos et al., 2009), and in humans around 3Hz (Mercier et al., 2015). In another study, the visual-induced phase reset produced a subsequently measurable perceptual periodicity, with auditory tones being more or less easily detected depending on the phase of EEG oscillations around 1Hz (Ten Oever et al., 2015).
Finally, sensory periodicities, at least in the visual domain, appear to be synchronized not only with sensory events in other modalities, but also with motor events, i.e. with action. This was reported as a behavioral oscillation in visual
30
detection, at 5-7Hz around the time of a hand movement (Tomassini, Spinelli, Jacono, Sandini, & Morrone, 2015; Benedetto, Spinelli, & Morrone, 2016), and at 4Hz around the time of an eye movement (Hogendoorn, 2016).
Perceptual/physio-logical variable Nature of evidence Spec. Freq.
Table 2. Studies demonstrating a periodicity in sensory domains other than vision. The entire table follows the organization of Table 1. The tested modality is indicated in the leftmost field: auditory, somato-sensory (listed as “touch”, for short), and cross-modal. This last domain encompasses periodicities in one modality (including vision) that were experimentally affected by stimuli presented in another modality.
31
Conclusion: Perceptual rhythms everywhere?
The inventory of findings presented here, regrettably but inevitably discounting important details of each experimental study, suggests that the “modernized” approach to the study of discrete perception (as described in the Introduction section: a paradigm shift) is starting to bear fruit. Once we acknowledge that there might not exist a single common sampling rhythm affecting all of our perceptions (a so-called “perceptual moment”), but instead many simultaneous rhythms, periodically modulating various perceptual and cognitive functions at independent rates, we begin to see perceptual rhythms (almost) everywhere we care to look.
In the visual domain, these periodicities have been reported for perception at or well-above threshold, for oculomotor behavior, motion perception, attention and visual search, categorization, decision-making, top-down processes of prediction and expectation, and short-term memory (see Table 1). Importantly, periodicities were also found to affect temporal parsing mechanisms, supporting a more “extreme” version of discrete perception in which the temporal continuity of experience itself is chopped up in successive frames or snapshots. The perceptual rhythms were detected using various experimental methods involving behavioral and electrophysiological techniques in humans and animals. The frequencies of these periodicities were very diverse, but with clear peaks at 10Hz and 7Hz (see Figures 1 and 3), which we tentatively ascribed to sensory and attentional sampling rhythms, respectively.
As the previous section just revealed, perceptual rhythms can also be observed in other modalities such as audition (where entrained rhythms may dominate spontaneous ones) and somatosensation (see Table 2). As in vision, these rhythms not only seem to modulate simple stimulus detection, but also temporal parsing mechanisms –and thus the temporal framing of sensory experience itself. In addition, perceptual rhythms are not strictly unimodal, but can be influenced (or reset) by stimuli from other modalities or by voluntary actions. The red histogram in Figure 3 reveals that the distribution of frequencies for periodicities observed in non-visual modalities and in cross-modal domains is not much different (aside from the overall much lower number of studies) than the distribution recorded in the visual domain (Kolmogorov-Smirnov test, p=0.56). Note that this conclusion remains true when all studies measuring a visual rhythm (influenced by stimulation in other modalities) are discarded from the list of cross-modal periodicities (KS test, p=0.2). Therefore, it is safe to conclude that the previously discussed apparent dominance of periodicities at 10Hz and 7Hz (and
32
potentially, the underlying biases) may be a universal phenomenon, not limited to vision.
Having established the state of evidence for the idea of rhythmic perception, the following sections take a more critical look at the inherent limitations of this current literature, and the relatively unexplored directions that the field will hopefully pursue in the near future.
Current limitations Effect size and negative results
With this flurry of recently published results in favor of perceptual cycles, it might seem that this sort of evidence is easy to obtain (and it might even appear surprising that such pronounced effects were not detected before). In fact, this impression is misleading.
For one thing, and as discussed already, most of the reported effects are rather subtle (often a small percent of behavioral or perceptual variability). The apparent surge in positive findings could thus reflect, in part, recent improvements in signal processing and statistical analysis methods (including the improved ability to compute complex, non-parametric statistics on large multi-dimensional datasets, such as multi-channel time-frequency transforms, which can now be accomplished on a desktop computer but would have required supercomputers only 15 years ago). It is still unknown whether the small size of typically measured perceptual oscillations is a technical limitation of the experimental paradigms (for example, due to measurement noise), or a true reflection of the meager contribution of these periodicities to the overall perceptual experience.
In addition, it is notoriously difficult to appreciate the number of unpublished negative results –the so-called “file drawer” effect. Only a few negative findings have been explicitly reported: for example, Walsh (1952) and (Bompas, Sumner, Muthumumaraswamy, Singh, & Gilchrist, 2015) failed to find any evidence for an EEG alpha phase dependence of visual detection at threshold or of reaction times; a pivotal experiment on EEG alpha phase dependence of visual temporal parsing (Varela et al., 1981) could not be replicated by several independent authors (Gho & Varela, 1988; VanRullen & Koch, 2003; VanRullen et al., 2011); initial studies of perceptual echoes and EEG phase dependence in the auditory perceptual domain also yielded negative results (İlhan & VanRullen, 2012; Zoefel & Heil, 2013; VanRullen et al., 2014). But for all of these negative findings, multiple subsequent contradicting reports of positive effects also exist (see Tables 1 & 2). Overall, the sheer mass of positive evidence, including
33
replications from several independent groups, appears overwhelming –but the file drawer also could turn out to be unexpectedly large…
Low-frequency bias The distribution of frequencies at which perceptual periodicities have been
found (see Figures 1 and 3) should approximately reflect the incidence of brain rhythms in classic frequency bands. This is more or less true for the alpha (8-14Hz), theta (4-8Hz) and delta bands (1-4Hz), but higher frequency bands, i.e. beta (15-30Hz) and gamma (30-80Hz or above) appear dramatically under-represented relative to their rank in the physiological literature. Yet, if these high-frequency oscillations are present at the level of neuronal populations and serve a role in perceptual processing, as many scientists believe (Singer & Gray, 1995; Tallon-Baudry & Bertrand, 1999; Engel & Singer, 2001; Varela et al., 2001; Buschman & Miller, 2007; Fries, Nikolic, & Singer, 2007; Fries, 2015), they should also produce their own perceptual cycles, and thus rhythmically modulate perception. Where could the low-frequency (below ~15Hz) bias in the literature stem from? We have already discussed the potential role of a-priori hypotheses and the vicious cycle of alpha dominance in this literature. But this serious penchant cannot explain everything. For example, numerous studies have investigated phase-dependent perception exhaustively in the frequency domain, often up to 100Hz (see Figure 1; although the figure itself is truncated at 50Hz, many of the included studies probed frequencies up to 100Hz –unsuccessfully). Two other potential sources of bias can be envisioned.
Firstly, periodicities at higher frequencies are inherently more difficult to measure. In behavioral oscillations, for example, because several dozen trials are needed for each time point, authors usually choose to restrict their sampling rate, typically between 20 and 50Hz; data processing (e.g. smoothing) can also reduce the effective temporal resolution. But in order to detect a given periodicity, behavior must be sampled at least at twice the rate of the periodicity (due to the Nyquist limit). In the end, beta and gamma frequencies are thus often invisible to these behavioral approaches. Even using electrophysiology, non-invasive recording techniques such as EEG and MEG present a signal-to-noise ratio that declines rapidly with frequency, creating its own low-frequency bias. It would thus seem that more invasive recordings in animals, with better signal-to-noise ratio, are needed to properly determine the place of beta and gamma frequencies among perceptual rhythms (see next section).
Secondly, certain cycles of neural information processing might well exist at beta and gamma frequencies, but it could be argued that if this rate exceeds the temporal resolution of the perceptual system, the ensuing perceptual consequences would simply not occur. This is a particularly obvious limitation of experimental paradigms relying on the perception of illusory flicker and aliasing, for example.
34
Finally, the possibility should of course be entertained that perceptual rhythms actually do only exist at frequencies between roughly 5 and 15Hz, as the accumulated data heretofore seems to indicate.
Scarcity of physiological data An important order of business is to determine where in the brain
periodicities originate. A behavioral oscillation in reaction times, for example, could arise as a result of rhythmicity in sensory processing, attention, decision-making, motor commands, etc. This spatial uncertainty, obvious in the case of behavioral oscillations and strictly psychophysical paradigms, is also problematic for surface measurements of brain activity such as EEG and MEG. Though many studies of perceptual rhythms did report scalp topographies and source analyses, I voluntarily abstained from discussing these localizations, not only to avoid weighing down the review, but also because the spatial uncertainty seems too large as yet.
Part of this issue would be easily solved if physiologists were more implicated in this field. Tables 1 and 2 show that invasive recordings in animals constitute, so far, only a minimal fraction of the available evidence (lower than 10%). This is unfortunate, because these techniques (and only these) enjoy a spatio-temporal resolution and the capacity for broad spatial coverage sufficient to resolve the origins of perceptual cycles. And in so doing, physiological studies could also elucidate the potential existence of higher-frequency cycles (see previous section). Among the many other possible interrogations that invasive recording techniques could help address: does every sensory area produce a perceptual periodicity at its own rhythm? What about different hierarchical levels in the same sensory system? Are thalamocortical loops an important source of periodicity? Does attentional modulation of sensory activity possess a rhythmic signature? Do perceptual rhythms encompass entire sensory areas, or are they local phenomena (see Future Directions)?
Functional advantages? One perceived limitation of the notion of perceptual rhythms is that it is not
immediately apparent, from a functional point of view, how perception would benefit from a periodic temporal organization. It might be argued, at one extreme, that the question is not really pertinent, since perceptual rhythmicity is a natural consequence of the demonstrated existence of brain oscillations in sensory areas. (Note that this consequence is expected, whether brain rhythms actually serve a specific functional role or not). Nonetheless, one can still speculate about any associated functional advantages. The first idea, present in numerous theoretical accounts of perception and cognition, is that oscillations can help neural
35
processing by creating specific temporal windows that favor communication between neuronal populations (Singer & Gray, 1995; Varela et al., 2001; Fries, 2009, 2015). Another, related idea is that rhythmic framing by oscillations endows the sensory apparatus with the ability to use the nested temporal structure, within each oscillatory cycle, as a means to encode other, non-temporal stimulus dimensions (Varela et al., 1981; O'Keefe & Recce, 1993; Singer, 1999; Ahissar & Arieli, 2001; Lisman, 2005; VanRullen, Guyonneau, & Thorpe, 2005; Fries et al., 2007; Jensen, Bonnefond, & VanRullen, 2012). An argument can also be made regarding the optimization of metabolic costs: concentrating neuronal resources at specific moments in time while sparing these resources at other points in the cycle can be energy-efficient (think, for example, of a predictive coding situation in which a sensory area, having received, processed and transmitted stimulus information, must await feedback from higher-level areas before updating its representation of the stimulus). Finally, it might be that brain oscillations and the associated perceptual rhythms confer no specific advantage to sensory perception, but rather arise as a consequence of satisfying various physiological and anatomical constraints: communication delays between areas, reciprocal synaptic connections, neuronal time constants, refractory periods, balancing excitation and inhibition (etc.), can all contribute to the generation of brain rhythms. In other words, it might simply be impossible (or at least, needlessly complicated) for the brain to operate without such (wanted or unwanted) periodicities.
Future Directions Taxonomy of perceptual rhythms
Perceptual rhythms are all over the place, but unfortunately in both senses of the phrase: they can be found almost everywhere, yet their assemblage baffles any attempt at rational organization. A quick glance at tables 1 and 2 readily challenges the naïve notion that each rhythmic frequency could be associated with a well-defined brain function, and vice-versa. Even between sensory modalities, there does not seem to be any clear distinction between the frequencies of recorded periodicities (Figure 3): auditory perceptual rhythms, for instance, appear to be neither faster nor slower than visual ones. Higher-level attentional functions and lower-level ones like simple visual detection also do not systematically differ in frequency –and it was only by speculation and extrapolation that we were lead to hypothesize that the former operates around 7Hz and the latter around 10Hz. On the other hand, much of the apparent anarchy in Tables 1 and 2 may be explained as a consequence of “noise” in the dataset (principally measurement noise, but also potential occasional analysis or reasoning errors in some of the studies listed), and of the fact that every task, even those designed to probe a unique perceptual or
36
cognitive function, necessarily entails other incidental processes (for example, the outcome of a categorization task must also involve low-level sensory components, various forms of attention, decision-making, motor components, etc.)
It might be that no classification actually exists, i.e. that every brain rhythm, from 1 to 100Hz or more, occasions near-simultaneous periodic consequences in most cortical areas. But a more enticing prospect is that the field has reached a crossroads, where the amount of data is sufficient to convince ourselves that periodicities exist, but insufficient to make full sense just yet. We simply need many more data points until the correct picture emerges. This would imply that it is possible to construct a taxonomy of perceptual rhythms, relating each brain function to a specific periodicity, with a well-defined frequency, and involving a particular network of brain regions. Once this goal is achieved, the next milestone will be to understand how distinct periodic mechanisms operating at different rates can coordinate their activity to avoid communicating at the wrong phase of their cycle.
Perceptual rhythms and overt sampling The perceptual cycles described above are all spontaneously produced by
the brain; that is, they reflect its intrinsic mode(s) of operation, independent of the temporal structure of the environment. (Indeed, this property was one of our initial criteria for “direct” experimental evidence of perceptual cycles.) Such internal cycles can be thought of as an inward or covert form of perceptual sampling, one that the brain operates on its own inner states. But in addition, sensory information is also sampled overtly, and this type of movement behavior can often display temporal rhythmicity (Schroeder et al., 2010). For instance, sniffing is tied to the respiratory rhythm, producing a de facto discreteness in olfactory perceptions (Uchida et al., 2006; Smear et al., 2011). Whisking (in rodent somatosensation) is another example of rhythmic exploratory behavior; in fact, whisking and sniffing rhythms may be controlled by the same respiratory clock in the theta range, roughly between 4 and 12Hz depending on species (Deschenes et al., 2012; Kleinfeld et al., 2014). In primate vision, saccades and micro-saccades typically result in quasi-periodic chunking of the sensory stream around 3-4Hz (Bosman et al., 2009; Chen et al., 2015; Lowet et al., 2015). If there are intrinsic periodicities in visual processing, therefore, they would be ill-advised to disregard the discretization imposed by overt sampling rhythms –it is much more likely and efficient that these intrinsic and extrinsic sources of periodicity should coordinate their sampling in order to synchronize their “optimal” phases.
In this context, an intriguing possibility, related to the premotor theory of attention (Rizzolatti, Riggio, Dascola, & Umilta, 1987), is that attentional sampling rhythms (around 7Hz) could have evolved from overt saccadic and micro-saccadic sampling behaviors (around 3-4Hz), as a more efficient way of
37
exploring the sensory environment: by directing the samples to internal rather than external sensory representations, metabolic costs associated with motor processes are spared, and the corresponding exploration can thus operate faster (here, at twice the rate).
Even though recent experiments do suggest a link between motor actions and perceptual sampling (Tomassini et al., 2015; Benedetto et al., 2016; Hogendoorn, 2016), the possible coordination between overt and covert rhythmic exploratory mechanisms remains understudied, and a promising direction for future research.
Spatial dimensions of perceptual rhythms The notion of a perceptual cycle implicitly brings to mind a strictly time-
based phenomenon, in which spatial factors, if any, are secondary. In the cinematograph, for example, the entire visual scene is sampled simultaneously, and every snapshot includes information about all spatial locations. However, just as we relaxed the constraints that initially pushed us to envision a unitary perceptual “moment”, it might be useful to consider that the cycles are not necessarily uniform in the spatial domain. In vision, for example, are there independent rhythms sampling distinct locations within a retinotopically organized area at unrelated times, and possibly at different sampling rates? This seems at the same time unlikely, impractical and inefficient. But even if perceptual cycles are spatially related, fully synchronous sampling across an entire retinotopic area is only one possibility. Another one would be that the sampling phase propagates smoothly across space, as in a travelling wave. This would be reminiscent of the “scanning hypothesis” that we encountered earlier (see Introduction), in which perceptual rhythms scan the cortical surface like the sweep of a radar on a screen (Pitts & McCulloch, 1947; Wiener, 1948). Although retinotopic travelling waves have been described in visual areas of other species (Prechtl, Cohen, Pesaran, Mitra, & Kleinfeld, 1997; Benucci, Frazor, & Carandini, 2007; Nauhaus, Busse, Carandini, & Ringach, 2009; Nauhaus, Busse, Ringach, & Carandini, 2012), in humans so far there is mainly evidence for propagating waves of activity between distinct cortical regions (Ribary et al., 1991; Klimesch, Hanslmayr, Sauseng, Gruber, & Doppelmayr, 2007; Cottereau et al., 2011; Fellinger, Gruber, Zauner, Freunberger, & Klimesch, 2012; Bahramisharif et al., 2013).
The existing literature on perceptual cycles (Tables 1 and 2) cannot really speak to this issue, because in most cases the focus was (rightfully) on temporal manipulations, and experiments only probed one stimulus position (or at least, one position at a time). One notable exception is a recent study of behavioral oscillations where it was found that attention cycles propagate within the boundaries of an object, with a phase difference of about 45 degrees (i.e., 1/8th of an attentional cycle at ~7Hz) between the center of attention and more distant
38
locations within the same object (Fiebelkorn, Saalmann, et al., 2013). More experiments of this type are needed, where phase relations are compared between multiple spatial locations, to answer this apparently simple question: is rhythmic phase synchronized over space, or are the perceptual rhythms really perceptual waves?
Acknowledgments The work described was funded by a EURYI (European Young
Investigator) Award and an ERC Consolidator Grant number 614244 (P-CYCLES). I am indebted to past and present members of my lab for helping me, directly or indirectly, to put together an extensive list of bibliographic references. Additionally, I wish to thank Leila Reddy and Benedikt Zoefel for detailed comments on the manuscript.
type=”list” List of Abbreviations A1: Primary Auditory Cortex ASSR: Auditory Steady-State Response BOLD: Blood Oxygen-Level Dependent CSD: Current Source Density c-WWI: continuous Wagon Wheel Illusion EEG: ElectroEncephaloGraphy ERP: Event-Related Potential ECoG: ElectroCorticoGraphy fMRI: functional Magnetic Resonance Imaging iEEG: intracranial EEG LFP: Local Field Potential LSD: lysergic acid diethylamide MEG: MagnetoEncephaloGraphy PAC: Phase-Amplitude Coupling RT: Reaction Time SOA: Stimulus-Onset Asynchrony TMS: Transcranial Magnetic Stimulation V1: Primary Visual Cortex VEP: Visual-Evoked Potential
39
References Adrian, E. D., & Yamagiwa, K. (1935). The origin of the Berger rhythm. Brain, 58, 323-351. Ahissar, E., & Arieli, A. (2001). Figuring space by time. Neuron, 32(2), 185-201. Ai, L., & Ro, T. (2014). The phase of prestimulus alpha oscillations affects tactile perception. J
Neurophysiol, 111(6), 1300-1307. doi: 10.1152/jn.00125.2013 Allport, D. A. (1968). Phenomenal simutaneity and the perceptual moment hypothesis. Br J
Psychol, 59(4), 395-406. Andrews, T., Purves, D., Simpson, W. A., & VanRullen, R. (2005). The wheel keeps turning:
Reply to Holcombe et al. Trends Cogn Sci, 9(12), 561. Arnal, L. H., Doelling, K. B., & Poeppel, D. (2015). Delta-Beta Coupled Oscillations Underlie
Arnal, L. H., & Giraud, A. L. (2012). Cortical oscillations and sensory predictions. Trends Cogn Sci, 16(7), 390-398. doi: 10.1016/j.tics.2012.05.003
Asher, H. (1971). "Trailing" phenomenon--a long-lasting LSD side effect. Am J Psychiatry, 127(9), 1233-1234. doi: 10.1176/ajp.127.9.1233
Bahramisharif, A., van Gerven, M. A., Aarnoutse, E. J., Mercier, M. R., Schwartz, T. H., Foxe, J. J., . . . Jensen, O. (2013). Propagating neocortical gamma bursts are coordinated by traveling alpha waves. J Neurosci, 33(48), 18849-18854. doi: 10.1523/JNEUROSCI.2455-13.2013
Baltus, A., & Herrmann, C. S. (2015). Auditory temporal resolution is linked to resonance frequency of the auditory cortex. Int J Psychophysiol, 98(1), 1-7. doi: 10.1016/j.ijpsycho.2015.08.003
Barry, R. J., Rushby, J. A., Johnstone, S. J., Clarke, A. R., Croft, R. J., & Lawrence, C. A. (2004). Event-related potentials in the auditory oddball as a function of EEG alpha phase at stimulus onset. Clin Neurophysiol, 115(11), 2593-2601. doi: 10.1016/j.clinph.2004.06.004
Baumgarten, T. J., Schnitzler, A., & Lange, J. (2015). Beta oscillations define discrete perceptual cycles in the somatosensory domain. Proc Natl Acad Sci U S A, 112(39), 12187-12192. doi: 10.1073/pnas.1501438112
Benedetto, A., Spinelli, D., & Morrone, C. (2016). Rhythmic modulation of visual contrast discrimination triggered by action. Proc R Soc Lond B Biol Sci, in press.
Benucci, A., Frazor, R. A., & Carandini, M. (2007). Standing waves and traveling waves distinguish two circuits in visual cortex. Neuron, 55(1), 103-117.
Berger, H. (1929). Über das Elektroenkephalogramm des Menschen. Archiv für Psychiatrie und Nervenkrankheiten, 87, 527-570.
Bergson, H. (1911). Creative Evolution: H. Holt. Blais, C., Arguin, M., & Gosselin, F. (2013). Human visual processing oscillates: evidence from
a classification image technique. Cognition, 128(3), 353-362. doi: 10.1016/j.cognition.2013.04.009
Blake, R., & Logothetis, N. K. (2002). Visual competition. Nat Rev Neurosci, 3(1), 13-21. Bompas, A., Sumner, P., Muthumumaraswamy, S. D., Singh, K. D., & Gilchrist, I. D. (2015).
The contribution of pre-stimulus neural oscillatory activity to spontaneous response time variability. Neuroimage, 107, 34-45. doi: 10.1016/j.neuroimage.2014.11.057
40
Bonnefond, M., & Jensen, O. (2012). Alpha oscillations serve to protect working memory maintenance against anticipated distracters. Curr Biol, 22(20), 1969-1974.
Bosman, C. A., Womelsdorf, T., Desimone, R., & Fries, P. (2009). A microsaccadic rhythm modulates gamma-band synchronization and behavior. J Neurosci, 29(30), 9471-9480. doi: 10.1523/JNEUROSCI.1193-09.2009
Bowen, R. W. (1989). Two pulses seen as three flashes: a superposition analysis. Vision Res, 29(4), 409-417.
Busch, N. A., Dubois, J., & VanRullen, R. (2009). The phase of ongoing EEG oscillations predicts visual perception. J Neurosci, 29(24), 7869-7876.
Busch, N. A., & VanRullen, R. (2010). Spontaneous EEG oscillations reveal periodic sampling of visual attention. Proc Natl Acad Sci U S A, 107(37), 16048-16053.
Buschman, T. J., & Miller, E. K. (2007). Top-down versus bottom-up control of attention in the prefrontal and posterior parietal cortices. Science, 315(5820), 1860-1862.
Buschman, T. J., & Miller, E. K. (2009). Serial, covert shifts of attention during visual search are reflected by the frontal eye fields and correlated with population oscillations. Neuron, 63(3), 386-396.
Buzsaki, G. (2006). Rhythms of the Brain. New York: Oxford University Press. Callaway, E. I., & Yeager, C. L. (1960). Relationship between reaction time and
electroencephalographic alpha phase. Science, 132(1765-1766). Cecere, R., Rees, G., & Romei, V. (2015). Individual differences in alpha frequency drive
Chakravarthi, R., & VanRullen, R. (2012). Conscious updating is a rhythmic process. Proc Natl Acad Sci U S A, 109(26), 10599-10604.
Chaudhuri, A. (1990). Modulation of the motion aftereffect by selective attention. Nature, 344(6261), 60-62.
Chen, C. Y., Ignashchenkova, A., Thier, P., & Hafed, Z. M. (2015). Neuronal Response Gain Enhancement prior to Microsaccades. Curr Biol, 25(16), 2065-2074. doi: 10.1016/j.cub.2015.06.022
Ciganek, L. (1969). Variability of the human visual evoked potential: normative data. Electroencephalogr Clin Neurophysiol, 27(1), 35-42.
Cottereau, B., Lorenceau, J., Gramfort, A., Clerc, M., Thirion, B., & Baillet, S. (2011). Phase delays within visual cortex shape the response to steady-state visual stimulation. Neuroimage, 54(3), 1919-1929. doi: 10.1016/j.neuroimage.2010.10.004
Cravo, A. M., Santos, K. M., Reyes, M. B., Caetano, M. S., & Claessens, P. M. (2015). Visual Causality Judgments Correlate with the Phase of Alpha Oscillations. J Cogn Neurosci, 27(10), 1887-1894. doi: 10.1162/jocn_a_00832
Crick, F., & Koch, C. (2003). A framework for consciousness. Nat Neurosci, 6(2), 119-126. Dehaene, S. (1993). Temporal oscillations in human perception. Psychological Science, 4(4),
264-270. Deschenes, M., Moore, J., & Kleinfeld, D. (2012). Sniffing and whisking in rodents. Curr Opin
Neurobiol, 22(2), 243-250. doi: 10.1016/j.conb.2011.11.013 Di Liberto, G. M., O'Sullivan, J. A., & Lalor, E. C. (2015). Low-Frequency Cortical Entrainment
Di Lollo, V., & Wilson, A. E. (1978). Iconic persistence and perceptual moment as determinants of temporal integration in vision. Vision Res, 18(12), 1607-1610.
41
Diederich, A., Schomburg, A., & Colonius, H. (2012). Saccadic reaction times to audiovisual stimuli show effects of oscillatory phase reset. PLoS ONE, 7(10), e44910. doi: 10.1371/journal.pone.0044910
Diederich, A., Schomburg, A., & van Vugt, M. (2014). Fronto-central theta oscillations are related to oscillations in saccadic response times (SRT): an EEG and behavioral data analysis. PLoS ONE, 9(11), e112974. doi: 10.1371/journal.pone.0112974
Ding, N., & Simon, J. Z. (2014). Cortical entrainment to continuous speech: functional roles and interpretations. Front Hum Neurosci, 8, 311. doi: 10.3389/fnhum.2014.00311
Doelling, K. B., Arnal, L. H., Ghitza, O., & Poeppel, D. (2014). Acoustic landmarks drive delta-theta oscillations to enable speech comprehension by facilitating perceptual parsing. Neuroimage, 85 Pt 2, 761-768. doi: 10.1016/j.neuroimage.2013.06.035
Drewes, J., & VanRullen, R. (2011). This is the rhythm of your eyes: the phase of ongoing electroencephalogram oscillations modulates saccadic reaction time. J Neurosci, 31(12), 4698-4708.
Drewes, J., Zhu, W., Wutz, A., & Melcher, D. (2015). Dense sampling reveals behavioral oscillations in rapid visual categorization. Sci Rep, 5, 16290. doi: 10.1038/srep16290
Dubois, J., & VanRullen, R. (2011). Visual trails: do the doors of perception open periodically? PLoS Biol, 9(5), e1001056.
Dugue, L., Marque, P., & VanRullen, R. (2011). The phase of ongoing oscillations mediates the causal relation between brain excitation and visual perception. J Neurosci, 31(33), 11889-11893.
Dugué, L., McLelland, D., Lajous, M., & VanRullen, R. (2015). Attention searches nonuniformly in space and in time. Proceedings of the National Academy of Sciences. doi: 10.1073/pnas.1511331112
Dugue, L., & VanRullen, R. (2014). The dynamics of attentional sampling during visual search revealed by Fourier analysis of periodic noise interference. J Vis, 14(2). doi: 10.1167/14.2.11
Dustman, R. E., & Beck, E. C. (1965). Phase of Alpha Brain Waves, Reaction Time and Visually Evoked Potentials. Electroencephalogr Clin Neurophysiol, 18, 433-440.
Engel, A. K., & Singer, W. (2001). Temporal binding and the neural correlates of sensory awareness. Trends Cogn Sci, 5(1), 16-25.
Fellinger, R., Gruber, W., Zauner, A., Freunberger, R., & Klimesch, W. (2012). Evoked traveling alpha waves predict visual-semantic categorization-speed. Neuroimage, 59(4), 3379-3388. doi: 10.1016/j.neuroimage.2011.11.010
Fiebelkorn, I. C., Foxe, J. J., Butler, J. S., Mercier, M. R., Snyder, A. C., & Molholm, S. (2011). Ready, set, reset: stimulus-locked periodicity in behavioral performance demonstrates the consequences of cross-sensory phase reset. J Neurosci, 31(27), 9971-9981. doi: 10.1523/JNEUROSCI.1338-11.2011
Fiebelkorn, I. C., Saalmann, Y. B., & Kastner, S. (2013). Rhythmic sampling within and between objects despite sustained attention at a cued location. Curr Biol, 23(24), 2553-2558. doi: 10.1016/j.cub.2013.10.063
Fiebelkorn, I. C., Snyder, A. C., Mercier, M. R., Butler, J. S., Molholm, S., & Foxe, J. J. (2013). Cortical cross-frequency coupling predicts perceptual outcomes. Neuroimage, 69, 126-137. doi: 10.1016/j.neuroimage.2012.11.021
Fisher, R. A. (1925). Statistical Methods for Research Workers. . Edinburgh: Oliver and Boyd.
42
Fontolan, L., Morillon, B., Liegeois-Chauvel, C., & Giraud, A. L. (2014). The contribution of frequency-specific activity to hierarchical information processing in the human auditory cortex. Nat Commun, 5, 4694. doi: 10.1038/ncomms5694
Fries, P. (2009). Neuronal gamma-band synchronization as a fundamental process in cortical computation. Annu Rev Neurosci, 32, 209-224.
Fries, P. (2015). Rhythms for Cognition: Communication through Coherence. Neuron, 88(1), 220-235. doi: 10.1016/j.neuron.2015.09.034
Fries, P., Nikolic, D., & Singer, W. (2007). The gamma cycle. Trends Neurosci, 30(7), 309-316. Fuentemilla, L., Penny, W. D., Cashdollar, N., Bunzeck, N., & Duzel, E. (2010). Theta-coupled
periodic replay in working memory. Curr Biol, 20(7), 606-612. doi: 10.1016/j.cub.2010.01.057
Geissler, H.-G. (1987). The temporal architecture of central information processing: Evidence for a tentative time-quantum model. Psychol Res, 49, 99-106.
Ghitza, O. (2011). Linking speech perception and neurophysiology: speech decoding guided by cascaded oscillators locked to the input rhythm. Frontiers in psychology, 2, 130.
Ghitza, O., Giraud, A. L., & Poeppel, D. (2012). Neuronal oscillations and speech perception: critical-band temporal envelopes are the essence. Front Hum Neurosci, 6, 340. doi: 10.3389/fnhum.2012.00340
Gho, M., & Varela, F. J. (1988). A quantitative assessment of the dependency of the visual temporal frame upon the cortical rhythm. J Physiol, 83(2), 95-101.
Giraud, A. L., & Poeppel, D. (2012). Cortical oscillations and speech processing: emerging computational principles and operations. Nat Neurosci, 15(4), 511-517.
Gross, J., Hoogenboom, N., Thut, G., Schyns, P., Panzeri, S., Belin, P., & Garrod, S. (2013). Speech rhythms and multiplexed oscillatory sensory coding in the human brain. PLoS Biol, 11(12), e1001752. doi: 10.1371/journal.pbio.1001752
Gruber, W. R., Zauner, A., Lechinger, J., Schabus, M., Kutil, R., & Klimesch, W. (2014). Alpha phase, temporal attention, and the generation of early event related potentials. Neuroimage, 103, 119-129. doi: 10.1016/j.neuroimage.2014.08.055
Haig, A. R., & Gordon, E. (1998). EEG alpha phase at stimulus onset significantly affects the amplitude of the P3 ERP component. Int J Neurosci, 93(1-2), 101-115.
Hamm, J. P., Dyckman, K. A., McDowell, J. E., & Clementz, B. A. (2012). Pre-cue fronto-occipital alpha phase and distributed cortical oscillations predict failures of cognitive control. J Neurosci, 32(20), 7034-7041.
Han, B., & VanRullen, R. (2015). The rhythms of predictive coding: pre-stimulus oscillatory phase modulates the influence of shape perception on luminance judgments. (submitted).
Hanslmayr, S., Volberg, G., Wimber, M., Dalal, S. S., & Greenlee, M. W. (2013). Prestimulus oscillatory phase at 7 Hz gates cortical information flow and visual perception. Curr Biol, 23(22), 2273-2278. doi: 10.1016/j.cub.2013.09.020
Harter, M. R. (1967). Excitability cycles and cortical scanning: a review of two hypotheses of central intermittency in perception. Psychol Bull, 68(1), 47-58.
Harter, M. R., & White, C. T. (1968). Periodicity within reaction time distributions and electromyograms. Quarterly Journal of Experimental Psychology, 20(2), 157-166.
Henry, M. J., & Herrmann, B. (2012). A precluding role of low-frequency oscillations for auditory perception in a continuous processing mode. J Neurosci, 32(49), 17525-17527.
Henry, M. J., Herrmann, B., & Obleser, J. (2014). Entrained neural oscillations in multiple frequency bands comodulate behavior. Proc Natl Acad Sci U S A, 111(41), 14935-14940. doi: 10.1073/pnas.1408741111
43
Henry, M. J., & Obleser, J. (2012). Frequency modulation entrains slow neural oscillations and optimizes human listening behavior. Proceedings of the National Academy of Sciences of the United States of America, 109(49), 20095-20100.
Hickok, G., Farahbod, H., & Saberi, K. (2015). The Rhythm of Perception: Entrainment to Acoustic Rhythms Induces Subsequent Perceptual Oscillation. Psychol Sci, 26(7), 1006-1013. doi: 10.1177/0956797615576533
Hillyard, S. A., Teder-Salejarvi, W. A., & Munte, T. F. (1998). Temporal dynamics of early perceptual processing. Curr Opin Neurobiol, 8(2), 202-210.
Hirsh, I. J., & Sherrick, C. E. J. (1961). Perceived order in different sense modalities. J Exp Psychol, 62(5), 423-432.
Hogendoorn, H. (2016). Voluntary saccadic eye movements ride the attentional rhythm. J Cogn Neurosci, in press.
Holcombe, A. O. (2009). Seeing slow and seeing fast: two limits on perception. Trends Cogn Sci, 13(5), 216-221.
Holcombe, A. O., & Chen, W. Y. (2013). Splitting attention reduces temporal resolution from 7 Hz for tracking one object to <3 Hz when tracking three. J Vis, 13(1), 12.
Holcombe, A. O., Clifford, C. W., Eagleman, D. M., & Pakarian, P. (2005). Illusory motion reversal in tune with motion detectors. Trends Cogn Sci, 9(12), 559-560.
Holcombe, A. O., & Seizova-Cajic, T. (2008). Illusory motion reversals from unambiguous motion with visual, proprioceptive, and tactile stimuli. Vision Res, 48(17), 1743-1757.
Huang, Y., Chen, L., & Luo, H. (2015). Behavioral oscillation in priming: competing perceptual predictions conveyed in alternating theta-band rhythms. J Vis, 15(12), 1246. doi: 10.1167/15.12.1246
Hutchinson, C. V., & Ledgeway, T. (2006). Sensitivity to spatial and temporal modulations of first-order and second-order motion. Vision Res, 46(3), 324-335.
İlhan, B., & VanRullen, R. (2012). No counterpart of visual perceptual echoes in the auditory system. PLoS ONE, 7(11), e49287.
Inyutina, M., Sun, H. M., Wu, C. T., & VanRullen, R. (2015). Who wins the race for consciousness? Ask the phase of ongoing ~7Hz oscillations. J Vis, 15(12), 569. doi: 10.1167/15.12.569
James, W. (1890). The principles of Psychology (Vol. I). New York: Holt. Jansen, B. H., & Brandt, M. E. (1991). The effect of the phase of prestimulus alpha activity on
the averaged visual evoked response. Electroencephalogr Clin Neurophysiol, 80(4), 241-250.
Jensen, O., Bonnefond, M., & VanRullen, R. (2012). An oscillatory mechanism for prioritizing salient unattended stimuli. Trends Cogn Sci, 16(4), 200-206.
Kayser, C., Ince, R. A., & Panzeri, S. (2012). Analysis of slow (theta) oscillations as a potential temporal reference frame for information coding in sensory cortices. PLoS Comput Biol, 8(10), e1002717. doi: 10.1371/journal.pcbi.1002717
Kayser, C., Petkov, C. I., & Logothetis, N. K. (2008). Visual modulation of neurons in auditory cortex. Cereb Cortex, 18(7), 1560-1574. doi: 10.1093/cercor/bhm187
Kayser, C., Wilson, C., Safaai, H., Sakata, S., & Panzeri, S. (2015). Rhythmic auditory cortex activity at multiple timescales shapes stimulus-response gain and background firing. J Neurosci, 35(20), 7750-7762. doi: 10.1523/JNEUROSCI.0268-15.2015
Kayser, S. J., Ince, R. A., Gross, J., & Kayser, C. (2015). Irregular Speech Rate Dissociates Auditory Cortical Entrainment, Evoked Responses, and Frontal Alpha. J Neurosci, 35(44), 14691-14701. doi: 10.1523/JNEUROSCI.2243-15.2015
44
Kayser, S. J., McNair, S. W., & Kayser, C. (2016). Prestimulus influences on auditory perception from sensory representations and decision processes. Proc Natl Acad Sci U S A. doi: 10.1073/pnas.1524087113
Kleinfeld, D., Deschenes, M., Wang, F., & Moore, J. D. (2014). More than a rhythm of life: breathing as a binder of orofacial sensation. Nat Neurosci, 17(5), 647-651. doi: 10.1038/nn.3693
Klimesch, W., Doppelmayr, M., Schimke, H., & Pachinger, T. (1996). Alpha frequency, reaction time, and the speed of processing information. J Clin Neurophysiol, 13(6), 511-518.
Klimesch, W., Hanslmayr, S., Sauseng, P., Gruber, W. R., & Doppelmayr, M. (2007). P1 and traveling alpha waves: evidence for evoked oscillations. J Neurophysiol, 97(2), 1311-1318.
Kline, K., & Eagleman, D. M. (2008). Evidence against the temporal subsampling account of illusory motion reversal. J Vis, 8(4), 13 11-15.
Kline, K., Holcombe, A. O., & Eagleman, D. M. (2004). Illusory motion reversal is caused by rivalry, not by perceptual snapshots of the visual field. Vision Res, 44(23), 2653-2658.
Kooi, K. A., & Bagchi, B. K. (1964). Observations on Early Components of the Visual Evoked Response and Occipital Rhythms. Electroencephalogr Clin Neurophysiol, 17, 638-643.
Kopell, N., Kramer, M. A., Malerba, P., & Whittington, M. A. (2010). Are different rhythms good for different functions? Front Hum Neurosci, 4, 187. doi: 10.3389/fnhum.2010.00187
Kosem, A., Gramfort, A., & van Wassenhove, V. (2014). Encoding of event timing in the phase of neural oscillations. Neuroimage, 92, 274-284. doi: 10.1016/j.neuroimage.2014.02.010
Kristofferson, A. B. (1967). Successiveness discrimination as a two-state, quantal process. Science, 158, 1337-1339.
Lakatos, P., Chen, C. M., O'Connell, M. N., Mills, A., & Schroeder, C. E. (2007). Neuronal oscillations and multisensory interaction in primary auditory cortex. Neuron, 53(2), 279-292. doi: 10.1016/j.neuron.2006.12.011
Lakatos, P., Karmos, G., Mehta, A. D., Ulbert, I., & Schroeder, C. E. (2008). Entrainment of neuronal oscillations as a mechanism of attentional selection. Science, 320(5872), 110-113.
Lakatos, P., O'Connell, M. N., Barczak, A., Mills, A., Javitt, D. C., & Schroeder, C. E. (2009). The leading sense: supramodal control of neurophysiological context by attention. Neuron, 64(3), 419-430.
Lakatos, P., Shah, A. S., Knuth, K. H., Ulbert, I., Karmos, G., & Schroeder, C. E. (2005). An oscillatory hierarchy controlling neuronal excitability and stimulus processing in the auditory cortex. J Neurophysiol, 94(3), 1904-1911. doi: 10.1152/jn.00263.2005
Lalor, E. C., Pearlmutter, B. A., Reilly, R. B., McDarby, G., & Foxe, J. J. (2006). The VESPA: a method for the rapid estimation of a visual evoked potential. Neuroimage, 32(4), 1549-1561.
Landau, A. N., & Fries, P. (2012). Attention samples stimuli rhythmically. Curr Biol, 22(11), 1000-1004.
Landau, A. N., Schreyer, H. M., van Pelt, S., & Fries, P. (2015). Distributed Attention Is Implemented through Theta-Rhythmic Gamma Modulation. Curr Biol, 25(17), 2332-2337. doi: 10.1016/j.cub.2015.07.048
Large, E. W., & Jones, M. R. (1999). The Dynamics of Attending: How People Track Time-Varying Events. Psychological Review, 106(1), 119-159.
45
Latour, P. L. (1967). Evidence of internal clocks in the human operator. Acta Psychol (Amst), 27, 341-348.
Leszczynski, M., Fell, J., & Axmacher, N. (2015). Rhythmic Working Memory Activation in the Human Hippocampus. Cell Rep, 13(6), 1272-1282. doi: 10.1016/j.celrep.2015.09.081
Lichtenstein, M. (1961). Phenomenal simultaneity with irregular timing of components of the visual stimulus. Percept Mot Skills, 12, 47-60.
Lisman, J. (2005). The theta/gamma discrete phase code occuring during the hippocampal phase precession may be a more general brain coding scheme. Hippocampus, 15(7), 913-922.
Lisman, J. (2007). Finding our rhythm. Nat Neurosci, 10(4), 395. Lowet, E., Roberts, M. J., Bosman, C. A., Fries, P., & de Weerd, P. (2015). Areas V1 and V2
show microsaccade-related 3-4 Hz covariation in gamma power and frequency. Eur J Neurosci. doi: 10.1111/ejn.13126
Luo, H., Liu, Z., & Poeppel, D. (2010). Auditory cortex tracks both auditory and visual stimulus dynamics using low-frequency neuronal phase modulation. PLoS Biol, 8(8), e1000445. doi: 10.1371/journal.pbio.1000445
Luo, H., & Poeppel, D. (2007). Phase patterns of neuronal responses reliably discriminate speech in human auditory cortex. Neuron, 54(6), 1001-1010.
Luo, H., & Poeppel, D. (2012). Cortical oscillations in auditory perception and speech: evidence for two temporal windows in human auditory cortex. Front Psychol, 3, 170. doi: 10.3389/fpsyg.2012.00170
Macdonald, J. S. P., Cavanagh, P., & VanRullen, R. (2013). Attentional sampling of multiple wagon wheels. in press.
Makeig, S., Westerfield, M., Jung, T. P., Enghoff, S., Townsend, J., Courchesne, E., & Sejnowski, T. J. (2002). Dynamic brain sources of visual evoked responses. Science, 295(5555), 690-694.
Manasseh, G., de Balthasar, C., Sanguinetti, B., Pomarico, E., Gisin, N., de Peralta, R. G., & Andino, S. L. G. (2013). Retinal and post-retinal contributions to the quantum efficiency of the human eye revealed by electrical neuroimaging. Frontiers in psychology, 4. doi: Artn 845, 10.3389/Fpsyg.2013.00845
Mathewson, K. E., Gratton, G., Fabiani, M., Beck, D. M., & Ro, T. (2009). To see or not to see: prestimulus alpha phase predicts visual awareness. J Neurosci, 29(9), 2725-2732.
McLelland, D., Lavergne, L., & VanRullen, R. (2014). The phase of ongoing EEG oscillations predicts the amplitude of peri-saccadic mislocalization. Paper presented at the Society for Neuroscience meeting, Washington DC.
Mercier, M. R., Foxe, J. J., Fiebelkorn, I. C., Butler, J. S., Schwartz, T. H., & Molholm, S. (2013). Auditory-driven phase reset in visual cortex: human electrocorticography reveals mechanisms of early multisensory integration. Neuroimage, 79, 19-29. doi: 10.1016/j.neuroimage.2013.04.060
Mercier, M. R., Molholm, S., Fiebelkorn, I. C., Butler, J. S., Schwartz, T. H., & Foxe, J. J. (2015). Neuro-oscillatory phase alignment drives speeded multisensory response times: an electro-corticographic investigation. J Neurosci, 35(22), 8546-8557. doi: 10.1523/JNEUROSCI.4527-14.2015
Michotte, A. (1963). The perception of causality. London: Methuen. Miconi, T., Roumy, M., & VanRullen, R. (2011). The three flashes illusion: A window into the
dynamics of visual processing. Paper presented at the ECVP, Toulouse.
46
Millman, R. E., Johnson, S. R., & Prendergast, G. (2015). The role of phase-locking to the temporal envelope of speech in auditory perception and speech intelligibility. J Cogn Neurosci, 27(3), 533-545. doi: 10.1162/jocn_a_00719
Milton, A., & Pleydell-Pearce, C. W. (2016). The phase of pre-stimulus alpha oscillations influences the visual perception of stimulus timing. Neuroimage, 133, 53-61. doi: 10.1016/j.neuroimage.2016.02.065
Monto, S., Palva, S., Voipio, J., & Palva, J. M. (2008). Very slow EEG fluctuations predict the dynamics of stimulus detection and oscillation amplitudes in humans. J Neurosci, 28(33), 8268-8272.
Morand, S., Gross, J., & Thut, G. (2015). Temporal framing in apparent motion perception cycles with a 12Hz (alpha) rhythm. J Vis, 15(12), 588. doi: 10.1167/15.12.588
Myers, N. E., Stokes, M. G., Walther, L., & Nobre, A. C. (2014). Oscillatory brain state predicts variability in working memory. J Neurosci, 34(23), 7735-7743. doi: 10.1523/JNEUROSCI.4741-13.2014
Nauhaus, I., Busse, L., Carandini, M., & Ringach, D. L. (2009). Stimulus contrast modulates functional connectivity in visual cortex. Nat Neurosci, 12(1), 70-76.
Nauhaus, I., Busse, L., Ringach, D. L., & Carandini, M. (2012). Robustness of traveling waves in ongoing activity of visual cortex. J Neurosci, 32(9), 3088-3094.
Neuling, T., Rach, S., Wagner, S., Wolters, C. H., & Herrmann, C. S. (2012). Good vibrations: oscillatory phase shapes perception. Neuroimage, 63(2), 771-778.
Ng, B. S., Schroeder, T., & Kayser, C. (2012). A precluding but not ensuring role of entrained low-frequency oscillations for auditory perception. J Neurosci, 32(35), 12268-12276.
Nietzsche, F. W., & Whitlock, G. (2001). The Pre-Platonic Philosophers: University of Illinois Press.
Nozaradan, S. (2014). Exploring how musical rhythm entrains brain activity with electroencephalogram frequency-tagging. Philos Trans R Soc Lond B Biol Sci, 369(1658), 20130393. doi: 10.1098/rstb.2013.0393
Nunn, C. M., & Osselton, J. W. (1974). The influence of the EEG alpha rhythm on the perception of visual stimuli. Psychophysiology, 11(3), 294-303.
O'Keefe, J., & Recce, M. L. (1993). Phase relationship between hippocampal place units and the EEG theta rhythm. Hippocampus, 3(3), 317-330.
Peelle, J. E., & Davis, M. H. (2012). Neural Oscillations Carry Speech Rhythm through to Comprehension. Frontiers in psychology, 3, 320.
Peelle, J. E., Gross, J., & Davis, M. H. (2013). Phase-locked responses to speech in human auditory cortex are enhanced during comprehension. Cerebral cortex (New York, N.Y.: 1991), 23(6), 1378-1387.
Perrodin, C., Kayser, C., Logothetis, N. K., & Petkov, C. I. (2015). Natural asynchronies in audiovisual communication signals regulate neuronal multisensory interactions in voice-sensitive cortex. Proc Natl Acad Sci U S A, 112(1), 273-278. doi: 10.1073/pnas.1412817112
Piantoni, G., Kline, K. A., & Eagleman, D. M. (2010). Beta oscillations correlate with the probability of perceiving rivalrous visual stimuli. J Vis, 10(13), 18.
Pitts, W., & McCulloch, W. S. (1947). How we know universals: the perception of auditory and visual forms. Bull Math Biophys, 9, 127-147.
Poeppel, D. (2003). The analysis of speech in different temporal integration windows: cerebral lateralization as 'asymmetric sampling in time'. Speech Communication, 41, 245-255.
47
Poppel, E. (1997). A hierarchical model of temporal perception. Trends Cogn Sci, 1(2), 56-61. doi: 10.1016/S1364-6613(97)01008-5
Poppel, E., & Logothetis, N. (1986). Neuronal oscillations in the human brain. Discontinuous initiations of pursuit eye movements indicate a 30-Hz temporal framework for visual information processing. Naturwissenschaften, 73(5), 267-268.
Prechtl, J. C., Cohen, L. B., Pesaran, B., Mitra, P. P., & Kleinfeld, D. (1997). Visual stimuli induce waves of electrical activity in turtle cortex. Proc Natl Acad Sci U S A, 94(14), 7621-7626.
Purves, D., Paydarfar, J. A., & Andrews, T. J. (1996). The wagon wheel illusion in movies and reality. Proc Natl Acad Sci U S A, 93(8), 3693-3697.
Reddy, L., Remy, F., Vayssiere, N., & VanRullen, R. (2011). Neural correlates of the continuous Wagon Wheel Illusion: a functional MRI study. Hum Brain Mapp, 32(2), 163-170.
Rezec, A., Krekelberg, B., & Dobkins, K. R. (2004). Attention enhances adaptability: evidence from motion adaptation experiments. Vision Res, 44(26), 3035-3044.
Ribary, U., Ioannides, A. A., Singh, K. D., Hasson, R., Bolton, J. P., Lado, F., . . . Llinas, R. (1991). Magnetic field tomography of coherent thalamocortical 40-Hz oscillations in humans. Proc Natl Acad Sci U S A, 88(24), 11037-11041.
Rice, D. M., & Hagstrom, E. C. (1989). Some evidence in support of a relationship between human auditory signal-detection performance and the phase of the alpha cycle. Percept Mot Skills, 69(2), 451-457. doi: 10.2466/pms.1989.69.2.451
Rizzolatti, G., Riggio, L., Dascola, I., & Umilta, C. (1987). Reorienting attention across the horizontal and vertical meridians: evidence in favor of a premotor theory of attention. Neuropsychologia, 25(1A), 31-40.
Romei, V., Gross, J., & Thut, G. (2012). Sounds reset rhythms of visual cortex and corresponding human visual perception. Curr Biol, 22(9), 807-813.
Roopun, A. K., Kramer, M. A., Carracedo, L. M., Kaiser, M., Davies, C. H., Traub, R. D., . . . Whittington, M. A. (2008). Temporal Interactions between Cortical Rhythms. Front Neurosci, 2(2), 145-154. doi: 10.3389/neuro.01.034.2008
Samaha, J., Bauer, P., Cimaroli, S., & Postle, B. R. (2015). Top-down control of the phase of alpha-band oscillations as a mechanism for temporal prediction. Proc Natl Acad Sci U S A, 112(27), 8439-8444. doi: 10.1073/pnas.1503686112
Samaha, J., & Postle, B. R. (2015). The Speed of Alpha-Band Oscillations Predicts the Temporal Resolution of Visual Perception. Curr Biol, 25(22), 2985-2990. doi: 10.1016/j.cub.2015.10.007
Saoud, H., Josse, G., Bertasi, E., Truy, E., Chait, M., & Giraud, A. L. (2012). Brain-speech alignment enhances auditory cortical responses and speech perception. J Neurosci, 32(1), 275-281.
Scheeringa, R., Mazaheri, A., Bojak, I., Norris, D. G., & Kleinschmidt, A. (2011). Modulation of visually evoked cortical FMRI responses by phase of ongoing occipital alpha oscillations. J Neurosci, 31(10), 3813-3820.
Schnitzler, A., & Gross, J. (2005). Normal and pathological oscillatory communication in the brain. Nat Rev Neurosci, 6(4), 285-296. doi: 10.1038/nrn1650
Schouten, J. F. (1967). Subjective stroboscopy and a model of visual movement detectors. In I. Wathen-Dunn (Ed.), Models for the perception of speech and visual form (pp. 44-45). Cambridge, MA.: MIT Press.
Schrauf, M., Lingelbach, B., & Wist, E. R. (1997). The scintillating grid illusion. Vision Res, 37(8), 1033-1038.
48
Schroeder, C. E., & Lakatos, P. (2009). Low-frequency neuronal oscillations as instruments of sensory selection. Trends Neurosci, 32(1), 9-18.
Schroeder, C. E., Wilson, D. A., Radman, T., Scharfman, H., & Lakatos, P. (2010). Dynamics of Active Sensing and perceptual selection. Curr Opin Neurobiol, 20(2), 172-176. doi: 10.1016/j.conb.2010.02.010
Shallice, T. (1964). The detection of change and the perceptual moment hypothesis. British Journal of Statistical Psychology, 17, 113-135.
Sherman, M. T., Kanai, R., Seth, A. K., & VanRullen, R. (2016). Rhythmic influence of top-down perceptual priors in the phase of pre-stimulus occipital alpha oscillations. J Cog Neuroscience, (in press).
Siegel, M., Donner, T. H., & Engel, A. K. (2012). Spectral fingerprints of large-scale neuronal interactions. Nat Rev Neurosci, 13(2), 121-134. doi: 10.1038/nrn3137
Siegel, M., Warden, M. R., & Miller, E. K. (2009). Phase-dependent neuronal coding of objects in short-term memory. Proc Natl Acad Sci U S A, 106(50), 21341-21346.
Simpson, W. A., Shahani, U., & Manahilov, V. (2005). Illusory percepts of moving patterns due to discrete temporal sampling. Neurosci Lett, 375(1), 23-27.
Singer, W. (1999). Time as coding space? Curr Opin Neurobiol, 9(2), 189-194. Singer, W., & Gray, C. M. (1995). Visual feature integration and the temporal correlation
hypothesis. Annu Rev Neurosci, 18, 555-586. Smear, M., Shusterman, R., O'Connor, R., Bozza, T., & Rinberg, D. (2011). Perception of sniff
phase in mouse olfaction. Nature, 479(7373), 397-400. doi: 10.1038/nature10521 Sokoliuk, R., & VanRullen, R. (2013). The Flickering Wheel Illusion: When alpha Rhythms
Make a Static Wheel Flicker. J Neurosci, 33(33), 13498-13504. Song, K., Meng, M., Chen, L., Zhou, K., & Luo, H. (2014). Behavioral oscillations in attention:
Strauss, A., Henry, M. J., Scharinger, M., & Obleser, J. (2015). Alpha phase determines successful lexical decision in noise. J Neurosci, 35(7), 3256-3262. doi: 10.1523/JNEUROSCI.3357-14.2015
Stroud, J. M. (1956). The fine structure of psychological time. In H. Quastler (Ed.), Information theory in Psychology (pp. 174-205). Chicago, Ill: Free Press.
Surwillo, W. W. (1961). Frequency of the Alpha Rhythm, Reaction Time and Age. Nature, 191(4790), 823-824.
Surwillo, W. W. (1964). The relation of decision time to brainwave frequency and to age. Electroencephalography and Clinical Neurophysiology, 16, 510-514.
Tallon-Baudry, C., & Bertrand, O. (1999). Oscillatory gamma activity in humans and its role in object representation. Trends Cogn Sci, 3(4), 151-162.
Ten Oever, S., van Atteveldt, N., & Sack, A. T. (2015). Increased Stimulus Expectancy Triggers Low-frequency Phase Reset during Restricted Vigilance. J Cogn Neurosci, 27(9), 1811-1822. doi: 10.1162/jocn_a_00820
Thorne, J. D., & Debener, S. (2013). Look now and hear what's coming: On the functional role of cross-modal phase reset. Hearing research.
Thut, G., Miniussi, C., & Gross, J. (2012). The functional importance of rhythmic activity in the brain. Curr Biol, 22(16), R658-663. doi: 10.1016/j.cub.2012.06.061
Tomassini, A., Spinelli, D., Jacono, M., Sandini, G., & Morrone, M. C. (2015). Rhythmic oscillations of visual contrast sensitivity synchronized with action. J Neurosci, 35(18), 7019-7029. doi: 10.1523/JNEUROSCI.4568-14.2015
49
Troncoso, X. G., Macknik, S. L., Otero-Millan, J., & Martinez-Conde, S. (2008). Microsaccades drive illusory motion in the Enigma illusion. Proc Natl Acad Sci U S A, 105(41), 16033-16038.
Uchida, N., Kepecs, A., & Mainen, Z. F. (2006). Seeing at a glance, smelling in a whiff: rapid forms of perceptual decision making. Nat Rev Neurosci, 7(6), 485-491.
van Erp, J. B., Philippi, T. G., de Winkel, K. N., & Werkhoven, P. (2014). Pre- and post-stimulus EEG patterns associated with the touch-induced illusory flash. Neurosci Lett, 562, 79-84. doi: 10.1016/j.neulet.2014.01.010
VanRullen, R. (2006). The continuous Wagon Wheel Illusion is object-based. Vision Res, 46(24), 4091-4095.
VanRullen, R. (2007). The continuous Wagon Wheel Illusion depends on, but is not identical to neuronal adaptation. Vision Res, 47(16), 2143-2149.
VanRullen, R. (2013). Visual attention: a rhythmic process? Curr Biol, 23(24), R1110-1112. doi: 10.1016/j.cub.2013.11.006
VanRullen, R. (2016). How to evaluate phase differences between trial groups in ongoing electrophysiological signals. submitted.
VanRullen, R., Busch, N. A., Drewes, J., & Dubois, J. (2011). Ongoing EEG phase as a trial-by-trial predictor of perceptual and attentional variability. Frontiers in Perception Science, 2(60), 1-9.
VanRullen, R., Carlson, T., & Cavanagh, P. (2007). The blinking spotlight of attention. Proc Natl Acad Sci U S A, 104(49), 19204-19209.
VanRullen, R., & Dubois, J. (2011). The psychophysics of brain rhythms. Front Psychol, 2, 203. VanRullen, R., Guyonneau, R., & Thorpe, S. J. (2005). Spike times make sense. Trends
Neurosci, 28(1), 1-4. VanRullen, R., & Koch, C. (2003). Is perception discrete or continuous? Trends Cogn Sci, 7(5),
207-213. VanRullen, R., Pascual-Leone, A., & Battelli, L. (2008). The continuous Wagon wheel illusion
and the 'when' pathway of the right parietal lobe: a repetitive transcranial magnetic stimulation study. PLoS ONE, 3(8), e2911.
VanRullen, R., Reddy, L., & Koch, C. (2005). Attention-driven discrete sampling of motion perception. Proc Natl Acad Sci U S A, 102(14), 5291-5296.
VanRullen, R., Reddy, L., & Koch, C. (2006). The continuous wagon wheel illusion is associated with changes in electroencephalogram power at approximately 13 Hz. J Neurosci, 26(2), 502-507.
VanRullen, R., Reddy, L., & Koch, C. (2010). A motion illusion revealing the temporally discrete nature of awareness. In R. Nijhawan (Ed.), Space and Time in Perception and Action (pp. 521-535). Cambridge: Cambridge University Press.
VanRullen, R., Zoefel, B., & Ilhan, B. (2014). On the cyclic nature of perception in vision versus audition. Philos Trans R Soc Lond B Biol Sci, 369(1641), 20130214. doi: 10.1098/rstb.2013.0214
Varela, F. J., Lachaux, J. P., Rodriguez, E., & Martinerie, J. (2001). The brainweb: phase synchronization and large-scale integration. Nat Rev Neurosci, 2(4), 229-239.
Varela, F. J., Toro, A., John, E. R., & Schwartz, E. L. (1981). Perceptual framing and cortical alpha rhythm. Neuropsychologia, 19(5), 675-686.
Venables, P. H. (1960). Periodicity in reaction time. Brit J Psychol, 51(1), 37-43. Vogel, W., & Broverman, D. M. (1964). Relationship between Eeg and Test Intelligence: A
Critical Review. Psychol Bull, 62, 132-144.
50
Voloh, B., Valiante, T. A., Everling, S., & Womelsdorf, T. (2015). Theta-gamma coordination between anterior cingulate and prefrontal cortex indexes correct attention shifts. Proc Natl Acad Sci U S A, 112(27), 8457-8462. doi: 10.1073/pnas.1500438112
von Baer, K. E. (1860). Festrede zur Eröffnung der russischen entomologischen Gesellschaft im Mai 1860. Berlin.
Walsh, E. G. (1952). Visual reaction time and the alpha-rhythm, an investigation of a scanning hypothesis. J Physiol, 118(4), 500-508.
White, C. (1963). Temporal numerosity and the psychological unit of duration. Psychological Monographs: General and Applied, 77(12), 1-37, Whole No 575.
White, C., & Harter, M. R. (1969). Intermittency in reaction time and perception, and evoked response correlates of image quality. Acta Psychol (Amst), 30, 368-377.
Whitlock, G. (2009). Baer, Karl Ernst Ritter von (1792–1876). In H. Birx (Ed.), Encyclopedia of Time: Science, Philosophy, Theology, & Culture (pp. 67-72). Thousand Oaks, CA: SAGE Publications, Inc.
Wiener, N. (1948). Gestalt and Universals. In N. Wiener (Ed.), Cybernetics (pp. 156-167). New York: Wiley.
Wutz, A., Weisz, N., Braun, C., & Melcher, D. (2014). Temporal windows in visual processing: "prestimulus brain state" and "poststimulus phase reset" segregate visual transients on different temporal scales. J Neurosci, 34(4), 1554-1565. doi: 10.1523/JNEUROSCI.3187-13.2014
Wyart, V., de Gardelle, V., Scholl, J., & Summerfield, C. (2012). Rhythmic fluctuations in evidence accumulation during decision making in the human brain. Neuron, 76(4), 847-858. doi: 10.1016/j.neuron.2012.09.015
Zeki, S., Watson, J. D., & Frackowiak, R. S. (1993). Going beyond the information given: the relation of illusory visual motion to brain activity. Proc Biol Sci, 252(1335), 215-222.
Zion-Golumbic, E. M., Ding, N., Bickel, S., Lakatos, P., Schevon, C. A., McKhann, G. M., . . . Schroeder, C. E. (2013). Mechanisms underlying selective neuronal tracking of attended speech at a "cocktail party". Neuron, 77(5), 980-991.
Zoefel, B., & Heil, P. (2013). Detection of Near-Threshold Sounds is Independent of EEG Phase in Common Frequency Bands. Frontiers in psychology, 4, 262.
Zoefel, B., Reddy Pasham, N., Bruers, S., & VanRullen, R. (2015). The ability of the auditory system to cope with temporal subsampling depends on the hierarchical level of processing. Neuroreport, 26(13), 773-778. doi: 10.1097/WNR.0000000000000422
Zoefel, B., & VanRullen, R. (2015a). EEG oscillations entrain their phase to high-level features of speech sound. Neuroimage, 124(Pt A), 16-23. doi: 10.1016/j.neuroimage.2015.08.054
Zoefel, B., & VanRullen, R. (2015b). Selective perceptual phase entrainment to speech rhythm in the absence of spectral energy fluctuations. J Neurosci, 35(5), 1954-1964. doi: 10.1523/JNEUROSCI.3484-14.2015