U.S. Department of the Interior U.S. Geological Survey Data Series 495 Perchlorate Data for Streams and Groundwater in Selected Areas of the United States, 2004 Groundwater site Surface-water site
Transcript
U.S. Department of the InteriorU.S. Geological Survey
Data Series 495
Perchlorate Data for Streams and Groundwater in Selected Areas of the United States, 2004
Groundwater siteSurface-water site
Cover illustration:
USGS personnel collect-ing a water sample from a small stream in Iowa.
Modified version of figure 1 from this report.
Photographs taken by USGS personnel.
USGS personnel collecting and processing a ground-water sample.
Perchlorate Data for Streams and Groundwater in Selected Areas of the United States, 2004By Stephen J. Kalkhoff, Sarah J. Stetson, Kris D. Lund, Richard B. Wanty, and Gregory L. Linder
Data Series 495
U.S. Department of the InteriorU.S. Geological Survey
U.S. Department of the InteriorKEN SALAZAR, Secretary
U.S. Geological SurveyMarcia K. McNutt, Director
U.S. Geological Survey, Reston, Virginia: 2010
For more information on the USGS—the Federal source for science about the Earth, its natural and living resources, natural hazards, and the environment, visit http://www.usgs.gov or call 1-888-ASK-USGS
For an overview of USGS information products, including maps, imagery, and publications, visit http://www.usgs.gov/pubprod
To order this and other USGS information products, visit http://store.usgs.gov
Any use of trade, product, or firm names is for descriptive purposes only and does not imply endorsement by the U.S. Government.
Although this report is in the public domain, permission must be secured from the individual copyright owners to reproduce any copyrighted materials contained within this report.
Suggested citation:Kalkhoff, S.J., Stetson, S.J., Lund, K.D., Wanty, R.B., and Linder, G.L., 2010, Perchlorate data for streams and groundwater in selected areas of the United States, 2004: U.S. Geological Survey Data Series 495, 43 p. with appendix.
Purpose and Scope ..............................................................................................................................2Description of the Study Area ............................................................................................................2Selection of Sampling Sites ................................................................................................................2
Surface Water ..............................................................................................................................3Groundwater .................................................................................................................................4
Quality Assurance..........................................................................................................................................4Field Blank Samples .............................................................................................................................4Replicate Samples ................................................................................................................................5Laboratory Quality Assurance Procedures ......................................................................................5Stability of Perchlorate in Water Samples .......................................................................................5
Occurrence of Perchlorate ..........................................................................................................................5Acknowledgments .......................................................................................................................................14References ....................................................................................................................................................14Appendix........................................................................................................................................................41
Figure
1–9 Maps showing: 1. Location of surface-water and groundwater sites for reconnaissance sampling,
2004 .........................................................................................................................................3 2. Perchlorate concentrations at selected surface-water and groundwater sites in
Arkansas and Texas, 2004 .....................................................................................................6 3. Perchlorate concentrations at selected surface-water sites in Arizonia and New
Mexico, 2004 ..........................................................................................................................7 4. Perchlorate concentrations at selected surface-water and groundwater sites in
California and Nevada, 2004 .................................................................................................8 5. Perchlorate concentrations at selected surface-water and groundwater sites in
Colorado, Wyoming, and South Dakota, 2004 .....................................................................9 6 Perchlorate concentrations at selected surface-water and groundwater sites in
Iowa, 2004 ............................................................................................................................10 7. Perchlorate concentrations at selected surface-water sites in Illinois, Indiana,
Missouri, and Ohio, 2004. ....................................................................................................11 8. Perchlorate concentrations at selected surface-water sites in Michigan, Minnesota,
and Wisconsin, 2004 ...........................................................................................................12 9 Perchlorate concentrations at selected surface-water and groundwater sites in
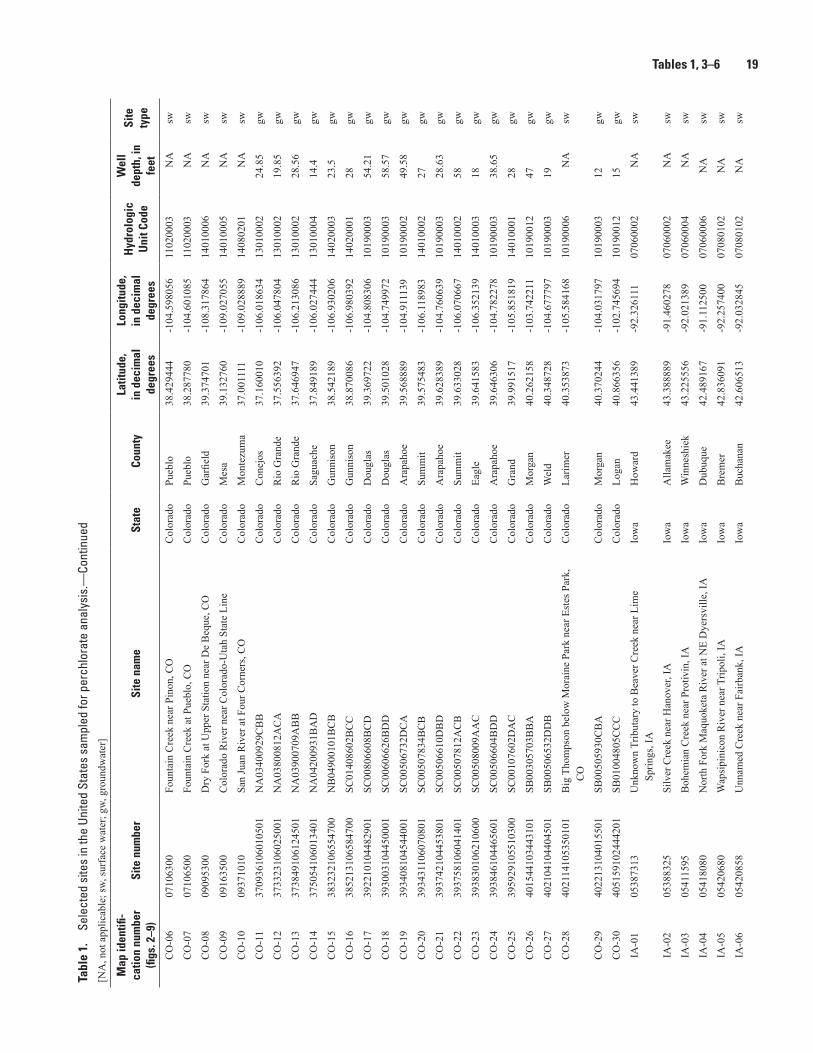
1. Selected sites in the United States sampled for perchlorate analysis . ..................................18 2. Quality assurrance-quality-control samples (field blanks) for perchlorate reconnaissance
study in selected areas of the United States ...............................................................................5 3. Quality assurrance-quality-control samples (replicates) for perchlorate reconnaissance
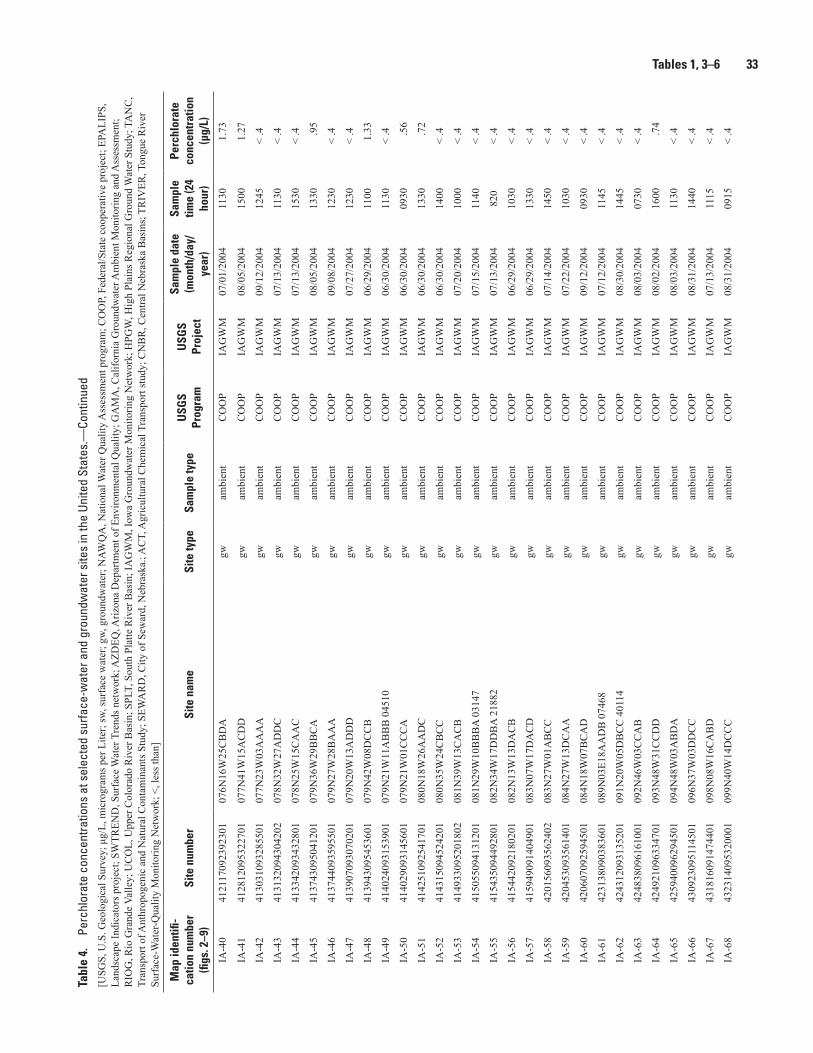
study in selected areas of the United States .............................................................................28 4. Perchlorate concentrations at selected surface-water and groundwater sites in the United
States ............................................................................................................................................29 5. Summary of perchlorate detections and concentrations in selected States .........................40 6. Perchlorate concentrations in streams sampled twice during the reconnaissance
study ..............................................................................................................................................40
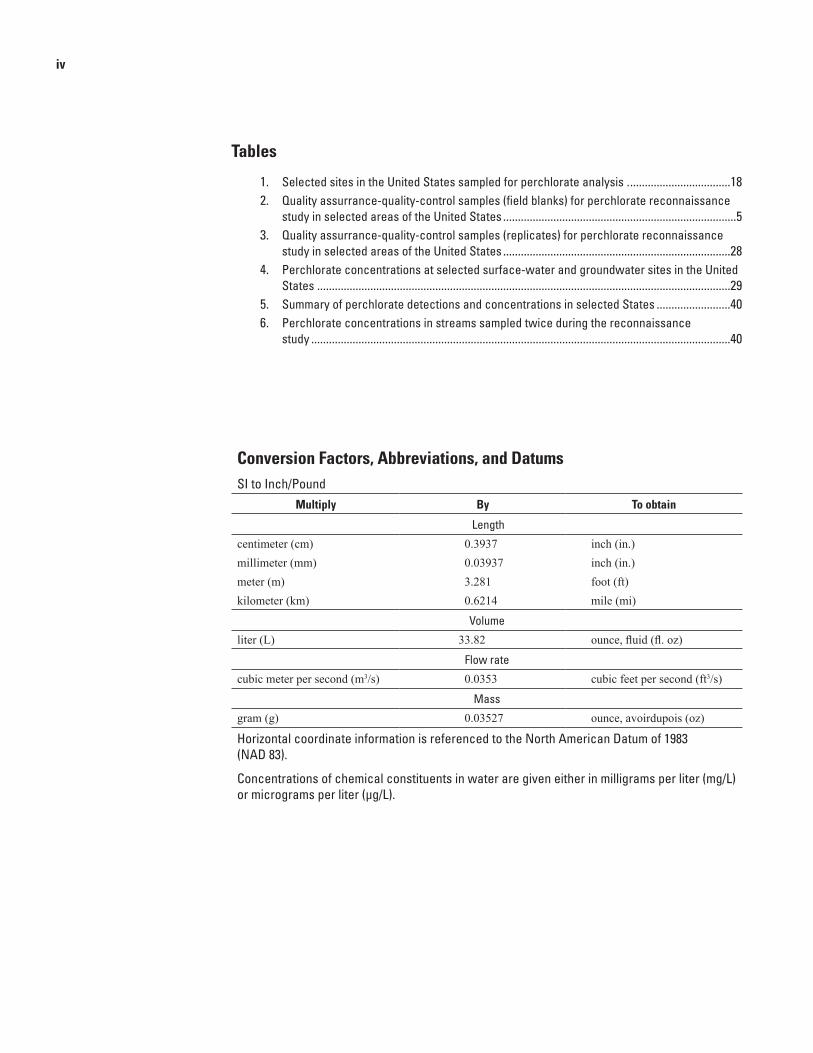
Conversion Factors, Abbreviations, and DatumsSI to Inch/Pound
Multiply By To obtain
Length
centimeter (cm) 0.3937 inch (in.)millimeter (mm) 0.03937 inch (in.)meter (m) 3.281 foot (ft) kilometer (km) 0.6214 mile (mi)
Volume
liter (L) 33.82 ounce, fluid (fl. oz)
Flow rate
cubic meter per second (m3/s) 0.0353 cubic feet per second (ft3/s)
Mass
gram (g) 0.03527 ounce, avoirdupois (oz)
Horizontal coordinate information is referenced to the North American Datum of 1983 (NAD 83).
Concentrations of chemical constituents in water are given either in milligrams per liter (mg/L) or micrograms per liter (µg/L).
AbstractThis report presents data collected as part of a recon-
naissance study to evaluate the occurrence of perchlorate in rivers and streams and in shallow aquifers in selected areas of the United States. Perchlorate, a component in rocket fuels, fireworks, and some explosives is soluble in water and persists in soils and water for long periods. It is biologically active at relatively low-levels in the environment, and has been identi-fied as an endocrine-disrupting chemical. The purpose of this reconnaissance was to determine the occurrence of perchlorate in agricultural areas of the Midwestern and North-Central United States and in arid Central and Western parts of the United States.
Samples were collected from 171 sites on rivers and streams and 146 sites from wells during the summer and early fall of 2004. Samples were collected from surface-water sites in 19 states and from wells in 5 states. Perchlorate was detected in samples collected in 15 states and was detected in 34 of 182 samples from rivers and streams and in 64 of 148 groundwater samples at concentrations equal to or greater than 0.4 micrograms per liter. Perchlorate concentrations were 1.0 micrograms per liter or greater in surface-water samples from seven states and in groundwater samples in four states. Only one surface-water and one groundwater sample had concentrations greater than 5.0 micrograms per liter. Perchlo-rate concentrations in followup samples collected from 1 to 3 months after the initial sample were unchanged at four of five stream sites.
IntroductionPerchlorate (ClO4
-), a naturally occurring and manmade compound that is a component in rocket fuels, fireworks, and some explosives, has been detected in many water supplies throughout the country. Most documented occurrences of perchlorate have been related to military and chemical-manu-facturing operations. However, a number of studies have docu-mented the presence of perchlorate in nitrate-bearing minerals from Chile that have been or are still being used as fertilizers in the United States.
Although perchlorate has been documented as a point-source contaminant in groundwater near areas where ammo-nium perchlorate is produced and where solid-fuel rockets, fireworks, and other explosives are manufactured or used, recent studies (Parker and others, 2008) have found perchlo-rate in areas with no apparent anthropogenic sources and where agricultural activities (fertilizers and irrigation) are prevalent. Small-scale studies have documented perchlorate in groundwater in the Texas High Plains (Rajagopalan and others, 2006), leafy vegetables (Sanchez and others, 2005), beef cattle (Cheng and others, 2004) and selected dairy milk from supermarket shelves in Texas (Kirk and others, 2003). Perchlorate occurs naturally in precipitation (Rajagopalan and others, 2009) and may accumulate in the unsaturated zone in areas with low precipitation (deserts) by deposition processes similar to nitrate (Walvoord and others, 2003). Infiltration of irrigation water can mobilize accumulated perchlorate and transport it from the unsaturated zone to the underlying aquifer (Scanlon and others, 2008).
The identification of perchlorate in sodium nitrate fertiliz-ers derived from Chilean caliche (Urbansky and others, 2001a) may support this suggestion. Although identified in Chilean caliche, perchlorate does not generally occur in manufactured nitrogen fertilizers (Urbansky and others, 2001b), but some questions remain on its occurrence in potash minerals (Orris and others, 2003). Perchlorate in groundwater in the United States has been documented by the U.S. Environmental Pro-tection Agency (2003), but the areal occurrence has not been investigated.
Perchlorate is soluble in water and persists in soils and water for long periods. It is biologically active at relatively low-levels in the environment, and its role as an endocrine-disrupting chemical has been documented in some fish (Patino and others, 2003; Crane and others, 2005). Uptake by plants (Nzengung and others, 1999) and microbial degradation (Cole-man and others, 2003; Sturchio and others, 2003) also has been established. The U.S. Environmental Protection Agency established a chronic oral reference dose (RfD) for humans of 0.0007 milligrams per kilogram body weight per day. The RfD equates to a Drinking Water Equivalent Level (DWEL) of 24.5 micrograms per liter (μg/L), or approximately equal to parts per billion (ppb). A DWEL is a lifetime exposure concen-tration protective of adverse, noncancer health effects that assumes all of the exposure to a contaminant is from drinking
Perchlorate Data for Streams and Groundwater in Selected Areas of the United States, 2004
By Stephen J. Kalkhoff, Sarah J. Stetson, Kris D. Lund, Richard B. Wanty, and Gregory L. Linder
2 Perchlorate Data for Streams and Groundwater in Selected Areas of the United States, 2004
water. (U.S. Environmental Protection Agency, 2008). A num-ber of states have set advisory levels less than the DWEL and as low as 1.0 μg/L (Interstate Technology Regulatory Council, 2005).
The occurrence of perchlorate has been documented in groundwater at pristine areas across the United State (Parker and others, 2008) and has been extensively studied in ground-water in the southern High Plains in Texas and New Mexico (Rajagopalan and others, 2006), Southwestern United States (Balaji and others, 2007), and California. However, additional information on the occurrence of perchlorate in the Central and Midwestern United States is still needed. Research has centered mainly on the occurrence in groundwater, and the occurrence of perchlorate in streams and rivers has not been investigated extensively.
Purpose and Scope
A reconnaissance sampling was conducted in 2004 to: (1) collect data to determine the occurrence of perchlorate over a gradient of agricultural land-use intensity in areas of the Mid-western and North Central United States and (2) collect data to determine if varying annual precipitation across the middle and western parts of the United States affects the occurrence of perchlorate in rivers and streams.
Surface-water and groundwater data were collected in agricultural areas. Surface-water data were collected at sites on small third-order streams draining agricultural watersheds in the Midwestern corn belt in the fall of 2004 during low-flow periods when most water in the stream originates from groundwater discharge. Followup samples were collected from five streams 1 to 3 months after the initial sampling to document any seasonal variability. Groundwater data were collected from shallow aquifers in the summer and early fall of 2004 that have relatively “young” waters that may be suscep-tible to contamination from current land-use practices.
Surface-water data were collected in the summer and early fall of 2004 from streams and rivers in the Central and Southwestern United States to determine if varying annual rainfall influenced perchlorate occurrence in surface water. Sites were located on small to medium-sized streams that drained a watershed with a single primary land use and larger rivers that integrated multiple land use in the watershed.
The purpose of this report is to present data collected as part of the perchlorate occurrence study in the Central and Southwestern United States. Data includes those from the agri-cultural land-use gradient component and from the precipita-tion gradient component of the reconnaissance study. Inter-pretation of the relations between perchlorate occurrence and geologic, climatologic, and anthropogenic factors is beyond the scope of this report.
Description of the Study Area
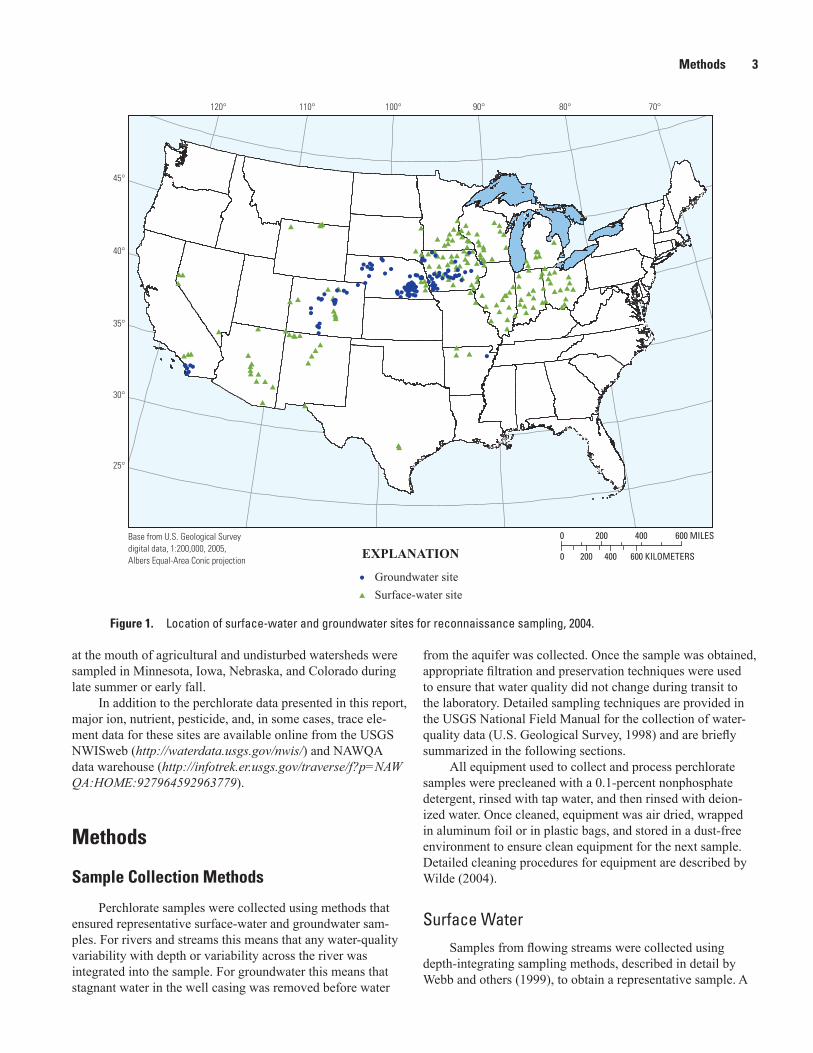
The reconnaissance study was concentrated in the Central and Southwestern part of the United States (fig. 1). Perchlorate samples were based on the availability of wells and streams being sampled as part of other U.S. Geological Survey’s (USGS) programs. The ongoing USGS water-quality programs include the National Water-Quality Assessment Program (NAWQA): joint US Environmental Protection Agency (EPA) and USGS Landscape Indicators (EPALIPS) project; and sev-eral USGS/State cooperative studies. Because of the integrated design, an extensive set of water-chemistry data that include physical properties, major ions, nutrients, and in some cases, trace elements are available in addition to the perchlorate data presented in this report. A list of projects that provided assis-tance in sample collection and selected reports documenting their findings is provided in appendix 1.
Selection of Sampling Sites
Several criteria were used to select stream and river sites and wells where perchlorate samples were added to existing data collection efforts to determine if perchlorate contamina-tion is more prevalent in areas where nitrogen and potassium minerals are used as fertilizers for agriculture and to determine if perchlorate contamination is more prevalent in areas that receive less rainfall where perchlorate may not be readily flushed through the hydrologic system.
Surface-water and groundwater sites were selected to obtain data on the occurrence of perchlorate in agricultural areas (table 1, at the back of this report). Surface-water sites on medium to large streams and rivers that drain agricul-tural, urban, and undisturbed watersheds from Texas through Arizona, New Mexico, and California (fig. 1) were sampled to obtain data on the occurrence of perchlorate in streams in rela-tion to a range of annual rainfall.
Water samples were collected from groundwater in an area with a gradient of agricultural intensity and of fertilizer use from Minnesota and Iowa southwest to Colorado. Shal-low groundwater that has most likely infiltrated within the last 50 years was sampled to define perchlorate occurrence in aquifers. An extensive set of wells (table 1, at the back of this report) was sampled in Nebraska for perchlorate along with the standard suite of other water-quality constituents. Thirty-eight municipal supply wells were sampled in Iowa during the summer of 2004. These 38 wells occur in shallow alluvial deposits and were selected because the aquifer is susceptible to contamination from land-surface activities. Although these are municipal wells, the wells are located in or near farmland. Additional wells were sampled in Colorado where agricultural land-use intensity is minimal. Small third-order streams that drain primarily agricultural areas in the Midwestern corn-belt were selected to determine if groundwater flowing to streams contained perchlorate. One hundred and ten sites in 10 Midwestern corn-belt states were sampled. Additional sites
Methods 3
at the mouth of agricultural and undisturbed watersheds were sampled in Minnesota, Iowa, Nebraska, and Colorado during late summer or early fall.
In addition to the perchlorate data presented in this report, major ion, nutrient, pesticide, and, in some cases, trace ele-ment data for these sites are available online from the USGS NWISweb (http://waterdata.usgs.gov/nwis/) and NAWQA data warehouse (http://infotrek.er.usgs.gov/traverse/f?p=NAWQA:HOME:927964592963779).
Methods
Sample Collection Methods
Perchlorate samples were collected using methods that ensured representative surface-water and groundwater sam-ples. For rivers and streams this means that any water-quality variability with depth or variability across the river was integrated into the sample. For groundwater this means that stagnant water in the well casing was removed before water
from the aquifer was collected. Once the sample was obtained, appropriate filtration and preservation techniques were used to ensure that water quality did not change during transit to the laboratory. Detailed sampling techniques are provided in the USGS National Field Manual for the collection of water-quality data (U.S. Geological Survey, 1998) and are briefly summarized in the following sections.
All equipment used to collect and process perchlorate samples were precleaned with a 0.1-percent nonphosphate detergent, rinsed with tap water, and then rinsed with deion-ized water. Once cleaned, equipment was air dried, wrapped in aluminum foil or in plastic bags, and stored in a dust-free environment to ensure clean equipment for the next sample. Detailed cleaning procedures for equipment are described by Wilde (2004).
Surface WaterSamples from flowing streams were collected using
depth-integrating sampling methods, described in detail by Webb and others (1999), to obtain a representative sample. A
120° 70°80°90°100°110°
45°
40°
35°
30°
25°
EXPLANATION
Groundwater siteSurface-water site
Base from U.S. Geological Survey digital data, 1:200,000, 2005, Albers Equal-Area Conic projection
0 200 600 MILES400
0 200 400 600 KILOMETERS
Figure 1. Location of surface-water and groundwater sites for reconnaissance sampling, 2004.
4 Perchlorate Data for Streams and Groundwater in Selected Areas of the United States, 2004
brief summary follows. Collection of depth-integrated samples involves using an equal-width-increment (EWI) or equal-discharge-increment (EDI) sampling method. The EWI or EDI methods produce a composite sample that represents the discharge weighted concentrations of the stream cross sec-tion being sampled. Samples were collected at verticals from increments of the cross section of a stream having a specified width. The number of verticals sampled varies based on the width of the stream. Generally 10–15 vertical samples were composited at each site. However, in narrow streams where it was not practical to obtain multiple vertical samples, one vertical sample was collected. Occasionally, low-flow condi-tions (stream depth less than about 15 cm deep, or the stream velocity is less than about 0.45 m/s) rendered the use of an iso-kinetic sampler impractical. In these conditions, a dip sample was collected.
GroundwaterDetailed groundwater sampling protocol is provided in
the groundwater sampling section (Chapter 4–2, by Gibbs and Wilde, 1999) of the National Field Manual and in a report documenting NAWQA protocols (Koterba and others, 1995). Initially, a water-level measurement was made to document natural or anthropogenic stresses on the aquifer. Wells were pumped for a sufficient amount of time so that a minimum of three well volumes were removed and so that temperature, specific conductance, and pH of the discharged water were stable. Once purged, the well was sampled by pumping the water through a 0.45 μm capsule filter into a polyethylene bottle as described below.
Sample Processing
Water collected from wells and streams was filtered through a capsule filter with a pore size of 0.45 μm for the perchlorate sample after filtering for major ions, nutrients, alkalinity, radiochemicals, and stable isotopes sample was completed. This ensured that several hundred milliliters of ambient water had been flushed through the filter before water was collected for the perchlorate sample. In addition, the first 20–25 mL of filtrate was used to rinse the polyethylene sample bottle to remove any foreign material. The sample bottle then was filled, capped securely, put in a ziplock bag, and chilled on ice for shipment to the laboratory. Once collected, the sample is kept chilled until analyzed at the laboratory.
Analytical Methods
The perchlorate analysis procedure was modified from that of Wagner and others (2004). Samples were analyzed for perchlorate using a Dionex DX-500 Ion Chromaograph (IC) system with a GP40 pump and ED40 electrochemical detector, 2 millimeter AG16 guard and AS16 analytical columns, and 35 millimole potassium hydroxide eluent flowing at a flow rate
of 0.25 milliliters per minute (mL/min). A 50-microliter injec-tion loop was used for samples with concentrations greater than 10 μg/L, and 1,000 microliter injection loop used for lower concentrations (less than or equal to 1 μg/L). A mem-brane suppression unit in the recycle mode was used with a current of 50 milliamps. Samples were pretreated with the barium, silver, and hydrogen cartridges. With the 2-millime-ter column system, the signal to noise ratio at 0.2 μg/L was approximately 5.
Quality AssuranceAn extensive array of quality-assurance (QA) samples
were analyzed to ensure that results were representative of those in the environment and were not because of introduc-tion of perchlorate during equipment cleaning or from cross contamination from previous samples (field blank samples). QA samples also were analyzed to ensure that the analytical method can determine accurate concentrations and can reliably reproduce results (replicate samples). In addition to the stan-dard QA samples, perchlorate concentrations were measured in prepared solutions for more than 600 days to document the long-term stability of perchlorate in samples.
Field Blank Samples
Field blank samples (blank samples) were collected to measure contamination introduced by the site environment (atmosphere) and by sample handling, processing, and analy-sis. Generally, blank samples were collected routinely during the collection period of environmental water samples and were distributed among sites to assess a broad range of locations, hydrologic conditions, and water types. Blank samples were collected, processed, and analyzed in a manner that simulates the collection, processing, transport, and analysis of environ-mental water samples through clean sampling and processing equipment. The collection and processing of surface-water samples were simulated by pouring blank water (pesticide-grade water suitable for use in the collection of field blanks) into the sampler bottle, capping the sampler bottle and nozzle assembly, shaking, and pouring the blank water into a split-ter. Blank water from the splitter then was filtered into sample bottles. Blank samples from surface-water sites were col-lected prior to the collection of environmental water samples to determine if cleaning procedures removed contamination introduced by water at the previous site, and if contamination was introduced by the transport of equipment to the current site. No field blank samples contained detectable concentra-tions of perchlorate (table 2).
Occurrence of Perchlorate 5
Replicate Samples
Replicate samples were collected and analyzed to esti-mate the precision of concentration values from sample pro-cessing and analysis. Each replicate is an aliquot of the native sample water processed in the field through the same sample equipment and processed using identical procedures. Labo-ratory replicates are an aliquot of an environmental sample submitted for analysis.
Most of the replicate samples (table 3, at the back of this report) did not contain detectable concentrations of perchlo-rate. Analytical results of replicate samples from 10 sites had concentrations below the detection limit (0.4 μg/L) in both the ambient and replicate sample. Results of replicate samples from five sites had low levels of perchlorate (0.41 to 0.96 μg/L) in the ambient sample but no detectable concentration in the replicate sample. Results from one site had a detection in the replicate but not in the ambient sample.
Laboratory Quality Assurance Procedures
Approximately 10 percent of samples were analyzed in duplicate to ensure that there is reproducibility among analy-sis. Standards were analyzed between every 5–10 samples and a blank was analyzed approximately every 15 samples to ensure accuracy of data and to verify that no carry over occured between samples. The precision of the method was determined by calculating the standard deviation in the ana-lyzed concentration of standard solutions of 100 and 1 μg/L. To ensure that there was no loss or enrichment of perchlorate during sample preparation, standards were analyzed after preparation in the same manner as samples. The recovered concentrations were found to be within the standard deviation of the original standards.
Stability of Perchlorate in Water Samples
The long-term stability of perchlorate in deionized water and in a common water matrix was determined to quantify any
changes in perchlorate concentrations from the time of sample collection until sample analysis. Sets of samples containing 1,000, 100, 10, 1, 0.5 and 0 μg/L perchlorate in deionized water and also in local tap water were formulated. These samples were analyzed by ion chromatography and were compared to perchlorate concentration in freshly prepared standards every 24 hours for the first 7 days, biweekly for the next 4 weeks, and periodically after that for a total of 400 or 610 days for the two lowest concentrations and a total of 428 or 638 days for the high concentrations (Stetson and others, 2006). Perchlorate was found to be stable allowing for holding times of at least 90 days for surface-water samples and at least 300 days for groundwater samples (Stetson and others, 2006).
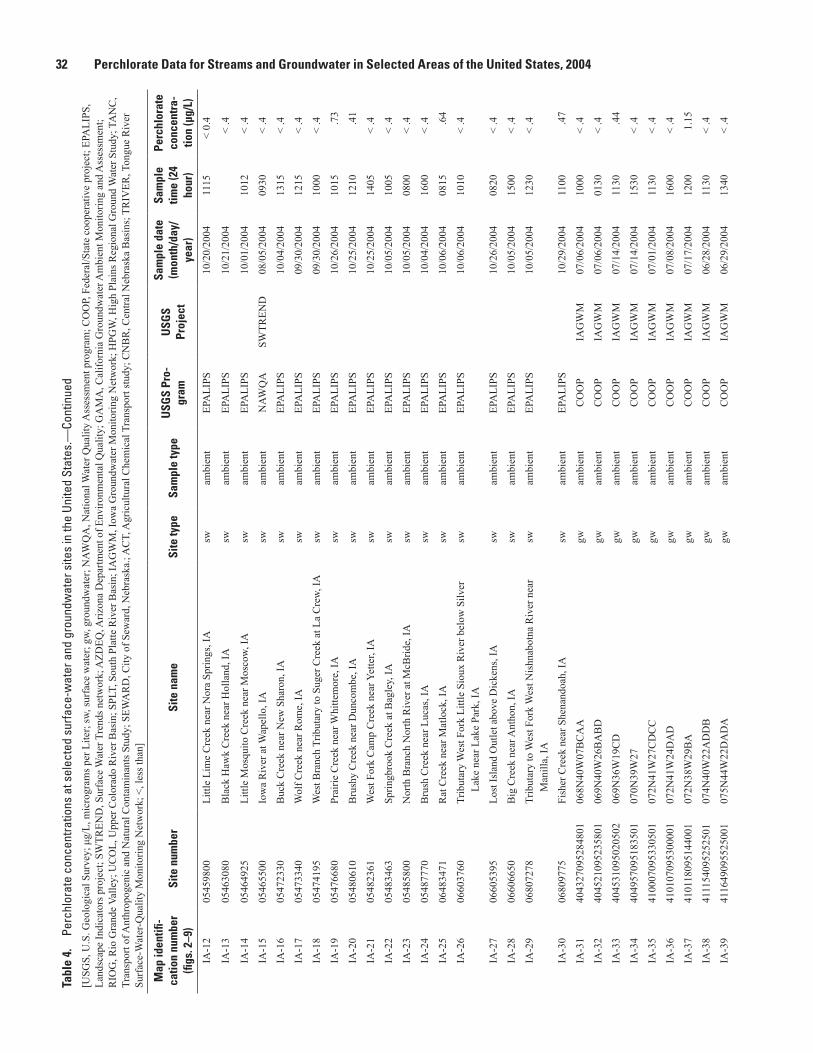
Occurrence of Perchlorate Samples were collected from 171 sites on rivers and
streams and 146 sites from wells during the summer and early fall of 2004. Samples were collected from surface-water sites in 19 states and from wells in 5 states.
Perchlorate was detected in samples collected in 15 states and was detected in 34 of 182 samples from rivers and streams and in 64 of 148 groundwater samples at concentrations equal to or greater than the 0.4 micrograms per liter (μg/L) reporting limit. Perchlorate concentrations were 1.0 μg/L or greater in surface-water samples from seven states and in groundwater samples in four states (table 5, at the back of this report). Only one surface water and one groundwater sample had concentra-tions greater than 5.0 μg/L. The results of the reconnaissance study, summarized by State, are shown in table 4 (at the back of this report) and illustrated in figures 2–9.
Perchlorate concentrations in followup samples collected from 1 to 3 months after the initial sample were unchanged at four of five stream sites (table 5). The perchlorate concentra-tion decreased from 0.8 μg/L on August 23, 2004, to less than detection level on October 7, 2004, in the Little Cobb River near Beauford, Minnesota (table 5).
Table 2. Quality-assurrance-quality-control samples (field blanks) for perchlorate reconnaissance study in selected areas of the United States.[<, less than]
Map identifica-tion number (figures 2–9)
Site number Site nameSample date(month/day/
year)
Sample time(24 hour)
Perchlorate concentration
(μg/L )
IA-01 05387313 Unknown Tributary to Beaver Creek near Lime Springs, IA
10/26/2004 1320 <0.4
MN-02 05316983 County Ditch 24 near Clements, MN 10/07/2004 0900 < .4NV-01 094196783 Las Vegas Wash below Flamingo Wash
Confluence near Las Vegas, NV08/17/2004 1020 < .4
OH-12 405251082164801 Jerome Fork near Ashland, OH 10/01/2004 1008 < .4SD-01 431559096350100 Little Beaver Creek near Canton, SD 09/02/2004 0830 < .4
6 Perchlorate Data for Streams and Groundwater in Selected Areas of the United States, 2004
90°93°96°99°102°105°
36°
33°
30°
27°
TX-03
TX-02TX-01
AR-03AR-02
AR-01
AR-04
EXPLANATION(identifier used in tables is next to symbol)
Groundwater sampling siteNot detected0.40 – 0.991.00 or greater
Surface-water sampling siteNot detected0.40 – 0.991.00 or greater
For sites with multiple samples, symbol corresponds to sample of first occurence
T E X A S
A R K A N S A S
L O U I S I A N A
O K L A H O M A
Base from U.S. Geological Survey digital data, 1:200,000, 2005, Albers Equal-Area Conic projection
0 200100 MILES
0 100 200 KILOMETERS
Figure 2. Perchlorate concentrations at selected surface-water and groundwater sites in Arkansas and Texas, 2004.
Occurrence of Perchlorate 7
103°106°109°112°115°
37°
35°
33°
31°
NM-05NM-08
NM-04
NM-03
NM-02
NM-01
AZ-11
AZ-10
AZ-08
AZ-07
AZ-05
AZ-04
AZ-03
AZ-02
AZ-01
NM-07
NM-06
AZ-09
AZ-06
Surface-water sampling siteNot detected0.40 – 0.991.00 or greater
A R I Z O N A
N E W M E X I C O
0 50 100 150 MILES
0 50 100 150 KILOMETERS
For sites with multiple samples, symbol corresponds to sample of first occurence
Base from U.S. Geological Survey digital data, 1:200,000, 2005, Albers Equal-Area Conic projection
EXPLANATION(identifier used in tables is next to symbol)
Figure 3. Perchlorate concentrations at selected surface-water sites in Arizona and New Mexico, 2004.
8 Perchlorate Data for Streams and Groundwater in Selected Areas of the United States, 2004
113°116°119°122°125°
39°
36°
33°
NV-04
NV-03NV-02
NV-01
CA-03CA-02 CA-01
CA-11CA-10
CA-09CA-08CA-07
CA-06CA-05CA-04
Groundwater sampling siteNot detected0.40 – 0.991.00 or greater
Surface-water sampling siteNot detected0.40 – 0.991.00 or greater
C A L I F O R N I A
N E V A D A
For sites with multiple samples, symbol corresponds to sample of first occurence
Base from U.S. Geological Survey digital data, 1:200,000, 2005, Albers Equal-Area Conic projection
0 50 100 150 MILES
0 50 100 150 KILOMETERSEXPLANATION
(identifier used in tables is next to symbol)
Figure 4. Perchlorate concentrations at selected surface-water and groundwater sites in California and Nevada, 2004.
Occurrence of Perchlorate 9
98°102°106°110°
44°
41°
38°
CO-30
CO-29CO-28 CO-27CO-26
CO-25CO-24 CO-23CO-20
CO-18CO-17
CO-16
CO-15CO-14
CO-13
CO-12
CO-22CO-21 CO-19
WY-04WY-03
WY-01
CO-11
CO-10
CO-09CO-08
CO-07CO-06
CO-05CO-04
CO-03CO-02
CO-01
WY-02SD-03
SD-02
SD-01
C O L O R A D O
W Y O M I N G
S O U T H D A K O T A
Groundwater sampling siteNot detected0.40 – 0.991.00 or greater
Surface-water sampling siteNot detected0.40 – 0.991.00 or greater
For sites with multiple samples, symbol corresponds to sample of first occurence
Base from U.S. Geological Survey digital data, 1:200,000, 2005, Albers Equal-Area Conic projection
0 50 100 150 MILES
0 50 100 150 KILOMETERSEXPLANATION
(identifier used in tables is next to symbol)
Figure 5. Perchlorate concentrations at selected surface-water and groundwater sites in Colorado, Wyoming, and South Dakota, 2004.
10 Perchlorate Data for Streams and Groundwater in Selected Areas of the United States, 2004
Figure 6. Perchlorate concentrations at selected surface-water and groundwater sites in Iowa, 2004.
90°W91°W92°W93°W94°W95°W96°W
43°N
42°N
41°N
IA-68 IA-67
IA-66
IA-65
IA-64IA-63 IA-62
IA-61
IA-60IA-59IA-57
IA-56IA-55
IA-54IA-53 IA-52 IA-51
IA-50IA-48 IA-46IA-45 IA-44IA-43
IA-42IA-41
IA-40IA-39
IA-38
IA-37IA-36
IA-34
IA-33
IA-32
IA-58
IA-49IA-47
IA-35
IA-31 IA-30
IA-29
IA-28
IA-27
IA-26
IA-25
IA-24
IA-23
IA-22
IA-21
IA-20
IA-19
IA-18
IA-17
IA-16
IA-15
IA-14
IA-13
IA-12
IA-11
IA-10
IA-09IA-08
IA-07
IA-06
IA-05
IA-04
IA-03
IA-02IA-01
Groundwater sampling siteNot detected0.40 – 0.991.00 or greater
Surface-water sampling siteNot detected0.40 – 0.991.00 or greater
I O W A
For sites with multiple samples, symbol corresponds to sample of first occurence
Base from U.S. Geological Survey digital data, 1:200,000, 2005, Albers Equal-Area Conic projection
0 50 100 MILES
0 50 100 KILOMETERSEXPLANATION
(identifier used in tables is next to symbol)
Occurrence of Perchlorate 11
82°85°88°91°94°
42°
40°
38°
36°
OH-14
OH-12
OH-11 OH-10
OH-09OH-08 OH-07
OH-06OH-05
OH-04OH-03
OH-02
OH-01
MO-02
MO-01
IN-15
IN-14 IN-13
IN-12IN-11
IN-10
IN-09
IN-08IN-07
IN-06IN-04
IN-03
IN-02
IN-01
IL-15
IL-14IL-13 IL-12
IL-11
IL-10IL-09 IL-08
IL-07
IL-06
IL-05IL-04
IL-03
IL-01
OH-13
IN-05
IL-02
I L L I N O I SI N D I A N A
O H I O
M I S S O U R I
Surface-water sampling siteNot detected0.40 – 0.991.00 or greater
0 50 100 150 MILES
0 50 100 150 KILOMETERS
For sites with multiple samples, symbol corresponds to sample of first occurence
Base from U.S. Geological Survey digital data, 1:200,000, 2005, Albers Equal-Area Conic projection
EXPLANATION(identifier used in tables is next to symbol)
Figure 7. Perchlorate concentrations at selected surface-water sites in Illinois, Indiana, Missouri, and Ohio, 2004.
12 Perchlorate Data for Streams and Groundwater in Selected Areas of the United States, 2004
Figure 8. Perchlorate concentrations at selected surface-water sites in Michigan, Minnesota, and Wisconsin, 2004.
83°86°89°92°95°
48°
46°
44°
42°
0 50 100 150 MILES
0 50 100 150 KILOMETERS
WI-14
WI-11
WI-05
MN-09
MN-04
WI-18WI-17 WI-16
WI-15WI-13WI-12
WI-10
WI-09
WI-08
WI-07 WI-06WI-04
WI-03
WI-02
WI-01
MN-13
MN-12
MN-11
MN-10
MN-08
MN-07MN-06
MN-05
MN-03
MN-02
MN-01
MI-08
MI-07
MI-06 MI-05
MI-04 MI-03
MI-02
MI-01
M I N N E S O T A
W I S C O N S I N
M I C H I G A N
Surface-water sampling siteNot detected0.40 – 0.991.00 or greater
For sites with multiple samples, symbol corresponds to sample of first occurence
Base from U.S. Geological Survey digital data, 1:200,000, 2005, Albers Equal-Area Conic projection
EXPLANATION(identifier used in tables is next to symbol)
Occurrence of Perchlorate 13
97°100°103°
43°
42°
41°
40°
NE-05
NE-04
NE-03
NE-02
NE-85
NE-84
NE-83NE-82
NE-81
NE-80
NE-79NE-78
NE-76
NE-75NE-74
NE-72NE-71
NE-57NE-56
NE-55NE-52
NE-24NE-23 NE-22
NE-19NE-17
NE-16
NE-14NE-13
NE-11
NE-10
NE-07NE-06
NE-77
NE-73
NE-61
NE-54
NE-53NE-51NE-47
NE-21NE-20NE-18NE-15
NE-12NE-09
NE-08
Inset AInset B
Inset C
N E B R A S K A
Groundwater sampling siteNot detected0.40 – 0.991.00 or greater
Surface-water sampling siteNot detected0.40 – 0.991.00 or greater
For sites with multiple samples, symbol corresponds to sample of first occurence
Base from U.S. Geological Survey digital data, 1:200,000, 2005, Albers Equal-Area Conic projection
NE-01
NE-70NE-69NE-68
NE-67NE-66NE-65
NE-64NE-63NE-62
NE-60NE-59NE-58
Coun
ty R
d 20
Maple Creek
NE-50NE-49
NE-46NE-45NE-44
NE-43NE-42
NE-39
NE-35NE-34
US Hwy 34
Seward
0 50 100 150 MILES
0 50 100 150 KILOMETERS
NE-48
NE-41
NE-40
NE-38NE-37
NE-36 NE-33NE-32
NE-31
NE-30NE-29NE-28
NE-27NE-26
NE-25
US Hwy 34York
Inset A Inset B Inset C
0 1 KILOMETERS
0 1 MILES
0 1 KILOMETERS
0 1 MILES
0 100 METERS
0 600 FEET
EXPLANATION(identifier used in tables is next to symbol)
Figure 9. Perchlorate concentrations at selected surface-water and groundwater sites in Nebraska, 2004.
14 Perchlorate Data for Streams and Groundwater in Selected Areas of the United States, 2004
AcknowledgmentsThis project was funded by the USGS Central Region
Integrated Science Project. The authors would like to thank Janice Ward, USGS retired, who originally indentified the need to obtain additional perchlorate data in the United States; developed an initial study design; obtained funding; and brought together the multidisciplinary team to accomplish this project. USGS National Water Quality Laboratory login staff were instrumental in separating perchlorate samples from other water-quality samples and ensuring the samples were sent to the perchlorate laboratory. Substantial support was provided by many USGS field personnel who voluntarily col-lected the samples as part of National Water-Quality Assess-ment Progam (NAWQA), the joint USEPA/USGS LIPSs study, and numerous USGS cooperative projects.
References
Balaji, Rao, Anderson, T.A., Orris, G.J., Rainwater, K.A., Rajagopalan, Srinath, Sandvig, R.M., Scanlon, B.R., Ston-estrom, D.A., Walvoord, M. A., and Jackson, W.A., 2007, Widespread natural perchlorate in unsaturated zones of the Southwest United States: Environmental Science and Tech-nology, v. 41, no. 13, p. 4,522–4,528.
Cheng, Quiqiong, Perlumtter, Lisa, Smith, P.N., McMurry S.T., Jackson, W.A., and Anderson, T.A., 2004, A study of perchlorate exposure and adsorption in beef cattle: Journal of Agricultural and Food Chemistry, v. 52, no. 11, p. 3,456–3,461.
Clark, M.L., and Mason, J.P., 2007, Water-quality character-istics for sites in the Tongue, Powder, Cheyenne, and Belle Fourche River drainage basins, Wyoming and Montana, water years 2001–2005, with temporal patterns of selected long-term water-quality data: U.S. Geological Survey Sci-entific Investigations Report 2007–5146, 65 p.
Coleman, M.L., Ader, Magali, Chaudhuri, Swades, and Coates, J.D., 2003, Microbial isotopic fractionation of perchlorate chlorine: Applied and Environmental Microbiol-ogy, v., 69, no. 8, p. 4,997–5,000.
Crane, H.M., Pickford, D.B., Hutchinson, T.H., and Brown, J.A., 2005, Effects of Ammonium Perchlorate on Thyroid Function in Developing Fathead Minnows, Pimephales promelas: Environmental Health Perspectives, v. 113, no. 4, p. 396–401.
Fredrick, B.S., Linard, J.I., and Carpenter, J.L., 2006, Envi-ronmental setting of Maple Creek watershed, Nebraska: U.S. Geological Survey Scientific Investigations Report 2006–5037, 22 p.
Gibbs, Jacob, and Wilde, F.D., 1999, Chapter 4.2; Ground-water sampling: Preparations and purging methods at water-supply wells and monitoring wells sites in U.S. Geological Survey, 1998, National field manual for the collection of water-quality data: U.S. Geological Survey Techniques of Water-Resources Investigations, book 9, chaps. A1–A9, available online at http://pubs.water.usgs.gov/twri9A.
Interstate Technology Regulatory Council, 2005, Perchlo-rate: Overview of issues, status, and remedial options: The Interstate Technology and Regulatory Council Perchlorate Team, 90 p., available online at http://www.itrcweb.org/Documents/PERC-1.pdf.
Kirk, A.B., Smith, E.E., Tian, Kang, Anderson, T.A., and Dasgupta, P.K., 2003, Perchlorate in milk: Environmental Science and Technology, v., 37, no. 21, p. 4,979–4,981.
Koterba, M.T., Wilde, F.D., and Lapham, W.W., 1995, Ground-water data-collection protocols and procedures for the National Water-Quality Assessment Program: collection and documentation of water-quality samples and related data: U.S. Geological Survey Open-File Report 95–399, 113 p.
Landon, M.K., Clark, B.R., McMahon, P.B., McGuire, V.L., and Turco, M.J., 2008, Hydrogeology, chemical character-istics, and transport processes in the zone of contribution of a public-supply well in York, Nebraska: U.S. Geological Survey Scientific Investigations Report 2008–5050, 149 p.
Littin, G.R., 2004, Quality of ground water used for selected municipal water supplies in Iowa, 1997–2002 water years: U.S. Geological Survey Open-File Report 2004–1048, 36 p.
Mau, D.P., Stogner, R.W., Sr., and Edelmann, Patrick, 2007, Characterization of stormflows and wastewater treatment-plant effluent discharges on water quality, suspended sedi-ment, and stream morphology for Fountain and Monument Creek Watersheds, Colorado, 1981–2006: U.S. Geological Survey Scientific Investigations Report 2007–5104, 76 p.
McMahon, Peter B., Dennehy, Kevin F., Bruce, Breton W., Gurdak, Jason J., and Qi, Sharon L., 2007, Water-quality assessment of the High Plains Aquifer, 1999–2004: U.S. Geological Survey Professional Paper 1749, 136 p.
Nzengung, V.A., Wang, Chuhua, and Harvey, Greg, 1999, Plant-mediated transformation of perchlorate into chlorine: Environmental Science and Technology, v. 33, no. 9, p. 1,470–1,478.
Orris, G.J., Harvey, G.J., Tsui, D.T., and Eldridge, J.E., 2003, Preliminary analyses for perchlorate in selected natural materials and their derivative products: U.S. Geological Survey Open-File Report 2003–314, 6 p.
References 15
Parker, D.R., Seyfferth, A.L., and Reese, B.K., 2008, Perchlo-rate in groundwater: A synoptic survey of “pristine” sites in the coterminous United States: Environmental Science and Technology, v. 42, no. 5, p. 1,465–1,471.
Patino, R., Wainscott, M.R., Cruz-Li, E.I., Balakrishnan, S., McMurry, C., Blazer, V.S., and Anderson, T.A., 2003, Effects of ammonium perchlorate on the reproductive performance and thyroid follicle histology of zebrafish: Environmental Toxicology and Chemistry, v. 22, no. 5, p. 1,115–1,121.
Rajagopalan, Srinath, Anderson, T.A., Fahlquist, L.S., Rain-water, K.A., Ridley, Moira, and Jackson, W.A., 2006, Wide-spread presence of naturally occurring perchlorate in High Plains of Texas and New Mexico: Environmental Science and Technology, v. 40, no. 10, p. 3,156–3,162.
Rajagopalan, Srinath, Anderson, T.A., Cox, S., Harvey, G., Cheng, Q., and Jackson, W.A., 2009, Perchlorate in wet deposition across North America: Environmental Science and Technology, v. 43, p. 616–622.
Sanchez, C.A., Crump, K.S., Drieger, R.I., Khandaker, N.R., and Gibbs, J.P., 2005, Perchlorate and nitrate in leafy vegetables of North America: Environmental Science and Technology, v. 39. no. 24, p. 9,391–9,397.
Scanlon, B.R., Reedy, R.C., Jackson, W.A., and Rao, Balaji, 2008, Mobilization of naturally occurring perchlorate related to land-use change in the Southern High Plains, Texas: Environmental Science and Technology, v. 42, no. 23, p. 8,648–8,653.
Stanton, J.S., Landon, M.K., and Turco, M.J., 2007, Ground-water age and quality in the High Plains aquifer near Seward, Nebraska, 2003–04: U.S. Geological Survey Scien-tific Investigations Report 2007–5088, 37 p.
Stetson, S.J., Wanty, R.B., Helsel, D.R., Kalkhoff, S.J., and Macalady, D.L., 2006, Stability of low levels of perchlo-rate in drinking water and natural water samples: Analytica Chimica Acta, v. 567, p. 108–113.
Sturchio, N.C., Hatzinger, P.B., Suh, Christy, and Heraty, L.J., 2003, Chlorine isotope fractionation during microbial reduction of perchlorate: Environmental Science and Tech-nology, v. 37, no. 17, p. 3,859–3,863.
Urbansky, E.T., Brown, S.K., Magnuson, M.L., and Kelty, C.A., 2001a, Perchlorate levels in samples of sodium nitrate fertilizer derived from Chilean caliche: Environmental Pol-lution, v. 112, p. 299–302.
Urbansky, E.T., Collette, T.W., Robarge, W.P., Hall, W.L., Skillen, J.M., and Kane, P.F., 2001b, Survey of fertilizers and related materials for perchlorate (ClO4) Final Report: U.S. Environmental Protection Agency Office of Research and Development EPA/600/R-01/047, 26 p.
U.S. Environmental Protection Agency, 2003, Occurrence and potential sources of perchlorate released to the environment as of April, 2003; available online at http://www.epa.gov/fedfac/pdf/percocc0403.pdf.
U.S. Environmental Protection Agency, 2008, Emerging Contaminant – Perchlorate: U.S. Environmental Protection Agency Fact Sheet EPA 505-F-07-0, 4 p.
U.S. Geological Survey, 1998, National field manual for the collection of water-quality data: U.S. Geological Survey Techniques of Water-Resources Investigations, book 9, chaps. A1–A9, available online at http://pubs.water.usgs.gov/twri9A.
Wagner, H.P., Suarez, F.X., Pepich, B.V., Hautman, D.P., and Munch, D.J., 2004, Challenges encountered in extending the sensitivity of U.S. Environmental Protection Agency Method 314.0 for perchlorate in drinking water: Journal of Chromatography A, v. 1039, p. 97–104.
Walvoord, M.A., Phillips, F.M., Stonestrom, D.A., Evans, R.D., Hartsough, P.C., Newman, B.D., and Striegel, R.G., 2003, A reservoir of nitrate beneath desert soils: Science, v. 302, p. 1,021–1,024.
Webb, W.E., Radtke, D.B., and Iwatsubo, R.T., 1999, Chapter 4.1 Surface-water sampling: Collection methods at flow-ing-water and still-water sites in U.S. Geological Survey, 1998, National field manual for the collection of water-quality data: U.S. Geological Survey Techniques of Water-Resources Investigations, book 9, chaps. A1–A9, available online at http://pubs.water.usgs.gov/twri9A.
Wilde, F.D., ed., 2004, Cleaning of equipment for water sampling (ver. 2.0): U.S. Geological Survey Techniques of Water-Resources Investigations, book 9, chap. A3, April, accessed February 13, 2009 at http://pubs.water.usgs.gov/twri9A3/.
Wright, M.T., Belitz, Kenneth, and Burton, C.A., 2005, Cali-fornia GAMA Program—Ground-water quality in the San Diego Drainages hydrogeologic province, California, 2004: U.S. Geological Survey Data Series 129, 91 p.
Tables 1, 3–6
18 Perchlorate Data for Streams and Groundwater in Selected Areas of the United States, 2004Ta
ble
1.
Sele
cted
site
s in
the
Unite
d St
ates
sam
pled
for p
erch
lora
te a
naly
sis.
[NA
, not
app
licab
le; s
w, su
rfac
e w
ater
; gw,
gro
undw
ater
]
Map
iden
tifi-
catio
n nu
mbe
r (fi
gs.
2–9)
Site
num
ber
Site
nam
eSt
ate
Coun
tyLa
titud
e,
in d
ecim
al
degr
ees
Long
itude
, in
dec
imal
de
gree
s
Hyd
rolo
gic
Uni
t Cod
e
Wel
l de
pth,
in
feet
Site
ty
pe
AR
-01
0705
3250
Yocu
m C
reek
nea
r Oak
Gro
ve, A
RA
rkan
sas
Car
roll
36.4
5478
8-9
3.35
6017
1101
0001
NA
sw
AR
-02
0705
5646
Buf
falo
Riv
er n
ear B
oxle
y, A
RA
rkan
sas
New
ton
35.9
3890
3-9
3.40
5061
1101
0005
NA
sw
AR
-03
0706
0710
Nor
th S
ylam
ore
Cre
ek n
ear F
ifty
Six,
AR
Ark
ansa
sSt
one
35.9
9173
9-9
2.21
4044
1101
0004
NA
sw
AR
-04
3546
3509
0365
601
13N
04E1
2AB
B1
Ark
ansa
sC
raig
head
35.7
7646
5-9
0.61
5665
0802
0203
110
gw
AZ-
0109
3800
00C
olor
ado
Riv
er a
t Lee
s Fer
ry, A
ZA
rizon
aC
ocon
ino
36.8
6471
0-1
11.5
8821
614
0700
06N
Asw
AZ-
0209
4485
00G
ila R
iver
at H
ead
of S
affo
rd V
alle
y ne
ar S
olom
on, A
ZA
rizon
aG
raha
m32
.868
397
-109
.511
186
1504
0005
NA
sw
AZ-
0309
4665
00G
ila R
iver
at C
alva
, AZ
Ariz
ona
Gra
ham
33.1
8561
3-1
10.2
2009
015
0400
05N
Asw
AZ-
0409
4710
00Sa
n Pe
dro
Riv
er a
t Cha
rlest
on, A
ZA
rizon
aC
ochi
se31
.625
926
-110
.174
523
1505
0202
NA
sw
AZ-
0509
4740
00G
ila R
iver
at K
elvi
n, A
ZA
rizon
aPi
nal
33.1
0284
0-1
10.9
7650
115
0501
00N
Asw
AZ-
0609
4985
00Sa
lt R
iver
nea
r Roo
seve
lt, A
ZA
rizon
aG
ila33
.619
495
-110
.921
504
1506
0103
NA
sw
AZ-
0709
5020
00Sa
lt R
iver
bel
ow S
tew
art M
ount
ain
Dam
, AZ
Ariz
ona
Mar
icop
a33
.552
823
-111
.576
524
1506
0106
NA
sw
AZ-
0809
5040
00Ve
rde
Riv
er n
ear C
lark
dale
, AZ
Ariz
ona
Yava
pai
34.8
5224
2-1
12.0
6599
415
0602
02N
Asw
AZ-
0909
5079
80Ea
st V
erde
Riv
er n
ear C
hild
s, A
ZA
rizon
aG
ila34
.276
421
-111
.638
756
1506
0203
NA
sw
AZ-
1009
5085
00Ve
rde
Riv
er b
elow
Tan
gle
Cre
ek a
bove
Hor
sesh
oe
Dam
, AZ
Ariz
ona
Yava
pai
34.0
7309
2-1
11.7
1625
715
0602
03N
Asw
AZ-
1109
5100
00Ve
rde
Riv
er b
elow
Bar
tlett
Dam
, AZ
Ariz
ona
Mar
icop
a33
.808
375
-111
.663
473
1506
0203
NA
sw
CA
-01
1104
9400
Sant
a Ana
Riv
er a
bove
Sev
en O
aks D
am, C
AC
alifo
rnia
San
Ber
nard
ino
34.1
4278
8-1
17.0
6948
018
0702
03N
Asw
CA
-02
1106
0400
War
m C
reek
nea
r San
Ber
nard
ino,
CA
Cal
iforn
iaSa
n B
erna
rdin
o34
.078
346
-117
.300
321
1807
0203
NA
sw
CA
-03
1107
4000
Sant
a Ana
Riv
er b
elow
Pra
do D
am, C
AC
alifo
rnia
Riv
ersi
de33
.883
349
-117
.645
330
1807
0203
NA
sw
CA
-04
3239
2511
7044
001
017S
002W
27P0
02S
Cal
iforn
iaSa
n D
iego
32.6
5707
5-1
17.0
7783
618
0703
0460
6gw
CA
-05
3248
4011
6584
401
016S
001W
03E0
01S
Cal
iforn
iaSa
n D
iego
32.8
1136
1-1
16.9
7905
618
0703
0490
6gw
CA
-06
3251
5711
6551
401
015S
001E
18L0
05S
Cal
iforn
iaSa
n D
iego
32.8
6611
1-1
16.9
2055
618
0703
0423
0gw
CA
-07
3304
4711
7065
301
013S
002W
05D
001S
Cal
iforn
iaSa
n D
iego
33.0
7994
4-1
17.1
1486
118
0703
0445
0gw
CA
-08
3314
4311
7181
201
011S
004W
04K
005S
Cal
iforn
iaSa
n D
iego
33.2
4527
8-1
17.3
0333
318
0703
0313
5gw
CA
-09
3316
5911
6394
701
010S
003E
27D
002S
Cal
iforn
iaSa
n D
iego
33.2
8308
3-1
16.6
6305
618
0703
0329
5gw
CA
-10
3317
0711
7223
601
010S
005W
26C
003S
Cal
iforn
iaSa
n D
iego
33.2
8544
4-1
17.3
7683
318
0703
02N
Agw
CA
-11
3320
2411
6535
701
010S
001E
05B
001S
Cal
iforn
iaSa
n D
iego
33.3
4003
4-1
16.9
0002
518
0703
0317
0gw
CO
-01
0671
3500
Che
rry
Cre
ek a
t Den
ver,
CO
Col
orad
oD
enve
r39
.742
487
-104
.999
982
1019
0003
NA
sw
CO
-02
0675
3990
Lone
tree
Cre
ek n
ear G
reel
ey, C
OC
olor
ado
Wel
d40
.442
481
-104
.588
849
1019
0008
NA
sw
CO
-03
0675
4000
Sout
h Pl
atte
Riv
er n
ear K
erse
y, C
OC
olor
ado
Wel
d40
.411
925
-104
.562
737
1019
0003
NA
sw
CO
-04
0710
3707
Foun
tain
Cre
ek b
elow
8th
Stre
et a
t Col
orad
o Sp
rings
, C
OC
olor
ado
El P
aso
38.8
2943
7-1
04.8
3969
711
0200
03N
Asw
CO
-05
0710
6000
Foun
tain
Cre
ek n
ear F
ount
ain,
CO
Col
orad
oEl
Pas
o38
.601
665
-104
.670
250
1102
0003
NA
sw
Tables 1, 3–6 19Ta
ble
1.
Sele
cted
site
s in
the
Unite
d St
ates
sam
pled
for p
erch
lora
te a
naly
sis.
—Co
ntin
ued
[NA
, not
app
licab
le; s
w, su
rfac
e w
ater
; gw,
gro
undw
ater
]
Map
iden
tifi-
catio
n nu
mbe
r (fi
gs. 2
–9)
Site
num
ber
Site
nam
eSt
ate
Coun
tyLa
titud
e,
in d
ecim
al
degr
ees
Long
itude
, in
dec
imal
de
gree
s
Hyd
rolo
gic
Uni
t Cod
e
Wel
l de
pth,
in
feet
Site
ty
pe
CO
-06
0710
6300
Foun
tain
Cre
ek n
ear P
inon
, CO
Col
orad
oPu
eblo
38.4
2944
4-1
04.5
9805
611
0200
03N
Asw
CO
-07
0710
6500
Foun
tain
Cre
ek a
t Pue
blo,
CO
Col
orad
oPu
eblo
38.2
8778
0-1
04.6
0108
511
0200
03N
Asw
CO
-08
0909
5300
Dry
For
k at
Upp
er S
tatio
n ne
ar D
e B
eque
, CO
Col
orad
oG
arfie
ld39
.374
701
-108
.317
864
1401
0006
NA
sw
CO
-09
0916
3500
Col
orad
o R
iver
nea
r Col
orad
o-U
tah
Stat
e Li
neC
olor
ado
Mes
a39
.132
760
-109
.027
055
1401
0005
NA
sw
CO
-10
0937
1010
San
Juan
Riv
er a
t Fou
r Cor
ners
, CO
Col
orad
oM
onte
zum
a37
.001
111
-109
.028
889
1408
0201
NA
sw
CO
-11
3709
3610
6010
501
NA
0340
0929
CB
BC
olor
ado
Con
ejos
37.1
6001
0-1
06.0
1863
413
0100
0224
.85
gw
CO
-12
3733
2310
6025
001
NA
0380
0812
AC
AC
olor
ado
Rio
Gra
nde
37.5
5639
2-1
06.0
4780
413
0100
0219
.85
gw
CO
-13
3738
4910
6124
501
NA
0390
0709
AB
BC
olor
ado
Rio
Gra
nde
37.6
4694
7-1
06.2
1308
613
0100
0228
.56
gw
CO
-14
3750
5410
6013
401
NA
0420
0931
BA
DC
olor
ado
Sagu
ache
37.8
4918
9-1
06.0
2744
413
0100
0414
.4gw
CO
-15
3832
3210
6554
700
NB
0490
0101
BC
BC
olor
ado
Gun
niso
n38
.542
189
-106
.930
206
1402
0003
23.5
gw
CO
-16
3852
1310
6584
700
SC01
4086
02B
CC
Col
orad
oG
unni
son
38.8
7008
6-1
06.9
8039
214
0200
0128
gw
CO
-17
3922
1010
4482
901
SC00
8066
08B
CD
Col
orad
oD
ougl
as39
.369
722
-104
.808
306
1019
0003
54.2
1gw
CO
-18
3930
0310
4450
001
SC00
6066
26B
DD
Col
orad
oD
ougl
as39
.501
028
-104
.749
972
1019
0003
58.5
7gw
CO
-19
3934
0810
4544
001
SC00
5067
32D
CA
Col
orad
oA
rapa
hoe
39.5
6888
9-1
04.9
1113
910
1900
0249
.58
gw
CO
-20
3934
3110
6070
801
SC00
5078
34B
CB
Col
orad
oSu
mm
it39
.575
483
-106
.118
983
1401
0002
27gw
CO
-21
3937
4210
4453
801
SC00
5066
10D
BD
Col
orad
oA
rapa
hoe
39.6
2838
9-1
04.7
6063
910
1900
0328
.63
gw
CO
-22
3937
5810
6041
401
SC00
5078
12A
CB
Col
orad
oSu
mm
it39
.633
028
-106
.070
667
1401
0002
58gw
CO
-23
3938
3010
6210
600
SC00
5080
09A
AC
Col
orad
oEa
gle
39.6
4158
3-1
06.3
5213
914
0100
0318
gw
CO
-24
3938
4610
4465
601
SC00
5066
04B
DD
Col
orad
oA
rapa
hoe
39.6
4630
6-1
04.7
8227
810
1900
0338
.65
gw
CO
-25
3959
2910
5510
300
SC00
1076
02D
AC
Col
orad
oG
rand
39.9
9151
7-1
05.8
5181
914
0100
0128
gw
CO
-26
4015
4410
3443
101
SB00
3057
03B
BA
Col
orad
oM
orga
n40
.262
158
-103
.742
211
1019
0012
47gw
CO
-27
4021
0410
4404
501
SB00
5065
32D
DB
Col
orad
oW
eld
40.3
4872
8-1
04.6
7779
710
1900
0319
gw
CO
-28
4021
1410
5350
101
Big
Tho
mps
on b
elow
Mor
aine
Par
k ne
ar E
stes
Par
k,
CO
Col
orad
oLa
rimer
40.3
5387
3-1
05.5
8416
810
1900
06N
Asw
CO
-29
4022
1310
4015
501
SB00
5059
30C
BA
Col
orad
oM
orga
n40
.370
244
-104
.031
797
1019
0003
12gw
CO
-30
4051
5910
2444
201
SB01
0048
05C
CC
Col
orad
oLo
gan
40.8
6635
6-1
02.7
4569
410
1900
1215
gw
IA-0
105
3873
13U
nkno
wn
Trib
utar
y to
Bea
ver C
reek
nea
r Lim
e Sp
rings
, IA
Iow
aH
owar
d43
.441
389
-92.
3261
1107
0600
02N
Asw
IA-0
205
3883
25Si
lver
Cre
ek n
ear H
anov
er, I
AIo
wa
Alla
mak
ee43
.388
889
-91.
4602
7807
0600
02N
Asw
IA-0
305
4115
95B
ohem
ian
Cre
ek n
ear P
rotiv
in, I
AIo
wa
Win
nesh
iek
43.2
2555
6-9
2.02
1389
0706
0004
NA
sw
IA-0
405
4180
80N
orth
For
k M
aquo
keta
Riv
er a
t NE
Dye
rsvi
lle, I
AIo
wa
Dub
uque
42.4
8916
7-9
1.11
2500
0706
0006
NA
sw
IA-0
505
4206
80W
apsi
pini
con
Riv
er n
ear T
ripol
i, IA
Iow
aB
rem
er42
.836
091
-92.
2574
0007
0801
02N
Asw
IA-0
605
4208
58U
nnam
ed C
reek
nea
r Fai
rban
k, IA
Iow
aB
ucha
nan
42.6
0651
3-9
2.03
2845
0708
0102
NA
sw
20 Perchlorate Data for Streams and Groundwater in Selected Areas of the United States, 2004Ta
ble
1.
Sele
cted
site
s in
the
Unite
d St
ates
sam
pled
for p
erch
lora
te a
naly
sis.
—Co
ntin
ued
[NA
, not
app
licab
le; s
w, su
rfac
e w
ater
; gw,
gro
undw
ater
]
Map
iden
tifi-
catio
n nu
mbe
r (fi
gs. 2
–9)
Site
num
ber
Site
nam
eSt
ate
Coun
tyLa
titud
e,
in d
ecim
al
degr
ees
Long
itude
, in
dec
imal
de
gree
s
Hyd
rolo
gic
Uni
t Cod
e
Wel
l de
pth,
in
feet
Site
ty
pe
IA-0
705
4489
10U
nkno
wn
Trib
utar
y to
Eas
t Bra
nch
Iow
a R
iver
at
Gar
ner,
IAIo
wa
Han
cock
43.0
9222
2-9
3.59
3611
0708
0207
NA
sw
IA-0
805
4495
00Io
wa
Riv
er n
ear R
owan
, IA
Iow
aW
right
42.7
5994
4-9
3.62
1849
0708
0207
NA
sw
IA-0
905
4495
80D
itch
No.
5 n
ear G
alt,
IAIo
wa
Wrig
ht42
.676
389
-93.
5983
3307
0802
07N
Asw
IA-1
005
4512
10So
uth
Fork
Iow
a R
iver
Nor
thea
st o
f New
Pro
vide
nce,
IA
Iow
aH
ardi
n42
.314
984
-93.
1524
2507
0802
07N
Asw
IA-1
105
4514
25So
uth
Min
erva
Cre
ek a
t Cle
mon
s, IA
Iow
aM
arsh
all
42.1
1250
0-9
3.15
1944
0708
0207
NA
sw
IA-1
205
4598
00Li
ttle
Lim
e C
reek
nea
r Nor
a Sp
rings
, IA
Iow
aC
erro
Gor
do43
.103
056
-93.
0447
2207
0802
03N
Asw
IA-1
305
4630
80B
lack
Haw
k C
reek
nea
r Hol
land
, IA
Iow
aG
rund
y42
.375
000
-92.
8166
6707
0802
05N
Asw
IA-1
405
4649
25Li
ttle
Mos
quito
Cre
ek n
ear M
osco
w, IA
Iow
aM
usca
tine
41.5
3305
6-9
1.08
3611
0708
0206
NA
sw
IA-1
505
4655
00Io
wa
Riv
er a
t Wap
ello
, IA
Iow
aLo
uisa
41.1
7808
6-9
1.18
2094
0708
0209
NA
sw
IA-1
605
4723
30B
uck
Cre
ek n
ear N
ew S
haro
n, IA
Iow
aM
ahas
ka41
.480
530
-92.
5901
6107
0801
06N
Asw
IA-1
705
4733
40W
olf C
reek
nea
r Rom
e, IA
Iow
aH
enry
40.9
6224
8-9
1.71
4332
0708
0107
NA
sw
IA-1
805
4741
95W
est B
ranc
h Tr
ibut
ary
to S
uger
Cre
ek a
t La
Cre
w, IA
Iow
aLe
e40
.728
889
-91.
5658
3307
0801
04N
Asw
IA-1
905
4766
80Pr
airie
Cre
ek n
ear W
hitte
mor
e, IA
Iow
aPa
lo A
lto43
.053
611
-94.
4741
6707
1000
02N
Asw
IA-2
005
4806
10B
rush
y C
reek
nea
r Dun
com
be, I
AIo
wa
Web
ster
42.4
7555
6-9
4.01
5000
0710
0004
NA
sw
IA-2
105
4823
61W
est F
ork
Cam
p C
reek
nea
r Yet
ter,
IAIo
wa
Cal
houn
42.3
7333
3-9
4.84
2222
0710
0006
NA
sw
IA-2
205
4834
63Sp
ringb
rook
Cre
ek a
t Bag
ley,
IAIo
wa
Gut
hrie
41.7
7361
1-9
4.46
5833
0710
0007
NA
sw
IA-2
305
4858
00N
orth
Bra
nch
Nor
th R
iver
at M
cBrid
e, IA
Iow
aM
adis
on41
.424
157
-93.
9427
2707
1000
08N
Asw
IA-2
405
4877
70B
rush
Cre
ek n
ear L
ucas
, IA
Iow
aLu
cas
41.0
1861
1-9
3.50
6111
0710
0008
NA
sw
IA-2
506
4834
71R
at C
reek
nea
r Mat
lock
, IA
Iow
aLy
on43
.273
889
-95.
9375
0010
1702
04N
Asw
IA-2
606
6037
60Tr
ibut
ary
Wes
t For
k Li
ttle
Siou
x R
iver
bel
ow S
ilver
La
ke n
ear L
ake
Park
, IA
Iow
aD
icki
nson
43.4
3833
3-9
5.27
9444
1023
0003
NA
sw
IA-2
706
6053
95Lo
st Is
land
Out
let a
bove
Dic
kens
, IA
Iow
aC
lay
43.1
2666
7-9
4.99
7222
1023
0003
NA
sw
IA-2
806
6066
50B
ig C
reek
nea
r Ant
hon,
IAIo
wa
Woo
dbur
y42
.389
722
-95.
8338
8910
2300
03N
Asw
IA-2
906
8072
78Tr
ibut
ary
to W
est F
ork
Wes
t Nis
hnab
otna
Riv
er n
ear
Man
illa,
IAIo
wa
Cra
wfo
rd41
.919
167
-95.
2261
1110
2400
02N
Asw
IA-3
006
8097
75Fi
sher
Cre
ek n
ear S
hena
ndoa
h, IA
Iow
aFr
emon
t40
.740
278
-95.
4222
2210
2400
03N
Asw
IA-3
140
4327
0952
8480
106
8N40
W07
BC
AA
Iow
aFr
emon
t40
.724
166
-95.
4802
6710
2400
0365
gw
IA-3
240
4521
0952
3580
106
9N40
W26
BA
BD
Iow
aFr
emon
t40
.755
831
-95.
3997
1110
2400
0333
gw
IA-3
340
4531
0950
2050
206
9N36
W19
CD
Iow
aPa
ge40
.758
602
-95.
0349
8010
2400
0976
gw
IA-3
440
4957
0951
8350
107
0N39
W27
Iow
aPa
ge40
.832
496
-95.
3099
8810
2400
0244
.5gw
IA-3
541
0007
0953
3050
107
2N41
W27
CD
CC
Iow
aM
ills
41.0
0194
2-9
5.55
1666
1024
0002
56gw
IA-3
641
0107
0953
0000
107
2N41
W24
DA
DIo
wa
Mill
s41
.018
608
-95.
5002
7610
2400
0253
gw
Tables 1, 3–6 21Ta
ble
1.
Sele
cted
site
s in
the
Unite
d St
ates
sam
pled
for p
erch
lora
te a
naly
sis.
—Co
ntin
ued
[NA
, not
app
licab
le; s
w, su
rfac
e w
ater
; gw,
gro
undw
ater
]
Map
iden
tifi-
catio
n nu
mbe
r (fi
gs. 2
–9)
Site
num
ber
Site
nam
eSt
ate
Coun
tyLa
titud
e,
in d
ecim
al
degr
ees
Long
itude
, in
dec
imal
de
gree
s
Hyd
rolo
gic
Uni
t Cod
e
Wel
l de
pth,
in
feet
Site
ty
pe
IA-3
741
0118
0951
4400
107
2N38
W29
BA
Iow
aM
ontg
omer
y41
.021
660
-95.
2447
1410
2400
0360
gw
IA-3
841
1154
0952
5250
107
4N40
W22
AD
DB
Iow
aPo
ttaw
atta
mie
41.1
9832
8-9
5.42
3889
1024
0002
38gw
IA-3
941
1649
0955
2500
107
5N44
W22
DA
DA
Iow
aPo
ttaw
atta
mie
41.2
8027
6-9
5.88
0846
1023
0006
121
gw
IA-4
041
2117
0923
9230
107
6N16
W25
CB
DA
Iow
aM
ahas
ka41
.354
727
-92.
6565
8107
0801
0550
gw
IA-4
141
2812
0953
2270
107
7N41
W15
AC
DD
Iow
aPo
ttaw
atta
mie
41.4
6999
2-9
5.54
1116
1024
0001
48gw
IA-4
241
3031
0932
8550
107
7N23
W03
AA
AA
Iow
aW
arre
n41
.508
601
-93.
4821
5807
1000
0843
gw
IA-4
341
3132
0943
0420
207
8N32
W27
AD
DC
Iow
aG
uthr
ie41
.525
543
-94.
5119
1507
1000
0834
gw
IA-4
441
3342
0934
3280
107
8N25
W15
CA
AC
Iow
aPo
lk41
.561
656
-93.
7241
1007
1000
0642
gw
IA-4
541
3743
0950
4120
107
9N36
W29
BB
CA
Iow
aA
udub
on41
.628
599
-95.
0702
6910
2400
0338
gw
IA-4
641
3744
0935
9550
107
9N27
W28
BA
AA
Iow
aD
alla
s41
.628
877
-93.
9988
4107
1000
0644
.5gw
IA-4
741
3907
0930
7020
107
9N20
W13
AD
DD
Iow
aJa
sper
41.6
5193
5-9
3.11
7423
0708
0105
52gw
IA-4
841
3943
0954
5360
107
9N42
W08
DC
CB
Iow
aH
arris
on41
.661
934
-95.
7602
8610
2300
0755
gw
IA-4
941
4024
0931
5390
107
9N21
W11
AB
BB
045
10Io
wa
Jasp
er41
.673
322
-93.
2610
3907
0801
0547
gw
IA-5
041
4029
0931
4560
107
9N21
W01
CC
CA
Iow
aJa
sper
41.6
7471
1-9
3.24
9094
0708
0105
57gw
IA-5
141
4251
0925
4170
108
0N18
W26
AA
DC
Iow
aJa
sper
41.7
1415
9-9
2.90
3805
0708
0106
36gw
IA-5
241
4315
0945
2420
108
0N35
W24
CB
CC
Iow
aA
udub
on41
.720
820
-94.
8785
9610
2400
0334
.5gw
IA-5
341
4933
0952
0180
208
1N39
W13
CA
CB
Iow
aSh
elby
41.8
2582
1-9
5.33
8609
1024
0002
50gw
IA-5
441
5055
0941
3120
108
1N29
W10
BB
BA
031
47Io
wa
Dal
las
41.8
4859
6-9
4.22
0239
0710
0006
22gw
IA-5
541
5435
0944
9280
108
2N34
W17
DD
BA
218
82Io
wa
Car
roll
41.9
0970
8-9
4.82
4706
0710
0007
45gw
IA-5
641
5442
0921
8020
108
2N13
W13
DA
CB
Iow
aTa
ma
41.9
1166
3-9
2.30
0741
0708
0208
37gw
IA-5
741
5949
0914
0490
108
3N07
W17
DA
CD
Iow
aLi
nn41
.996
944
-91.
6804
5807
0802
0572
gw
IA-5
842
0156
0935
6240
208
3N27
W01
AB
CC
Iow
aB
oone
42.0
3220
5-9
3.94
0230
0710
0004
74gw
IA-5
942
0453
0935
6140
108
4N27
W13
DC
AA
Iow
aB
oone
42.0
8137
0-9
3.93
7452
0710
0004
55.8
gw
IA-6
042
0607
0925
9450
108
4N18
W07
BC
AD
Iow
aM
arsh
all
42.1
0193
1-9
2.99
5478
0708
0208
25gw
IA-6
142
3138
0903
8360
108
9N03
E18A
AD
B 0
7468
Iow
aD
ubuq
ue42
.527
224
-90.
6434
6107
0600
0519
6gw
IA-6
242
4312
0931
3520
109
1N20
W05
DB
CC
401
14Io
wa
Fran
klin
42.7
0886
3-9
3.23
1313
0708
0204
44gw
IA-6
342
4838
0961
6100
109
2N46
W03
CC
AB
Iow
aPl
ymou
th42
.810
546
-96.
2697
4710
2300
0232
gw
IA-6
442
4921
0963
3470
109
3N48
W31
CC
DD
Iow
aPl
ymou
th42
.822
493
-96.
5633
6610
1702
0347
gw
IA-6
542
5940
0962
9450
109
4N48
W03
AB
DA
Iow
aSi
oux
42.9
9443
3-9
6.49
6142
1017
0203
37.5
gw
IA-6
643
0923
0951
1450
109
6N37
W03
DD
CC
Iow
aC
lay
43.1
5635
8-9
5.19
6108
1023
0003
39gw
IA-6
743
1816
0914
7440
109
8N08
W16
CA
BD
Iow
aW
inne
shie
k43
.304
417
-91.
7957
1007
0600
0267
gw
IA-6
843
2314
0953
2000
109
9N40
W14
DC
CC
Iow
aO
sceo
la43
.387
190
-95.
5336
1910
2300
0334
gw
IL-0
105
5255
00Su
gar C
reek
at M
ilfor
d, IL
Illin
ois
Iroq
uois
40.6
3003
6-8
7.72
3918
0712
0002
NA
sw
22 Perchlorate Data for Streams and Groundwater in Selected Areas of the United States, 2004Ta
ble
1.
Sele
cted
site
s in
the
Unite
d St
ates
sam
pled
for p
erch
lora
te a
naly
sis.
—Co
ntin
ued
[NA
, not
app
licab
le; s
w, su
rfac
e w
ater
; gw,
gro
undw
ater
]
Map
iden
tifi-
catio
n nu
mbe
r (fi
gs. 2
–9)
Site
num
ber
Site
nam
eSt
ate
Coun
tyLa
titud
e,
in d
ecim
al
degr
ees
Long
itude
, in
dec
imal
de
gree
s
Hyd
rolo
gic
Uni
t Cod
e
Wel
l de
pth,
in
feet
Site
ty
pe
IL-0
205
5720
00Sa
ngam
on R
iver
at M
ontic
ello
, IL
Illin
ois
Piat
t40
.030
867
-88.
5889
5407
1300
06N
Asw
IL-0
303
3821
25Li
ttle
Salin
e R
iver
nea
r Car
rier M
ills,
ILIll
inoi
sSa
line
37.6
3754
9-8
8.62
5887
0514
0204
NA
sw
IL-0
405
5952
10R
ockh
ouse
Cre
ek n
ear H
ecke
r, IL
Illin
ois
Mon
roe
38.2
8671
8-9
0.05
0942
0714
0204
NA
sw
IL-0
503
3806
00Fo
urm
ile C
reek
nea
r Way
ne C
ity, I
LIll
inoi
sW
ayne
38.3
1472
2-8
8.54
0556
0512
0115
NA
sw
IL-0
603
3465
65R
acco
on C
reek
Trib
utar
y ne
ar P
eter
sbur
g, IL
Illin
ois
Law
renc
e38
.585
048
-87.
7780
8505
1201
13N
Asw
IL-0
705
5927
60R
acco
on C
reek
nea
r Mul
berr
y G
rove
, IL
Illin
ois
Faye
tte38
.924
213
-89.
2339
6107
1402
02N
Asw
IL-0
803
3444
35Is
land
Cre
ek n
ear W
oodb
ury,
ILIll
inoi
sC
umbe
rland
39.1
7972
2-8
8.27
8333
0512
0112
NA
sw
IL-0
905
5865
97C
oate
s Cre
ek n
ear B
erda
n, IL
Illin
ois
Gre
ene
39.3
4416
7-9
0.46
8333
0713
0011
NA
sw
IL-1
005
5750
30W
illow
Cre
ek n
ear M
orris
onvi
lle, I
LIll
inoi
sC
hris
tian
39.4
1060
5-8
9.43
5648
0713
0007
NA
sw
IL-1
105
5732
00B
ig C
reek
Trib
utar
y ne
ar M
t. Zi
on, I
LIll
inoi
sM
acon
39.7
8336
9-8
8.83
7573
0713
0006
NA
sw
IL-1
205
5719
50C
amp
Cre
ek T
ribut
ary
near
Whi
te H
eath
, IL
Illin
ois
Piat
t40
.047
811
-88.
4845
0507
1300
06N
Asw
IL-1
305
5847
90C
edar
Cre
ek n
ear C
amde
n, IL
Illin
ois
Schu
yler
40.1
7027
8-9
0.76
1389
0713
0010
NA
sw
IL-1
403
3367
90U
pper
Sal
t For
k Tr
ibut
ary
near
Ran
toul
, IL
Illin
ois
Cha
mpa
ign
40.2
6975
6-8
8.10
2542
0512
0109
NA
sw
IL-1
505
4160
50Sm
allp
ox C
reek
at A
itken
, IL
Illin
ois
Jo D
avie
ss42
.348
889
-90.
4102
7807
0600
05N
Asw
IN-0
104
1780
00St
. Jos
eph
Riv
er n
ear N
ewvi
lle, I
NIn
dian
aD
eKal
b41
.385
606
-84.
8016
2604
1000
03N
Asw
IN-0
238
4113
0864
2540
1B
eave
r Cre
ek n
ear H
uron
, IN
Indi
ana
Mar
tin38
.686
817
-86.
7150
8905
1202
08N
Asw
IN-0
339
0020
0860
0080
1C
oole
y C
reek
nea
r Sey
mou
r, IN
Indi
ana
Jack
son
39.0
0564
7-8
6.00
2322
0512
0206
NA
sw
IN-0
439
1014
0864
8450
1Li
ck C
reek
nea
r Fre
edom
, IN
Indi
ana
Ow
en39
.170
572
-86.
8125
0805
1202
02N
Asw
IN-0
539
1740
0850
5570
1Pi
pe C
reek
nea
r Pen
ntow
n, IN
Indi
ana
Rip
ley
39.2
9432
2-8
5.09
9058
0508
0003
NA
sw
IN-0
639
2007
0871
4020
1B
ig S
loug
h ne
ar R
iley,
INIn
dian
aC
lay
39.3
3514
4-8
7.23
3992
0512
0203
NA
sw
IN-0
739
4024
0870
5090
1R
ock
Fork
nea
r Man
sfiel
d, IN
Indi
ana
Park
e39
.673
419
-87.
0858
8105
1201
08N
Asw
IN-0
839
4102
0855
3310
1Li
ttle
Suga
r Cre
ek n
ear N
ew P
ales
tine,
INIn
dian
aSh
elby
39.6
8390
0-8
5.89
2000
0512
0204
NA
sw
IN-0
940
0101
0861
7250
1M
ount
s Run
nea
r Zio
nsvi
lle, I
NIn
dian
aB
oone
40.0
1691
1-8
6.29
0400
0512
0201
NA
sw
IN-1
040
1510
0855
0250
1Li
ttle
Duc
k C
reek
nea
r Elw
ood,
INIn
dian
aM
adis
on40
.252
750
-85.
8402
3905
1202
01N
Asw
IN-1
140
1722
0845
1320
1M
issi
ssin
ewa
Riv
er n
ear U
nion
City
, IN
Indi
ana
Ran
dolp
h40
.289
433
-84.
8587
5005
1201
03N
Asw
IN-1
240
3748
0871
0130
1O
wen
s Ditc
h ne
ar F
owle
r, IN
Indi
ana
Ben
ton
40.6
3013
3-8
7.17
0317
0512
0108
NA
sw
IN-1
341
0823
0845
5110
1W
ilbur
Ditc
h ne
ar F
ort W
ayne
, IN
Indi
ana
Alle
n41
.139
750
-84.
9196
6904
1000
05N
Asw
IN-1
441
2215
0870
4280
1C
obb
Ditc
h ne
ar K
outs
, IN
Indi
ana
Porte
r41
.370
800
-87.
0743
3107
1200
01N
Asw
IN-1
541
4241
0860
3010
1C
obus
Cre
ek n
ear E
lkha
rt, IN
Indi
ana
Elkh
art
41.7
1148
1-8
6.05
0200
0405
0001
NA
sw
MI-
0104
1015
31O
sbor
n D
rain
nea
r Gle
nwoo
d, M
IM
ichi
gan
Cas
s42
.065
599
-86.
0750
1404
0500
01N
Asw
MI-
0204
1027
26B
utte
rnut
Cre
ek n
ear S
outh
Hav
en, M
IM
ichi
gan
Van
Bur
en42
.411
698
-86.
2161
4004
0500
02N
Asw
MI-
0304
1158
51Li
ttle
Libh
art C
reek
nea
r Lyo
ns, M
IM
ichi
gan
Ioni
a42
.958
644
-84.
9661
1204
0500
06N
Asw
MI-
0404
1160
23B
ella
my
Cre
ek n
ear I
onia
, MI
Mic
higa
nIo
nia
42.9
9419
9-8
5.11
3619
0405
0006
NA
sw
Tables 1, 3–6 23Ta
ble
1.
Sele
cted
site
s in
the
Unite
d St
ates
sam
pled
for p
erch
lora
te a
naly
sis.
—Co
ntin
ued
[NA
, not
app
licab
le; s
w, su
rfac
e w
ater
; gw,
gro
undw
ater
]
Map
iden
tifi-
catio
n nu
mbe
r (fi
gs. 2
–9)
Site
num
ber
Site
nam
eSt
ate
Coun
tyLa
titud
e,
in d
ecim
al
degr
ees
Long
itude
, in
dec
imal
de
gree
s
Hyd
rolo
gic
Uni
t Cod
e
Wel
l de
pth,
in
feet
Site
ty
pe
MI-
0504
1167
34Li
ttle
Thor
napp
le R
iver
nea
r Gre
sham
, MI
Mic
higa
nEa
ton
42.6
5170
3-8
4.87
2768
0405
0007
NA
sw
MI-
0604
1174
48C
edar
Cre
ek n
ear Q
uim
by, M
IM
ichi
gan
Bar
ry42
.600
869
-85.
2416
7104
0500
07N
Asw
MI-
0704
1505
92So
uth
Bra
nch
Whi
te C
reek
nea
r Def
ord,
MI
Mic
higa
nTu
scol
a43
.504
465
-83.
2463
3604
0802
05N
Asw
MI-
0804
1770
85La
ird C
reek
nea
r Wal
dron
, MI
Mic
higa
nH
illsd
ale
41.7
1310
6-8
4.49
8838
0410
0003
NA
sw
MN
-01
0528
8705
Shin
gle
Cre
ek a
t Que
en A
venu
e in
Min
neap
olis
, MN
Min
neso
taH
enne
pin
45.0
4996
5-9
3.31
0227
0701
0206
NA
sw
MN
-02
0531
6983
Cou
nty
Ditc
h 24
nea
r Cle
men
ts, M
NM
inne
sota
Red
woo
d44
.341
944
-94.
9983
3307
0200
08N
Asw
MN
-03
0531
8283
Judi
cial
Ditc
h 85
nea
r Will
ow C
reek
, MN
Min
neso
taB
lue
Earth
43.8
9000
0-9
4.28
9167
0702
0009
NA
sw
MN
-04
0532
0270
Littl
e C
obb
Riv
er n
ear B
eauf
ord,
MN
Min
neso
taB
lue
Earth
43.9
9663
3-9
3.90
8563
0702
0011
NA
sw
MN
-05
0532
5580
Che
rry
Cre
ek n
ear O
ttaw
a, M
NM
inne
sota
Le S
ueur
44.3
5774
4-9
3.90
9126
0702
0007
NA
sw
MN
-06
0532
9898
Silv
er C
reek
nea
r Eas
t Uni
on, M
NM
inne
sota
Car
ver
44.6
9138
9-9
3.73
7222
0702
0012
NA
sw
MN
-07
0533
1580
Mis
siss
ippi
rive
r bel
ow L
&D
#2
at H
astin
gs, M
NM
inne
sota
Dak
ota
44.7
4663
4-9
2.85
2427
0701
0206
NA
sw
MN
-08
0533
9721
Rus
h C
reek
abo
ve M
outh
nea
r Rus
h C
ity, M
NM
inne
sota
Chi
sago
45.6
5611
1-9
2.89
0278
0703
0005
NA
sw
MN
-09
0535
1400
Dev
il C
reek
nea
r Mor
risto
wn,
MN
Min
neso
taR
ice
44.2
5413
0-9
3.46
8000
0704
0002
NA
sw
MN
-10
0535
5307
Wel
ls C
reek
nea
r Bel
vide
re M
ills,
MN
Min
neso
taG
oodh
ue44
.457
778
-92.
4772
2207
0400
01N
Asw
MN
-11
0537
7508
Trou
t Cre
ek n
ear W
eave
r, M
NM
inne
sota
Wab
asha
44.2
0055
6-9
1.94
4444
0704
0003
NA
sw
MN
-12
0537
7550
Dee
ring
Valle
y C
reek
nea
r Whi
tman
, MN
Min
neso
taW
inon
a44
.134
167
-91.
7886
1107
0400
03N
Asw
MN
-13
0538
4110
Dus
chee
Cre
ek a
bove
Lan
esbo
ro, M
NM
inne
sota
Fillm
ore
43.6
9944
4-9
1.99
0000
0704
0008
NA
sw
MO
-01
0549
5850
Wya
cond
a R
iver
nea
r Lur
ay, M
OM
isso
uri
Cla
rk40
.415
872
-91.
8698
9307
1100
01N
Asw
MO
-02
0550
2005
Bea
r Cre
ek a
t 29t
h St
reet
at H
anni
bal,
MO
Mis
sour
iR
alls
39.6
8476
8-9
1.38
8205
0711
0004
NA
sw
MT-
0106
3063
00To
ngue
Riv
er a
t Sta
te L
ine
near
Dec
ker,
MT
Mon
tana
Big
Hor
n45
.008
863
-106
.836
178
1009
0101
NA
sw
NE-
0106
8000
00M
aple
Cre
ek n
ear N
icke
rson
, NE
Neb
rask
aD
odge
41.5
6027
8-9
6.54
0833
1022
0003
NA
sw
NE-
0206
8005
00El
khor
n R
iver
at W
ater
loo,
NE
Neb
rask
aD
ougl
as41
.293
333
-96.
2838
8910
2200
03N
Asw
NE-
0306
8055
00Pl
atte
Riv
er a
t Lou
isvi
lle, N
EN
ebra
ska
Sarp
y41
.015
278
-96.
1577
7810
2002
02N
Asw
NE-
0440
0757
0983
2540
12N
11W
15C
DD
D1
Neb
rask
aW
ebst
er40
.132
556
-98.
5482
7810
2500
1611
8.3
gw
NE-
0540
1329
0974
4450
13N
4W
15D
AD
A1
Neb
rask
aTh
ayer
40.2
2472
2-9
7.74
5833
1027
0206
58.4
7gw
NE-
0640
1715
0970
8360
14N
2E2
5AD
AA
1N
ebra
ska
Jeffe
rson
40.2
8750
0-9
7.14
3333
1027
0202
128.
5gw
NE-
0740
1853
0975
5010
14N
5W
18D
AA
A1
Neb
rask
aN
ucko
lls40
.314
722
-97.
9169
4410
2702
0611
2.4
gw
NE-
0840
1918
0971
9530
14N
1E
8DD
DD
1N
ebra
ska
Jeffe
rson
40.3
2166
7-9
7.33
1389
1027
0207
128.
38gw
NE-
0940
2103
0974
0420
15N
3W
32D
CD
C1
Neb
rask
aFi
llmor
e40
.350
833
-97.
6783
3310
2702
0610
8.79
gw
NE-
1040
2154
0985
1260
15N
14W
26D
DD
D1
Neb
rask
aK
earn
ey40
.365
000
-98.
8572
2210
2702
0615
8.43
gw
NE-
1140
2708
0985
3490
16N
14W
28D
DC
D1
Neb
rask
aK
earn
ey40
.452
222
-98.
8969
4410
2702
0612
9.39
gw
NE-
1240
2943
0982
8480
16N
10W
7D
DD
C1
Neb
rask
aA
dam
s40
.495
500
-98.
4798
0610
2702
0611
8.53
gw
NE-
1340
3314
0975
3280
17N
5W
21C
DA
D1
Neb
rask
aC
lay
40.5
5580
6-9
7.89
1222
1027
0203
118.
5gw
24 Perchlorate Data for Streams and Groundwater in Selected Areas of the United States, 2004Ta
ble
1.
Sele
cted
site
s in
the
Unite
d St
ates
sam
pled
for p
erch
lora
te a
naly
sis.
—Co
ntin
ued
[NA
, not
app
licab
le; s
w, su
rfac
e w
ater
; gw,
gro
undw
ater
]
Map
iden
tifi-
catio
n nu
mbe
r (fi
gs. 2
–9)
Site
num
ber
Site
nam
eSt
ate
Coun
tyLa
titud
e,
in d
ecim
al
degr
ees
Long
itude
, in
dec
imal
de
gree
s
Hyd
rolo
gic
Uni
t Cod
e
Wel
l de
pth,
in
feet
Site
ty
pe
NE-
1440
3330
0985
4510
17N
14W
20D
AD
A1
Neb
rask
aK
earn
ey40
.558
333
-98.
9141
6710
2702
0677
.37
gw
NE-
1540
3502
0974
6010
17N
4W
10C
CC
B1
Neb
rask
aFi
llmor
e40
.583
889
-97.
7669
4410
2702
0412
3.5
gw
NE-
1640
3520
0970
1390
17N
3E1
2AD
DD
1N
ebra
ska
Salin
e40
.588
889
-97.
0275
0010
2702
0411
4gw
NE-
1740
3759
0971
3010
18N
2E2
9AD
DD
1N
ebra
ska
Salin
e40
.633
056
-97.
2169
4410
2702
0411
3.57
gw
NE-
1840
4010
0961
3010
1W
olf C
reek
nea
r Syr
acus
e, N
EN
ebra
ska
Oto
e40
.669
500
-96.
2170
2810
2400
06N
Asw
NE-
1940
4020
0980
5240
18N
7W
10D
DA
A1
Neb
rask
aC
lay
40.6
7222
2-9
8.09
0000
1027
0203
118.
21gw
NE-
2040
4117
0972
5330
18N
1W
4D
AD
D1
Neb
rask
aFi
llmor
e40
.688
056
-97.
4258
3310
2702
0310
0.71
gw
NE-
2140
4445
0973
2220
19N
2W
15C
BC
C1
Neb
rask
aYo
rk40
.745
833
-97.
5394
4410
2702
0353
.63
gw
NE-
2240
4525
0975
1510
19N
5W
10D
DD
D1
Neb
rask
aH
amilt
on40
.756
944
-97.
8641
6710
2702
0310
6.5
gw
NE-
2340
5047
0981
3320
110
N 8
W10
CC
BB
1N
ebra
ska
Ham
ilton
40.8
4638
9-9
8.22
5556
1027
0203
92.3
9gw
NE-
2440
5131
0973
5140
110
N 2
W 6
DC
CC
1 O
FPS-
38N
ebra
ska
York
40.8
5890
0-9
7.58
7551
1027
0203
43gw
NE-
2540
5134
0973
5530
110
N 3
W 1
DD
AD
1 F
P2-4
3N
ebra
ska
York
40.8
5944
4-9
7.59
8056
1027
0203
48.1
gw
NE-
2640
5146
0973
5300
110
N 2
W 6
CA
BB
1 F
P3-3
3N
ebra
ska
York
40.8
6277
8-9
7.59
1667
1027
0203
37.6
1gw
NE-
2740
5147
0973
5400
110
N 2
W 6
CB
DB
1 U
WT1
-53
Neb
rask
aYo
rk40
.863
056
-97.
5944
4410
2702
0358
.83
gw
NE-
2840
5149
0973
6100
110
N 3
W 1
DA
CC
1 U
WT2
-23
Neb
rask
aYo
rk40
.863
611
-97.
6027
7810
2702
0328
.6gw
NE-
2940
5151
0973
5090
110
N 2
W 6
DB
BD
1 O
FPN
-88
Neb
rask
aYo
rk40
.864
167
-97.
5858
3310
2702
0393
.27
gw
NE-
3040
5200
0973
5510
110
N 2
W 6
BC
CB
1 U
WT3
-34
Neb
rask
aYo
rk40
.866
667
-97.
5975
0010
2702
0338
.57
gw
NE-
3140
5205
0973
6170
110
N 3
W 1
BD
A1
FP4
-28
Neb
rask
aYo
rk40
.868
000
-97.
6046
6710
2702
0333
.25
gw
NE-
3240
5207
0973
4550
110
N 2
W 6
AD
BB
1 U
WT4
-85
Neb
rask
aYo
rk40
.868
611
-97.
5819
4410
2702
0393
.5gw
NE-
3340
5212
0971
1000
211
N 2
E26C
CB
B2
FP3
-105
Neb
rask
aSe
war
d40
.890
658
-97.
1773
8310
2702
0210
5gw
NE-
3440
5212
0971
1000
311
N 2
E26C
CB
B3
FP3
-125
Neb
rask
aSe
war
d40
.890
658
-97.
1773
8310
2702
0212
5gw
NE-
3540
5216
0973
6430
110
N 3
W 1
BB
A1
NW
T1-3
9N
ebra
ska
York
40.8
7111
1-9
7.61
1944
1027
0203
43.5
gw
NE-
3640
5224
0973
8220
110
N 3
W 2
CB
BD
1 F
P5-4
5N
ebra
ska
York
40.8
7333
3-9
7.63
9444
1027
0203
50.7
7gw
NE-
3740
5224
0974
1440
111
N 3
W31
DD
CD
1N
ebra
ska
York
40.8
7333
3-9
7.69
5556
1027
0203
98.2
3gw
NE-
3840
5304
0971
0390
111
N 2
E34A
AD
A1
Neb
rask
aSe
war
d40
.884
444
-97.
1775
0010
2702
0210
2.2
gw
NE-
3940
5313
0973
9020
111
N 3
W34
BB
A1
AW
T3-7
3N
ebra
ska
York
40.8
8694
4-9
7.65
0556
1027
0203
78.7
4gw
NE-
4040
5314
0973
7320
111
N 3
W26
DC
C1
AW
T1-8
3N
ebra
ska
York
40.8
8722
2-9
7.62
5556
1027
0203
88.8
6gw
NE-
4140
5330
0971
1000
211
N 2
E23C
CB
B2
FP2
-105
Neb
rask
aSe
war
d40
.904
561
-97.
1771
3310
2702
0110
0gw
NE-
4240
5330
0971
1000
311
N 2
E23C
CB
B3
FP2
-125
Neb
rask
aSe
war
d40
.904
561
-97.
1771
3310
2702
0112
5gw
NE-
4340
5340
0970
9450
111
N 2
E26A
DC
C1
FP1
-90
Neb
rask
aSe
war
d40
.894
572
-97.
1623
6110
2702
0189
gw
NE-
4440
5340
0970
9450
211
N 2
E26A
DC
C2
FP1
-105
Neb
rask
aSe
war
d40
.894
572
-97.
1623
6110
2702
0110
5gw
NE-
4540
5340
0970
9450
311
N 2
E26A
DC
C3
FP1
-123
Neb
rask
aSe
war
d40
.894
572
-97.
1623
6110
2702
0112
0gw
NE-
4640
5353
0975
7260
111
N 6
W25
BA
CC
1N
ebra
ska
Ham
ilton
40.8
9805
6-9
7.95
7222
1027
0201
114.
07gw
Tables 1, 3–6 25Ta
ble
1.
Sele
cted
site
s in
the
Unite
d St
ates
sam
pled
for p
erch
lora
te a
naly
sis.
—Co
ntin
ued
[NA
, not
app
licab
le; s
w, su
rfac
e w
ater
; gw,
gro
undw
ater
]
Map
iden
tifi-
catio
n nu
mbe
r (fi
gs.
2–9)
Site
num
ber
Site
nam
eSt
ate
Coun
tyLa
titud
e,
in d
ecim
al
degr
ees
Long
itude
, in
dec
imal
de
gree
s
Hyd
rolo
gic
Uni
t Cod
e
Wel
l de
pth,
in
feet
Site
ty
pe
NE-
4740
5406
0974
0560
111
N 3
W20
DC
C1
AW
T2-7
1N
ebra
ska
York
40.9
0166
7-9
7.68
2222
1027
0203
76.7
7gw
NE-
4840
5420
0971
1400
211
N 2
E22C
BB
B2
FP4
-105
Neb
rask
aSe
war
d40
.908
911
-97.
1961
1710
2702
0110
5gw
NE-
4940
5420
0971
1400
311
N 2
E22C
BB
B3
FP4
-129
Neb
rask
aSe
war
d40
.908
911
-97.
1961
1710
2702
0112
9gw
NE-
5041
0247
0975
3360
112
N 5
W 4
BA
AA
1N
ebra
ska
Ham
ilton
41.0
4638
9-9
7.89
3333
1027
0201
122.
5gw
NE-
5141
0251
1020
2420
1SB
0120
4232
CD
DN
ebra
ska
Kei
th41
.047
556
-102
.044
861
1019
0018
22gw
NE-
5241
0410
0972
2060
113
N 1
W25
DA
AD
1N
ebra
ska
But
ler
41.0
6716
7-9
7.36
8667
1027
0201
116.
47gw
NE-
5341
0520
0973
4450
113
N 2
W20
BB
BC
1N
ebra
ska
Polk
41.0
8888
9-9
7.57
9167
1027
0201
93.5
7gw
NE-
5441
0552
0972
2050
113
N 1
E18B
CC
C1
Neb
rask
aB
utle
r41
.097
778
-97.
3680
5610
2702
0198
.5gw
NE-
5541
0710
0974
5420
113
N 4
W10
BA
AA
1N
ebra
ska
Polk
41.1
1944
4-9
7.76
1667
1027
0201
114.
1gw
NE-
5641
1256
0973
0110
114
N 2
W 2
AD
DA
1N
ebra
ska
Polk
41.2
1555
6-9
7.50
3056
1027
0201
133.
5gw
NE-
5741
1636
0963
7290
1D
uck
Cre
ek n
ear C
olon
, NE
Neb
rask
aSa
unde
rs41
.276
639
-96.
6247
7810
2002
03N
Asw
NE-
5841
3334
0963
2530
118
N 8
W 5
DB
AB
1 N
AWQ
A W
ELL
AC
TFS1
-1A
Neb
rask
aD
odge
41.5
5958
3-9
6.54
8083
1022
0003
79gw
NE-
5941
3334
0963
2530
218
N 8
W 5
DB
AB
2 N
AWQ
A W
ELL
AC
TFS1
-1B
Neb
rask
aD
odge
41.5
5958
3-9
6.54
8083
1022
0003
91gw
NE-
6041
3334
0963
2530
318
N 8
W 5
DB
AB
3 N
AWQ
A W
ELL
AC
TFS1
-1C
Neb
rask
aD
odge
41.5
5958
3-9
6.54
8083
1022
0003
103.
5gw
NE-
6141
3340
0964
0270
118
N 7
E 6B
CC
C1
CN
BR
LUSC
R1
DO
-24
Neb
rask
aD
odge
41.5
6108
3-9
6.67
4250
1022
0003
24.5
gw
NE-
6241
3341
0963
2550
118
N 8
W 5
AC
DC
1 N
AWQ
A W
ELL
AC
TFS1
-2A
Neb
rask
aD
odge
41.5
6138
9-9
6.54
8528
1022
0003
81.1
gw
NE-
6341
3341
0963
2550
218
N 8
W 5
AC
DC
2 N
AWQ
A W
ELL
AC
TFS1
-2B
Neb
rask
aD
odge
41.5
6138
9-9
6.54
8528
1022
0003
94gw
NE-
6441
3341
0963
2550
318
N 8
W 5
AC
DC
3 N
AWQ
A W
ELL
AC
TFS1
-2C
Neb
rask
aD
odge
41.5
6138
9-9
6.54
8528
1022
0003
104.
5gw
NE-
6541
3348
0963
2480
118
N 8
W 5
AC
AC
1 N
AWQ
A W
ELL
AC
TFS1
-3A
Neb
rask
aD
odge
41.5
6325
0-9
6.54
6778
1022
0003
60gw
NE-
6641
3348
0963
2480
218
N 8
W 5
AC
AC
2 N
AWQ
A W
ELL
AC
TFS1
-3B
Neb
rask
aD
odge
41.5
6325
0-9
6.54
6778
1022
0003
71.1
gw
NE-
6741
3348
0963
2480
318
N 8
W 5
AC
AC
3 N
AWQ
A W
ELL
AC
TFS1
-3C
Neb
rask
aD
odge
41.5
6325
0-9
6.54
6778
1022
0003
83gw
NE-
6841
3350
0963
2470
118
N 8
W 5
AB
DD
1 N
AWQ
A W
ELL
AC
TFS1
-4A
Neb
rask
aD
odge
41.5
6395
3-9
6.54
6550
1022
0003
18.2
gw
NE-
6941
3350
0963
2470
218
N 8
W 5
AB
DD
2 N
AWQ
A W
ELL
AC
TFS1
-4B
Neb
rask
aD
odge
41.5
6395
6-9
6.54
6431
1022
0003
28gw
NE-
7041
3350
0963
2470
318
N 8
W 5
AB
DD
3 N
AWQ
A W
ELL
AC
TFS1
-4C
Neb
rask
aD
odge
41.5
6394
4-9
6.54
6528
1022
0003
38gw
NE-
7141
3412
1014
1450
119
N 3
8W33
DD
DA
1N
ebra
ska
Arth
ur41
.569
944
-101
.695
944
1018
0014
232
gw
NE-
7241
3850
0974
2580
119
N 3
W 6
CB
CB
1N
ebra
ska
Plat
te41
.647
222
-97.
7161
1110
2002
0119
3.06
gw
NE-
7341
4343
0965
9580
120
N 4
E 5C
CD
C1
CN
BR
LUSC
R1
CO
-13
Neb
rask
aC
olfa
x41
.728
656
-96.
9996
8310
2200
0325
gw
NE-
7441
4527
0970
9410
121
N 2
E35A
BA
A1
CN
BR
LUSC
R1
S-11
Neb
rask
aSt
anto
n41
.757
581
-97.
1614
6410
2200
0365
gw
NE-
7541
4748
1000
9090
121
N 2
5W13
AB
AA
1N
ebra
ska
Bla
ine
41.7
9688
9-1
00.1
5269
410
2100
0214
0gw
NE-
7642
0326
1022
5320
124
N 4
4W16
DB
DB
1N
ebra
ska
Sher
idan
42.0
5716
7-1
02.4
2544
410
2100
0150
gw
NE-
7742
0458
1012
7020
124
N 3
6W 2
DA
BC
1N
ebra
ska
Gra
nt42
.082
778
-101
.450
583
1021
0001
670
gw
NE-
7842
0515
1013
6390
124
N 3
7W 4
AC
BB
1N
ebra
ska
Gra
nt42
.087
611
-101
.610
889
1021
0001
100
gw
NE-
7942
0821
0993
5110
125
N 2
0W13
AD
AC
1N
ebra
ska
Roc
k42
.139
056
-99.
5862
7810
2100
0811
0gw
26 Perchlorate Data for Streams and Groundwater in Selected Areas of the United States, 2004Ta
ble
1.
Sele
cted
site
s in
the
Unite
d St
ates
sam
pled
for p
erch
lora
te a
naly
sis.
—Co
ntin
ued
[NA
, not
app
licab
le; s
w, su
rfac
e w
ater
; gw,
gro
undw
ater
]
Map
iden
tifi-
catio
n nu
mbe
r (fi
gs. 2
–9)
Site
num
ber
Site
nam
eSt
ate
Coun
tyLa
titud
e,
in d
ecim
al
degr
ees
Long
itude
, in
dec
imal
de
gree
s
Hyd
rolo
gic
Uni
t Cod
e
Wel
l de
pth,
in
feet
Site
ty
pe
NE-
8042
1317
1015
4020
126
N 3
9W19
AD
CB
1N
ebra
ska
Che
rry
42.2
2136
1-1
01.9
0050
010
2100
0190
gw
NE-
8142
2120
1021
7530
127
N 4
3W 2
AA
DB
1N
ebra
ska
Sher
idan
42.3
5563
9-1
02.2
9805
610
1500
0380
gw
NE-
8242
2138
1012
8260
128
N 3
6W36
CB
BB
1N
ebra
ska
Che
rry
42.3
6050
0-1
01.4
7388
910
2100
0680
gw
NE-
8342
2830
1014
1110
129
N 3
7W20
DC
DA
1N
ebra
ska
Che
rry
42.4
7502
8-1
01.6
8647
210
1500
0411
3gw
NE-
8442
4403
1002
5350
132
N 2
7W24
AC
BB
1N
ebra
ska
Che
rry
42.7
3427
8-1
00.4
2658
310
1500
0417
5gw
NE-
8542
5154
1003
4230
133
N 2
8W 1
BB
1N
ebra
ska
Che
rry
42.8
6497
2-1
00.5
7294
410
1500
0418
0gw
NM
-01
0827
6500
Rio
Gra
nde
belo
w T
aos J
unct
ion
Brid
ge n
ear T
aos,
NM
New
Mex
ico
Taos
36.3
2002
3-1
05.7
5445
913
0201
01N
Asw
NM
-02
0831
3000
Rio
Gra
nde
at O
tow
i Brid
ge, N
MN
ew M
exic
oSa
nta
Fe35
.874
444
-106
.141
667
1302
0101
NA
sw
NM
-03
0831
9000
Rio
Gra
nde
at S
an F
elip
e, N
MN
ew M
exic
oSa
ndov
al35
.444
444
-106
.439
444
1302
0201
NA
sw
NM
-04
0833
1000
Rio
Gra
nde
at Is
leta
, NM
New
Mex
ico
Vale
ncia
34.9
2055
6-1
06.6
7888
913
0202
03N
Asw
NM
-05
0935
5500
San
Juan
Riv
er n
ear A
rchu
leta
, NM
New
Mex
ico
San
Juan
36.8
0138
9-1
07.6
9750
014
0801
01N
Asw
NM
-06
0936
4500
Ani
mas
Riv
er a
t Far
min
gton
, NM
New
Mex
ico
San
Juan
36.7
2250
0-1
08.2
0194
414
0801
04N
Asw
NM
-07
0936
5000
San
Juan
Riv
er a
t Far
min
gton
, NM
New
Mex
ico
San
Juan
36.7
2305
6-1
08.2
2583
314
0801
05N
Asw
NM
-08
0936
8000
San
Juan
Riv
er a
t Shi
proc
k, N
MN
ew M
exic
oSa
n Ju
an36
.776
667
-108
.683
056
1408
0105
NA
sw
NV-
0109
4196
783
Las V
egas
Was
h be
low
Fla
min
go W
ash
Con
fluen
ce n
ear
Las V
egas
, NV
Nev
ada
Cla
rk36
.139
695
-115
.047
776
1501
0015
NA
sw
NV-
0210
3090
10Ea
st F
ork
Car
son
Riv
er n
ear D
ress
lerv
ille,
NV
Nev
ada
Dou
glas
38.8
7824
0-1
19.6
8934
116
0502
01N
Asw
NV-
0310
3476
99Tr
ucke
e R
iver
at C
halk
Blu
ff Tr
eatm
ent P
lant
Inta
ke n
ear
Ren
o, N
VN
evad
aW
asho
e39
.510
500
-119
.866
472
1605
0102
NA
sw
NV-
0410
3505
00Tr
ucke
e R
iver
at C
lark
, NV
Nev
ada
Stor
ey39
.565
453
-119
.486
186
1605
0102
NA
sw
OH
-01
0326
7900
Mad
Riv
er a
t St.
Paris
Pik
e at
Eag
le C
ity, O
HO
hio
Cla
rk39
.964
227
-83.
8315
9605
0800
01N
Asw
OH
-02
0418
6500
Aug
laiz
e R
iver
nea
r For
t Jen
ning
s, O
HO
hio
Putn
am40
.948
662
-84.
2660
5904
1000
07N
Asw
OH
-03
3846
4108
3201
001
Mill
Cre
ek a
t Blu
e C
reek
, OH
Ohi
oA
dam
s38
.777
917
-83.
3359
7205
0600
02N
Asw
OH
-04
3857
2808
3032
101
Cam
p C
reek
nea
r Coo
pers
ville
, OH
Ohi
oSc
ioto
38.9
5763
9-8
3.05
5972
0506
0002
NA
sw
OH
-05
3920
1908
2510
401
Littl
e W
alnu
t Cre
ek n
ear M
oore
svill
e, O
HO
hio
Ros
s39
.338
611
-82.
8512
5005
0600
02N
Asw
OH
-06
3921
5708
4465
401
Dry
For
k W
hite
wat
er R
iver
nea
r Oke
ana,
OH
Ohi
oB
utle
r39
.365
833
-84.
7818
0605
0800
03N
Asw
OH
-07
3957
0108
2030
601
Tim
ber R
un n
ear Z
anes
ville
, OH
Ohi
oM
uski
ngum
39.9
5027
8-8
2.05
1806
0504
0006
NA
sw
OH
-08
4002
0308
3155
801
Yutz
y D
itch
near
Pla
in C
ity, O
HO
hio
Mad
ison
40.0
3416
7-8
3.26
6111
0506
0001
NA
sw
OH
-09
4004
2808
2353
501
Moo
ts R
un n
ear G
ranv
ille,
OH
Ohi
oLi
ckin
g40
.074
444
-82.
5930
5605
0400
06N
Asw
OH
-10
4026
1408
2172
501
East
Bra
nch
Jello
way
Cre
ek n
ear D
anvi
lle, O
HO
hio
Kno
x40
.437
222
-82.
2902
7805
0400
03N
Asw
OH
-11
4037
0008
4065
301
Bla
ckho
of C
reek
nea
r Wap
akon
eta,
OH
Ohi
oA
ugla
ize
40.6
1652
8-8
4.11
4861
0410
0007
NA
sw
OH
-12
4052
5108
2164
801
Jero
me
Fork
nea
r Ash
land
, OH
Ohi
oA
dam
s40
.880
972
-82.
2800
0005
0400
02N
Asw
OH
-13
4119
5608
4055
401
Scho
ol C
reek
nea
r Nap
oleo
n, O
HO
hio
Hen
ry41
.332
222
-84.
0983
3304
1000
09N
Asw
OH
-14
4122
0708
3345
601
Nor
th B
ranc
h of
Por
tage
Riv
er n
ear B
owlin
g G
reen
, OH
Ohi
oW
ood
41.3
6847
2-8
3.58
2361
0410
0010
NA
sw
Tables 1, 3–6 27Ta
ble
1.
Sele
cted
site
s in
the
Unite
d St
ates
sam
pled
for p
erch
lora
te a
naly
sis.
—Co
ntin
ued
[NA
, not
app
licab
le; s
w, su
rfac
e w
ater
; gw,
gro
undw
ater
]
Map
iden
tifi-
catio
n nu
mbe
r (fi
gs. 2
–9)
Site
num
ber
Site
nam
eSt
ate
Coun
tyLa
titud
e,
in d
ecim
al
degr
ees
Long
itude
, in
dec
imal
de
gree
s
Hyd
rolo
gic
Uni
t Cod
e
Wel
l de
pth,
in
feet
Site
ty
pe
SD-0
143
1559
0963
5010
0Li
ttle
Bea
ver C
reek
nea
r Can
ton,
SD
Sout
h D
akot
aLi
ncol
n43
.266
389
-96.
5836
1110
1702
03N
Asw
SD-0
243
2947
0970
9480
0U
nnam
ed T
ribut
ary
to E
ast F
ork
Verm
illio
n R
iver
nea
r M
onro
e, S
DSo
uth
Dak
ota
Turn
er43
.496
389
-97.
1633
3310
1701
02N
Asw
SD-0
345
1003
0963
9060
0U
nnam
ed T
ribut
ary
to N
orth
For
k Ye
llow
bank
Riv
er n
ear
Milb
ank,
SD
Sout
h D
akot
aG
rnat
45.1
6750
0-9
6.65
1667
0702
0001
NA
sw
TX-0
108
1788
00Sa
lado
Cre
ek a
t Loo
p 13
at S
an A
nton
io, T
XTe
xas
Bex
ar29
.357
180
-98.
4127
9312
1003
01N
Asw
TX-0
208
1818
00Sa
n A
nton
io R
iver
nea
r Elm
endo
rf, T
XTe
xas
Bex
ar29
.222
185
-98.
3558
4612
1003
01N
Asw
TX-0
308
3640
00R
io G
rand
e at
El P
aso,
TX
Texa
sEl
Pas
o31
.802
885
-106
.540
822
1303
0102
NA
sw
WI-
0104
0706
21So
uth
Bra
nch
Oco
nto
Riv
er n
ear M
arkt
on, W
IW
isco
nsin
Oco
nto
45.1
4608
6-8
8.59
7606
0403
0104
NA
sw
WI-
0204
0720
50D
uck
Cre
ek a
t Sem
inar
y R
oad
near
One
ida,
WI
Wis
cons
inO
utag
amie
44.4
6582
2-8
8.21
8992
0403
0103
NA
sw
WI-
0304
0747
30H
untin
g R
iver
on
Cou
nty
Hig
hway
T n
ear S
umm
it La
ke,
WI
Wis
cons
inLa
ngla
de45
.373
853
-89.
0867
8104
0302
02N
Asw
WI-
0404
0780
05Tr
ibut
ary
to W
olf R
iver
nea
r Sha
wan
o, W
IW
isco
nsin
Shaw
ano
44.7
2937
5-8
8.55
5658
0403
0202
NA
sw
WI-
0504
0863
315
Ston
ey C
reek
at B
olto
nvill
e, W
IW
isco
nsin
Was
hing
ton
43.5
1794
2-8
8.08
8399
0404
0003
NA
sw
WI-
0605
3418
65Pa
rker
Cre
ek n
ear R
iver
Fal
ls, W
IW
isco
nsin
St. C
roix
44.9
2024
5-9
2.52
9917
0703
0005
NA
sw
WI-
0705
3659
62B
lack
Cre
ek n
ear F
airc
hild
, WI
Wis
cons
inC
lark
44.6
2301
7-9
0.92
1538
0705
0006
NA
sw
WI-
0805
3670
64C
ranb
erry
Cre
ek a
t Mer
idea
n, W
IW
isco
nsin
Dun
n44
.734
129
-91.
7993
3607
0500
05N
Asw
WI-
0905
3678
03Si
lver
Cre
ek n
ear A
rland
, WI
Wis
cons
inB
arro
n45
.287
850
-92.
0440
9707
0500
07N
Asw
WI-
1005
3814
41So
per C
reek
at C
atar
act,
WI
Wis
cons
inM
onro
e44
.081
353
-90.
8406
9207
0400
07N
Asw
WI-
1105
3824
15Li
ttle
La C
ross
e R
iver
nea
r Mel
vina
, WI
Wis
cons
inM
onro
e43
.827
024
-90.
7612
4407
0400
06N
Asw
WI-
1205
4041
139
Wes
t Bra
nch
Bar
aboo
Riv
er a
t Hill
sbor
o, W
IW
isco
nsin
Vern
on43
.651
446
-90.
3573
5107
0700
04N
Asw
WI-
1305
4067
125
Haw
kins
Cre
ek a
t Roc
kbrid
ge, W
IW
isco
nsin
Ric
hlan
d43
.461
368
-90.
3551
2807
0700
05N
Asw
WI-
1405
4072
17C
rook
ed C
reek
at B
osco
bel,
WI
Wis
cons
inG
rant
43.1
2248
4-9
0.71
6516
0707
0005
NA
sw
WI-
1505
4128
80R
oger
s Bra
nch
near
Lan
cast
er, W
IW
isco
nsin
Gra
nt42
.889
156
-90.
7142
9307
0600
03N
Asw
WI-
1605
4141
33Li
ttle
Plat
te R
iver
nea
r Arth
ur, W
IW
isco
nsin
Gra
nt42
.781
659
-90.
4792
9507
0600
03N
Asw
WI-
1705
4149
24G
alen
a R
iver
at J
enki
nsvi
lle, W
IW
isco
nsin
Lafa
yette
42.6
3083
3-9
0.35
9017
0706
0005
NA
sw
WI-
1805
4363
61Li
ttle
Suga
r Riv
er W
est B
ranc
h at
Mon
ticel
lo, W
IW
isco
nsin
Gre
ene
42.7
4639
4-8
9.58
5399
0709
0004
NA
sw
WY-
0106
2797
95C
row
Cre
ek a
t Mou
th a
t Pah
aska
, WY
Wyo
min
gPa
rk44
.513
278
-109
.973
519
1008
0012
NA
sw
WY-
0206
2999
80To
ngue
Riv
er a
t Mon
arch
, WY
Wyo
min
gSh
erid
an44
.900
249
-107
.020
905
1009
0101
NA
sw
WY-
0306
3057
00G
oose
Cre
ek n
ear A
cme,
WY
Wyo
min
gSh
erid
an44
.886
361
-106
.988
959
1009
0101
NA
sw
WY-
0406
3062
50Pr
airie
Dog
Cre
ek n
ear A
cme,
WY
Wyo
min
gSh
erid
an44
.983
863
-106
.839
789
1009
0101
NA
sw
28 Perchlorate Data for Streams and Groundwater in Selected Areas of the United States, 2004Ta
ble
3.
Qual
ity-a
ssur
ranc
e-qu
ality
-con
trol s
ampl
es (r
eplic
ates
) for
per
chlo
rate
reco
nnai
ssan
ce s
tudy
in s
elec
ted
area
s of
the
Unite
d St
ates
.[<
, les
s tha
n]
Map
iden
tifica
tion
num
ber (
figs.
2–9
)Si
te n
umbe
rSi
te n
ame
Sam
ple
type
Sam
ple
date
(mom
th/d
ay/
year
)
Sam
ple
time
(24
hour
)Pe
rchl
orat
e co
ncen
-tr
atio
n (μ
g/L
)
CA
-03
1107
4000
Sant
a Ana
Riv
er b
elow
Pra
do D
am, C
Aam
bien
t08
/12/
2004
1550
0.8
7
CA
-03
1107
4000
Sant
a Ana
Riv
er b
elow
Pra
do D
am, C
Are
plic
ate
08/1
2/20
0415
51<
.4
CA
-04
3239
2511
7044
001
017S
002W
27P0
02S
ambi
ent
07/1
2/20
0410
38<
.4
CA
-04
3239
2511
7044
001
017S
002W
27P0
02S
repl
icat
e07
/12/
2004
1150
< .4
CA
-08
3314
4311
7181
201
011S
004W
04K
005S
ambi
ent
07/1
4/20
0413
40<
.4
CA
-08
3314
4311
7181
201
011S
004W
04K
005S
repl
icat
e07
/14/
2004
1340
< .4
CA
-09
3316
5911
6394
701
010S
003E
27D
002S
ambi
ent
07/1
3/20
0409
20 .4
4
CA
-09
3316
5911
6394
701
010S
003E
27D
002S
repl
icat
e07
/13/
2004
0921
< .4
CA
-10
3317
0711
7223
601
010S
005W
26C
003S
ambi
ent
07/1
5/20
0410
40 .8
2
CA
-10
3317
0711
7223
601
010S
005W
26C
003S
repl
icat
e07
/15/
2004
1040
< .4
CA
-11
3320
2411
6535
701
010S
001E
05B
001S
ambi
ent
07/1
9/20
0414
10<
.4
CA
-11
3320
2411
6535
701
010S
001E
05B
001S
repl
icat
e07
/19/
2004
1410
.81
IL-1
005
5750
30W
illow
Cre
ek n
ear M
orris
onvi
lle, I
Lam
bien
t10
/20/
2004
1400
< .4
IL-1
005
5750
30W
illow
Cre
ek n
ear M
orris
onvi
lle, I
Lre
plic
ate
10/2
0/20
0414
01<
.4
IN-0
839
4102
0855
3310
1Li
ttle
Suga
r Cre
ek n
ear N
ew P
ales
tine,
INam
bien
t09
/24/
2004
0845
.41
IN-0
839
4102
0855
3310
1Li
ttle
Suga
r Cre
ek n
ear N
ew P
ales
tine,
INre
plic
ate
09/2
4/20
0408
55<
.4
IN-1
140
1722
0845
1320
1M
issi
ssin
ewa
Riv
er n
ear U
nion
City
, IN
ambi
ent
09/2
0/20
0411
00<
.4
IN-1
140
1722
0845
1320
1M
issi
ssin
ewa
Riv
er n
ear U
nion
City
, IN
repl
icat
e09
/20/
2004
1210
< .4
IN-1
541
4241
0860
3010
1C
obus
Cre
ek n
ear E
lkha
rt, IN
ambi
ent
10/2
1/20
0412
15<
.4
IN-1
541
4241
0860
3010
1C
obus
Cre
ek n
ear E
lkha
rt, IN
repl
icat
e10
/21/
2004
1245
< .4
MI-
0404
1160
23B
ella
my
Cre
ek n
ear I
onia
, MI
ambi
ent
09/1
4/20
0410
45<
.4
MI-
0404
1160
23B
ella
my
Cre
ek n
ear I
onia
, MI
repl
icat
e09
/14/
2004
1330
< .4
MN
-12
0537
7550
Dee
ring
Valle
y C
reek
nea
r Whi
tman
, MN
ambi
ent
08/1
4/20
0414
00<
.4
MN
-12
0537
7550
Dee
ring
Valle
y C
reek
nea
r Whi
tman
, MN
repl
icat
e08
/14/
2004
1406
< .4
MN
-13
0538
4110
Dus
chee
Cre
ek a
bove
Lan
esbo
ro, M
Nam
bien
t09
/02/
2004
1300
< .4
MN
-13
0538
4110
Dus
chee
Cre
ek a
bove
Lan
esbo
ro, M
Nre
plic
ate
09/0
2/20
0413
02<
.4
MO
-01
0549
5850
Wya
cond
a R
iver
nea
r Lur
ay, M
Oam
bien
t08
/16/
2004
1400
< .4
MO
-01
0549
5850
Wya
cond
a R
iver
nea
r Lur
ay, M
Ore
plic
ate
08/1
6/20
0414
01<
.4
NV-
0109
4196
783
Las V
egas
Was
h be
low
Fla
min
go W
ash
Con
fluen
ce n
ear L
as V
egas
, NV
ambi
ent
08/1
7/20
0410
30 6
.23
NV-
0109
4196
783
Las V
egas
Was
h be
low
Fla
min
go W
ash
Con
fluen
ce n
ear L
as V
egas
, NV
repl
icat
e08
/17/
2004
1040
2.7
OH
-14
4122
0708
3345
601
Nor
th B
ranc
h of
Por
tage
Riv
er n
ear B
owlin
g G
reen
, OH
ambi
ent
10/0
7/20
0408
40<
.4
OH
-14
4122
0708
3345
601
Nor
th B
ranc
h of
Por
tage
Riv
er n
ear B
owlin
g G
reen
, OH
repl
icat
e10
/07/
2004
0841
< .4
WI-
1605
4141
33Li
ttle
Plat
te R
iver
nea
r Arth
ur, W
Iam
bien
t09
/08/
2004
0710
.96
WI-
1605
4141
33Li
ttle
Plat
te R
iver
nea
r Arth
ur, W
Ire
plic
ate
09/0
8/20
0407
20<
.4
Tables 1, 3–6 29Ta
ble
4.
Perc
hlor
ate
conc
entra
tions
at s
elec
ted
surfa
ce-w
ater
and
gro
undw
ater
site
s in
the
Unite
d St
ates
.[U
SGS,
U.S
. Geo
logi
cal S
urve
y; μ
g/L,
mic
rogr
ams p
er L
iter;
sw, s
urfa
ce w
ater
; gw,
gro
undw
ater
; NAW
QA
, Nat
iona
l Wat
er Q
ualit
y A
sses
smen
t pro
gram
; CO
OP,
Fed
eral
/Sta
te c
oope
rativ
e pr
ojec
t; EP
ALI
PS,
Land
scap
e In
dica
tors
pro
ject
; SW
TREN
D, S
urfa
ce W
ater
Tre
nds n
etw
ork;
AZD
EQ, A
rizon
a D
epar
tmen
t of E
nviro
nmen
tal Q
ualit
y; G
AM
A, C
alifo
rnia
Gro
undw
ater
Am
bien
t Mon
itorin
g an
d A
sses
smen
t; R
IOG
, Rio
Gra
nde
Valle
y; U
CO
L, U
pper
Col
orad
o R
iver
Bas
in; S
PLT,
Sou
th P
latte
Riv
er B
asin
; IA
GW
M, I
owa
Gro
undw
ater
Mon
itorin
g N
etw
ork;
HPG
W, H
igh
Plai
ns R
egio
nal G
roun
d W
ater
Stu
dy;
TAN
C, T
rans
port
of A
nthr
opog
enic
and
Nat
ural
Con
tam
inan
ts S
tudy
; SEW
AR
D, C
ity o
f Sew
ard,
Neb
rask
a.; A
CT,
Agr
icul
tura
l Che
mic
al T
rans
port
stud
y; C
NB
R, C
entra
l Neb
rask
a B
asin
s; T
RIV
ER, T
ongu
e R
iver
Sur
face
-Wat
er-Q
ualit
y M
onito
ring
Net
wor
k; <
, les
s tha
n]
Map
iden
tifi-
catio
n nu
mbe
r (fi
gs. 2
–9)
Site
num
ber
Site
nam
eSi
te ty
peSa
mpl
e ty
peU
SGS
Pro-
gram
USG
S Pr
ojec
t
Sam
ple
date
(m
onth
/day
/ye
ars)
Sam
ple
time
(24
hour
)
Perc
hlor
ate
conc
entr
a-tio
n (μ
g/L)
AR
-01
0705
3250
Yocu
m C
reek
nea
r Oak
Gro
ve, A
Rsw
ambi
ent
NAW
QA
SWTR
END
07/0
7/20
0415
00 0
.68
AR
-02
0705
5646
Buf
falo
Riv
er n
ear B
oxle
y, A
Rsw
ambi
ent
NAW
QA
SWTR
END
07/0
7/20
0412
00<
.4
AR
-03
0706
0710
Nor
th S
ylam
ore
Cre
ek n
ear F
ifty
Six,
AR
swam
bien
tN
AWQ
ASW
TREN
D07
/08/
2004
0800
< .4
AR
-04
3546
3509
0365
601
13N
04E1
2AB
B1
gwam
bien
tC
OO
P09
/01/
2004
0830
.92
AZ-
0109
3800
00C
olor
ado
Riv
er a
t Lee
s Fer
ry, A
Zsw
ambi
ent
NAW
QA
09/0
7/20
0414
20<
.4
AZ-
0209
4485
00G
ila R
iver
at H
ead
of S
affo
rd V
alle
y ne
ar S
olom
on,
AZ
swam
bien
tC
OO
PA
ZDEQ
08/1
1/20
0411
15<
.4
AZ-
0309
4665
00G
ila R
iver
at C
alva
, AZ
swam
bien
tC
OO
PA
ZDEQ
08/1
2/20
0411
05<
.4
AZ-
0409
4710
00Sa
n Pe
dro
Riv
er a
t Cha
rlest
on, A
Zsw
ambi
ent
CO
OP
AZD
EQ08
/19/
2004
1325
< .4
AZ-
0509
4740
00G
ila R
iver
at K
elvi
n, A
Zsw
ambi
ent
CO
OP
AZD
EQ08
/10/
2004
1055
.6
AZ-
0609
4985
00Sa
lt R
iver
nea
r Roo
seve
lt, A
Zsw
ambi
ent
CO
OP
AZD
EQ08
/31/
2004
1115
< .4
AZ-
0709
5020
00Sa
lt R
iver
bel
ow S
tew
art M
ount
ain
Dam
, AZ
swam
bien
tC
OO
PA
ZDEQ
09/0
2/20
0410
30<
.4
AZ-
0809
5040
00Ve
rde
Riv
er n
ear C
lark
dale
, AZ
swam
bien
tC
OO
PA
ZDEQ
09/0
9/20
0407
55<
.4
AZ-
0909
5079
80Ea
st V
erde
Riv
er n
ear C
hild
s, A
Zsw
ambi
ent
CO
OP
AZD
EQ08
/27/
2004
1320
< .4
AZ-
1009
5085
00Ve
rde
Riv
er b
elow
Tan
gle
Cre
ek a
bove
Hor
sesh
oe
Dam
, AZ
swam
bien
tC
OO
PA
ZDEQ
08/1
3/20
0410
00<
.4
AZ-
1109
5100
00Ve
rde
Riv
er b
elow
Bar
tlett
Dam
, AZ
swam
bien
tC
OO
PA
ZDEQ
08/1
8/20
0410
30<
.4
CA
-01
1104
9400
Sant
a Ana
Riv
er a
bove
Sev
en O
aks D
am, C
Asw
ambi
ent
NAW
QA
SWTR
END
08/1
3/20
0413
20<
.4
CA
-02
1106
0400
War
m C
reek
nea
r San
Ber
nard
ino,
CA
swam
bien
tN
AWQ
ASW
TREN
D08
/13/
2004
0930
.71
CA
-03
1107
4000
Sant
a Ana
Riv
er b
elow
Pra
do D
am, C
Asw
ambi
ent
NAW
QA
SWTR
END
08/1
2/20
0415
50 .8
7
CA
-03
1107
4000
Sant
a Ana
Riv
er b
elow
Pra
do D
am, C
Asw
repl
icat
eN
AWQ
ASW
TREN
D08
/12/
2004
1551
< .4
CA
-04
3239
2511
7044
001
017S
002W
27P0
02S
gwam
bien
tC
OO
PG
AM
A07
/12/
2004
1038
< .4
CA
-04
3239
2511
7044
001
017S
002W
27P0
02S
gwre
plic
ate
CO
OP
GA
MA
07/1
2/20
0411
50<
.4
CA
-05
3248
4011
6584
401
016S
001W
03E0
01S
gwam
bien
tC
OO
PG
AM
A07
/12/
2004
1.9
3
CA
-06
3251
5711
6551
401
015S
001E
18L0
05S
gwam
bien
tC
OO
PG
AM
A07
/15/
2004
1030
< .4
CA
-07
3304
4711
7065
301
013S
002W
05D
001S
gwam
bien
tC
OO
PG
AM
A07
/20/
2004
1100
.45
CA
-08
3314
4311
7181
201
011S
004W
04K
005S
gwam
bien
tC
OO
PG
AM
A07
/14/
2004
1340
< .4
CA
-08
3314
4311
7181
201
011S
004W
04K
005S
gwre
plic
ate
CO
OP
GA
MA
07/1
4/20
0413
40<
.4
CA
-09
3316
5911
6394
701
010S
003E
27D
002S
gwam
bien
tC
OO
PG
AM
A07
/13/
2004
0920
.44
CA
-09
3316
5911
6394
701
010S
003E
27D
002S
gwre
plic
ate
CO
OP
GA
MA
07/1
3/20
0409
21<
.4
CA
-10
3317
0711
7223
601
010S
005W
26C
003S
gwam
bien
tC
OO
PG
AM
A07
/15/
2004
1040
.82
30 Perchlorate Data for Streams and Groundwater in Selected Areas of the United States, 2004Ta
ble
4.
Perc
hlor
ate
conc
entra
tions
at s
elec
ted
surfa
ce-w
ater
and
gro
undw
ater
site
s in
the
Unite
d St
ates
.—Co
ntin
ued
[USG
S, U
.S. G
eolo
gica
l Sur
vey;
μg/
L, m
icro
gram
s per
Lite
r; sw
, sur
face
wat
er; g
w, g
roun
dwat
er; N
AWQ
A, N
atio
nal W
ater
Qua
lity
Ass
essm
ent p
rogr
am; C
OO
P, F
eder
al/S
tate
coo
pera
tive
proj
ect;
EPA
LIPS
, La
ndsc
ape
Indi
cato
rs p
roje
ct; S
WTR
END
, Sur
face
Wat
er T
rend
s net
wor
k; A
ZDEQ
, Ariz
ona
Dep
artm
ent o
f Env
ironm
enta
l Qua
lity;
GA
MA
, Cal
iforn
ia G
roun
dwat
er A
mbi
ent M
onito
ring
and
Ass
essm
ent;
RIO
G, R
io G
rand
e Va
lley;
UC
OL,
Upp
er C
olor
ado
Riv
er B
asin
; SPL
T, S
outh
Pla
tte R
iver
Bas
in; I
AG
WM
, Iow
a G
roun
dwat
er M
onito
ring
Net
wor
k; H
PGW
, Hig
h Pl
ains
Reg
iona
l Gro
und
Wat
er S
tudy
; TA
NC
, Tr
ansp
ort o
f Ant
hrop
ogen
ic a
nd N
atur
al C
onta
min
ants
Stu
dy; S
EWA
RD
, City
of S
ewar
d, N
ebra
ska.
; AC
T, A
gric
ultu
ral C
hem
ical
Tra
nspo
rt st
udy;
CN
BR
, Cen
tral N
ebra
ska
Bas
ins;
TR
IVER
, Ton
gue
Riv
er
Surf
ace-
Wat
er-Q
ualit
y M
onito
ring
Net
wor
k; <
, les
s tha
n]
Map
iden
tifi-
catio
n nu
mbe
r (fi
gs. 2
–9)
Site
num
ber
Site
nam
eSi
te ty
peSa
mpl
e ty
peU
SGS
Pro-
gram
USG
S Pr
ojec
t
Sam
ple
date
(m
onth
/day
/ye
ar)
Sam
ple
time
(24
hour
)
Perc
hlor
ate
conc
entr
a-tio
n (μ
g/L)
CA
-10
3317
0711
7223
601
010S
005W
26C
003S
gwre
plic
ate
CO
OP
GA
MA
07/1
5/20
0410
40<
0.4
CA
-11
3320
2411
6535
701
010S
001E
05B
001S
gwam
bien
tC
OO
PG
AM
A07
/19/
2004
1410
< .4
CA
-11
3320
2411
6535
701
010S
001E
05B
001S
gwre
plic
ate
CO
OP
GA
MA
07/1
9/20
0414
10 .8
1
CO
-01
0671
3500
Che
rry
Cre
ek a
t Den
ver,
CO
swam
bien
tN
AWQ
ASW
TREN
D06
/10/
2004
1000
.63
CO
-02
0675
3990
Lone
tree
Cre
ek n
ear G
reel
ey, C
Osw
ambi
ent
NAW
QA
SWTR
END
06/0
8/20
0409
30<
.4
CO
-03
0675
4000
Sout
h Pl
atte
Riv
er n
ear K
erse
y, C
Osw
ambi
ent
NAW
QA
SWTR
END
06/0
8/20
0412
30<
.4
CO
-04
0710
3707
Foun
tain
Cre
ek b
elow
8th
Stre
et a
t Col
orad
o Sp
rings
, C
Osw
ambi
ent
CO
OP
07/2
0/20
0413
45<
.4
CO
-05
0710
6000
Foun
tain
Cre
ek n
ear F
ount
ain,
CO
swam
bien
tC
OO
P07
/21/
2004
1745
< .4
CO
-06
0710
6300
Foun
tain
Cre
ek n
ear P
inon
, CO
swam
bien
tC
OO
P07
/22/
2004
1110
< .4
CO
-07
0710
6500
Foun
tain
Cre
ek a
t Pue
blo,
CO
swam
bien
tC
OO
P07
/22/
2004
1445
< .4
CO
-08
0909
5300
Dry
For
k at
Upp
er S
tatio
n ne
ar D
e B
eque
, CO
swam
bien
tN
AWQ
ASW
TREN
D06
/02/
2004
1200
< .4
CO
-08
0909
5300
Dry
For
k at
Upp
er S
tatio
n ne
ar D
e B
eque
, CO
swam
bien
tN
AWQ
ASW
TREN
D07
/29/
2004
1135
< .4
CO
-08
0909
5300
Dry
For
k at
Upp
er S
tatio
n ne
ar D
e B
eque
, CO
swam
bien
tN
AWQ
ASW
TREN
D09
/07/
2004
1045
< .4
CO
-09
0916
3500
Col
orad
o R
iver
nea
r Col
orad
o-U
tah
Stat
e Li
nesw
ambi
ent
NAW
QA
SWTR
END
05/2
6/20
04<
.4
CO
-09
0916
3500
Col
orad
o R
iver
nea
r Col
orad
o-U
tah
Stat
e Li
nesw
ambi
ent
NAW
QA
SWTR
END
06/2
5/20
0408
05<
.4
CO
-09
0916
3500
Col
orad
o R
iver
nea
r Col
orad
o-U
tah
Stat
e Li
nesw
ambi
ent
NAW
QA
SWTR
END
07/2
8/20
04<
.4
CO
-09
0916
3500
Col
orad
o R
iver
nea
r Col
orad
o-U
tah
Stat
e Li
nesw
ambi
ent
NAW
QA
SWTR
END
08/2
6/20
0416
40<
.4
CO
-09
0916
3500
Col
orad
o R
iver
nea
r Col
orad
o-U
tah
Stat
e Li
nesw
ambi
ent
NAW
QA
SWTR
END
11/0
4/20
0409
30<
.4
CO
-10
0937
1010
San
Juan
Riv
er a
t Fou
r Cor
ners
, CO
swam
bien
tN
AWQ
ASW
TREN
D06
/30/
2004
0900
< .4
CO
-11
3709
3610
6010
501
NA
0340
0929
CB
Bgw
ambi
ent
NAW
QA
RIO
G08
/18/
2004
1415
< .4
CO
-12
3733
2310
6025
001
NA
0380
0812
AC
Agw
ambi
ent
NAW
QA
RIO
G08
/19/
2004
1100
1.1
CO
-13
3738
4910
6124
501
NA
0390
0709
AB
Bgw
ambi
ent
NAW
QA
RIO
G08
/18/
2004
0840
< .4
CO
-13
3738
4910
6124
501
NA
0390
0709
AB
Bgw
ambi
ent
NAW
QA
RIO
G08
/18/
2004
0840
< .4
CO
-13
3738
4910
6124
501
NA
0390
0709
AB
Bgw
ambi
ent
NAW
QA
RIO
G08
/18/
2004
0840
< .4
CO
-14
3750
5410
6013
401
NA
0420
0931
BA
Dgw
ambi
ent
NAW
QA
RIO
G08
/17/
2004
0940
< .4
CO
-15
3832
3210
6554
700
NB
0490
0101
BC
Bgw
ambi
ent
NAW
QA
UC
OL
05/1
7/20
0416
45<
.4
CO
-16
3852
1310
6584
700
SC01
4086
02B
CC
gwam
bien
tN
AWQ
AU
CO
L05
/18/
2004
1135
< .4
CO
-17
3922
1010
4482
901
SC00
8066
08B
CD
gwam
bien
tN
AWQ
ASP
LT07
/20/
2004
1400
3.3
2
CO
-18
3930
0310
4450
001
SC00
6066
26B
DD
gwam
bien
tN
AWQ
ASP
LT07
/20/
2004
1100
< .4
Tables 1, 3–6 31Ta
ble
4.
Perc
hlor
ate
conc
entra
tions
at s
elec
ted
surfa
ce-w
ater
and
gro
undw
ater
site
s in
the
Unite
d St
ates
.—Co
ntin
ued
[USG
S, U
.S. G
eolo
gica
l Sur
vey;
μg/
L, m
icro
gram
s per
Lite
r; sw
, sur
face
wat
er; g
w, g
roun
dwat
er; N
AWQ
A, N
atio
nal W
ater
Qua
lity
Ass
essm
ent p
rogr
am; C
OO
P, F
eder
al/S
tate
coo
pera
tive
proj
ect;
EPA
LIPS
, La
ndsc
ape
Indi
cato
rs p
roje
ct; S
WTR
END
, Sur
face
Wat
er T
rend
s net
wor
k; A
ZDEQ
, Ariz
ona
Dep
artm
ent o
f Env
ironm
enta
l Qua
lity;
GA
MA
, Cal
iforn
ia G
roun
dwat
er A
mbi
ent M
onito
ring
and
Ass
essm
ent;
RIO
G, R
io G
rand
e Va
lley;
UC
OL,
Upp
er C
olor
ado
Riv
er B
asin
; SPL
T, S
outh
Pla
tte R
iver
Bas
in; I
AG
WM
, Iow
a G
roun
dwat
er M
onito
ring
Net
wor
k; H
PGW
, Hig
h Pl
ains
Reg
iona
l Gro
und
Wat
er S
tudy
; TA
NC
, Tr
ansp
ort o
f Ant
hrop
ogen
ic a
nd N
atur
al C
onta
min
ants
Stu
dy; S
EWA
RD
, City
of S
ewar
d, N
ebra
ska.
; AC
T, A
gric
ultu
ral C
hem
ical
Tra
nspo
rt st
udy;
CN
BR
, Cen
tral N
ebra
ska
Bas
ins;
TR
IVER
, Ton
gue
Riv
er
Surf
ace-
Wat
er-Q
ualit
y M
onito
ring
Net
wor
k; <
, les
s tha
n]
Map
iden
tifi-
catio
n nu
mbe
r (fi
gs. 2
–9)
Site
num
ber
Site
nam
eSi
te ty
peSa
mpl
e ty
peU
SGS
Pro-
gram
USG
S Pr
ojec
t
Sam
ple
date
(m
onth
/day
/ye
ar)
Sam
ple
time
(24
hour
)
Perc
hlor
ate
conc
entr
a-tio
n (μ
g/L)
CO
-19
3934
0810
4544
001
SC00
5067
32D
CA
gwam
bien
tN
AWQ
ASP
LT07
/21/
2004
1050
< 0.
4
CO
-20
3934
3110
6070
801
SC00
5078
34B
CB
gwam
bien
tN
AWQ
AU
CO
L09
/08/
2004
1215
< .4
CO
-21
3937
4210
4453
801
SC00
5066
10D
BD
gwam
bien
tN
AWQ
ASP
LT07
/19/
2004
1020
4.1
9
CO
-22
3937
5810
6041
401
SC00
5078
12A
CB
gwam
bien
tN
AWQ
AU
CO
L09
/07/
2004
1240
< .4
CO
-23
3938
3010
6210
600
SC00
5080
09A
AC
gwam
bien
tN
AWQ
AU
CO
L05
/19/
2004
1330
< .4
CO
-24
3938
4610
4465
601
SC00
5066
04B
DD
gwam
bien
tN
AWQ
ASP
LT07
/19/
2004
1350
1.8
3
CO
-25
3959
2910
5510
300
SC00
1076
02D
AC
gwam
bien
tN
AWQ
AU
CO
L05
/20/
2004
1130
< .4
CO
-26
4015
4410
3443
101
SB00
3057
03B
BA
gwam
bien
tN
AWQ
ASP
LT07
/14/
2004
0920
< .4
CO
-27
4021
0410
4404
501
SB00
5065
32D
DB
gwam
bien
tN
AWQ
ASP
LT07
/15/
2004
0920
< .4
CO
-28
4021
1410
5350
101
Big
Tho
mps
on b
elow
Mor
aine
Par
k ne
ar E
stes
Par
k,
CO
swam
bien
tN
AWQ
ASW
TREN
D07
/07/
2004
1100
< .4
CO
-29
4022
1310
4015
501
SB00
5059
30C
BA
gwam
bien
tN
AWQ
ASP
LT07
/14/
2004
.64
CO
-30
4051
5910
2444
201
SB01
0048
05C
CC
gwam
bien
tN
AWQ
ASP
LT07
/13/
2004
1520
< .4
IA-0
105
3873
13U
nkno
wn
Trib
utar
y to
Bea
ver C
reek
nea
r Lim
e Sp
rings
, IA
swbl
ank
EPA
LIPS
10/2
6/20
0413
20<
.4
IA-0
105
3873
13U
nkno
wn
Trib
utar
y to
Bea
ver C
reek
nea
r Lim
e Sp
rings
, IA
swam
bien
tEP
ALI
PS10
/26/
2004
1340
.62
IA-0
205
3883
25Si
lver
Cre
ek n
ear H
anov
er, I
Asw
ambi
ent
EPA
LIPS
11/1
6/20
0414
00<
.4
IA-0
305
4115
95B
ohem
ian
Cre
ek n
ear P
rotiv
in, I
Asw
ambi
ent
EPA
LIPS
11/1
6/20
0411
15<
.4
IA-0
405
4180
80N
orth
For
k M
aquo
keta
Riv
er a
t NE
Dye
rsvi
lle, I
Asw
ambi
ent
EPA
LIPS
0838
< .4
IA-0
505
4206
80W
apsi
pini
con
Riv
er n
ear T
ripol
i, IA
swam
bien
tEP
ALI
PS/
NAW
QA
SWTR
END
08/0
3/20
0410
25<
.4
IA-0
605
4208
58U
nnam
ed C
reek
nea
r Fai
rban
k, IA
swam
bien
tEP
ALI
PS10
/21/
2004
0915
< .4
IA-0
705
4489
10U
nkno
wn
Trib
utar
y to
Eas
t Bra
nch
Iow
a R
iver
at
Gar
ner,
IAsw
ambi
ent
EPA
LIPS
10/2
0/20
0412
55 .4
IA-0
805
4495
00Io
wa
Riv
er n
ear R
owan
, IA
swam
bien
tEP
ALI
PS/
NAW
QA
SWTR
END
08/0
2/20
0415
20<
.4
IA-0
905
4495
80D
itch
No.
5 n
ear G
alt,
IAsw
ambi
ent
EPA
LIPS
10/2
0/20
0415
00 1
.12
IA-1
005
4512
10So
uth
Fork
Iow
a R
iver
Nor
thea
st o
f New
Pro
vide
nce,
IA
swam
bien
tEP
ALI
PS/
NAW
QA
SWTR
END
08/0
2/20
0410
45<
.4
IA-1
105
4514
25So
uth
Min
erva
Cre
ek a
t Cle
mon
s, IA
swam
bien
tEP
ALI
PS10
/25/
2004
1005
< .4
32 Perchlorate Data for Streams and Groundwater in Selected Areas of the United States, 2004Ta
ble
4.
Perc
hlor
ate
conc
entra
tions
at s
elec
ted
surfa
ce-w
ater
and
gro
undw
ater
site
s in
the
Unite
d St
ates
.—Co
ntin
ued
[USG
S, U
.S. G
eolo
gica
l Sur
vey;
μg/
L, m
icro
gram
s per
Lite
r; sw
, sur
face
wat
er; g
w, g
roun
dwat
er; N
AWQ
A, N
atio
nal W
ater
Qua
lity
Ass
essm
ent p
rogr
am; C
OO
P, F
eder
al/S
tate
coo
pera
tive
proj
ect;
EPA
LIPS
, La
ndsc
ape
Indi
cato
rs p
roje
ct; S
WTR
END
, Sur
face
Wat
er T
rend
s net
wor
k; A
ZDEQ
, Ariz
ona
Dep
artm
ent o
f Env
ironm
enta
l Qua
lity;
GA
MA
, Cal
iforn
ia G
roun
dwat
er A
mbi
ent M
onito
ring
and
Ass
essm
ent;
RIO
G, R
io G
rand
e Va
lley;
UC
OL,
Upp
er C
olor
ado
Riv
er B
asin
; SPL
T, S
outh
Pla
tte R
iver
Bas
in; I
AG
WM
, Iow
a G
roun
dwat
er M
onito
ring
Net
wor
k; H
PGW
, Hig
h Pl
ains
Reg
iona
l Gro
und
Wat
er S
tudy
; TA
NC
, Tr
ansp
ort o
f Ant
hrop
ogen
ic a
nd N
atur
al C
onta
min
ants
Stu
dy; S
EWA
RD
, City
of S
ewar
d, N
ebra
ska.
; AC
T, A
gric
ultu
ral C
hem
ical
Tra
nspo
rt st
udy;
CN
BR
, Cen
tral N
ebra
ska
Bas
ins;
TR
IVER
, Ton
gue
Riv
er
Surf
ace-
Wat
er-Q
ualit
y M
onito
ring
Net
wor
k; <
, les
s tha
n]
Map
iden
tifi-
catio
n nu
mbe
r (fi
gs. 2
–9)
Site
num
ber
Site
nam
eSi
te ty
peSa
mpl
e ty
peU
SGS
Pro-
gram
USG
S Pr
ojec
t
Sam
ple
date
(m
onth
/day
/ye
ar)
Sam
ple
time
(24
hour
)
Perc
hlor
ate
conc
entr
a-tio
n (μ
g/L)
IA-1
205
4598
00Li
ttle
Lim
e C
reek
nea
r Nor
a Sp
rings
, IA
swam
bien
tEP
ALI
PS10
/20/
2004
1115
< 0.
4
IA-1
305
4630
80B
lack
Haw
k C
reek
nea
r Hol
land
, IA
swam
bien
tEP
ALI
PS10
/21/
2004
< .4
IA-1
405
4649
25Li
ttle
Mos
quito
Cre
ek n
ear M
osco
w, IA
swam
bien
tEP
ALI
PS10
/01/
2004
1012
< .4
IA-1
505
4655
00Io
wa
Riv
er a
t Wap
ello
, IA
swam
bien
tN
AWQ
ASW
TREN
D08
/05/
2004
0930
< .4
IA-1
605
4723
30B
uck
Cre
ek n
ear N
ew S
haro
n, IA
swam
bien
tEP
ALI
PS10
/04/
2004
1315
< .4
IA-1
705
4733
40W
olf C
reek
nea
r Rom
e, IA
swam
bien
tEP
ALI
PS09
/30/
2004
1215
< .4
IA-1
805
4741
95W
est B
ranc
h Tr
ibut
ary
to S
uger
Cre
ek a
t La
Cre
w, IA
swam
bien
tEP
ALI
PS09
/30/
2004
1000
< .4
IA-1
905
4766
80Pr
airie
Cre
ek n
ear W
hitte
mor
e, IA
swam
bien
tEP
ALI
PS10
/26/
2004
1015
.73
IA-2
005
4806
10B
rush
y C
reek
nea
r Dun
com
be, I
Asw
ambi
ent
EPA
LIPS
10/2
5/20
0412
10 .4
1
IA-2
105
4823
61W
est F
ork
Cam
p C
reek
nea
r Yet
ter,
IAsw
ambi
ent
EPA
LIPS
10/2
5/20
0414
05<
.4
IA-2
205
4834
63Sp
ringb
rook
Cre
ek a
t Bag
ley,
IAsw
ambi
ent
EPA
LIPS
10/0
5/20
0410
05<
.4
IA-2
305
4858
00N
orth
Bra
nch
Nor
th R
iver
at M
cBrid
e, IA
swam
bien
tEP
ALI
PS10
/05/
2004
0800
< .4
IA-2
405
4877
70B
rush
Cre
ek n
ear L
ucas
, IA
swam
bien
tEP
ALI
PS10
/04/
2004
1600
< .4
IA-2
506
4834
71R
at C
reek
nea
r Mat
lock
, IA
swam
bien
tEP
ALI
PS10
/06/
2004
0815
.64
IA-2
606
6037
60Tr
ibut
ary
Wes
t For
k Li
ttle
Siou
x R
iver
bel
ow S
ilver
La
ke n
ear L
ake
Park
, IA
swam
bien
tEP
ALI
PS10
/06/
2004
1010
< .4
IA-2
706
6053
95Lo
st Is
land
Out
let a
bove
Dic
kens
, IA
swam
bien
tEP
ALI
PS10
/26/
2004
0820
< .4
IA-2
806
6066
50B
ig C
reek
nea
r Ant
hon,
IAsw
ambi
ent
EPA
LIPS
10/0
5/20
0415
00<
.4
IA-2
906
8072
78Tr
ibut
ary
to W
est F
ork
Wes
t Nis
hnab
otna
Riv
er n
ear
Man
illa,
IAsw
ambi
ent
EPA
LIPS
10/0
5/20
0412
30<
.4
IA-3
006
8097
75Fi
sher
Cre
ek n
ear S
hena
ndoa
h, IA
swam
bien
tEP
ALI
PS10
/29/
2004
1100
.47
IA-3
140
4327
0952
8480
106
8N40
W07
BC
AA
gwam
bien
tC
OO
PIA
GW
M07
/06/
2004
1000
< .4
IA-3
240
4521
0952
3580
106
9N40
W26
BA
BD
gwam
bien
tC
OO
PIA
GW
M07
/06/
2004
0130
< .4
IA-3
340
4531
0950
2050
206
9N36
W19
CD
gwam
bien
tC
OO
PIA
GW
M07
/14/
2004
1130
.44
IA-3
440
4957
0951
8350
107
0N39
W27
gwam
bien
tC
OO
PIA
GW
M07
/14/
2004
1530
< .4
IA-3
541
0007
0953
3050
107
2N41
W27
CD
CC
gwam
bien
tC
OO
PIA
GW
M07
/01/
2004
1130
< .4
IA-3
641
0107
0953
0000
107
2N41
W24
DA
Dgw
ambi
ent
CO
OP
IAG
WM
07/0
8/20
0416
00<
.4
IA-3
741
0118
0951
4400
107
2N38
W29
BA
gwam
bien
tC
OO
PIA
GW
M07
/17/
2004
1200
1.1
5
IA-3
841
1154
0952
5250
107
4N40
W22
AD
DB
gwam
bien
tC
OO
PIA
GW
M06
/28/
2004
1130
< .4
IA-3
941
1649
0955
2500
107
5N44
W22
DA
DA
gwam
bien
tC
OO
PIA
GW
M06
/29/
2004
1340
< .4
Tables 1, 3–6 33Ta
ble
4.
Perc
hlor
ate
conc
entra
tions
at s
elec
ted
surfa
ce-w
ater
and
gro
undw
ater
site
s in
the
Unite
d St
ates
.—Co
ntin
ued
[USG
S, U
.S. G
eolo
gica
l Sur
vey;
μg/
L, m
icro
gram
s per
Lite
r; sw
, sur
face
wat
er; g
w, g
roun
dwat
er; N
AWQ
A, N
atio
nal W
ater
Qua
lity
Ass
essm
ent p
rogr
am; C
OO
P, F
eder
al/S
tate
coo
pera
tive
proj
ect;
EPA
LIPS
, La
ndsc
ape
Indi
cato
rs p
roje
ct; S
WTR
END
, Sur
face
Wat
er T
rend
s net
wor
k; A
ZDEQ
, Ariz
ona
Dep
artm
ent o
f Env
ironm
enta
l Qua
lity;
GA
MA
, Cal
iforn
ia G
roun
dwat
er A
mbi
ent M
onito
ring
and
Ass
essm
ent;
RIO
G, R
io G
rand
e Va
lley;
UC
OL,
Upp
er C
olor
ado
Riv
er B
asin
; SPL
T, S
outh
Pla
tte R
iver
Bas
in; I
AG
WM
, Iow
a G
roun
dwat
er M
onito
ring
Net
wor
k; H
PGW
, Hig
h Pl
ains
Reg
iona
l Gro
und
Wat
er S
tudy
; TA
NC
, Tr
ansp
ort o
f Ant
hrop
ogen
ic a
nd N
atur
al C
onta
min
ants
Stu
dy; S
EWA
RD
, City
of S
ewar
d, N
ebra
ska.
; AC
T, A
gric
ultu
ral C
hem
ical
Tra
nspo
rt st
udy;
CN
BR
, Cen
tral N
ebra
ska
Bas
ins;
TR
IVER
, Ton
gue
Riv
er
Surf
ace-
Wat
er-Q
ualit
y M
onito
ring
Net
wor
k; <
, les
s tha
n]
Map
iden
tifi-
catio
n nu
mbe
r (fi
gs. 2
–9)
Site
num
ber
Site
nam
eSi
te ty
peSa
mpl
e ty
peU
SGS
Pr
ogra
mU
SGS
Proj
ect
Sam
ple
date
(m
onth
/day
/ye
ar)
Sam
ple
time
(24
hour
)
Perc
hlor
ate
conc
entr
atio
n (μ
g/L)
IA-4
041
2117
0923
9230
107
6N16
W25
CB
DA
gwam
bien
tC
OO
PIA
GW
M07
/01/
2004
1130
1.7
3
IA-4
141
2812
0953
2270
107
7N41
W15
AC
DD
gwam
bien
tC
OO
PIA
GW
M08
/05/
2004
1500
1.2
7
IA-4
241
3031
0932
8550
107
7N23
W03
AA
AA
gwam
bien
tC
OO
PIA
GW
M09
/12/
2004
1245
< .4
IA-4
341
3132
0943
0420
207
8N32
W27
AD
DC
gwam
bien
tC
OO
PIA
GW
M07
/13/
2004
1130
< .4
IA-4
441
3342
0934
3280
107
8N25
W15
CA
AC
gwam
bien
tC
OO
PIA
GW
M07
/13/
2004
1530
< .4
IA-4
541
3743
0950
4120
107
9N36
W29
BB
CA
gwam
bien
tC
OO
PIA
GW
M08
/05/
2004
1330
.95
IA-4
641
3744
0935
9550
107
9N27
W28
BA
AA
gwam
bien
tC
OO
PIA
GW
M09
/08/
2004
1230
< .4
IA-4
741
3907
0930
7020
107
9N20
W13
AD
DD
gwam
bien
tC
OO
PIA
GW
M07
/27/
2004
1230
< .4
IA-4
841
3943
0954
5360
107
9N42
W08
DC
CB
gwam
bien
tC
OO
PIA
GW
M06
/29/
2004
1100
1.3
3
IA-4
941
4024
0931
5390
107
9N21
W11
AB
BB
045
10gw
ambi
ent
CO
OP
IAG
WM
06/3
0/20
0411
30<
.4
IA-5
041
4029
0931
4560
107
9N21
W01
CC
CA
gwam
bien
tC
OO
PIA
GW
M06
/30/
2004
0930
.56
IA-5
141
4251
0925
4170
108
0N18
W26
AA
DC
gwam
bien
tC
OO
PIA
GW
M06
/30/
2004
1330
.72
IA-5
241
4315
0945
2420
108
0N35
W24
CB
CC
gwam
bien
tC
OO
PIA
GW
M06
/30/
2004
1400
< .4
IA-5
341
4933
0952
0180
208
1N39
W13
CA
CB
gwam
bien
tC
OO
PIA
GW
M07
/20/
2004
1000
< .4
IA-5
441
5055
0941
3120
108
1N29
W10
BB
BA
031
47gw
ambi
ent
CO
OP
IAG
WM
07/1
5/20
0411
40<
.4
IA-5
541
5435
0944
9280
108
2N34
W17
DD
BA
218
82gw
ambi
ent
CO
OP
IAG
WM
07/1
3/20
0482
0<
.4
IA-5
641
5442
0921
8020
108
2N13
W13
DA
CB
gwam
bien
tC
OO
PIA
GW
M06
/29/
2004
1030
< .4
IA-5
741
5949
0914
0490
108
3N07
W17
DA
CD
gwam
bien
tC
OO
PIA
GW
M06
/29/
2004
1330
< .4
IA-5
842
0156
0935
6240
208
3N27
W01
AB
CC
gwam
bien
tC
OO
PIA
GW
M07
/14/
2004
1450
< .4
IA-5
942
0453
0935
6140
108
4N27
W13
DC
AA
gwam
bien
tC
OO
PIA
GW
M07
/22/
2004
1030
< .4
IA-6
042
0607
0925
9450
108
4N18
W07
BC
AD
gwam
bien
tC
OO
PIA
GW
M09
/12/
2004
0930
< .4
IA-6
142
3138
0903
8360
108
9N03
E18A
AD
B 0
7468
gwam
bien
tC
OO
PIA
GW
M07
/12/
2004
1145
< .4
IA-6
242
4312
0931
3520
109
1N20
W05
DB
CC
401
14gw
ambi
ent
CO
OP
IAG
WM
08/3
0/20
0414
45<
.4
IA-6
342
4838
0961
6100
109
2N46
W03
CC
AB
gwam
bien
tC
OO
PIA
GW
M08
/03/
2004
0730
< .4
IA-6
442
4921
0963
3470
109
3N48
W31
CC
DD
gwam
bien
tC
OO
PIA
GW
M08
/02/
2004
1600
.74
IA-6
542
5940
0962
9450
109
4N48
W03
AB
DA
gwam
bien
tC
OO
PIA
GW
M08
/03/
2004
1130
< .4
IA-6
643
0923
0951
1450
109
6N37
W03
DD
CC
gwam
bien
tC
OO
PIA
GW
M08
/31/
2004
1440
< .4
IA-6
743
1816
0914
7440
109
8N08
W16
CA
BD
gwam
bien
tC
OO
PIA
GW
M07
/13/
2004
1115
< .4
IA-6
843
2314
0953
2000
109
9N40
W14
DC
CC
gwam
bien
tC
OO
PIA
GW
M08
/31/
2004
0915
< .4
34 Perchlorate Data for Streams and Groundwater in Selected Areas of the United States, 2004Ta
ble
4.
Perc
hlor
ate
conc
entra
tions
at s
elec
ted
surfa
ce-w
ater
and
gro
undw
ater
site
s in
the
Unite
d St
ates
.—Co
ntin
ued
[USG
S, U
.S. G
eolo
gica
l Sur
vey;
μg/
L, m
icro
gram
s per
Lite
r; sw
, sur
face
wat
er; g
w, g
roun
dwat
er; N
AWQ
A, N
atio
nal W
ater
Qua
lity
Ass
essm
ent p
rogr
am; C
OO
P, F
eder
al/S
tate
coo
pera
tive
proj
ect;
EPA
LIPS
, La
ndsc
ape
Indi
cato
rs p
roje
ct; S
WTR
END
, Sur
face
Wat
er T
rend
s net
wor
k; A
ZDEQ
, Ariz
ona
Dep
artm
ent o
f Env
ironm
enta
l Qua
lity;
GA
MA
, Cal
iforn
ia G
roun
dwat
er A
mbi
ent M
onito
ring
and
Ass
essm
ent;
RIO
G, R
io G
rand
e Va
lley;
UC
OL,
Upp
er C
olor
ado
Riv
er B
asin
; SPL
T, S
outh
Pla
tte R
iver
Bas
in; I
AG
WM
, Iow
a G
roun
dwat
er M
onito
ring
Net
wor
k; H
PGW
, Hig
h Pl
ains
Reg
iona
l Gro
und
Wat
er S
tudy
; TA
NC
, Tra
nspo
rt of
Ant
hrop
ogen
ic a
nd N
atur
al C
onta
min
ants
Stu
dy; S
EWA
RD
, City
of S
ewar
d, N
ebra
ska.
; AC
T, A
gric
ultu
ral C
hem
ical
Tra
nspo
rt st
udy;
CN
BR
, Cen
tral N
ebra
ska
Bas
ins;
TR
IVER
, Ton
gue
Riv
er S
urfa
ce-W
ater
-Qua
lity
Mon
itorin
g N
etw
ork;
<, l
ess t
han]
Map
iden
tifi-
catio
n nu
mbe
r (fi
gs. 2
–9)
Site
num
ber
Site
nam
eSi
te ty
peSa
mpl
e ty
peU
SGS
Pr
ogra
mU
SGS
Proj
ect
Sam
ple
date
(m
onth
/day
/ye
ar)
Sam
ple
time
(24
hour
)
Perc
hlor
ate
conc
entr
atio
n (μ
g/L)
IL-0
105
5255
00Su
gar C
reek
at M
ilfor
d, IL
swam
bien
tEP
ALI
PS/
NAW
QA
SWTR
END
08/0
6/20
0410
05<
0.4
IL-0
105
5255
00Su
gar C
reek
at M
ilfor
d, IL
swam
bien
tEP
ALI
PS/
NAW
QA
SWTR
END
12/1
5/20
0412
45<
.4
IL-0
205
5720
00Sa
ngam
on R
iver
at M
ontic
ello
, IL
swam
bien
tEP
ALI
PS/
NAW
QA
SWTR
END
08/0
5/20
0413
30<
.4
IL-0
205
5720
00Sa
ngam
on R
iver
at M
ontic
ello
, IL
swam
bien
tEP
ALI
PS/
NAW
QA
SWTR
END
10/0
5/20
0409
15<
.4
IL-0
303
3821
25Li
ttle
Salin
e R
iver
nea
r Car
rier M
ills,
ILsw
ambi
ent
EPA
LIPS
10/2
6/20
0409
00<
.4
IL-0
405
5952
10R
ockh
ouse
Cre
ek n
ear H
ecke
r, IL
swam
bien
tEP
ALI
PS10
/25/
2004
1220
< .4
IL-0
503
3806
00Fo
urm
ile C
reek
nea
r Way
ne C
ity, I
Lsw
ambi
ent
EPA
LIPS
10/1
6/20
0414
10<
.4
IL-0
603
3465
65R
acco
on C
reek
Trib
utar
y ne
ar P
eter
sbur
g, IL
swam
bien
tEP
ALI
PS11
/09/
2004
0915
< .4
IL-0
705
5927
60R
acco
on C
reek
nea
r Mul
berr
y G
rove
, IL
swam
bien
tEP
ALI
PS10
/04/
2004
1140
< .4
IL-0
803
3444
35Is
land
Cre
ek n
ear W
oodb
ury,
ILsw
ambi
ent
EPA
LIPS
09/2
8/20
0410
40<
.4
IL-0
905
5865
97C
oate
s Cre
ek n
ear B
erda
n, IL
swam
bien
tEP
ALI
PS10
/20/
2004
0950
< .4
IL-1
005
5750
30W
illow
Cre
ek n
ear M
orris
onvi
lle, I
Lsw
ambi
ent
EPA
LIPS
10/2
0/20
0414
00<
.4
IL-1
005
5750
30W
illow
Cre
ek n
ear M
orris
onvi
lle, I
Lsw
repl
icat
eEP
ALI
PS10
/20/
2004
1401
< .4
IL-1
105
5732
00B
ig C
reek
Trib
utar
y ne
ar M
t. Zi
on, I
Lsw
ambi
ent
EPA
LIPS
09/2
9/20
0410
30<
.4
IL-1
205
5719
50C
amp
Cre
ek T
ribut
ary
near
Whi
te H
eath
, IL
swam
bien
tEP
ALI
PS10
/05/
2004
1300
< .4
IL-1
305
5847
90C
edar
Cre
ek n
ear C
amde
n, IL
swam
bien
tEP
ALI
PS10
/19/
2004
1540
< .4
IL-1
403
3367
90U
pper
Sal
t For
k Tr
ibut
ary
near
Ran
toul
, IL
swam
bien
tEP
ALI
PS09
/30/
2004
0920
< .4
IL-1
505
4160
50Sm
allp
ox C
reek
at A
itken
, IL
swam
bien
tEP
ALI
PS/
NAW
QA
SWTR
END
11/2
3/20
0409
35<
.4
IN-0
104
1780
00St
. Jos
eph
Riv
er n
ear N
ewvi
lle, I
Nsw
ambi
ent
EPA
LIPS
09/0
8/20
0409
00<
.4
IN-0
238
4113
0864
2540
1B
eave
r Cre
ek n
ear H
uron
, IN
swam
bien
tEP
ALI
PS11
/08/
2004
1600
< .4
IN-0
339
0020
0860
0080
1C
oole
y C
reek
nea
r Sey
mou
r, IN
swam
bien
tEP
ALI
PS11
/08/
2004
1035
< .4
IN-0
439
1014
0864
8450
1Li
ck C
reek
nea
r Fre
edom
, IN
swam
bien
tEP
ALI
PS11
/09/
2004
0915
< .4
IN-0
539
1740
0850
5570
1Pi
pe C
reek
nea
r Pen
ntow
n, IN
swam
bien
tEP
ALI
PS10
/26/
2004
1045
1.4
9
IN-0
639
2007
0871
4020
1B
ig S
loug
h ne
ar R
iley,
INsw
ambi
ent
EPA
LIPS
11/0
9/20
0413
30<
.4
IN-0
739
4024
0870
5090
1R
ock
Fork
nea
r Man
sfiel
d, IN
swam
bien
tEP
ALI
PS09
/23/
2004
0925
< .4
IN-0
839
4102
0855
3310
1Li
ttle
Suga
r Cre
ek n
ear N
ew P
ales
tine,
INsw
ambi
ent
EPA
LIPS
09/2
4/20
0408
45 .4
1
Tables 1, 3–6 35Ta
ble
4.
Perc
hlor
ate
conc
entra
tions
at s
elec
ted
surfa
ce-w
ater
and
gro
undw
ater
site
s in
the
Unite
d St
ates
.—Co
ntin
ued
[USG
S, U
.S. G
eolo
gica
l Sur
vey;
μg/
L, m
icro
gram
s per
Lite
r; sw
, sur
face
wat
er; g
w, g
roun
dwat
er; N
AWQ
A, N
atio
nal W
ater
Qua
lity
Ass
essm
ent p
rogr
am; C
OO
P, F
eder
al/S
tate
coo
pera
tive
proj
ect;
EPA
LIPS
, La
ndsc
ape
Indi
cato
rs p
roje
ct; S
WTR
END
, Sur
face
Wat
er T
rend
s net
wor
k; A
ZDEQ
, Ariz
ona
Dep
artm
ent o
f Env
ironm
enta
l Qua
lity;
GA
MA
, Cal
iforn
ia G
roun
dwat
er A
mbi
ent M
onito
ring
and
Ass
essm
ent;
RIO
G, R
io G
rand
e Va
lley;
UC
OL,
Upp
er C
olor
ado
Riv
er B
asin
; SPL
T, S
outh
Pla
tte R
iver
Bas
in; I
AG
WM
, Iow
a G
roun
dwat
er M
onito
ring
Net
wor
k; H
PGW
, Hig
h Pl
ains
Reg
iona
l Gro
und
Wat
er S
tudy
; TA
NC
, Tr
ansp
ort o
f Ant
hrop
ogen
ic a
nd N
atur
al C
onta
min
ants
Stu
dy; S
EWA
RD
, City
of S
ewar
d, N
ebra
ska.
; AC
T, A
gric
ultu
ral C
hem
ical
Tra
nspo
rt st
udy;
CN
BR
, Cen
tral N
ebra
ska
Bas
ins;
TR
IVER
, Ton
gue
Riv
er
Surf
ace-
Wat
er-Q
ualit
y M
onito
ring
Net
wor
k; <
, les
s tha
n]
Map
iden
tifi-
catio
n nu
mbe
r (fi
gs. 2
–9)
Site
num
ber
Site
nam
eSi
te ty
peSa
mpl
e ty
peU
SGS
Pr
ogra
mU
SGS
Proj
ect
Sam
ple
date
(m
onth
/day
/ye
ar)
Sam
ple
time
(24
hour
)
Perc
hlor
ate
conc
entr
atio
n (μ
g/L)
IN-0
839
4102
0855
3310
1Li
ttle
Suga
r Cre
ek n
ear N
ew P
ales
tine,
INsw
repl
icat
eEP
ALI
PS09
/24/
2004
0855
< 0.
4
IN-0
940
0101
0861
7250
1M
ount
s Run
nea
r Zio
nsvi
lle, I
Nsw
ambi
ent
EPA
LIPS
09/3
0/20
0409
30 1
.58
IN-1
040
1510
0855
0250
1Li
ttle
Duc
k C
reek
nea
r Elw
ood,
INsw
ambi
ent
EPA
LIPS
11/1
0/20
0409
45<
.4
IN-1
140
1722
0845
1320
1M
issi
ssin
ewa
Riv
er n
ear U
nion
City
, IN
swam
bien
tEP
ALI
PS09
/20/
2004
1100
< .4
IN-1
140
1722
0845
1320
1M
issi
ssin
ewa
Riv
er n
ear U
nion
City
, IN
swre
plic
ate
EPA
LIPS
09/2
0/20
0412
10<
.4
IN-1
240
3748
0871
0130
1O
wen
s Ditc
h ne
ar F
owle
r, IN
swam
bien
tEP
ALI
PS09
/22/
2004
0910
< .4
IN-1
341
0823
0845
5110
1W
ilbur
Ditc
h ne
ar F
ort W
ayne
, IN
swam
bien
tEP
ALI
PS09
/21/
2004
0930
< .4
IN-1
441
2215
0870
4280
1C
obb
Ditc
h ne
ar K
outs
, IN
swam
bien
tEP
ALI
PS09
/21/
2004
1610
< .4
IN-1
541
4241
0860
3010
1C
obus
Cre
ek n
ear E
lkha
rt, IN
swam
bien
tEP
ALI
PS10
/21/
2004
1215
< .4
IN-1
541
4241
0860
3010
1C
obus
Cre
ek n
ear E
lkha
rt, IN
swre
plic
ate
EPA
LIPS
10/2
1/20
0412
45<
.4
MI-
0104
1015
31O
sbor
n D
rain
nea
r Gle
nwoo
d, M
Isw
ambi
ent
EPA
LIPS
10/1
3/20
0412
30 .8
5
MI-
0204
1027
26B
utte
rnut
Cre
ek n
ear S
outh
Hav
en, M
Isw
ambi
ent
EPA
LIPS
09/0
8/20
0416
00<
.4
MI-
0304
1158
51Li
ttle
Libh
art C
reek
nea
r Lyo
ns, M
Isw
ambi
ent
EPA
LIPS
09/1
3/20
0413
40<
.4
MI-
0404
1160
23B
ella
my
Cre
ek n
ear I
onia
, MI
swam
bien
tEP
ALI
PS09
/14/
2004
1045
< .4
MI-
0404
1160
23B
ella
my
Cre
ek n
ear I
onia
, MI
swre
plic
ate
EPA
LIPS
09/1
4/20
0413
30<
.4
MI-
0504
1167
34Li
ttle
Thor
napp
le R
iver
nea
r Gre
sham
, MI
swam
bien
tEP
ALI
PS10
/12/
2004
1135
< .4
MI-
0604
1174
48C
edar
Cre
ek n
ear Q
uim
by, M
Isw
ambi
ent
EPA
LIPS
09/2
3/20
0412
30<
.4
MI-
0704
1505
92So
uth
Bra
nch
Whi
te C
reek
nea
r Def
ord,
MI
swam
bien
tEP
ALI
PS09
/29/
2004
1400
< .4
MI-
0804
1770
85La
ird C
reek
nea
r Wal
dron
, MI
swam
bien
tEP
ALI
PS09
/15/
2004
1145
< .4
MN
-01
0528
8705
Shin
gle
Cre
ek a
t Que
en A
venu
e in
Min
neap
olis
, M
Nsw
ambi
ent
NAW
QA
08/2
5/20
0410
25 2
.53
MN
-02
0531
6983
Cou
nty
Ditc
h 24
nea
r Cle
men
ts, M
Nsw
ambi
ent
EPA
LIPS
10/0
6/20
0414
20 .8
7
MN
-02
0531
6983
Cou
nty
Ditc
h 24
nea
r Cle
men
ts, M
Nsw
blan
kEP
ALI
PS10
/07/
2004
900
< .4
MN
-03
0531
8283
Judi
cial
Ditc
h 85
nea
r Will
ow C
reek
, MN
swam
bien
tEP
ALI
PS10
/07/
2004
1210
1.8
MN
-04
0532
0270
Littl
e C
obb
Riv
er n
ear B
eauf
ord,
MN
swam
bien
tEP
ALI
PS/
NAW
QA
SWTR
END
08/2
3/20
0413
10 .8
MN
-04
0532
0270
Littl
e C
obb
Riv
er n
ear B
eauf
ord,
MN
swam
bien
tEP
ALI
PS/
NAW
QA
SWTR
END
10/0
7/20
0410
05<
.4
MN
-05
0532
5580
Che
rry
Cre
ek n
ear O
ttaw
a, M
Nsw
ambi
ent
EPA
LIPS
09/0
3/20
0410
40<
.4
MN
-06
0532
9898
Silv
er C
reek
nea
r Eas
t Uni
on, M
Nsw
ambi
ent
EPA
LIPS
07/2
8/20
0413
00<
.4
MN
-07
0533
1580
Mis
siss
ippi
rive
r bel
ow L
&D
#2
at H
astin
gs, M
Nsw
ambi
ent
NAW
QA
SWTR
END
08/1
3/20
0410
16<
.4
36 Perchlorate Data for Streams and Groundwater in Selected Areas of the United States, 2004Ta
ble
4.
Perc
hlor
ate
conc
entra
tions
at s
elec
ted
surfa
ce-w
ater
and
gro
undw
ater
site
s in
the
Unite
d St
ates
.—Co
ntin
ued
[USG
S, U
.S. G
eolo
gica
l Sur
vey;
μg/
L, m
icro
gram
s per
Lite
r; sw
, sur
face
wat
er; g
w, g
roun
dwat
er; N
AWQ
A, N
atio
nal W
ater
Qua
lity
Ass
essm
ent p
rogr
am; C
OO
P, F
eder
al/S
tate
coo
pera
tive
proj
ect;
EPA
LIPS
, La
ndsc
ape
Indi
cato
rs p
roje
ct; S
WTR
END
, Sur
face
Wat
er T
rend
s net
wor
k; A
ZDEQ
, Ariz
ona
Dep
artm
ent o
f Env
ironm
enta
l Qua
lity;
GA
MA
, Cal
iforn
ia G
roun
dwat
er A
mbi
ent M
onito
ring
and
Ass
essm
ent;
RIO
G, R
io G
rand
e Va
lley;
UC
OL,
Upp
er C
olor
ado
Riv
er B
asin
; SPL
T, S
outh
Pla
tte R
iver
Bas
in; I
AG
WM
, Iow
a G
roun
dwat
er M
onito
ring
Net
wor
k; H
PGW
, Hig
h Pl
ains
Reg
iona
l Gro
und
Wat
er S
tudy
; TA
NC
, Tra
nspo
rt of
Ant
hrop
ogen
ic a
nd N
atur
al C
onta
min
ants
Stu
dy; S
EWA
RD
, City
of S
ewar
d, N
ebra
ska.
; AC
T, A
gric
ultu
ral C
hem
ical
Tra
nspo
rt st
udy;
CN
BR
, Cen
tral N
ebra
ska
Bas
ins;
TR
IVER
, Ton
gue
Riv
er S
urfa
ce-W
ater
-Qua
lity
Mon
itorin
g N
etw
ork;
<, l
ess t
han]
Map
iden
tifi-
catio
n nu
mbe
r (fi
gs. 2
–9)
Site
num
ber
Site
nam
eSi
te ty
peSa
mpl
e ty
peU
SGS
Pr
ogra
mU
SGS
Proj
ect
Sam
ple
date
(m
onth
/day
/ye
ar)
Sam
ple
time
(24
hour
)
Perc
hlor
ate
conc
entr
atio
n (μ
g/L)
MN
-08
0533
9721
Rus
h C
reek
abo
ve M
outh
nea
r Rus
h C
ity, M
Nsw
ambi
ent
EPA
LIPS
07/2
7/20
0411
30<
0.4
MN
-09
0535
1400
Dev
il C
reek
nea
r Mor
risto
wn,
MN
swam
bien
tEP
ALI
PS08
/15/
2004
1230
< .4
MN
-10
0535
5307
Wel
ls C
reek
nea
r Bel
vide
re M
ills,
MN
swam
bien
tEP
ALI
PS09
/03/
2004
1130
< .4
MN
-11
0537
7508
Trou
t Cre
ek n
ear W
eave
r, M
Nsw
ambi
ent
EPA
LIPS
09/0
3/20
0408
30<
.4
MN
-12
0537
7550
Dee
ring
Valle
y C
reek
nea
r Whi
tman
, MN
swam
bien
tEP
ALI
PS08
/14/
2004
1400
< .4
MN
-12
0537
7550
Dee
ring
Valle
y C
reek
nea
r Whi
tman
, MN
swre
plic
ate
EPA
LIPS
08/1
4/20
0414
06<
.4
MN
-13
0538
4110
Dus
chee
Cre
ek a
bove
Lan
esbo
ro, M
Nsw
ambi
ent
EPA
LIPS
09/0
2/20
0413
00<
.4
MN
-13
0538
4110
Dus
chee
Cre
ek a
bove
Lan
esbo
ro, M
Nsw
repl
icat
eEP
ALI
PS09
/02/
2004
1302
< .4
MO
-01
0549
5850
Wya
cond
a R
iver
nea
r Lur
ay, M
Osw
ambi
ent
EPA
LIPS
08/1
6/20
0414
00<
.4
MO
-01
0549
5850
Wya
cond
a R
iver
nea
r Lur
ay, M
Osw
repl
icat
eEP
ALI
PS08
/16/
2004
1401
< .4
MO
-02
0550
2005
Bea
r Cre
ek a
t 29t
h St
reet
at H
anni
bal,
MO
swam
bien
tEP
ALI
PS08
/17/
2004
0820
< .4
MT-
0106
3063
00To
ngue
Riv
er a
t Sta
te L
ine
near
Dec
ker,
MT
swam
bien
tC
OO
P07
/14/
2004
1420
.68
NE-
0106
8000
00M
aple
Cre
ek n
ear N
icke
rson
, NE
swam
bien
tEP
ALI
PS/
NAW
QA
SWTR
END
07/1
3/20
0410
30<
.4
NE-
0106
8000
00M
aple
Cre
ek n
ear N
icke
rson
, NE
swam
bien
tEP
ALI
PS/
NAW
QA
SWTR
END
10/1
2/20
0409
30<
.4
NE-
0206
8005
00El
khor
n R
iver
at W
ater
loo,
NE
swam
bien
tN
AWQ
ASW
TREN
D07
/14/
2004
1000
.48
NE-
0306
8055
00Pl
atte
Riv
er a
t Lou
isvi
lle, N
Esw
ambi
ent
NAW
QA
SWTR
END
07/1
5/20
0410
00<
.4
NE-
0440
0757
0983
2540
12N
11W
15C
DD
D1
gwam
bien
tN
AWQ
AH
PGW
08/1
7/20
0414
00 1
.59
NE-
0540
1329
0974
4450
13N
4W
15D
AD
A1
gwam
bien
tN
AWQ
AH
PGW
08/1
9/20
0415
00 .6
9
NE-
0640
1715
0970
8360
14N
2E2
5AD
AA
1gw
ambi
ent
NAW
QA
HPG
W07
/16/
2004
1000
1.4
3
NE-
0740
1853
0975
5010
14N
5W
18D
AA
A1
gwam
bien
tN
AWQ
AH
PGW
07/1
5/20
0411
00 1
.99
NE-
0840
1918
0971
9530
14N
1E
8DD
DD
1gw
ambi
ent
NAW
QA
HPG
W08
/20/
2004
1000
1.0
5
NE-
0940
2103
0974
0420
15N
3W
32D
CD
C1
gwam
bien
tN
AWQ
AH
PGW
07/1
5/20
0414
00 1
.3
NE-
1040
2154
0985
1260
15N
14W
26D
DD
D1
gwam
bien
tN
AWQ
AH
PGW
08/1
8/20
0414
00 1
.49
NE-
1140
2708
0985
3490
16N
14W
28D
DC
D1
gwam
bien
tN
AWQ
AH
PGW
08/1
8/20
0412
00<
.4
NE-
1240
2943
0982
8480
16N
10W
7D
DD
C1
gwam
bien
tN
AWQ
AH
PGW
08/1
7/20
0410
00 .8
8
NE-
1340
3314
0975
3280
17N
5W
21C
DA
D1
gwam
bien
tN
AWQ
AH
PGW
07/1
4/20
0410
00 1
.8
NE-
1440
3330
0985
4510
17N
14W
20D
AD
A1
gwam
bien
tN
AWQ
AH
PGW
08/1
9/20
0411
00 2
0.87
NE-
1540
3502
0974
6010
17N
4W
10C
CC
B1
gwam
bien
tN
AWQ
AH
PGW
07/1
4/20
0414
00<
.4
NE-
1640
3520
0970
1390
17N
3E1
2AD
DD
1gw
ambi
ent
NAW
QA
HPG
W07
/16/
2004
1400
.94
Tables 1, 3–6 37Ta
ble
4.
Tabl
e 4.
Pe
rchl
orat
e co
ncen
tratio
ns a
t sel
ecte
d su
rface
-wat
er a
nd g
roun
dwat
er s
ites
in th
e Un
ited
Stat
es.—
Cont
inue
d[U
SGS,
U.S
. Geo
logi
cal S
urve
y; μ
g/L,
mic
rogr
ams p
er L
iter;
sw, s
urfa
ce w
ater
; gw,
gro
undw
ater
; NAW
QA
, Nat
iona
l Wat
er Q
ualit
y A
sses
smen
t pro
gram
; CO
OP,
Fed
eral
/Sta
te c
oope
rativ
e pr
ojec
t; EP
ALI
PS,
Land
scap
e In
dica
tors
pro
ject
; SW
TREN
D, S
urfa
ce W
ater
Tre
nds n
etw
ork;
AZD
EQ, A
rizon
a D
epar
tmen
t of E
nviro
nmen
tal Q
ualit
y; G
AM
A, C
alifo
rnia
Gro
undw
ater
Am
bien
t Mon
itorin
g an
d A
sses
smen
t; R
IOG
, Rio
Gra
nde
Valle
y; U
CO
L, U
pper
Col
orad
o R
iver
Bas
in; S
PLT,
Sou
th P
latte
Riv
er B
asin
; IA
GW
M, I
owa
Gro
undw
ater
Mon
itorin
g N
etw
ork;
HPG
W, H
igh
Plai
ns R
egio
nal G
roun
d W
ater
Stu
dy;
TAN
C, T
rans
port
of A
nthr
opog
enic
and
Nat
ural
Con
tam
inan
ts S
tudy
; SEW
AR
D, C
ity o
f Sew
ard,
Neb
rask
a.; A
CT,
Agr
icul
tura
l Che
mic
al T
rans
port
stud
y; C
NB
R, C
entra
l Neb
rask
a B
asin
s; T
RIV
ER, T
ongu
e R
iver
Sur
face
-Wat
er-Q
ualit
y M
onito
ring
Net
wor
k; <
, les
s tha
n]
Map
iden
tifi-
catio
n nu
mbe
r (fi
gs. 2
–9)
Site
num
ber
Site
nam
eSi
te ty
peSa
mpl
e ty
peU
SGS
Pr
ogra
mU
SGS
Proj
ect
Sam
ple
date
(m
onth
/day
/ye
ar)
Sam
ple
time
(24
hour
)
Perc
hlor
ate
conc
entr
atio
n (μ
g/L)
NE-
4740
5406
0974
0560
111
N 3
W20
DC
C1
AWT2
-71
gwam
bien
tN
AWQ
AH
PGW
07/2
9/20
0413
00 1
.31
NE-
4840
5420
0971
1400
211
N 2
E22C
BB
B2
FP4-
105
gwam
bien
tC
OO
PSE
WA
RD
08/0
4/20
0415
00 .9
5
NE-
4940
5420
0971
1400
311
N 2
E22C
BB
B3
FP4-
129
gwam
bien
tC
OO
PSE
WA
RD
08/2
5/20
0418
000.
7
NE-
5041
0247
0975
3360
112
N 5
W 4
BA
AA
1gw
ambi
ent
NAW
QA
HPG
W07
/20/
2004
.6
NE-
5141
0251
1020
2420
1SB
0120
4232
CD
Dgw
ambi
ent
NAW
QA
SPLT
07/1
3/20
0410
40 .6
1
NE-
5241
0410
0972
2060
113
N 1
W25
DA
AD
1gw
ambi
ent
NAW
QA
HPG
W07
/13/
2004
.67
NE-
5341
0520
0973
4450
113
N 2
W20
BB
BC
1gw
ambi
ent
NAW
QA
HPG
W07
/20/
2004
1300
.78
NE-
5441
0552
0972
2050
113
N 1
E18B
CC
C1
gwam
bien
tN
AWQ
AH
PGW
07/1
2/20
04 .5
NE-
5541
0710
0974
5420
113
N 4
W10
BA
AA
1gw
ambi
ent
NAW
QA
HPG
W07
/19/
2004
1700
.77
NE-
5641
1256
0973
0110
114
N 2
W 2
AD
DA
1gw
ambi
ent
NAW
QA
HPG
W07
/13/
2004
< .4
NE-
5741
1636
0963
7290
1D
uck
Cre
ek n
ear C
olon
, NE
swam
bien
tEP
ALI
PS09
/20/
2004
1000
< .4
NE-
5841
3334
0963
2530
118
N 8
W 5
DB
AB
1 N
AWQ
A W
ELL
AC
TFS1
-1A
gwam
bien
tN
AWQ
AA
CT
08/1
6/20
0416
30 .4
4
NE-
5941
3334
0963
2530
218
N 8
W 5
DB
AB
2 N
AWQ
A W
ELL
AC
TFS1
-1B
gwam
bien
tN
AWQ
AA
CT
08/1
6/20
0415
00<
.4
NE-
6041
3334
0963
2530
318
N 8
W 5
DB
AB
3 N
AWQ
A W
ELL
AC
TFS1
-1C
gwam
bien
tN
AWQ
AA
CT
08/1
6/20
0413
30<
.4
NE-
6141
3340
0964
0270
118
N 7
E 6B
CC
C1
CN
BR
LUSC
R1
DO
-24
gwam
bien
tN
AWQ
AC
NB
R09
/08/
2004
1500
< .4
NE-
6241
3341
0963
2550
118
N 8
W 5
AC
DC
1 N
AWQ
A W
ELL
AC
TFS1
-2A
gwam
bien
tN
AWQ
AA
CT
08/1
7/20
0412
00<
.4
NE-
6341
3341
0963
2550
218
N 8
W 5
AC
DC
2 N
AWQ
A W
ELL
AC
TFS1
-2B
gwam
bien
tN
AWQ
AA
CT
08/1
7/20
0410
30<
.4
NE-
6441
3341
0963
2550
318
N 8
W 5
AC
DC
3 N
AWQ
A W
ELL
AC
TFS1
-2C
gwam
bien
tN
AWQ
AA
CT
08/1
7/20
0410
00<
.4
NE-
6541
3348
0963
2480
118
N 8
W 5
AC
AC
1 N
AWQ
A W
ELL
AC
TFS1
-3A
gwam
bien
tN
AWQ
AA
CT
08/1
8/20
0411
00<
.4
NE-
6641
3348
0963
2480
218
N 8
W 5
AC
AC
2 N
AWQ
A W
ELL
AC
TFS1
-3B
gwam
bien
tN
AWQ
AA
CT
08/1
8/20
0413
30<
.4
NE-
6741
3348
0963
2480
318
N 8
W 5
AC
AC
3 N
AWQ
A W
ELL
AC
TFS1
-3C
gwam
bien
tN
AWQ
AA
CT
08/1
8/20
0412
30<
.4
NE-
6841
3350
0963
2470
118
N 8
W 5
AB
DD
1 N
AWQ
A W
ELL
AC
TFS1
-4A
gwam
bien
tN
AWQ
AA
CT
08/1
7/20
0415
00<
.4
NE-
6941
3350
0963
2470
218
N 8
W 5
AB
DD
2 N
AWQ
A W
ELL
AC
TFS1
-4B
gwam
bien
tN
AWQ
AA
CT
08/1
7/20
0416
00<
.4
NE-
7041
3350
0963
2470
318
N 8
W 5
AB
DD
3 N
AWQ
A W
ELL
AC
TFS1
-4C
gwam
bien
tN
AWQ
AA
CT
08/1
7/20
0415
30<
.4
NE-
7141
3412
1014
1450
119
N 3
8W33
DD
DA
1gw
ambi
ent
NAW
QA
HPG
W<
.4
NE-
7241
3850
0974
2580
119
N 3
W 6
CB
CB
1gw
ambi
ent
NAW
QA
HPG
W07
/19/
2004
1100
< .4
NE-
7341
4343
0965
9580
120
N 4
E 5C
CD
C1
CN
BR
LUSC
R1
CO
-13
gwam
bien
tN
AWQ
AA
CT
09/0
9/20
0410
00<
.4
NE-
7441
4527
0970
9410
121
N 2
E35A
BA
A1
CN
BR
LUSC
R1
S-11
gwam
bien
tN
AWQ
AA
CT
08/1
9/20
0411
00<
.4
NE-
7541
4748
1000
9090
121
N 2
5W13
AB
AA
1gw
ambi
ent
NAW
QA
HPG
W06
/14/
2004
1000
< .4
NE-
7642
0326
1022
5320
124
N 4
4W16
DB
DB
1gw
ambi
ent
NAW
QA
HPG
W06
/08/
2004
1600
< .4
38 Perchlorate Data for Streams and Groundwater in Selected Areas of the United States, 2004Ta
ble
4.
Perc
hlor
ate
conc
entra
tions
at s
elec
ted
surfa
ce-w
ater
and
gro
undw
ater
site
s in
the
Unite
d St
ates
.—Co
ntin
ued
[USG
S, U
.S. G
eolo
gica
l Sur
vey;
μg/
L, m
icro
gram
s per
Lite
r; sw
, sur
face
wat
er; g
w, g
roun
dwat
er; N
AWQ
A, N
atio
nal W
ater
Qua
lity
Ass
essm
ent p
rogr
am; C
OO
P, F
eder
al/S
tate
coo
pera
tive
proj
ect;
EPA
LIPS
, La
ndsc
ape
Indi
cato
rs p
roje
ct; S
WTR
END
, Sur
face
Wat
er T
rend
s net
wor
k; A
ZDEQ
, Ariz
ona
Dep
artm
ent o
f Env
ironm
enta
l Qua
lity;
GA
MA
, Cal
iforn
ia G
roun
dwat
er A
mbi
ent M
onito
ring
and
Ass
essm
ent;
RIO
G, R
io G
rand
e Va
lley;
UC
OL,
Upp
er C
olor
ado
Riv
er B
asin
; SPL
T, S
outh
Pla
tte R
iver
Bas
in; I
AG
WM
, Iow
a G
roun
dwat
er M
onito
ring
Net
wor
k; H
PGW
, Hig
h Pl
ains
Reg
iona
l Gro
und
Wat
er S
tudy
; TA
NC
, Tr
ansp
ort o
f Ant
hrop
ogen
ic a
nd N
atur
al C
onta
min
ants
Stu
dy; S
EWA
RD
, City
of S
ewar
d, N
ebra
ska.
; AC
T, A
gric
ultu
ral C
hem
ical
Tra
nspo
rt st
udy;
CN
BR
, Cen
tral N
ebra
ska
Bas
ins;
TR
IVER
, Ton
gue
Riv
er
Surf
ace-
Wat
er-Q
ualit
y M
onito
ring
Net
wor
k; <
, les
s tha
n]
Map
iden
tifi-
catio
n nu
mbe
r (fi
gs. 2
–9)
Site
num
ber
Site
nam
eSi
te ty
peSa
mpl
e ty
peU
SGS
Pr
ogra
mU
SGS
Proj
ect
Sam
ple
date
(m
onth
/day
/ye
ar)
Sam
ple
time
(24
hour
)
Perc
hlor
ate
conc
entr
atio
n (μ
g/L)
NE-
7742
0458
1012
7020
124
N 3
6W 2
DA
BC
1gw
ambi
ent
NAW
QA
HPG
W06
/08/
2004
1200
< 0.
4
NE-
7842
0515
1013
6390
124
N 3
7W 4
AC
BB
1gw
ambi
ent
NAW
QA
HPG
W06
/23/
2004
1000
1.5
7
NE-
7942
0821
0993
5110
125
N 2
0W13
AD
AC
1gw
ambi
ent
NAW
QA
HPG
W06
/24/
2004
1100
.45
NE-
8042
1317
1015
4020
126
N 3
9W19
AD
CB
1gw
ambi
ent
NAW
QA
HPG
W06
/16/
2004
1000
< .4
NE-
8142
2120
1021
7530
127
N 4
3W 2
AA
DB
1gw
ambi
ent
NAW
QA
HPG
W06
/16/
2004
1300
.42
NE-
8242
2138
1012
8260
128
N 3
6W36
CB
BB
1gw
ambi
ent
NAW
QA
HPG
W06
/15/
2004
< .4
NE-
8342
2830
1014
1110
129
N 3
7W20
DC
DA
1gw
ambi
ent
NAW
QA
HPG
W06
/09/
2004
1100
< .4
NE-
8442
4403
1002
5350
132
N 2
7W24
AC
BB
1gw
ambi
ent
NAW
QA
HPG
W06
/03/
2004
1100
1.2
8
NE-
8542
5154
1003
4230
133
N 2
8W 1
BB
1gw
ambi
ent
NAW
QA
HPG
W06
/09/
2004
< .4
NM
-01
0827
6500
Rio
Gra
nde
belo
w T
aos J
unct
ion
Brid
ge n
ear T
aos,
NM
swam
bien
tC
OO
P07
/22/
2004
1230
1.0
6
NM
-02
0831
3000
Rio
Gra
nde
at O
tow
i Brid
ge, N
Msw
ambi
ent
CO
OP
07/2
2/20
0412
10<
.4
NM
-03
0831
9000
Rio
Gra
nde
at S
an F
elip
e, N
Msw
ambi
ent
CO
OP
07/1
9/20
0412
00<
.4
NM
-04
0833
1000
Rio
Gra
nde
at Is
leta
, NM
swam
bien
tC
OO
P07
/13/
2004
1140
< .4
NM
-05
0935
5500
San
Juan
Riv
er n
ear A
rchu
leta
, NM
swam
bien
tC
OO
P07
/29/
2004
1500
< .4
NM
-06
0936
4500
Ani
mas
Riv
er a
t Far
min
gton
, NM
swam
bien
tC
OO
P07
/01/
2004
0800
2.0
6
NM
-07
0936
5000
San
Juan
Riv
er a
t Far
min
gton
, NM
swam
bien
tC
OO
P07
/01/
2004
1205
< .4
NM
-08
0936
8000
San
Juan
Riv
er a
t Shi
proc
k, N
Msw
ambi
ent
CO
OP
06/3
0/20
0413
05 1
.69
NV-
0109
4196
783
Las V
egas
Was
h be
low
Fla
min
go W
ash
Con
flu-
ence
nea
r Las
Veg
as, N
Vsw
blan
kN
AWQ
ASW
TREN
D08
/17/
2004
1020
< .4
NV-
0109
4196
783
Las V
egas
Was
h be
low
Fla
min
go W
ash
Con
flu-
ence
nea
r Las
Veg
as, N
Vsw
ambi
ent
NAW
QA
SWTR
END
08/1
7/20
0410
30 6
.23
NV-
0109
4196
783
Las V
egas
Was
h be
low
Fla
min
go W
ash
Con
flu-
ence
nea
r Las
Veg
as, N
Vsw
repl
icat
eN
AWQ
ASW
TREN
D08
/17/
2004
1040
2.7
NV-
0210
3090
10Ea
st F
ork
Car
son
Riv
er n
ear D
ress
lerv
ille,
NV
swam
bien
tN
AWQ
ASW
TREN
D08
/12/
2004
1010
< .4
NV-
0310
3476
99Tr
ucke
e R
iver
at C
halk
Blu
ff Tr
eatm
ent P
lant
In
take
nea
r Ren
o, N
Vsw
ambi
ent
NAW
QA
SWTR
END
08/1
8/20
0409
10<
.4
NV-
0410
3505
00Tr
ucke
e R
iver
at C
lark
, NV
swam
bien
tN
AWQ
ASW
TREN
D08
/09/
2004
1115
< .4
OH
-01
0326
7900
Mad
Riv
er a
t St.
Paris
Pik
e at
Eag
le C
ity, O
Hsw
ambi
ent
EPA
LIPS
09/0
7/20
0411
00<
.4
OH
-02
0418
6500
Aug
laiz
e R
iver
nea
r For
t Jen
ning
s, O
Hsw
ambi
ent
EPA
LIPS
09/0
8/20
0411
00<
.4
OH
-02
0418
6500
Aug
laiz
e R
iver
nea
r For
t Jen
ning
s, O
Hsw
ambi
ent
EPA
LIPS
10/2
0/20
0409
30<
.4
Tables 1, 3–6 39Ta
ble
4.
Perc
hlor
ate
conc
entra
tions
at s
elec
ted
surfa
ce-w
ater
and
gro
undw
ater
site
s in
the
Unite
d St
ates
.—Co
ntin
ued
[USG
S, U
.S. G
eolo
gica
l Sur
vey;
μg/
L, m
icro
gram
s per
Lite
r; sw
, sur
face
wat
er; g
w, g
roun
dwat
er; N
AWQ
A, N
atio
nal W
ater
Qua
lity
Ass
essm
ent p
rogr
am; C
OO
P, F
eder
al/S
tate
coo
pera
tive
proj
ect;
EPA
LIPS
, La
ndsc
ape
Indi
cato
rs p
roje
ct; S
WTR
END
, Sur
face
Wat
er T
rend
s net
wor
k; A
ZDEQ
, Ariz
ona
Dep
artm
ent o
f Env
ironm
enta
l Qua
lity;
GA
MA
, Cal
iforn
ia G
roun
dwat
er A
mbi
ent M
onito
ring
and
Ass
essm
ent;
RIO
G, R
io G
rand
e Va
lley;
UC
OL,
Upp
er C
olor
ado
Riv
er B
asin
; SPL
T, S
outh
Pla
tte R
iver
Bas
in; I
AG
WM
, Iow
a G
roun
dwat
er M
onito
ring
Net
wor
k; H
PGW
, Hig
h Pl
ains
Reg
iona
l Gro
und
Wat
er S
tudy
; TA
NC
, Tra
nspo
rt of
Ant
hrop
ogen
ic a
nd N
atur
al C
onta
min
ants
Stu
dy; S
EWA
RD
, City
of S
ewar
d, N
ebra
ska.
; AC
T, A
gric
ultu
ral C
hem
ical
Tra
nspo
rt st
udy;
CN
BR
, Cen
tral N
ebra
ska
Bas
ins;
TR
IVER
, Ton
gue
Riv
er S
urfa
ce-W
ater
-Qua
lity
Mon
itorin
g N
etw
ork;
<, l
ess t
han]
Map
iden
tifi-
catio
n nu
mbe
r (fi
gs. 2
–9)
Site
num
ber
Site
nam
eSi
te ty
peSa
mpl
e ty
peU
SGS
Pr
ogra
mU
SGS
Proj
ect
Sam
ple
date
(m
onth
/day
/ye
ar)
Sam
ple
time
(24
hour
)
Perc
hlor
ate
conc
entr
atio
n (μ
g/L)
WI-
0605
3418
65Pa
rker
Cre
ek n
ear R
iver
Fal
ls, W
Isw
ambi
ent
EPA
LIPS
10/0
6/20
0409
25<
0.4
WI-
0705
3659
62B
lack
Cre
ek n
ear F
airc
hild
, WI
swam
bien
tEP
ALI
PS10
/05/
2004
1015
< .4
WI-
0805
3670
64C
ranb
erry
Cre
ek a
t Mer
idea
n, W
Isw
ambi
ent
EPA
LIPS
10/0
5/20
0414
30 .9
3
WI-
0905
3678
03Si
lver
Cre
ek n
ear A
rland
, WI
swam
bien
tEP
ALI
PS10
/04/
2004
1605
< .4
WI-
1005
3814
41So
per C
reek
at C
atar
act,
WI
swam
bien
tEP
ALI
PS09
/14/
2004
0740
< .4
WI-
1105
3824
15Li
ttle
La C
ross
e R
iver
nea
r Mel
vina
, WI
swam
bien
tEP
ALI
PS09
/14/
2004
0910
< .4
WI-
1205
4041
139
Wes
t Bra
nch
Bar
aboo
Riv
er a
t Hill
sbor
o, W
Isw
ambi
ent
EPA
LIPS
09/1
3/20
0410
20<
.4
WI-
1305
4067
125
Haw
kins
Cre
ek a
t Roc
kbrid
ge, W
Isw
ambi
ent
EPA
LIPS
09/1
3/20
0408
55<
.4
WI-
1405
4072
17C
rook
ed C
reek
at B
osco
bel,
WI
swam
bien
tEP
ALI
PS09
/07/
2004
1300
< .4
WI-
1505
4128
80R
oger
s Bra
nch
near
Lan
cast
er, W
Isw
ambi
ent
EPA
LIPS
09/0
8/20
0412
50<
.4
WI-
1605
4141
33Li
ttle
Plat
te R
iver
nea
r Arth
ur, W
Isw
ambi
ent
EPA
LIPS
09/0
8/20
0407
10 .9
6
WI-
1605
4141
33Li
ttle
Plat
te R
iver
nea
r Arth
ur, W
Isw
repl
icat
eEP
ALI
PS09
/08/
2004
0720
< .4
WI-
1705
4149
24G
alen
a R
iver
at J
enki
nsvi
lle, W
Isw
ambi
ent
EPA
LIPS
09/0
9/20
0409
20<
.4
WI-
1805
4363
61Li
ttle
Suga
r Riv
er W
est B
ranc
h at
Mon
ticel
lo, W
Isw
ambi
ent
EPA
LIPS
09/1
0/20
0408
15 1
.41
WY-
0106
2797
95C
row
Cre
ek a
t Mou
th a
t Pah
aska
, WY
swam
bien
tC
OO
PTR
IVER
08/2
0/20
0412
30<
.4
WY-
0206
2999
80To
ngue
Riv
er a
t Mon
arch
, WY
swam
bien
tC
OO
PTR
IVER
07/1
4/20
0416
45 .4
9
WY-
0306
3057
00G
oose
Cre
ek n
ear A
cme,
WY
swam
bien
tC
OO
PTR
IVER
07/1
5/20
0408
10<
.4
WY-
0406
3062
50Pr
airie
Dog
Cre
ek n
ear A
cme,
WY
swam
bien
tC
OO
PTR
IVER
07/1
4/20
0411
00<
.4
40 Perchlorate Data for Streams and Groundwater in Selected Areas of the United States, 2004
Table 5. Summary of perchlorate detections and concentrations in selected states.[μg/L, micrograms per liter; <, less than]
StateNumber of samples
Number of samples with detectable con-centration (0.4 μg/L or
greater)
Percent of samples with concentration 1.0 μg/L or greater
Percent of samples with concentration 2.0 μg/L or greater
Percent of samples with concentration 5.0 μg/L or greater
Table 6. Perchlorate concentrations in streams sampled twice during the reconnaissance study.
Map identifica-tion number
(figs. 2–9)Site number Site name
Sample date (month/day/
year)
Sample time (24 hours)
Perchlorate concen-tration (ug/L)
IL-01 05525500 Sugar Creek at Milford, IL 08/06/2004 1005 <0.4IL-01 05525500 Sugar Creek at Milford, IL 12/15/2004 1245 <.4IL-02 05572000 Sangamon River at Monticello, IL 08/05/2004 1330 <.4IL-02 05572000 Sangamon River at Monticello, IL 10/05/2004 0915 <.4
MN-04 05320270 Little Cobb River near Beauford, MN 08/23/2004 1310 .8MN-04 05320270 Little Cobb River near Beauford, MN 10/07/2004 1005 <.4NE-01 06800000 Maple Creek near Nickerson, NE 07/13/2004 1030 <.4NE-01 06800000 Maple Creek near Nickerson, NE 10/12/2004 0930 <.4OH-02 04186500 Auglaize River near Fort Jennings, OH 09/08/2004 1100 <.4OH-02 04186500 Auglaize River near Fort Jennings, OH 10/20/2004 0930 <.4
Appendix
42 Perchlorate Data for Streams and Groundwater in Selected Areas of the United States, 2004
Appendix 1. Project support.
Core funding was provided by the U.S. Geological Survey's Central Region Integrated Science Program.
Collection of samples from such a large part of the United States was only possible because of the willingness of personnel working on Federal/State cooperative (COOP) projects, the National Water-Quality Assessment program (NAWQA) , and U.S. Geological Survey/ U.S. Environmental Protection Agency Landscape Indicators (EPALIPS) project to collect an additional water sample. Collection of perchlorate samples was supported as part of the following programs.
Federal/State Cooperative Program
Water Science Center Project/cooperator Description
Arkansas Master well monitoringArizona Arizona Department of Environmental
Quality (AZDEQ)California Groundwater Ambient Monitoring and
Assessment (GAMA)/California State Water Resources Control Board
An assessment of groundwater quality in areas where public supply wells are an important source of drink-ing water (Wright and others, 2005). Perchlorate samples are routinely analyzed by a commercial laboratory as part of the GAMA project, but addi-tional samples were collected for this study.
Colorado Water Quality in the Arkansas River basin near Pueblo, CO/ Southeastern Colorado Water Activity Enterprise
Monitoring in the Fountain and Monument Creek wa-tersheds from 1981 through 2006 to evaluate the ef-fects of stormflow and wastewater-treatment effluent on Fountain and Monument Creeks in the Colorado Springs, Colorado area. (Mau and others, 2007)
Iowa Iowa Groundwater Monitoring Net-work (IAGWM) /Iowa Department of Natural Resources
38 of 150 municipal supply wells completed in shallow alluvial deposits that are susceptible to contamina-tion from land surface were sampled for perchlorate. (Littin, 2004)
Montana Tongue River Surface-Water-Quality Monitoring Network (TRIVER)
Monitoring surface water within or near the Powder River structural basin in northeastern Wyoming and southeastern Montana to characterize water quality in streams draining an area of coalbed natural gas development. (Clark and Mason, 2007)
Nebraska City of Seward (SEWARD) A study of groundwater age and quality was conducted to improve understanding of: (1) travel times from recharge areas to public-supply wells, (2) the effects of geochemical reactions in the aquifer on water quality, and (3) how water quality has changed his-torically in response to land-use practices. (Stanton and others, 2007)
New Mexico Statewide monitoring
National Water-Quality Assessment Program (NAWQA)
Topical Study Study Unit Description
Surface-WaterTrends (SWTREND) Central Arizona Basins Ambient resource assessment over decades with a regional and national perspective to evaluate eco-logical conditions and the occurrence, trends, and transport of nutrients and pesticides in rivers and streams. Twenty-five surface-water sites on both medium-sized rivers indicative of a single land use and large rivers that integrate the effects of agricul-tural and urban land use.
Central Nebraska Basins (CNBR)Eastern Iowa BasinsNevada Basin and RangeOzark Plateaus Rio Grande (RIOG)Santa Ana
Appendix 43
Appendix 1. Project support.—Continued
Core funding was provided by the U.S. Geological Survey's Central Region Integrated Science Program.
Collection of samples from such a large part of the United States was only possible because of the willingness of personnel working on Federal/State cooperative (COOP) projects, the National Water-Quality Assessment program (NAWQA) , and U.S. Geological Survey/ U.S. Environmental Protection Agency Landscape Indicators (EPALIPS) project to collect an additional water sample. Collection of perchlorate samples was supported as part of the following programs.
National Water-Quality Assessment Program (NAWQA)—Continued
Topical Study Study Unit Description
Agricultural Chemical Transport (ACT)
Central Nebraska Basins A study to (1) understand the links between the sources of water and agricultural chemicals (nutrients and pesticides) and their behavior and transport through the environment; (2) predict the behavior and transport of water and agricultural chemicals in other agricultural areas not being studied; and (3) evalu-ate what the study results mean for management of water and water quality in a variety of agricultural settings. (Fredrick and others, 2006)
Transport of Anthropogenic and Natu-ral Contaminants Study (TANC)
Central Nebraska Basins Study of the hydrogeology and geochemistry of the High Plains aquifer in a 42-square-mile study area at York, Nebraska that contains the zone of contri-bution to a public supply well (PSW). Data were used to describe factors controlling the transport of selected anthropogenic and natural contaminants to PSWs. (Landon and others, 2008)
Groundwater trends South Platte River Basin
Topical Study Description
High Plains Regional Ground Water Study (HPGW)
Water quality of the High Plains aquifer was assessed for the period 1999-2004 through a strati-fied, nested group of studies designed to assess linkages between the quality of water recharg-ing the aquifer, the effect of transport through the hydrologic system on water quality, and the quality of the resource used for human consumption and agricultural applications. (McMahon and others, 2007)
There were 110 third order streams draining agricultural watersheds in 10 corn-belt States that were sampled in September 2004 during base flow when most streamflow was derived from groundwater discharge. Samples collected at base flow integrated the water quality of a water-shed over temporal and geographical scales.
Publishing support provided by:Rolla Publishing Service Center
For more information concerning this publication, contact:Director, USGS Iowa Water Science Center400 South Clinton Street, Room 269Iowa City, IA 52240(319) 337–4191
Or visit the Iowa Water Science Center Web site at:http://ia.water.usgs.gov