21
WHO/SDE/FWC/16.46 Perchlorate in Drinking-water Background document for development of WHO Guidelines for Drinking-water Quality
| Date post: | 29-Apr-2018 |
| Category: |
Documents |
| Upload: | nguyenthuy |
| View: | 215 times |
| Download: | 1 times |
WHO/SDE/FWC/16.46
Perchlorate in Drinking-water
Background document for development of
WHO Guidelines for Drinking-water Quality
World Health Organization 2016
All rights reserved. Publications of the World Health Organization can be obtained from WHO Press,
World Health Organization, 20 Avenue Appia, 1211 Geneva 27, Switzerland (tel.: +41 22791 3264;
fax: +41 22791 4857; email: [email protected]).
Requests for permission to reproduce or translate WHO publications – whether for sale or for non-
commercial distribution – should be addressed to WHO Press at the above address (fax: +41
22791 4806; email: [email protected]).
The designations employed and the presentation of the material in this publication do not imply the
expression of any opinion whatsoever on the part of the World Health Organization concerning the
legal status of any country, territory, city or area or of its authorities, or concerning the delimitation of
its frontiers or boundaries. Dotted lines on maps represent approximate border lines for which there
may not yet be full agreement.
The mention of specific companies or of certain manufacturers’ products does not imply that they are
endorsed or recommended by the World Health Organization in preference to others of a similar
nature that are not mentioned. Errors and omissions excepted, the names of proprietary products are
distinguished by initial capital letters.
All reasonable precautions have been taken by the World Health Organization to verify the
information contained in this publication. However, the published material is being distributed
without warranty of any kind, either expressed or implied. The responsibility for the interpretation and
use of the material lies with the reader. In no event shall the World Health Organization be liable for
damages arising from its use.
The named authors alone are responsible for the views expressed in this publication.
iii
Preface
Access to safe drinking-water is essential to health, a basic human right and a component of effective
policy for health protection. A major World Health Organization (WHO) function to support access to
safe drinking-water is the responsibility “to propose ... regulations, and to make recommendations
with respect to international health matters ...”, including those related to drinking-water safety and
management.
The first WHO document dealing specifically with public drinking-water quality was published in
1958 as International Standards for Drinking-water. It was subsequently revised in 1963 and in 1971
under the same title. In 1984–1985, the first edition of the WHO Guidelines for Drinking-water
Quality (GDWQ) was published in three volumes: Volume 1, Recommendations; Volume 2, Health
criteria and other supporting information; and Volume 3, Surveillance and control of community
supplies. Second editions of these volumes were published in 1993, 1996 and 1997, respectively.
Addenda to Volumes 1 and 2 of the second edition were published in 1998, addressing selected
chemicals. An addendum on microbiological aspects reviewing selected microorganisms was
published in 2002. The third edition of the GDWQ was published in 2004, the first addendum to the
third edition was published in 2006 and the second addendum to the third edition was published in
2008. The fourth edition was published in 2011, and the first addendum to the fourth edition was
published in 2017.
The GDWQ are subject to a rolling revision process. Through this process, microbial, chemical and
radiological aspects of drinking-water are subject to periodic review, and documentation related to
aspects of protection and control of drinking-water quality is accordingly prepared and updated.
Since the first edition of the GDWQ, WHO has published information on health criteria and other
supporting information to the GDWQ, describing the approaches used in deriving guideline values
and presenting critical reviews and evaluations of the effects on human health of the substances or
contaminants of potential health concern in drinking-water. In the first and second editions, these
constituted Volume 2 of the GDWQ. Since publication of the third edition, they comprise a series of
free-standing monographs, including this one.
For each chemical contaminant or substance considered, a background document evaluating the risks
for human health from exposure to the particular chemical in drinking-water was prepared. The draft
health criteria document was submitted to a number of scientific institutions and selected experts for
peer review. The draft document was also released to the public domain for comment. Comments
were carefully considered and addressed as appropriate, taking into consideration the processes
outlined in the Policies and Procedures Used in Updating the WHO Guidelines for Drinking-water
Quality (http://apps.who.int/iris/bitstream/10665/70050/1/WHO_HSE_WSH_09.05_eng.pdf) and the
WHO Handbook for Guideline Development (http://www.who.int/publications/guidelines/
handbook_2nd_ed.pdf), and the revised draft was submitted for final evaluation at expert
consultations.
During the preparation of background documents and at expert consultations, careful consideration
was given to information available in previous risk assessments carried out by the International
Programme on Chemical Safety, in its Environmental Health Criteria monographs and Concise
International Chemical Assessment Documents, the International Agency for Research on Cancer, the
Joint Food and Agriculture Organization of the United Nations (FAO)/WHO Meeting on Pesticide
Residues and the Joint FAO/WHO Expert Committee on Food Additives (which evaluates
contaminants such as lead, cadmium, nitrate and nitrite, in addition to food additives).
Further up-to-date information on the GDWQ and the process of their development is available on the
WHO website and in the current edition of the GDWQ.
iv
Acknowledgements
The first draft of Perchlorate in drinking-water, Background document for development of WHO
Guidelines for Drinking-water Quality was prepared by Professor Shane Snyder, University of
Arizona, United States of America (USA), to whom special thanks are due.
The work of the following experts was crucial in the development of this document and others in the
first addendum to the fourth edition:
Dr M. Asami, National Institute of Public Health, Japan
Dr R.J. Bevan, Cranfield University, United Kingdom
Dr J. Cotruvo, Joseph Cotruvo & Associates and NSF International WHO Collaborating Centre,
USA
Dr A. Eckhardt, Umweltbundesamt (Federal Environment Agency), Germany
Professor J.K. Fawell, United Kingdom
Ms M. Giddings, Health Canada, Canada
Dr A. Hirose, National Institute of Health Sciences, Japan
Dr P. Marsden, Drinking Water Inspectorate, United Kingdom
Professor Y. Matsui, Hokkaido University, Japan
Dr M.E. Meek, University of Ottawa, Canada
Dr E. Ohanian, Environmental Protection Agency, USA
Professor C.N. Ong, National University of Singapore, Singapore
Dr S. Ramasamy, Environmental Protection Agency, USA
Professor S. Snyder, University of Arizona, USA
The draft text was discussed at the expert consultations for the first addendum to the fourth edition of
the GDWQ, held on 2–5 December 2013 and 23–26 February 2015. The final version of the
document takes into consideration comments from both peer reviewers and the public.
The coordinator was Ms J. De France, WHO Headquarters, with support from Mr P. Callan, Australia.
Strategic direction was provided by Mr B. Gordon, WHO Headquarters. Dr A. Tritscher and Dr P.
Verger, WHO Headquarters, provided liaisons with the Joint FAO/WHO Expert Committee on Food
Additives and the Joint FAO/WHO Meeting on Pesticide Residues, whereas Dr R. Brown and Ms C.
Vickers, WHO Headquarters, provided liaisons with the International Programme on Chemical
Safety. Dr M. Perez contributed on behalf of the Radiation Programme, WHO Headquarters. Dr R.
Yadav, WHO Headquarters, provided input on pesticides added to drinking-water for public health
purposes.
Ms P. Ward and Ms L. Robinson provided invaluable administrative support at the expert
consultations and throughout the review and publication process. Ms M. Sheffer of Canada and Dr H.
Cadman of Australia were responsible for the scientific editing of the document.
Many individuals from various countries contributed to the development of the GDWQ. The efforts of
all who contributed to the preparation of this document and in particular those who provided peer or
public domain review comments are greatly appreciated.
v
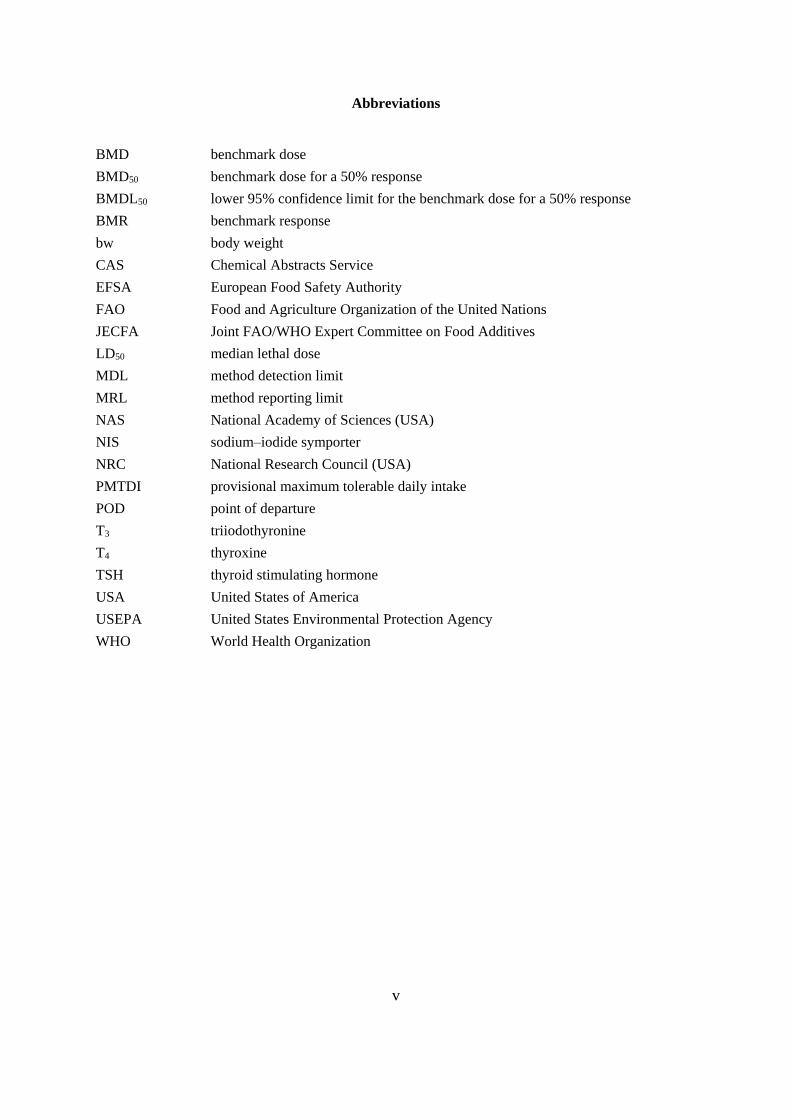
Abbreviations
BMD benchmark dose
BMD50 benchmark dose for a 50% response
BMDL50 lower 95% confidence limit for the benchmark dose for a 50% response
BMR benchmark response
bw body weight
CAS Chemical Abstracts Service
EFSA European Food Safety Authority
FAO Food and Agriculture Organization of the United Nations
JECFA Joint FAO/WHO Expert Committee on Food Additives
LD50 median lethal dose
MDL method detection limit
MRL method reporting limit
NAS National Academy of Sciences (USA)
NIS sodium–iodide symporter
NRC National Research Council (USA)
PMTDI provisional maximum tolerable daily intake
POD point of departure
T3 triiodothyronine
T4 thyroxine
TSH thyroid stimulating hormone
USA United States of America
USEPA United States Environmental Protection Agency
WHO World Health Organization
vi
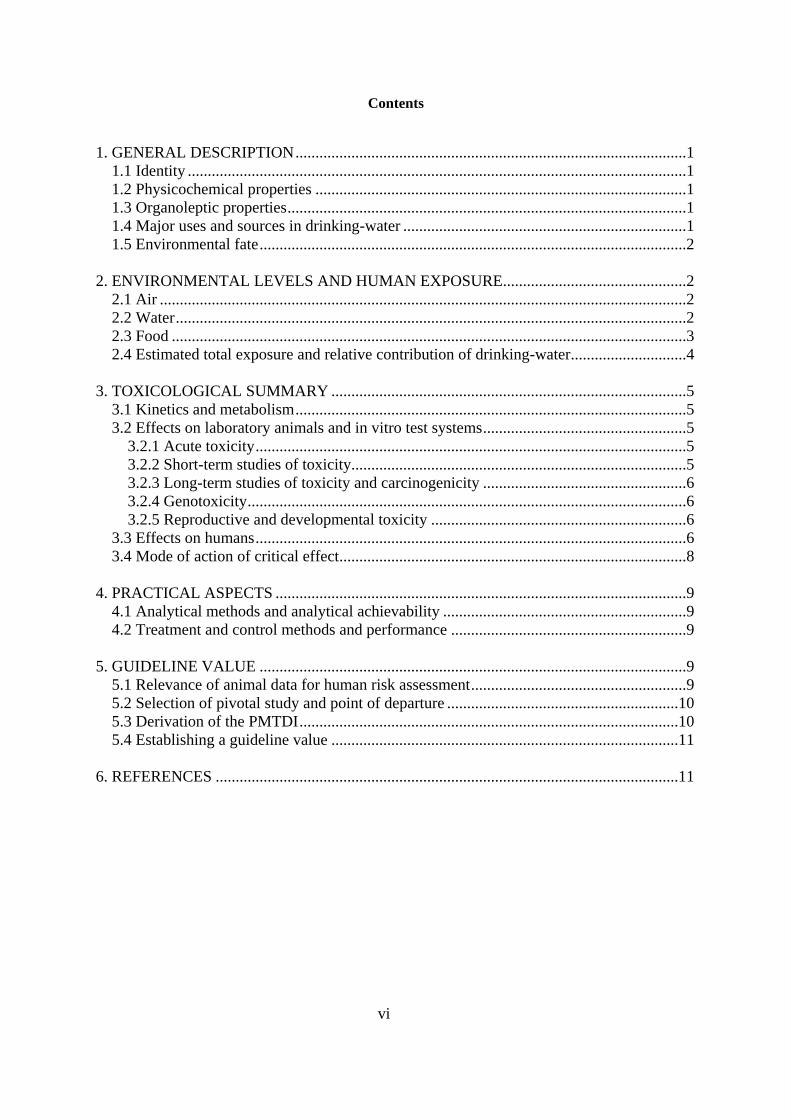
Contents
1. GENERAL DESCRIPTION ..................................................................................................1
1.1 Identity .............................................................................................................................1
1.2 Physicochemical properties .............................................................................................1
1.3 Organoleptic properties ....................................................................................................1
1.4 Major uses and sources in drinking-water .......................................................................1
1.5 Environmental fate ...........................................................................................................2
2. ENVIRONMENTAL LEVELS AND HUMAN EXPOSURE..............................................2
2.1 Air ....................................................................................................................................2
2.2 Water ................................................................................................................................2
2.3 Food .................................................................................................................................3
2.4 Estimated total exposure and relative contribution of drinking-water .............................4
3. TOXICOLOGICAL SUMMARY .........................................................................................5
3.1 Kinetics and metabolism ..................................................................................................5
3.2 Effects on laboratory animals and in vitro test systems ...................................................5
3.2.1 Acute toxicity ............................................................................................................5
3.2.2 Short-term studies of toxicity....................................................................................5
3.2.3 Long-term studies of toxicity and carcinogenicity ...................................................6
3.2.4 Genotoxicity ..............................................................................................................6
3.2.5 Reproductive and developmental toxicity ................................................................6
3.3 Effects on humans ............................................................................................................6
3.4 Mode of action of critical effect .......................................................................................8
4. PRACTICAL ASPECTS .......................................................................................................9
4.1 Analytical methods and analytical achievability .............................................................9
4.2 Treatment and control methods and performance ...........................................................9
5. GUIDELINE VALUE ...........................................................................................................9
5.1 Relevance of animal data for human risk assessment ......................................................9
5.2 Selection of pivotal study and point of departure ..........................................................10
5.3 Derivation of the PMTDI ...............................................................................................10
5.4 Establishing a guideline value .......................................................................................11
6. REFERENCES ....................................................................................................................11
1
1. GENERAL DESCRIPTION
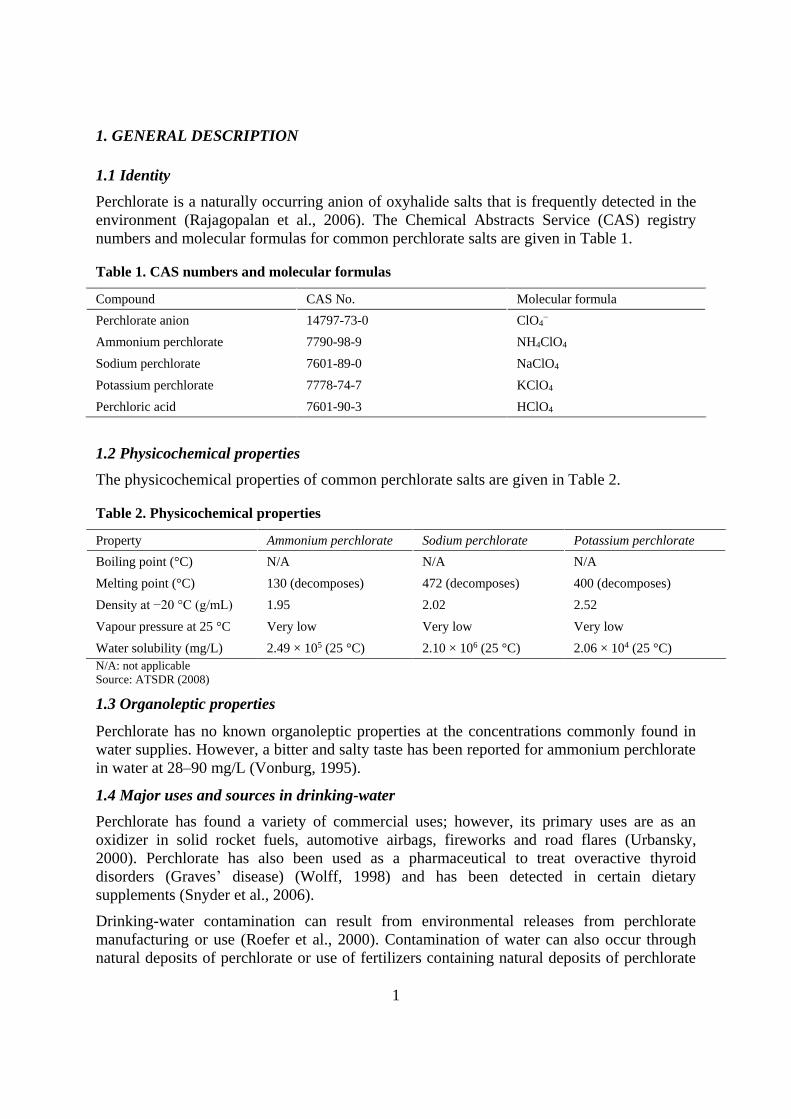
1.1 Identity
Perchlorate is a naturally occurring anion of oxyhalide salts that is frequently detected in the
environment (Rajagopalan et al., 2006). The Chemical Abstracts Service (CAS) registry
numbers and molecular formulas for common perchlorate salts are given in Table 1.
Table 1. CAS numbers and molecular formulas
Compound CAS No. Molecular formula
Perchlorate anion 14797-73-0 ClO4−
Ammonium perchlorate 7790-98-9 NH4ClO4
Sodium perchlorate 7601-89-0 NaClO4
Potassium perchlorate 7778-74-7 KClO4
Perchloric acid 7601-90-3 HClO4
1.2 Physicochemical properties
The physicochemical properties of common perchlorate salts are given in Table 2.
Table 2. Physicochemical properties
Property Ammonium perchlorate Sodium perchlorate Potassium perchlorate
Boiling point (°C) N/A N/A N/A
Melting point (°C) 130 (decomposes) 472 (decomposes) 400 (decomposes)
Density at −20 °C (g/mL) 1.95 2.02 2.52
Vapour pressure at 25 °C Very low Very low Very low
Water solubility (mg/L) 2.49 × 10⁵ (25 °C) 2.10 × 10⁶ (25 °C) 2.06 × 10⁴ (25 °C)
N/A: not applicable
Source: ATSDR (2008)
1.3 Organoleptic properties
Perchlorate has no known organoleptic properties at the concentrations commonly found in
water supplies. However, a bitter and salty taste has been reported for ammonium perchlorate
in water at 28–90 mg/L (Vonburg, 1995).
1.4 Major uses and sources in drinking-water
Perchlorate has found a variety of commercial uses; however, its primary uses are as an
oxidizer in solid rocket fuels, automotive airbags, fireworks and road flares (Urbansky,
2000). Perchlorate has also been used as a pharmaceutical to treat overactive thyroid
disorders (Graves’ disease) (Wolff, 1998) and has been detected in certain dietary
supplements (Snyder et al., 2006).
Drinking-water contamination can result from environmental releases from perchlorate
manufacturing or use (Roefer et al., 2000). Contamination of water can also occur through
natural deposits of perchlorate or use of fertilizers containing natural deposits of perchlorate
PERCHLORATE IN DRINKING-WATER
2
(Foubister, 2006). Atmospheric deposition of perchlorate also contributes to the ubiquitous
presence of perchlorate in water (Rajagopalan et al., 2006).
In some arid regions, deposits containing high concentrations of perchlorate have been
discovered, most notably co-occurring with nitrates harvested as fertilizers used
commercially since the mid-1840s (Urbansky et al., 2001). These natural deposits are
primarily attributed to atmospheric formation and deposition in rainfall (Dasgupta et al.,
2005).
Perchlorate also forms in hypochlorite solutions to varying degrees, depending on the
hypochlorite concentration, age and storage conditions (Asami, Kosaka & Kunikane, 2009;
Stanford et al., 2011). Similarly to chlorate, perchlorate formation increases in hypochlorite
solutions stored in warmer temperatures for extended periods of time. In addition to
conventional hypochlorite solutions, perchlorate has also been identified in the hypochlorite
produced by on-site generators using electrolysis (Snyder, Vanderford & Rexing, 2005).
1.5 Environmental fate
The perchlorate anion is highly stable in water and is capable of being transported long
distances in water without significant degradation (Dasgupta et al., 2006). Perchlorate
generally is not well retained by soils, with more than 90% of perchlorate remaining in the
aqueous phase (Urbansky & Brown, 2003). In certain arid climates, sporadic and insufficient
rainwater results in an accumulation of perchlorate in soils (Rajagopalan et al., 2006). Natural
attenuation of perchlorate in water is limited. Perchlorate can be decomposed (reduced) by
certain anaerobic bacteria; however, nitrates and sulfates can inhibit degradation (Dugan et
al., 2009). Some plants can effectively take up perchlorate, providing some attenuation
capacity (Yu et al., 2004). Neither photolysis nor vaporization is known or expected to
significantly affect perchlorate concentrations in water. Perchlorate is a powerful oxidizer and
would not be additionally oxidized during natural processes; however, it may be reduced by
anaerobic bacteria or reducing environments.
2. ENVIRONMENTAL LEVELS AND HUMAN EXPOSURE
2.1 Air
Perchlorate is known to form in the atmosphere and is transferred through rainfall (Ericksen,
1983). Concentrations of perchlorate found in rain and snow are discussed in Section 2.2.
2.2 Water
Perchlorate has near ubiquitous occurrence in water in the nanogram per litre range, which is
due in part to natural formation in the atmosphere and deposition during rain or snow events
(Dasgupta et al., 2005). Using ultra-trace methods, perchlorate has been quantified in
groundwater and surface water (Snyder, Vanderford & Rexing, 2005). Perchlorate is also
known to occur ubiquitously in seawater (Martinelango, Tian & Dasgupta, 2006).
Rainwater in China was recently reported to contain perchlorate at concentrations between
0.35 and 27.3 µg/L, with a mean concentration of 6.37 µg/L (Qin et al., 2014). Conversely, a
study from Harbin, China, showed no detectable levels of perchlorate in rain (method
PERCHLORATE IN DRINKING-WATER
3
detection limit [MDL] for snow water = 0.008 µg/L); however, seasonal detection of
perchlorate in snow was linked to fireworks displays and ranged from 0.02 to 0.15 µg/L (Ye
et al., 2013). In a study of Arctic snow from Nunavut, Canada, a mean perchlorate
concentration of 5.5 ± 3.9 ng/L was measured (Furdui & Tomassini, 2009). Seventy per cent
of samples of rainwater collected between August 2003 and November 2004 in Texas, United
States of America (USA), contained detectable concentrations (MDL = 0.01 µg/L) of
perchlorate, ranging from 0.02 to 1.6 µg/L (Dasgupta et al., 2005). In another study from the
USA conducted from November 2005 through July 2007, a mean perchlorate concentration
of 0.21 ± 0.04 µg/L, with a maximum value of 2.78 µg/L, was found in rainwater after
fireworks displays at holiday celebrations (Munster et al., 2009). Thus, rainwater is well
documented to contain perchlorate formed in the atmosphere at relatively low levels;
however, influences from fireworks can result in elevated levels of perchlorate.
Between 2000 and 2005, the United States Environmental Protection Agency (USEPA)
conducted a survey of 3870 public water systems and found that 160 of the systems (4.1%)
contained perchlorate at concentrations above the method reporting limit (MRL) of 4 µg/L,
and 13 of the systems surveyed had concentrations above 40 µg/L (Brandhuber, Clark &
Morley, 2009). Concentrations of perchlorate in drinking-water at 20 locations in England
and Wales ranged from <0.020 to 2.073 µg/L, with a mean concentration of 0.747 µg/L
(McLaughlin et al., 2011). In the Republic of Korea, 80% of 520 tap water samples were
positive for perchlorate, at detectable concentrations ranging from <1 to 6.1 µg/L, with a
mean concentration of 0.56 µg/L (Her et al., 2011). Seventy-six per cent of water samples
from 13 locations in six states from India contained perchlorate at concentrations above
0.02 µg/L, with a maximum concentration of 6.9 µg/L and a mean concentration of 0.42 µg/L
(Kannan et al., 2009). In the Tone River basin in Japan, with known industrial discharges of
perchlorate, tap water samples contained 0.06–37 µg/L (Kosaka et al., 2007).
The Joint Food and Agriculture Organization of the United Nations (FAO)/WHO Expert
Committee on Food Additives (JECFA) reviewed data from six countries (Canada, China,
India, Japan, Republic of Korea, USA) on the occurrence of perchlorate in water. Analytical
data on 35 073 samples of groundwater and drinking-water indicated that the perchlorate
concentration in 98% of samples was below the limit of reporting. In drinking-water,
perchlorate levels exceeded 20 µg/L in only 1% of the samples (FAO/WHO, 2011).
2.3 Food
Perchlorate is commonly found in foods, likely originating in most cases from natural
deposition from rain (Rajagopalan et al., 2006) and use of fertilizers containing perchlorate
(Dasgupta et al., 2006). Perchlorate is known to accumulate in some marine plants
(Martinelango, Tian & Dasgupta, 2006); the accumulation of perchlorate in aquatic plants
used as a source of iodine has led to the contamination of dietary supplements with
perchlorate, including those marketed as prenatal supplements (Snyder et al., 2006).
Concentrations of perchlorate in food in Ottawa, Canada, ranged from non-detectable to
536 µg/kg, with highest concentration ranges reported in imported food from Guatemala,
Chile and the USA (Wang et al., 2009). In a study of perchlorate in 350 foods and beverages
from various countries, all measured in triplicate, the highest levels were as follows: bottled
water from Portugal at 5.1 µg/L, produce from Guatemala at 463.5 µg/kg, wine from Portugal
at 50.3 µg/L, beer from France at 21.1 µg/L and tap water from the USA at 2.9 µg/L (El Aribi
PERCHLORATE IN DRINKING-WATER
4
et al., 2006). In bottled beverages from Japan, over half contained perchlorate (MRL =
0.05 µg/L), with a maximum concentration of 0.92 µg/L (Asami, Kosaka & Yoshida, 2009).
In the USA, perchlorate was detected in 10 of 21 bottled waters (MRL = 0.05 µg/L), with a
maximum reported concentration of 0.74 µg/L (Snyder, Vanderford & Rexing, 2005).
Based on a recent evaluation of 4731 data points for perchlorate occurrence in foods from six
member states of the European Union, leafy vegetables contained the highest concentrations,
with an average concentration of approximately 77 µg/kg (EFSA, 2014). In a study of food
and water in the Hatay region of Turkey, remarkably similar concentrations of perchlorate in
food and water were reported, at approximately 0.4–0.5 µg/kg or µg/L in all matrices tested
(Sungur & Sangun, 2011). In an evaluation of 31 dietary supplements, 20 contained
detectable levels of perchlorate, with the highest reported concentration of 2400 µg/kg in a
vitamin supplement recommended for pregnant mothers (Snyder et al., 2006).
JECFA reviewed analytical data from 1866 samples of food (vegetables, fruits, rice, milk,
infant formula, fish and fish products, and beverages, such as juices, beer and wine) from six
countries (Canada, China, India, Japan, Republic of Korea, USA), finding perchlorate
concentrations in 33% of the samples to be below the limit of reporting. Weighted mean
perchlorate concentrations in raw vegetables were in the range 4.8–110 μg/kg; in fruits, the
weighted mean concentrations ranged from 0.5 to 28 μg/kg. Other weighted mean perchlorate
concentrations were as follows: rice, 1 μg/kg; whole wheat flour, 3.5 μg/kg; milk, 6.8 μg/kg;
beer, 1 μg/kg; and wine, 6 μg/kg. The mean perchlorate concentrations in human milk in
China and the USA were found to be 19.7 μg/L (range 2.1–136 μg/L) and 9.3 μg/L (range
0.01–411 μg/L), respectively. Based on limited data, the weighted mean perchlorate
concentration in infant formula was 10 μg/kg (FAO/WHO, 2011).
2.4 Estimated total exposure and relative contribution of drinking-water
In a study by the United States Food and Drug Administration, perchlorate intake through
food was highest in infants (aged 6–11 months) and children (aged 2 years), ranging from
0.26 to 0.39 µg/kg body weight (bw) per day. Baby food contributed 49% of the perchlorate
dose in infants, whereas dairy products had the highest contribution (51%) in 2-year-olds and
vegetables contributed the most towards dietary exposure to perchlorate in adults, ranging
from 26% to 38% (Murray et al., 2008). In a review of occurrence data for drinking-water
and food in the USA, one study concluded that for the general population in the USA, the
contribution of perchlorate from food relative to water was roughly 4:1, except for children
aged 6–11 years, for whom the contribution from food was even greater (Huber et al., 2011).
In the Republic of Korea, in an investigation of 39 types of food, Korean adults were exposed
to perchlorate at approximately 0.04 µg/kg bw per day from the diet (Lee, Oh & Oh, 2012). A
recent study from Japan demonstrated that the majority of perchlorate exposure arose from
food rather than water, with intake from water ranging from 0.1 to 4.4 µg/day and intake
from food ranging from 2.5 to 84 µg/day (Asami et al., 2013). Canadian data reviewed by
JECFA showed that mean dietary exposure to perchlorate was approximately 0.04 μg/kg bw
per day for children aged 1–11 years compared with 0.03 μg/kg bw per day for adults,
including women of childbearing age (FAO/WHO, 2011). JECFA also evaluated the data
from the USA described in the previous paragraph (Murray et al., 2008).
PERCHLORATE IN DRINKING-WATER
5
JECFA estimated that international dietary exposure to perchlorate (using the 13
consumption cluster diets of the Food Contamination Monitoring and Assessment
Programme of the Global Environment Monitoring System) was 0.03–0.22 μg/kg bw per day
(FAO/WHO, 2011).
For most geographical locations, exposure to perchlorate from food greatly exceeds that from
water. However, in the relatively rare cases of industrial or agricultural contamination or
unique geographical deposits, exposure to perchlorate from water can exceed that from the
diet.
3. TOXICOLOGICAL SUMMARY
The JECFA monograph on perchlorate served as the primary source of information for the
toxicological evaluation of perchlorate, and the key sections are summarized or taken directly
from that source (FAO/WHO, 2011). The EFSA evaluation of perchlorate, undertaken in
2014, was also evaluated (EFSA, 2014), and it was concluded that the report included no
significant additions to the studies evaluated by JEFCA (FAO/WHO, 2011).
3.1 Kinetics and metabolism
Perchlorate is rapidly absorbed in both humans and experimental animals following oral
exposure (EFSA, 2014). It has been detected in serum, plasma, urine, breast milk and saliva
of humans exposed to the chemical (FAO/WHO, 2011) and exhibits a short half-life of 6.0–
9.3 hours (mean 8.1 hours) in human blood serum (Greer et al., 2002). Perchlorate undergoes
relatively little, if any, metabolism in humans, with more than 90% of ingested doses
excreted in the urine (FAO/WHO, 2011).
3.2 Effects on laboratory animals and in vitro test systems
Detailed reviews of the effects of perchlorate on laboratory animals may be found in NRC
(2005), ATSDR (2008), FAO/WHO (2011), ECHA (2014) and EFSA (2014).
3.2.1 Acute toxicity
When a single dose (300 or 2000 mg/kg bw) of ammonium perchlorate was administered to
female rats by oral gavage, no deaths occurred, although hypoactivity was noted up to
2 hours post-dosing for all animals dosed at 2000 mg/kg bw (ECHA, 2014).
3.2.2 Short-term studies of toxicity
A dietary concentration of 3.55% (35 500 mg/kg diet, approximately 3621 mg/kg bw per day
as perchlorate) was reported as the median lethal dose (LD50) for potassium perchlorate in
mice exposed for up to 30 days. The first deaths occurred within 4 days of the start of
treatment (Gauss, 1972).
Several short-term (ranging from 7 to 90 days) studies of toxicity have been carried out in
which rats were administered ammonium perchlorate in drinking-water (Eskin et al., 1975;
Siglin et al., 2000; Khan et al., 2005; McLanahan et al., 2007). Effects on thyroid hormones,
thyroid gland weights and histological changes to the thyroid gland were the primary end-
points studied. In an 8-week study, the mammary glands of female rats were of normal
weight but histologically showed mild atrophy, some atypia of the lobular epithelium and
scattered foci of hyperplastic activity (Eskin et al., 1975).
PERCHLORATE IN DRINKING-WATER
6
3.2.3 Long-term studies of toxicity and carcinogenicity
Potassium perchlorate and sodium perchlorate have been shown to produce thyroid tumours
(papillary and/or follicular adenomas and/or carcinomas) in rats and mice with long-term
exposure (1–24 months) to 1–1.2% concentrations in the feed (10 000–12 000 mg/kg) or
drinking-water (10 000–12 000 mg/L) (Kessler & Krüskemper, 1966; Gauss, 1972; Florencio
Vicente, 1990; Fernandez Rodriguez et al., 1991; Pajer & Kalisnik, 1991; Toro Guillen,
1991). Estimated perchlorate doses in these studies ranged from 928 to 2573 mg/kg bw per
day. The cancer effect levels from these studies were around 1000 mg/kg bw per day.
3.2.4 Genotoxicity
No evidence of the genotoxicity of magnesium perchlorate or ammonium perchlorate was
observed in a wide array of both in vivo and in vitro genotoxicity tests (Nakamura & Kosaka,
1989; Costa et al., 1996; Zeiger, 1998a,b; San & Clarke, 1999; Siglin et al., 2000).
3.2.5 Reproductive and developmental toxicity
Several studies have been carried out to investigate the reproductive and developmental
toxicity of perchlorate in rats, prairie voles, deer mice and rabbits (York et al., 2001a,b, 2003;
Thuett et al., 2002a,b; Mahle et al., 2003; Smith et al., 2006; Stoker et al., 2006). The results
of these studies indicate effects on some reproductive end-points following exposure to
perchlorate, including decreases in the number of litters born, decreases in mean litter size,
increases in the percentage of stillborn pups, and reduced ossification of fetal sternebrae and
phalanges; however, the changes, where observed, were usually slight. Exposure to
perchlorate in utero and via lactation resulted in thyroid findings in fetuses and pups that
were similar to those noted in adults.
Several studies in rats have also investigated the relationship between exposure to perchlorate
and developmental neurotoxicity, including effects on brain weight and dimensions and on
spatial learning (York et al., 2004, 2005; Gilbert & Sui, 2008). However, limitations of the
data preclude the determination of an association between exposure to perchlorate and
developmental neurotoxicity (EFSA, 2014).
3.3 Effects on humans1
Human observations include clinical studies on thyroid function in healthy adult volunteers
given perchlorate in drinking-water, clinical studies on thyroid function in workers
occupationally exposed to perchlorate for several years, population-based epidemiological
studies and ecological studies comparing populations living in areas with differing
concentrations of perchlorate in the drinking-water. Some of the ecological studies included
pregnant women, newborns and children and, in the case of newborns, benefited from
neonatal screening programmes that included measurements of serum thyroid stimulating
hormone (TSH) and/or thyroid hormones. In the various studies, outcome measures
investigated included one or more of the following: radiolabelled iodide uptake by the
thyroid, serum TSH and thyroid hormone concentrations, urinary perchlorate and iodide
concentrations, incidence of thyroid diseases, neonatal birth weight, head circumference and
length, incidence of congenital hypothyroidism and neurobehavioural measures in children.
1 References for this section, except for the critical study, can be found in FAO/WHO (2011).
PERCHLORATE IN DRINKING-WATER
7
There are also historical clinical data from past use of perchlorate as a treatment for
hyperthyroidism.
There were no reported associations between perchlorate concentrations in drinking-water
and the incidence of thyroid diseases, including congenital hypothyroidism and thyroid
cancer in the ecological studies. With respect to TSH and thyroid hormones, one study
reported a significant association between elevated newborn TSH levels and concentrations
of perchlorate in drinking-water. However, it is notable that the concentrations of perchlorate
in drinking-water in this study were not as high as in other, negative studies on newborns.
The clinical studies in healthy adult volunteers and workers did not show any significant
effects on TSH or thyroid hormone concentrations at exposures of up to 0.5 mg/kg bw per
day. From consideration of human clinical studies in healthy subjects and studies of long-
term treatment of patients with hyperthyroidism, the National Academy of Sciences (NAS) in
the USA has estimated that a sustained exposure to perchlorate of more than 0.4 mg/kg bw
per day would probably be necessary in order to trigger hypothyroidism in normal adults. The
NAS also commented that in pregnant women, infants, children and people with low iodide
intake or pre-existing thyroid dysfunction, the dose of perchlorate required to cause
hypothyroidism may be lower. Despite lack of effects on TSH and thyroid hormones, the
studies in healthy adult volunteers did show clear, dose-related effects on radiolabelled iodide
uptake by the thyroid.
A key issue for human risk assessment is whether a point of departure (POD) for deriving a
health-based guidance value (i.e. tolerable daily intake) for perchlorate should be based on
the end-point of inhibition of thyroidal uptake of iodide or on end-point(s) with clearer
implications for adversity, such as increases in TSH, reductions in circulating thyroid
hormone levels and clinical hypothyroidism. Inhibition of iodide uptake by the thyroid is
clearly a precursor event in the chain of events that ultimately can lead to adverse effects on
thyroid function; by itself, however, it cannot be considered adverse if circulating thyroid
hormone levels remain unchanged. The available human data provide support for such a
conclusion. For example, for short-term exposure, in a 14-day clinical study by Greer and co-
workers (2002) in healthy adults, there was no effect on TSH or thyroid hormones at the
highest perchlorate dose tested, 0.5 mg/kg bw per day, despite the observation that the
highest dose caused an average 67% inhibition of iodide uptake by the thyroid. For chronic
exposure, support is provided by data from the two occupational studies, in which about half
the participants in each study had been exposed for more than 5 years. In one study,
perchlorate exposure equivalent to about 0.5 mg/kg bw per day (the same as the highest dose
in the study by Greer et al. [2002]) was not associated with any change in TSH or thyroid
hormones; in the other study, in which uptake of radiolabelled iodide by the thyroid was
measured, a 38% reduction in iodide uptake was not associated with any effect on TSH or
thyroid hormones. The NAS review also expressed the view that uptake of iodide by the
thyroid would need to be inhibited by at least 75% for several months or longer in adults with
a normal dietary iodine intake in order to cause declines in thyroid hormone production that
would have adverse health effects. A further practical constraint in selecting the end-point is
that, with the exception of one study, the human clinical and epidemiological studies on
perchlorate did not actually identify any significant association between perchlorate exposure
and changes in TSH and thyroid hormones that could be used for the POD.
PERCHLORATE IN DRINKING-WATER
8
A second key issue is to what extent a POD derived from studies in healthy adults relates to
potentially more vulnerable groups in the population. Given the critical role of thyroid
hormones in brain development, it is widely considered that the probability of a permanent
adverse effect on neurodevelopment from thyroid disruption, including transient disruption,
would be greatest during early life. Consideration needs to be given to the differing thyroid
physiology in the fetus and neonate compared with that of children and adults; for example,
the amount of thyroid hormone stored in the colloid in late-gestation fetuses and neonates is
estimated to be sufficient for less than 1 day only, compared with several months for adults. It
is also unclear whether infants consuming breast milk from mothers exposed to perchlorate
may have an additional risk if perchlorate were to reduce the passage of iodide into breast
milk; at present, there are very few data on this, and what data are available are contradictory.
As perchlorate competitively inhibits iodide uptake by the thyroid, another issue for
consideration is whether populations living in parts of the world where the diet is deficient in
iodine would be more susceptible to perchlorate than iodine-replete individuals.1 The data on
this aspect are sparse. A further consideration is whether individuals, in particular pregnant
women, who already have the condition of hypothyroidism or subclinical hypothyroidism
might be additionally affected by low-level perchlorate exposure. The above subgroups of the
general population are numerically significant.
JECFA also noted that there can be co-exposure in the diet to other ubiquitous anti-thyroid
substances with the same mode of action (i.e. competitive inhibition at the sodium–iodide
symporter [NIS]; see Section 3.4), such as nitrate or thiocyanate, or with differing modes of
action, such as organochlorines.
Given the mode of action of perchlorate (see Section 3.4), the key vulnerable groups are
likely to be pregnant women, fetuses, newborns, young infants, those with hypothyroidism
and possibly those with iodine-deficient diets. As there are no good quantitative data relating
perchlorate dietary exposure to changes in thyroidal iodide uptake, TSH or thyroid hormones
in these key groups that are comparable with the quantitative data obtained in the study by
Greer and co-workers (2002), these represent significant data gaps and are the major sources
of uncertainty in any population-wide risk assessment. The uncertainties discussed above
need to be weighed alongside the fact that the POD for the risk assessment can be based on
inhibition of iodide uptake by the thyroid, a precursor event that, at least at low to moderate
levels of inhibition, appears to be non-adverse.
3.4 Mode of action of critical effect
The health effects of perchlorate salts are due to the perchlorate ion itself. The primary effect
of perchlorate is its ability to competitively inhibit uptake of iodide by the thyroid gland. The
inhibition is at the level of the NIS, which actively transports iodide and perchlorate from the
blood into the thyroid gland. Inhibition of iodide uptake by perchlorate reduces the amount of
iodide available for the synthesis of thyroid hormones, resulting in reductions in the
concentrations of circulating thyroxine (T4) and the more biologically active hormone,
triiodothyronine (T3). In a negative feedback loop, reductions in the concentrations of T4 and
T3 reaching the brain trigger the release of thyrotropin-releasing hormone in the
1 WHO has estimated that 54 countries may still be iodine deficient, yet the rates of iodine deficiency continue
to decline (http://www.who.int/nutrition/topics/idd/en/#).
PERCHLORATE IN DRINKING-WATER
9
hypothalamus, which, in turn, causes the release of thyrotropin, also known as TSH, from the
anterior pituitary gland. TSH initiates the events in the thyroid that result in NIS transport of
iodide into the thyroid and synthesis of T3 and T4. Sustained reduction in iodide uptake by the
thyroid may result in hypothyroidism. Hypothyroidism has adverse implications for structural
and functional brain development in the fetus, infant and child and for metabolism and the
functioning of cardiovascular, gastrointestinal, skeletal, neuromuscular and reproductive
systems in adults.
4. PRACTICAL ASPECTS
4.1 Analytical methods and analytical achievability
Numerous methods are available to identify and quantify the perchlorate anion in water;
however, the majority utilize ion chromatography for separation and either conductivity or
mass spectrometry for detection. The limits of detection for these methods are generally in
the micrograms per litre or nanograms per litre range, respectively. USEPA Method 314.0
(USEPA, 1999) utilizes ion chromatography with suppressed conductivity detection and can
generally achieve an MRL of approximately 4 µg/L, whereas USEPA Method 331.0
(USEPA, 2005a) using liquid chromatography with mass spectrometry detection achieves
MRLs between 20 and 50 ng/L.
4.2 Treatment and control methods and performance
The perchlorate anion is highly stable in water and is difficult to remove using conventional
water treatment technologies. The advanced treatment technologies that have been shown to
effectively remove perchlorate from water may not be readily available or applicable to low-
resource regions. Effective advanced technologies include reverse osmosis and nanofiltration
membranes (Yoon et al., 2009), anaerobic biodegradation (Hatzinger, 2005) and ion
exchange using strong basic anion exchange or perchlorate-selective ion exchange resins (Gu,
Brown & Chiang, 2007; Srinivasan & Sorial, 2009). Anaerobic biodegradation has generally
been applied to remediate perchlorate releases at high concentrations (>100 µg/L), whereas
advanced treatment processes (e.g. reverse osmosis and ion exchange) have also been applied
to lower concentrations. However, other technologies (e.g. electrochemical reduction) and
hybrids (e.g. ion exchange coupled with biodegradation) have also been found to be
successful (USEPA, 2005b; Ye et al., 2012).
Proper selection, handling and storage of hypochlorite solutions are important to minimize
perchlorate formation in hypochlorite solutions. Control measures include obtaining the
freshest hypochlorite possible of appropriate quality; diluting the concentrated solutions as
soon as they are received; keeping the hypochlorite in a cool, dark storage facility; and
controlling its pH in the range of pH 11–13 during storage (Stanford et al., 2011).
5. GUIDELINE VALUE
5.1 Relevance of animal data for human risk assessment
JECFA noted that for substances known to affect the thyroid and having a mode of action
involving inhibition of the uptake of iodide, the rat is not a good model for humans. This
applies not only to the likelihood of thyroid cancer but also to other perturbations of thyroid
PERCHLORATE IN DRINKING-WATER
10
physiology and pathology in response to thyroid toxicants. For this reason, the animal data
reviewed by JECFA, which comprised mostly data from rats and were qualitatively
supportive of the human data, were not further considered for deriving a health-based
guidance value for perchlorate.
5.2 Selection of pivotal study and point of departure
The pivotal study for dose–response analysis was the human clinical study on 16 male and 21
female healthy adult volunteers published by Greer and co-workers in 2002, in which
perchlorate was given in drinking-water at a dose of 0.007, 0.02, 0.1 or 0.5 mg/kg bw per day
for 14 days. The uptake of iodide into the thyroid was measured at baseline before
administration of perchlorate and on days 2 and 14 of administration at both 8 and 24 hours
after administration of radiolabelled iodine. These data were used for modelling.
JECFA selected a critical effect size of 50% inhibition of iodide uptake as the benchmark
response (BMR). This choice was made because human clinical data from healthy adults
following both short-term and chronic exposure to perchlorate have shown that such a level
of inhibition is not associated with any changes in TSH or thyroid hormone levels. JECFA
noted that a BMR of 50% inhibition was within the observed range of the study.
PROAST software (version 23.2) for analysis of continuous data was used. In the clinical
study, each subject served as his or her own control, with baseline values measured 1 day
before the start of the 14-day perchlorate exposure period. In the benchmark dose (BMD)
analysis, the baseline value for iodide uptake in each subject was set at 100%. Analysis of the
post-treatment values for iodide uptake at 8 and 24 hours and the values from exposure days
2 and 14 as covariates showed that these factors did not have any significant impact.
Therefore, the two models used for continuous data – the exponential and Hill models – were
fitted to all the data combined. Similar values for the benchmark dose for a 50% response
(BMD50) and the lower 95% confidence limit on the BMD50 (BMDL50) were obtained from
the two models. The lower of the two BMDL50 values (rounded to two significant figures) of
0.11 mg/kg bw per day was used as the POD.
5.3 Derivation of the provisional maximum tolerable daily intake
As perchlorate has a very short half-life and is rapidly cleared from the body, it is considered
appropriate to derive a provisional maximum tolerable daily intake (PMTDI). The BMDL50
of 0.11 mg/kg bw per day for inhibition of uptake of radiolabelled iodide by the thyroid was
chosen as the POD for derivation of a PMTDI. As it is based on human data, there is no need
to apply any interspecies uncertainty factor.
JECFA noted that the BMDL50 was derived from a study of relatively short duration but that
there are efficient homeostatic mechanisms to cope with short-term and long-term inhibition
of iodide uptake, up to (at least) 50%, in healthy children and adults. JECFA also noted that
there is at least a fourfold margin between the value of the BMDL50 and the estimate of more
than 0.4 mg/kg bw per day that would probably be necessary as a sustained exposure in order
to trigger hypothyroidism in normal adults. JECFA therefore concluded that it was not
necessary to apply an uncertainty factor to account for the short duration of the pivotal study.
In considering the size of any necessary uncertainty factor for inter-individual human
differences, JECFA took account of the fact that the effect of perchlorate on inhibition of
PERCHLORATE IN DRINKING-WATER
11
iodide uptake by the thyroid and on the subsequent synthesis of thyroid hormones in
potentially vulnerable groups – such as pregnant women, fetuses, neonates and young infants,
those with iodine-deficient diets and those with clinical or subclinical hypothyroidism – may
differ from that in healthy adults. JECFA concluded that an uncertainty factor of 10 would be
appropriate to cover any differences in the general population, including those in potentially
vulnerable subgroups. Applying this 10-fold factor to the BMDL50 and rounding to one
significant figure, a PMTDI of 0.01 mg/kg bw was established for perchlorate.
5.4 Establishing a guideline value
Using the unrounded PMTDI of 0.011 mg/kg bw, a typical adult body weight of 60 kg, the
assumption that drinking-water contributes 20% of the total exposure to perchlorate and a
typical consumption of 2 L of water per day, a health-based value of 0.07 mg/L (rounded
figure) can be calculated. The allocation factor (floor value) of 20% was determined to be
appropriate considering the large number of occurrence studies indicating that perchlorate
exposure from food exceeded the exposure from water. As a recent example, in a study from
Japan, the actual relative source contribution of perchlorate from water ranged from 0.5% to
22% of the total daily perchlorate intake (Asami et al., 2013).
A guideline value of 0.07 mg/L is therefore established. Analysis of perchlorate at the
guideline value is readily achievable. Although perchlorate is not readily removed by
conventional treatment technologies, it can be removed to the guideline value by a variety of
non-conventional, more advanced processes, such as ion exchange, reverse osmosis,
nanofiltration and anaerobic biological processes, which are generally costly to install and
relatively more complex to operate.
6. REFERENCES
Asami M, Kosaka K, Kunikane S (2009). Bromate, chlorate, chlorite and perchlorate in sodium hypochlorite
solution used in water supply. J Water Supply Res Technol - Aqua. 58(2):107.
Asami M, Kosaka K, Yoshida N (2009). Occurrence of chlorate and perchlorate in bottled beverages in Japan. J
Health Sci. 55(4):549–53.
Asami M, Yoshida N, Kosaka K, Ohno K, Matsui Y (2013). Contribution of tap water to chlorate and
perchlorate intake: a market basket study. Sci Total Environ. 463:199–208.
ATSDR (2008). Toxicological profile for perchlorates. Atlanta (GA): United States Department of Health and
Human Services, Public Health Service, Agency for Toxic Substances and Disease Registry
(http://www.atsdr.cdc.gov/toxprofiles/tp162.pdf, accessed 7 January 2015).
Brandhuber P, Clark S, Morley K (2009). A review of perchlorate occurrence in public drinking water systems.
J Am Water Works Assoc. 101(11):63–73.
Costa M, Zhitkovich A, Gargas M, Paustenbach D, Finley B, Kuykendall J et al. (1996). Interlaboratory
validation of a new assay for DNA–protein crosslinks. Mutat Res. 369:13–21 [cited in EFSA, 2014].
Dasgupta PK, Martinelango PK, Jackson WA, Anderson TA, Tian K, Tock RW et al. (2005). The origin of
naturally occurring perchlorate: the role of atmospheric processes. Environ Sci Technol. 39(6):1569–75.
Dasgupta PK, Dyke JV, Kirk AB, Jackson WA (2006). Perchlorate in the United States. Analysis of relative
source contributions to the food chain. Environ Sci Technol. 40:6608–14.
Dugan NR, Williams DJ, Meyer M, Schneider RR, Speth TF, Metz DH (2009). The impact of temperature on
the performance of anaerobic biological treatment of perchlorate in drinking water. Water Res. 43(7):1867–78.
PERCHLORATE IN DRINKING-WATER
12
ECHA (2014). Published information on the REACH registration dossier on ammonium perchlorate (CAS
Number 7790-98-9). European Chemicals Agency (http://echa.europa.eu/information-on-chemicals/registered-
substances, accessed 7 January 2015) [cited in EFSA, 2014].
EFSA (2014). Scientific opinion on the risks to public health related to the presence of perchlorate in food, in
particular fruits and vegetables. EFSA 12(10):3869 (http://www.efsa.europa.eu/en/efsajournal/pub/3869.htm,
accessed 7 January 2014).
El Aribi H, Le Blanc YJC, Antonsen S, Sakuma T (2006). Analysis of perchlorate in foods and beverages by ion
chromatography coupled with tandem mass spectrometry (IC-ESI-MS/MS). Anal Chim Acta. 567(1):39–47.
Ericksen GE (1983). The Chilean nitrate deposits. Am Sci. 71:366–74.
Eskin BA, Shuman R, Krouse T, Merion JA (1975). Rat mammary gland atypia produced by iodine blockade
with perchlorate. Cancer Res. 35:2332–9 [cited in EFSA, 2014].
FAO/WHO (2011). Safety evaluation of certain contaminants in food. Prepared by the seventy-second meeting
of the Joint FAO/WHO Expert Committee on Food Additives (JECFA). Geneva: World Health Organization;
685–762 (WHO Food Additives Series, No. 63; FAO JECFA Monographs 8;
http://www.inchem.org/documents/jecfa/jecmono/v63je01.pdf).
Fernandez Rodriguez A, Galera Davidson H, Salguero Villadiego M, Moreno Fernandez A, Martin Lacave I,
Fernandez Sanz J (1991). Induction of thyroid proliferative changes in rats treated with antithyroid compound.
Anat Histol Embryol. 20:289–98 [cited in EFSA, 2014].
Florencio Vicente MDR (1990). Proliferative thyroid lesions: an experimental study. Diss Abstr Int C. 5:176
[cited in EFSA, 2014].
Foubister V (2006). Chilean fertilizer leaves perchlorate legacy. Anal Chem. 78:7914–5.
Furdui VI, Tomassini F (2009). Trends and sources of perchlorate in Arctic snow. Environ Sci Technol.
44(2):588–92.
Gauss W (1972). Physiological and histological criteria of thyroid gland function following a single or long-
term administration of potassium perchlorate in adult mice (Mus musculus L.). I. Long-term experiments. Z
Mikrosk Anat Forsch. 85:469–500.
Gilbert ME, Sui L (2008). Developmental exposure to perchlorate alters synaptic transmission in hippocampus
of the adult rat. Environ Health Perspect. 116:752–60 [cited in EFSA, 2014].
Greer MA, Goodman GG, Pleus RC, Greer SE (2002). Health effects assessment for environmental perchlorate
contamination: the dose response for inhibition of thyroidal radioiodine uptake in humans. Environ Health
Perspect. 110(9):927–37.
Gu BH, Brown GM, Chiang CC (2007). Treatment of perchlorate-contaminated groundwater using highly
selective, regenerable ion-exchange technologies. Environ Sci Technol. 41(17):6277–82.
Hatzinger PB (2005). Perchlorate biodegradation for water treatment. Environ Sci Technol. 39(11):239A–247A.
Her N, Jeong H, Kim J, Yoon Y (2011). Occurrence of perchlorate in drinking water and seawater in South
Korea. Arch Environ Contam Toxicol. 61(2):166–72.
Huber DR, Blount BC, Mage DT, Letkiewicz FJ, Kumar A, Allen RH (2011). Estimating perchlorate exposure
from food and tap water based on US biomonitoring and occurrence data. J Expo Sci Environ Epidemiol.
21(4):395–407.
Kannan K, Praamsma ML, Oldi JF, Kunisue T, Sinha RK (2009). Occurrence of perchlorate in drinking water,
groundwater, surface water and human saliva from India. Chemosphere. 76(1):22–6.
Kessler FJ, Krüskemper HL (1966). Experimental thyroid tumors caused by many years of potassium
perchlorate administration. Klin Wochenschr. 44:1154–6 [cited in EFSA, 2014].
PERCHLORATE IN DRINKING-WATER
13
Khan MA, Fenton SE, Swank AE, Hester SD, Williams A, Wolf DC (2005). A mixture of ammonium
perchlorate and sodium chlorate enhances alterations of the pituitary–thyroid axis caused by the individual
chemicals in adult male F344 rats. Toxicol Pathol. 33:776–83 [cited in EFSA, 2014].
Kosaka K, Asami M, Matsuoka Y, Kamoshita M, Kunikane S (2007). Occurrence of perchlorate in drinking
water sources of metropolitan area in Japan. Water Res. 41(15):3474–82.
Lee JW, Oh SH, Oh JE (2012). Monitoring of perchlorate in diverse foods and its estimated dietary exposure for
Korea populations. J Hazard Mater. 243:52–8.
Mahle DA, Yu KO, Narayanan L, Mattie DR, Fisher JW (2003). Changes in cross-fostered Sprague-Dawley rat
litters exposed to perchlorate. Int J Toxicol. 22:87–94 [cited in EFSA, 2014].
Martinelango PK, Tian K, Dasgupta PK (2006). Perchlorate in seawater: bioconcentration of iodide and
perchlorate by various seaweed species. Anal Chim Acta. 567(1):100–7.
McLanahan ED, Campbell JL Jr, Ferguson DC, Harmon B, Hedge JM, Crofton KM et al. (2007). Low-dose
effects of ammonium perchlorate on the hypothalamic–pituitary–thyroid axis of adult male rats pretreated with
PCB126. Toxicol Sci. 97:308–17 [cited in EFSA, 2014].
McLaughlin CL, Blake S, Hall T, Harman M, Kanda R, Hunt J et al. (2011). Perchlorate in raw and drinking
water sources in England and Wales. Water Environ J. 25(4):456–65.
Munster J, Hanson GN, Jackson WA, Rajagopalan S (2009). The fallout from fireworks: perchlorate in total
deposition. Water Air Soil Pollut. 198(1–4):149–53.
Murray CW, Egan SK, Kim H, Beru N, Bolger PM (2008). US Food and Drug Administration’s total diet study:
dietary intake of perchlorate and iodine. J Expo Sci Environ Epidemiol. 18(6):571–80.
Nakamura S, Kosaka H (1989). Genotoxicity of inorganic metal compounds with umu test. Jpn J Ind Health.
31:430–1 [cited in EFSA, 2014].
NRC (2005). Health implications of perchlorate ingestion. Washington (DC): National Research Council,
National Academies Press.
Pajer Z, Kalisnik M (1991). The effect of sodium perchlorate and ionizing irradiation on the thyroid
parenchymal and pituitary thyrotropic cells. Oncology. 48:317–20 [cited in EFSA, 2014].
Qin XL, Zhang T, Gan Z, Sun H (2014). Spatial distribution of perchlorate, iodide and thiocyanate in the aquatic
environment of Tianjin, China: environmental source analysis. Chemosphere. 111:201–8.
Rajagopalan S, Anderson T, Fahlquist L, Rainwater K, Ridley M, Jackson WA (2006). Widespread presence of
naturally occurring perchlorate in high plains of Texas and New Mexico. Environ Sci Technol. 40:3156–62.
Roefer P, Snyder S, Zegers RE, Rexing DJ, Fronk JL (2000). Endocrine-disrupting chemicals in a source water.
J Am Water Works Assoc. 92(8):52–8.
San RHC, Clarke JJ (1999). In vitro mammalian cell gene mutation test (L5178Y/TK+/− mouse lymphoma
assay). BioReliance study no. G98BAO6.702. Rockville (MD): Perchlorate Study Group
(http://www.tera.org/ART/Perchlorate/2nd%20study%20protocol.pdf) [cited in EFSA, 2014].
Siglin JC, Mattie DR, Dodd DE, Hildebrandt PK, Baker WH (2000). A 90-day drinking water toxicity study in
rats of the environmental contaminant ammonium perchlorate. Toxicol Sci. 57:61–74 [cited in EFSA, 2014].
Smith PN, Severt SA, Jackson JW, Anderson TA (2006). Thyroid function and reproductive success in rodents
exposed to perchlorate via food and water. Environ Toxicol Chem. 25:1050–9 [cited in EFSA, 2014].
Snyder SA, Vanderford BJ, Rexing DJ (2005). Trace analysis of bromate, chlorate, iodate, and perchlorate in
natural and bottled waters. Environ Sci Technol. 39(12):4586–93.
Snyder SA, Pleus RC, Vanderford BJ, Holady JC (2006). Perchlorate and chlorate in dietary supplements and
flavor enhancing ingredients. Anal Chim Acta. 567:23–32.
PERCHLORATE IN DRINKING-WATER
14
Srinivasan R, Sorial GA (2009). Treatment of perchlorate in drinking water: a critical review. Sep Purif
Technol. 69:7–21.
Stanford BD, Pisarenko AN, Snyder SA, Gordon G (2011). Perchlorate, bromate, and chlorate in hypochlorite
solutions: guidelines for utilities. J Am Water Works Assoc. 103(6):71–83.
Stoker TE, Ferrell JM, Laws SC, Cooper RL, Buckalew A (2006). Evaluation of ammonium perchlorate in the
Endocrine Disruptor Screening and Testing Program’s male pubertal protocol: ability to detect effects on
thyroid endpoints. Toxicology. 228:58–65 [cited in EFSA, 2014].
Sungur S, Sangun MK (2011). Ion chromatographic determination of perchlorate in foods consumed in Hatay
region. Food Chem. 126(1):326–31.
Thuett KA, Roots EH, Mitchell LP, Gentles BA, Anderson TA, Kendall RJ et al. (2002a). In utero and
lactational exposure to ammonium perchlorate in drinking water: effects on developing deer mice at postnatal
day 21. J Toxicol Environ Health A. 65:1061–76 [cited in EFSA, 2014].
Thuett KA, Roots EH, Mitchell LP, Gentles BA, Anderson TA, Smith EE (2002b). Effects of in utero and
lactational ammonium perchlorate exposure on thyroid gland histology and thyroid and sex hormones in
developing deer mice (Peromyscus maniculatus) through postnatal day 21. J Toxicol Environ Health A.
65:2119–30 [cited in EFSA, 2014].
Toro Guillen M (1991). Reversibility of proliferative thyroid lesions. Diss Abstr Int C. 54:1186 [cited in EFSA,
2014].
Urbansky ET, editor (2000). Perchlorate in the environment. New York (NY): Kluwer Academic/Plenum
Publishers (Environmental Science Research, Volume 57).
Urbansky ET, Brown SK (2003). Perchlorate retention and mobility in soils. J Environ Monit. 5(3):455–62.
Urbansky ET, Brown SK, Magnuson ML, Kelty CA (2001). Perchlorate levels in samples of sodium nitrate
fertilizer derived from Chilean caliche. Environ Pollut. 112(3):299–302.
USEPA (1999). Method 314.0. Determination of perchlorate in drinking water using ion chromatography.
Revision 1.0. Cincinnati (OH): United States Environmental Protection Agency, Office of Research and
Development, National Exposure Research.
USEPA (2005a). Method 331.0. Determination of perchlorate in drinking water by liquid chromatography
electrospray ionization mass spectrometry. Revision 1.0. Cincinnati (OH): United States Environmental
Protection Agency, Office of Ground Water and Drinking Water, Technical Support Center.
USEPA (2005b). Perchlorate treatment technology update. Washington (DC): United States Environmental
Protection Agency (Federal Facilities Forum Issue Paper; EPA 542-R-05-015; http://clu-
in.org/download/remed/542-r-05-015.pdf, accessed 2 June 2015).
Vonburg R (1995). Toxicology update. J Appl Toxicol. 15(3):237–41.
Wang ZW, Forsyth D, BP Lau, Pelletier L, Bronson R, Gaertner D (2009). Estimated dietary exposure of
Canadians to perchlorate through the consumption of fruits and vegetables available in Ottawa markets. J Agric
Food Chem. 57(19):9250–5.
Wolff J (1998). Perchlorate and the thyroid gland. Pharmacol Rev. 50(1):89–105.
Ye L, You H, Yao J, Su H (2012). Water treatment technologies for perchlorate: a review. Desalination. 298:1–
12.
Ye L, You H, Yao J, Kang X, Tang L (2013). Seasonal variation and factors influencing perchlorate in water,
snow, soil and corns in northeastern China. Chemosphere. 90(10):2493–8.
Yoon J, Amy G, Chung J, Sohn J, Yoon Y (2009). Removal of toxic ions (chromate, arsenate, and perchlorate)
using reverse osmosis, nanofiltration, and ultrafiltration membranes. Chemosphere. 77(2):228–35.
PERCHLORATE IN DRINKING-WATER
15
York RG, Brown WR, Girard MF, Dollarhide JS (2001a). Two-generation reproduction study of ammonium
perchlorate in drinking water in rats evaluates thyroid toxicity. Int J Toxicol. 20:183–97 [cited in EFSA, 2014].
York RG, Brown WR, Girard MF, Dollarhide JS (2001b). Oral (drinking water) developmental toxicity study of
ammonium perchlorate in New Zealand White rabbits. Int J Toxicol. 20:199–205 [cited in EFSA, 2014].
York RG, Funk KA, Girard MF, Mattie D, Strawson JE (2003). Oral (drinking water) developmental toxicity
study of ammonium perchlorate in Sprague-Dawley rats. Int J Toxicol. 22:453–64 [cited in EFSA, 2014].
York RG, Barnett J Jr, Brown WR, Garman RH, Mattie DR, Dodd D (2004). A rat neurodevelopmental
evaluation of offspring, including evaluation of adult and neonatal thyroid, from mothers treated with
ammonium perchlorate in drinking water. Int J Toxicol. 23:191–214 [cited in EFSA, 2014].
York RG, Lewis E, Brown WR, Girard MF, Mattie DR, Funk KA et al. (2005). Refining the effects observed in
a developmental neurobehavioral study of ammonium perchlorate administered orally in drinking water to rats.
II. Behavioral and neurodevelopment effects. Int J Toxicol. 24:451–67 [cited in EFSA, 2014].
Yu L, Cañas JE, Cobb GP, Jackson WA, Anderson TA (2004). Uptake of perchlorate in terrestrial plants.
Ecotoxicol Environ Saf. 58(1):44–9.
Zeiger E (1998a). Salmonella mutagenicity testing of ammonium perchlorate (memorandum with attachment to
Annie Jarabek). Research Triangle Park (NC): United States Department of Health and Human Services,
National Institute of Environmental Health Services [cited in EFSA, 2014].
Zeiger E (1998b). Ammonium perchlorate MN test results [memorandum with attachment to Annie Jarabek].
Research Triangle Park (NC): United States Department of Health and Human Services, National Institute of
Environmental Health Services [cited in EFSA, 2014].


