JOURNAL OF NUCLEAR MEDICINE 7:269-280, 1966 Perforated Tape Recorder for Digital Scan Data Store With Grey Shade and Numeric Readout' David E. KUhI, M.D. and Roy Q. Edwards2 . Philadelphia, Penna. INTRODUCTION Current directions for improvement in radioisotope scanning emphasize faster collection of data, more detail in images, and quantitative analysis of the data. The information extracted from the study depends crucially on how data are recorded, displayed, and analyzed. In the earliest scan records, counting data were presented as rows of black stylus marks made on paper (1). Later, color coding was introduced to improve the contrast of mark recordings (2). Now scan data are usually recorded as grey shade images on photographic film (3). In most photorecorders, film is exposed by a light source coupled mechanically to the detector, but cathode ray tube os cilloscopes with cameras have been used as photographicrecordersforspecial purposes(4,5).For more optimum choicesofimage contrast, closedcircuitele vision viewing (6) and rescanning densitometry (7) have been used for analysis of the photographic record after scanning. Other approaches for optimizing image contrast have included magnetic tape recording of scan data followed by time compression replay with oscilloscope camera film recording (8) or storage tube display (9). Numeric printout has been used when the quantitative counting data were of more importance than picture quality (10, 11). Recently, perforated tape recording of the counting data has been employed by some workers as a pre lude to the use of a large computer for data analysis (12, 13, 14, 15). iThis project was supported by USAEC Contract No. AT (30-1 )-3175, USPHS Research Grant No. C-4456, and USPHS Research Career Program Award CA-14,020 from the National Cancer Institute. NYO-3175-19. 2Department of Radiology of the School of Medicine and the Hospital of the University of Pennsylvania and the William H. Dormer Center for Radiology, Philadelphia, Pennsylvania. 269 by on August 7, 2020. For personal use only. jnm.snmjournals.org Downloaded from
Transcript
JOURNAL OF NUCLEAR MEDICINE 7:269-280, 1966
Perforated Tape Recorder for Digital Scan Data StoreWith Grey Shade and Numeric Readout'
David E. KUhI, M.D. and Roy Q. Edwards2
. Philadelphia, Penna.
INTRODUCTION
Current directions for improvement in radioisotope scanning emphasize fastercollection of data, more detail in images, and quantitative analysis of the data.The information extracted from the study depends crucially on how data arerecorded, displayed, and analyzed.
In the earliest scan records, counting data were presented as rows of blackstylus marks made on paper (1). Later, color coding was introduced to improvethe contrast of mark recordings (2). Now scan data are usually recorded as greyshade images on photographic film (3). In most photorecorders, film is exposedby a light source coupled mechanically to the detector, but cathode ray tube oscilloscopeswith cameras have been used as photographicrecordersforspecialpurposes(4,5).For more optimum choicesofimage contrast,closedcircuittelevision viewing (6) and rescanning densitometry (7) have been used for analysisof the photographic record after scanning. Other approaches for optimizing imagecontrast have included magnetic tape recording of scan data followed by timecompression replay with oscilloscope camera film recording (8) or storage tubedisplay (9). Numeric printout has been used when the quantitative countingdata were of more importance than picture quality (10, 11). Recently, perforatedtape recording of the counting data has been employed by some workers as a prelude to the use of a large computer for data analysis (12, 13, 14, 15).
iThis project was supported by USAEC Contract No. AT (30-1 )-3175, USPHS ResearchGrant No. C-4456, and USPHS Research Career Program Award CA-14,020 from the NationalCancer Institute. NYO-3175-19.
2Department of Radiology of the School of Medicine and the Hospital of the Universityof Pennsylvania and the William H. Dormer Center for Radiology, Philadelphia, Pennsylvania.
269
by on August 7, 2020. For personal use only. jnm.snmjournals.org Downloaded from
We have evolved a data system that has been efficient and reliable in theprocessing of several thousand scans over the past two years ( 16, 17, 18 ) ( Fig. 1).Instrument cost is commensurate with that of present day rectilinear scanningsystems. In operation, digitized counting and position data are recorded on a
strip of perforated paper tape without significant loss or distortion. Rapid playback
converts these data to a recognizable form. For visual inspection, a grey shadepicture is generated on Polaroid film, with contrast under operator's control. Forquantitative retrieval, the counting data are presented as a matrix of typewrittennumbers. The inexpensive length of perforated paper tape remains a part of the
patient's permanent record, available for future analysis if needed.
INSTRUMENT DESIGN
2.1 Recorder. We required that recording and display instrumentation be
separated physically so as to permit simultaneous independent use. The recordingmedium was to be small in size and inexpensive, so that data might be retainedpermanently in original form. Continuous-speed magnetic-tape recording wouldproduce a longer and more expensive tape than desired; multiple-channel meremental-feed magnetic recording would produce a short tape but would be acostly instrument investment. Perforated paper tape recording was chosen as thepreferred technique. Perforators are well adapted to the slow rates of data collection inherent in present day scanning, and the short length of paper record isconvenient to handle and store.
In this system, each character on the paper tape is made to represent thecounts integrated in a predetermined elapsed detector travel distance. Originally,we used a predetermined elapsed time based sampling interval. This was replaced with spatial sampling intervals to avoid distortion of the final image matrixthrough unavoidable small fluctuations in scan speed. With time based sampling,for example a one per cent fluctuation in scan speed will add or subtract one picture element of a scan line that should be 100 picture elements wide. With spatialsampling, the number of elements in the line remains at 100; the one per centchange in collected counts is insignificant. Also, image generation with spatialsampling requires retained knowledge of picture element size alone, much lesscomplicated knowledge than the scan speed required with time based sampling.
The operation of the recorder is illustrated in Figure 2. Pulses from the detector are processed in a pulse height analyzer and inserted into the scaler. Thescaler produces an output pulse representing 1, 2, 4, or 8 input pulses, dependingon the selection of the scale factor.
The scaler output pulse is inserted into the counter where six flip-flop circuitsare connected for serial counting. The parallel output of these circuits providesa binaryrepresentationoftheaccumulatedcounts.
Meanwhile, the spatial trigger unit has received an input signal from thescanner which represents a predetermined elapsed detector travel distance. Thissignal is used to activate two univibrators. The first univibrator generates a pulseof one microsecond duration which is introduced to the counter and to the storageregister. Upon receipt of this trigger pulse, the counter stops, resets to zero, remains inactive for a one microsecond dead time, and then resumes counting. The
by on August 7, 2020. For personal use only. jnm.snmjournals.org Downloaded from
271PERFORATED TAPE RECORDERFOR DIGITAL SCAN DATA STORE
second univibrator in the trigger unit generates a 30 millisecond signal whichactivates the punch mechanism but does not contribute to the overall dead time
of the system.Upon receipt of the transfer signal from the trigger unit, six flip-flop circuits
in the storage register assume the state of the six inputs received from the counter.
These storage register circuits are directly connected to the perforated drive wherepower transistors are matched to tape perforator punch coils. Upon receipt of thepunch command from the trigger unit, these power transistors are activatedthrough gating circuits, whereupon tape columns one through six are punchedto represent the count in binary code.
The paper tape coding is shown in Figure 3. Detector position is specifiedusing three command codes; raster start, line start, and raster end. These codesare generated by the raster encoder after receipt of electrical signals describingthe position of the detector during scanning. The data punch is activated onlyduring the traverse portion of the raster.
When multiple detectors (A, B, C) are used with this method, an additionalanalyzer, scaler, counter, and storage register are required for each detectionsystem. The overall dead time of the system is not increased. Data characters from
Fig. 1. The scan picture generator includes a perforated.paper tape reader, digital logiccircuitry, a display cathode.ray tube with camera, and an automatic typewriter.
-ii
by on August 7, 2020. For personal use only. jnm.snmjournals.org Downloaded from
the first detector are identified by a punch in column seven. Data characters fromthe additional detectors are identified by their sequence following this punch.
2.2 Grey Shade Picture Readout. The operation of the picture generator isdiagrammed in Figure 4. At the completion of the scan procedure, the tape recordis introduced to an eight-column perforated tape reader operating in unidirec
tional mode at a rate of 300 characters per second. When a single detector isused, an average tape record of 9,000 picture elements is 75 feet in length and isread in approximately 30 seconds.
The tape reader signals are introduced to the decoder which provides outputs representing the three position command codes, a sprocket track signal, andsix binary count levels.
The screen position of an oscilloscope1 spot is controlled by the tape position codes. The raster start code provides a master reset signal to all spot positioning circuitry. For a transverse positioning, the track signal is fed to a bidirectional X axis binary counter which is alternately conditioned by the line startcode into the up-count and down-count modes. The X axis counter has a capacityof seven binary bits which yield a possible 127 picture elements per line. The output of the X counter is introduced into the X axis D/A converter which provides
T1WE@ RCCORD
Fig. 2. Recorder. Digital counting and position data are recorded on a strip of perforatedpaper tape.
1P.i1 phosphor, 3000 volts accelerating potential
by on August 7, 2020. For personal use only. jnm.snmjournals.org Downloaded from
PERFORATED TAPE RECORDER FOR DIGITAL SCAN DATA STORE 273
either an ascending or descending staircase analogue signal, depending on thepreconditioning by the line start code. This analogue signal is then introduced to
the X axis of the oscilloscope to cause the spot to move across the screen in eitherdirection, to correspond to the motion of the detector. For line spacing, the linestart code is also fed into a unidirectional Y axis binary counter which has a capacity of seven binary bits, yielding a possible 127 lines. The output of the Yaxis binary counter is fed to the Y axis D/A converter which produces an ascend
ing staircase analogue voltage, each step corresponding to a scan line. This outputis introduced to the Y axis of the oscilloscope to cause the spot to ascend the screen
according to the scan line spacing. This combination of X and Y axis signals reconstitutes the rectilinear raster of the detector on the oscilloscope screen.
For representation of the counting data, the six count outputs of the decoderare translated to corresponding analogue voltages in a Z axis D/A converter.These analogue signals are then introduced to the contrast control, an operationalamplifier with adjustable gain and offset which modulates the oscilloscope spotbrightness (Fig. 5). The beam is turned on with receipt of the raster start codeand turned off with receipt of the raster end code.
A saw-tooth oscillator is used to provide a rectangular spot shape of adjustable dimensions. The spot width is adjusted to correspond to the spatial intervalof count integration; the spot height is made to correspond to the line spacing.
Screen exposure time for each element is determined by the tape readercharacter speed and is the same for all rasters. At a reader speed of 300 characters per second, each element brightens the screen for one three-hundredth of asecond.
An open shutter oscilloscope camera records the scan image on high speedself developing positive film which has a ten second developing time'. In all pictures, an increase in count is represented as an increase in blackening on the finalprints. With positive film in the oscilloscope camera, negative modulation is used
for the spot brightness. Zero count spot brightness is adjusted to just saturate thefilmand thereby,produce a whitespot.With increaseincount,thespotbecomesmore dim; the picture representation becomes darker. Positive modulation can beobtained for use with negative film by incorporating an inverting operationalamplifier in the Z axis line.
Column number 1 2 3 4 5 6 7 8
Raster start X XLine start X XRaster end X XA detector count 2° 2' 22 2@ 2@ 2@ XB detector count 2° 2' 22 2@ 2@ 2@C detector count 2° 2' 22 2@ 2@ 2@
Fig. 3. Paper tape coding. Each character expresses either position data, specified bythree command codes, or counting data, representing counts integrated in a predeterminedelapsed detector travel distance.
‘F-8lens opening; Polaroid type 57 film, ASA rating 3000
by on August 7, 2020. For personal use only. jnm.snmjournals.org Downloaded from
275PERFORATED TAPE RECORDER FOR DIGITAL SCAN DATA STORE
2.3 Numeric Readout. When quantitative retrieval of counting data is moreimportant than picture quality, the scan data on the perforated tape can be presented as a matrix of typewritten numbers.
Data characters on the tape are oriented according to the bidirectional detector motion. A unidirectional orientation of characters is required for thetypewriter input, so that numbers will align correctly when each line is typed inthe conventional left to right direction. Therefore, the reader is programmed toread the first and all odd numbered scan lines in the reverse direction; the secondand all even numbered scan lines are read in forward direction.
The operation of the automatic typewriter system is illustrated in Figure 6.The command code signals, raster start, line start, and raster end, are separatedin the decoder and matrix driver and delivered to the tape feed control and thetypewriter control. In accordance with these codes, the tape feed control causesthe tape reader to read forward, read reverse, or end reading; the typewritercontrol causes the typewriter to return carriage and advance the paper roller.With each command code, the tape reader is stopped until completion of therequired typewriter operation, whereupon it delivers a go signal to the tape feedcontrol.
Counting data in the selected tape channel (A, B, or C) is detected in thedecoder and matrix driver and a signal is sent to the tape feed control to stopthe reader. The first and second diode matrices translate the six level binary codeoriginating from punches in tape columns one through six into a two characterdecimal circuit accommodating numbers ranging from 00 to 63. The six levelparallel binary count signals are converted by relay drivers to six paired binarylevels of sufficient power to drive the first diode matrix. This matrix converts thesix paired wire binary levels to 63 wire single levels representing all possible
SECOND DIODC TVPEWRIT€R
MATRIX CONTROL T'YPEWRIT€R
Fig. 6. Numeric readout. For quantitative retrieval, the scan data on the perforated tapeare presented as a matrix of numbers by the automatic typewriter.
TAP€RECORD
by on August 7, 2020. For personal use only. jnm.snmjournals.org Downloaded from
integers from zero to 63. The 63 wire output is introduced to the second diodematrix and converted to a 17 wire output. The first seven wires represent thefirst decimal characters zero to six, and the remaining ten wires represent thesecond decimal characters zero through nine.
The typewriter control contains timing circuitry which permits the typewriterto print the first character, print the second character, and then space before signailing the tape feed control to advance the tape to the next appropriate character.
The typewriter is a modified manual office machine with a carriage that accommodates a sheet of paper 66 centimeters wide. Power transistors drive solenoidplungers on the number keys, space bar, and paper roller advance. A motor andclutch are used for carriage return.
After loading the tape reader and inserting a blank piece of paper into thetypewriter, the operation of the typewriter system is fully automatic. The type
writer operates at a speed comparable to a fast manual typist and completes theprintout of an average scan raster in approximately 45 minutes.
INSTRUMENT USE
3.1 Picture Element Size. The choice of picture element size is important
when pictures are to be generated from digital data. The width of the pictureelement is determined by the selection of spatial interval for count integration.The picture element height is determined by the selection of line spacing. If thepicture element is too small, the large number of required scan lines prolong thestudy. On the other hand, if the picture element is too large, picture detail isdestroyed and the checkerboard pattern interferes with perception of the image.
If the collimator has been correctly chosen for the study, the best choice ofpicture element size is related to the minimum diameter of view of the detector.The picture element should probably be no wider than one-fourth of the minimumdiameter of view of the detector if destruction of detail is to be avoided. For ex
P13 ?@ C/e
r
9 12 6?
Fig. 7. Grey shade brain scan pictures. Cerebellar astrocytoma grade i in 15-year-oldgirl. (A) Right lateral and, (B) Posterior views. Calibration bands are below each picture.
by on August 7, 2020. For personal use only. jnm.snmjournals.org Downloaded from
ample, we used a collimated detector that had a 1.25 cm minimum diameter ofview to scan point sources arrayed with different separations. We found thatsource separations as small as .75 cm could be distinguished, when the pictureelement was .25 cm square. However, when a .5 cm square picture element wasused, individual sources could not be distinguished at separations less than 1.25centimeters. In this instance, the preferred relationship of picture element size,.25 cm, to minimum diameter of view, 1.25 cm, is analogous to the accepted practice of choosing sampling rates four or five times the maximum frequency of theinput signal in analogue to digital conversion systems.
3.2 Brain Scan Exampli@. When the collimator described above is used forbrain scanning with 99mTc pertechnetate, we give an intravenous dose of 200
@@C/kgof body weight and begin scanning 15 minutes later. Counts are integrated at a .25 cm spatial interval and a .25 cm line spacing is used to produce thesquare picture element. With a scan speed of 2 cm per second, the maximum recording capacity of 63 counts per picture element is seldom exceeded, except overthe parotid gland. An 80 line scan frame measuring 25 cm by 20 cm requires lessthan 15 minutes of scan time. The picture is a matrix of 8000 picture elements(Figs. 7,8).
The count content of each picture element can be represented in the Polaroidreadout as a scale factor times any number from zero to 63. Therefore, there is a
potential range of 64 shades of grey available. In practice, each recording is dis
played as a series of high contrast pictures, each of which displays a portion ofthe entire count range as a change from white to black (Fig. 7).
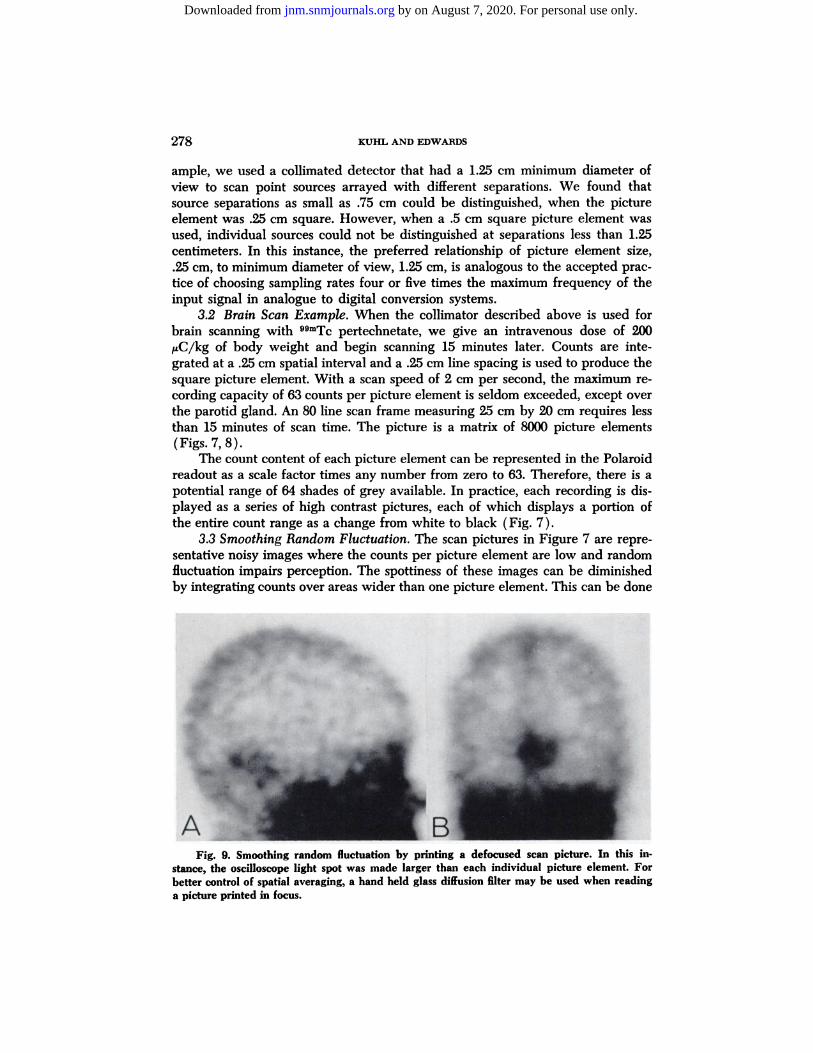
3.3 Smoothing Random Fluctuation. The scan pictures in Figure 7 are representative noisy images where the counts per picture element are low and randomfluctuation impairs perception. The spottiness of these images can be diminishedby integrating counts over areas wider than one picture element. This can be done
Fig. 9. Smoothing random fluctuation by printing a defocused scan picture. In this instance, the oscilloscope light spot was made larger than each individual picture element. Forbetter control of spatial averaging, a hand held glass diffusion filter may be used when readinga picture printed in focus.
A
by on August 7, 2020. For personal use only. jnm.snmjournals.org Downloaded from
PERFORATED TAPE RECORDER FOR DIGITAL SCAN DATA STORE 279
by printing the picture with the oscilloscope light spot larger than each individualelement (5, 19 ) ( Fig. 9). However, we prefer another method of spatial averaging. For better control, we print the picture elements in sharp focus and perform
the optical blurring with a hand-held glass diffusion filter at time of interpretation ( 20) . Our more recent experience with digital techniques for secondary processing of scan data is described elsewhere (21).
SUMMARY
The design and operation of a scan data system is described. Digitizedcounting and position data are recorded on a strip of perforated paper tape without significant loss or distortion. Rapid playback converts these data to a recognizable form. For visual inspection, a grey shade picture is generated onPolaroid film, with contrast under operator control. For quantitative retrieval, thecounting data are presented as a matrix of typewritten numbers. The inexpensivelength of perforated paper tape remains part of the patient's permanent record,available for future analysis if needed. Instrument cost is commensurate withpresent day rectilinear scanners. The data system has proved to be efficient andreliable in the processing of several thousand scans over the past two years.
ACKNOWLEDGEMENT
The authors thank Martin H. Wilcox, Joseph Connolly, Thomas J. Mich,Michael G. Dadario, and Anthony R. Ricci for technical assistance.
REFERENCES
1. CAS5EN,B., CuRris, L., REED,C., ANDLIBBY,R. : Instrumentation for 1311 Use inMedical Studies. Nucleonics, 9:46-50, August, 1951.
2. MALLARD,J. R., AND PEACHEY,C. J. : A Quantitative Automatic Body Scanner forthe Localization of Radioisotopes In Vivo. Brit. I. of Radiol., 32:652-657, October, 1959.
3. KUHL,D. E., CHAMBERLAIN,R. H., HALE,J., ANDGORSON,R. 0.: A High-ContrastPhotographic Recorder for Scintillation Counter Scanning. Radiology, 66:730-739, May, 1956.
4. MAYNEORD,W. V., TURNER, R. C., NEWBERRY, S. P., AND Hown, H. J.: A Method ofMaking Visible the Distribution of Activity in a Source of Ionizing Radiation. Nature, London,168:762-765, 1951.
5. M@cIz@rm@,W. J. REJALI,A. M., CHRISTIE,J. H., Gorr, F. S., ANDHousER, T. S.:Techniques for the Visualization of Internal Organs by an Automatic Radioisotope ScanningSystem. Intern. J. Appi. Rad. Isotopes, 3:193-206, August, 1958.
6. BENDER, M. A., AND BLAU, M.: Photoscanning (In) Medical Radioisotope Scanning,
Proceedings of a Seminar Jointly Organized by the International Atomic Energy Agency andthe World Health Organization, Vienna 25-27 February 1959, pp. 31-38, IAEA, Vienna, 1959.
7. H@uuus,C. C., BELL,P. R., FRANCIS,J. E., JR., JORDAN,J. C., ANDSA1TERFIELD,M.M.: Data Recording for Radioisotope Scanning (In) Progress in Medical Radioisotope Scanning.Proceedings of a Symposium at the Medical Division of the Oak Ridge Inst. for Nuclear Studies, October 22-26, 1982. Oak Ridge, Tenn., pp. 66-104, USAEC, 1963.
8. BERNE,E., ANDJ0NSSON,U.: Ein magnetischen Analysator fürdie quantitative Auswertung von Scintigrammen, Nuclear Med., 1:80-90, 1959.
9. BONTE,F. J., KROHMER,J. S., ANDRo@Ns, W. C.: Magnetic Tape Recording ofScintillation Scan Data. Intern. Jr. Appi. Rad. Isotopes, 14:273-277, 1983.
10. BRArnE, J. W., AND BRADT,C.: Digital Printout System for Whole Body Scanner,IRE Transactions on Bio-Medical Electronics, 8:24-28, January, 1961.
by on August 7, 2020. For personal use only. jnm.snmjournals.org Downloaded from
11. LAUGHLIN,J. S., KENNY,P. J., COREY,K. R., GREENBERG,E., ANDWEBER,D. A.:Localization and Total Body High-Energy Gamma-Ray Scanning Studies in Cancer Patients( In) MedicalRadioisotopeScanning,Proceedingsof a Symposiumheld by the InternationalAtomic Energy Agency, Athens, April, 1964, Vol. I, pp. 253-267, IAEA, Vienna, 1984.
12. KAWIN,B., HUSTON,F. V., ANDCOPE, C. B.: Digital Processing/Display System forRadioisotope Scanning. J. Nuclear Med., 5:500-514, July, 1964.
13. SCHEPER5,H., ANDWINKLER,C.: An Automatic Scanning System, Using a Tape Perforator and Computer Techniques. (In) Medical Radioisotope Scanning, Proceedings of aSymposium held by the International Atomic Energy Agency, Athens, April, 1964, Vol. I, pp.321-329, Vienna, 1964.
14. BROWN, D. W.: Digital Computer Analysis and Display of the Radioisotope Scan.J. Nuclear Med., 5:802-806, October, 1964.
15. WxnER, D. A., KENNY, P., POCHACZEVSKY,R., COREY, K. R., AND LAUGHLIN,J. S.:Liver Schans With Digital Readout. J. Nuclear Med. 528-530, July, 1965.
16. KUHL, D. E.: A Clinical Radioisotope Scanner for Cylindrical and Section Scanning.(In) Medical Radioisotope Scanning, Proceedings of a Symposium held by the InternationalAtomic Energy Agency, Athens, April, 1964, Vol. I., pp. 273-288, IAEA, Vienna, 1964.
17. KUHL, D. E., AND EDWARDS, R. Q.: Cylindrical and Section Radioisotope Scanning ofthe Liver and Brain. Radiology. 83:926-936, November, 1964.
18. Kum@,D. E., Pirrs, F. W., SANDERS,T. P., ANDMISHKIN,M. M.: Transverse Section and Rectilinear Brain Scanning Using D9mTc Pertechnetate. (In press)
19. CHARLESTON, D. B., BECK, R. N., EIDELBERG, P., AND SCHUH, M. W.: TechniquesWhich Aid in Quantitative Interpretation of Scan Data. (In) Medical Radioisotope Scanning,Proceedings of a Symposium held by the International Atomic Energy Agency, Athens, April,1964, Vol. I., pp. 509-525, IAEA, Vienna, 1964.
20. ANGER,H. 0., VANDYKE,D. C., Coi'-rscHALK, A., YANO,Y., ANDSCHAER,L. R.: TheScintillation Camera in Diagnosis and Research. Nucleonics, 23:57-62, January 1965.
21. Kuisi., D. E., AND EDWARDS,R. Q.: Digital Techniques for On-Site Scan Data Processing. Presented at a Symposium on Fundamental Problems in Scanning, Chicago, May 9,1965. (In press)
by on August 7, 2020. For personal use only. jnm.snmjournals.org Downloaded from
Information about subscriptions to JNM can be found at:
http://jnm.snmjournals.org/site/misc/permission.xhtmlInformation about reproducing figures, tables, or other portions of this article can be found online at:
(Print ISSN: 0161-5505, Online ISSN: 2159-662X)1850 Samuel Morse Drive, Reston, VA 20190.SNMMI | Society of Nuclear Medicine and Molecular Imaging
is published monthly.The Journal of Nuclear Medicine