Performance Analysis and Tuning – Part 1 D. John Shakshober (Shak) - Sr Consulting Eng / Director Performance Engineering Larry Woodman - Senior Consulting Engineer / Kernel VM Jeremy Eder - Principal Performance Engineering Bill Gray - Principal Performance Engineer
Transcript
Performance Analysis and Tuning – Part 1
D. John Shakshober (Shak) - Sr Consulting Eng / Director Performance Engineering
Larry Woodman - Senior Consulting Engineer / Kernel VM
Jeremy Eder - Principal Performance Engineering
Bill Gray - Principal Performance Engineer
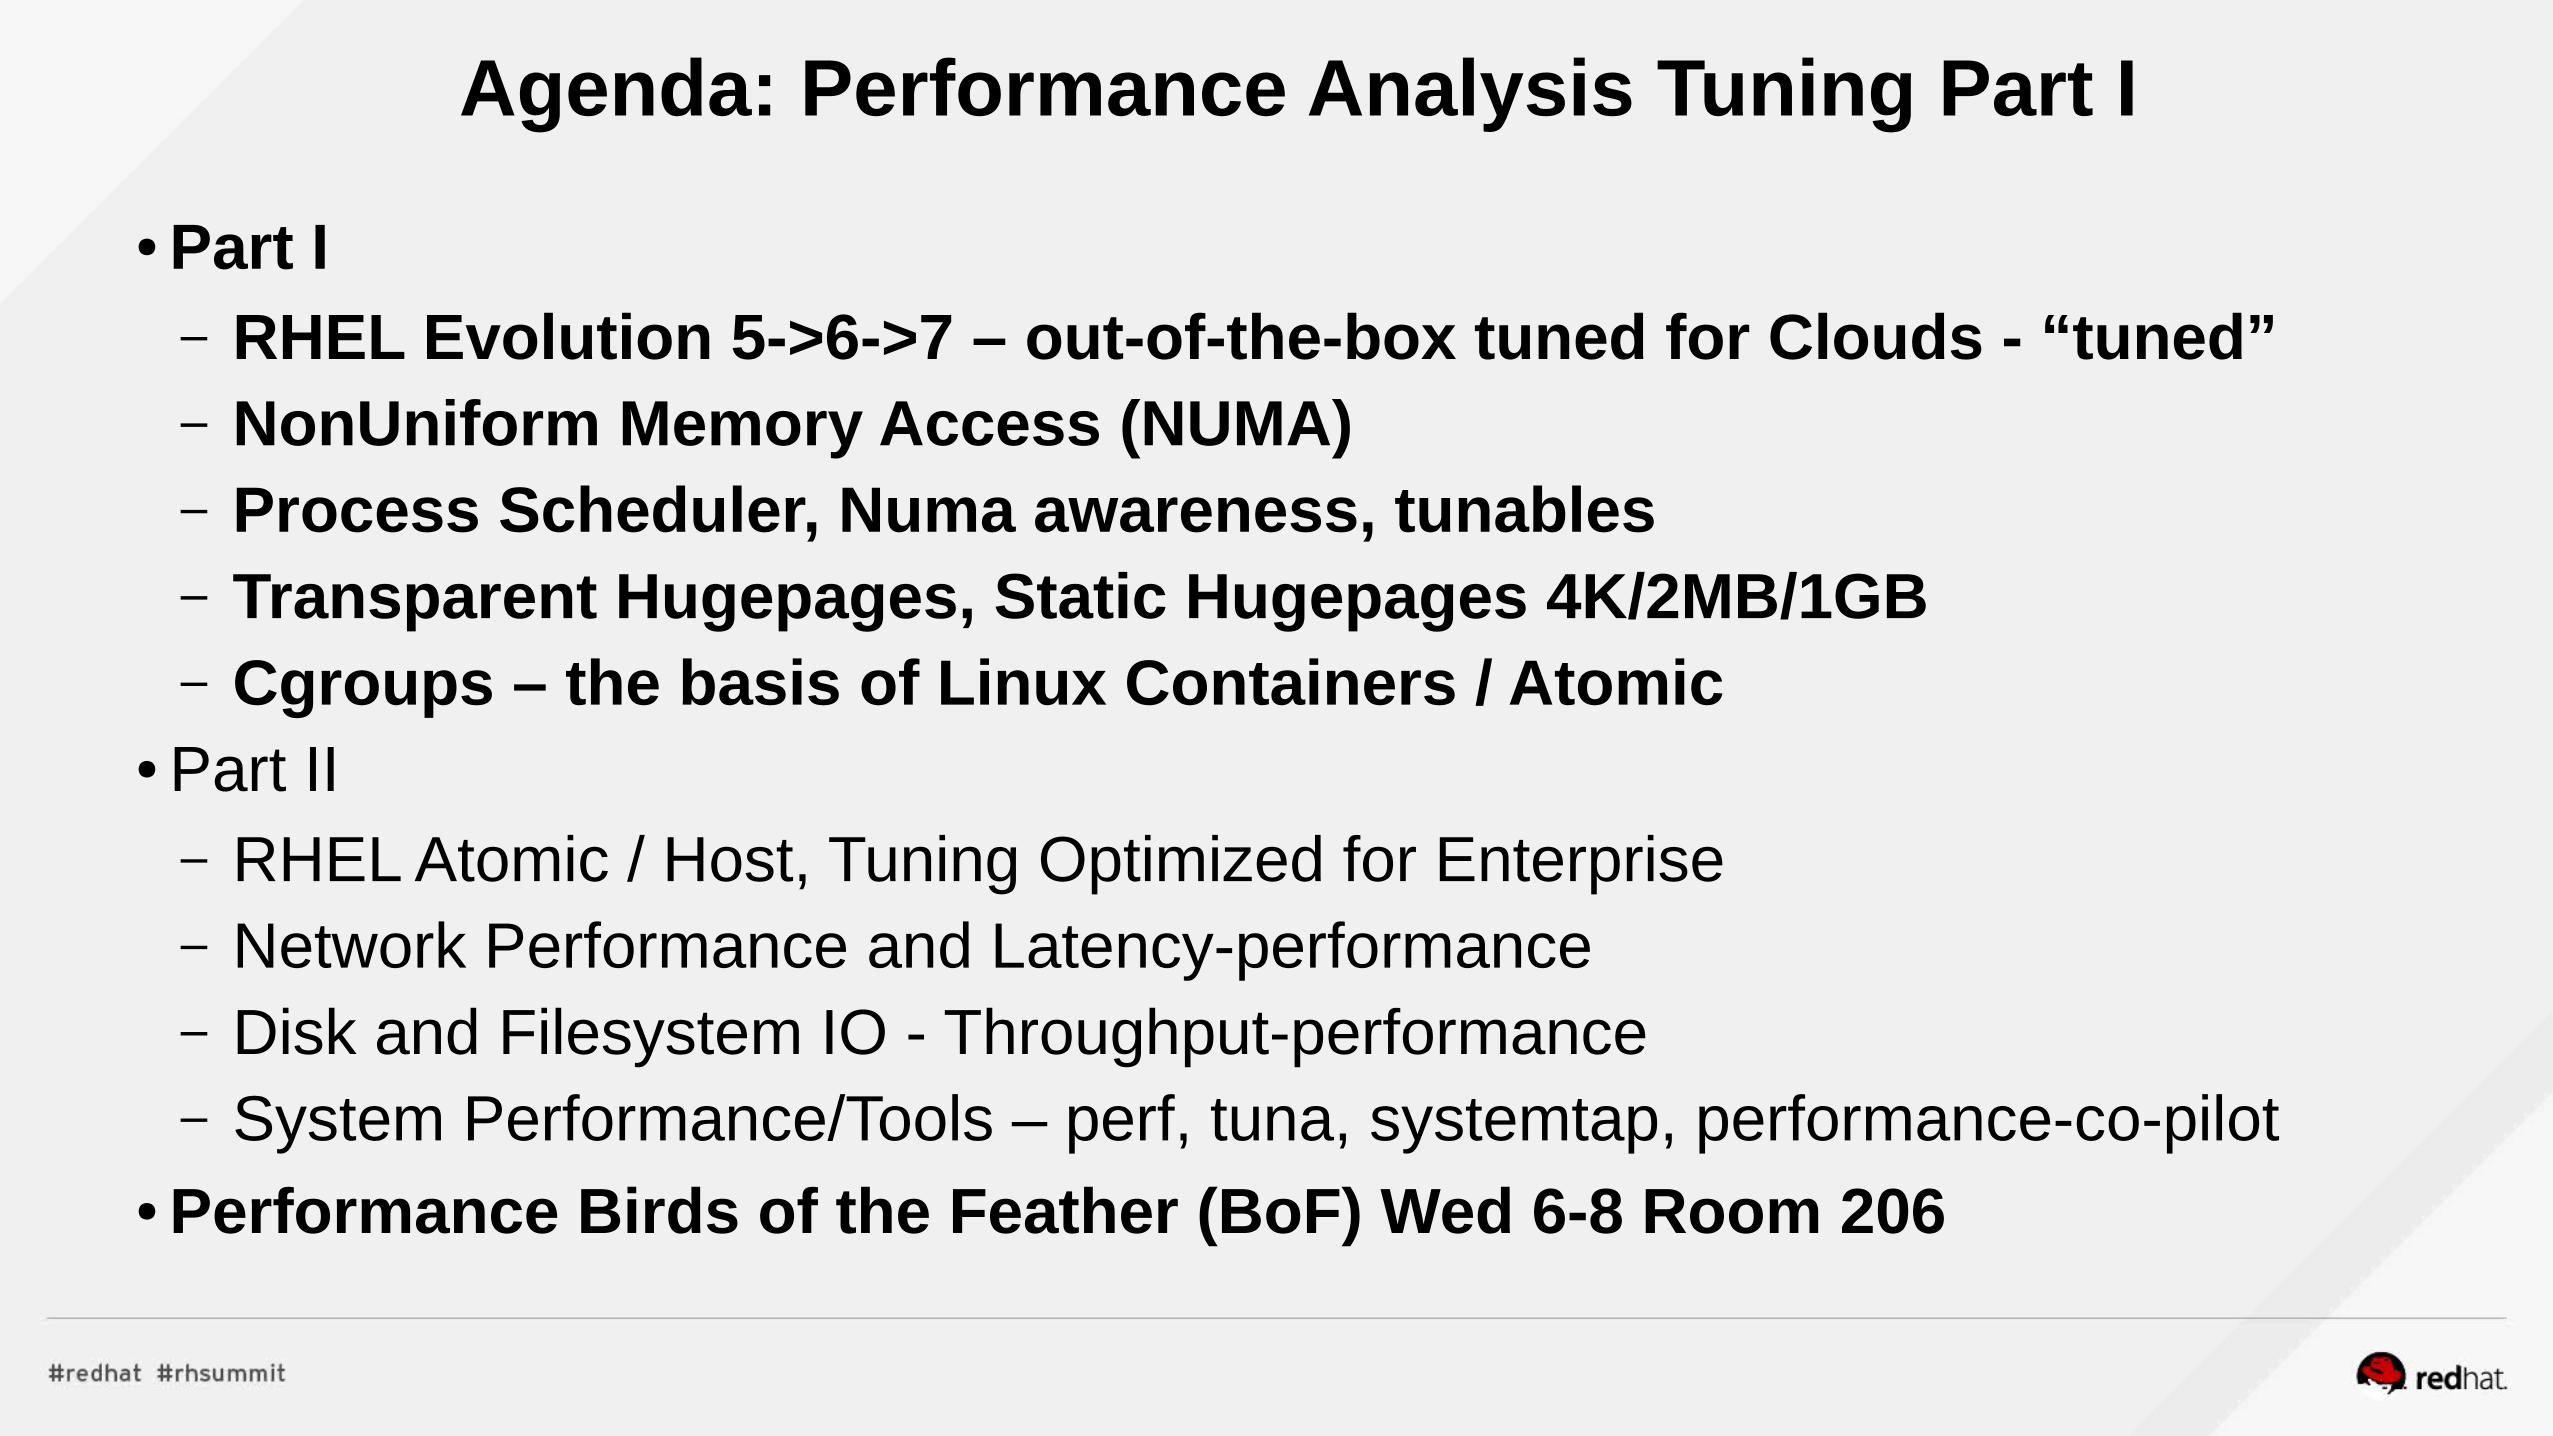
Agenda: Performance Analysis Tuning Part I
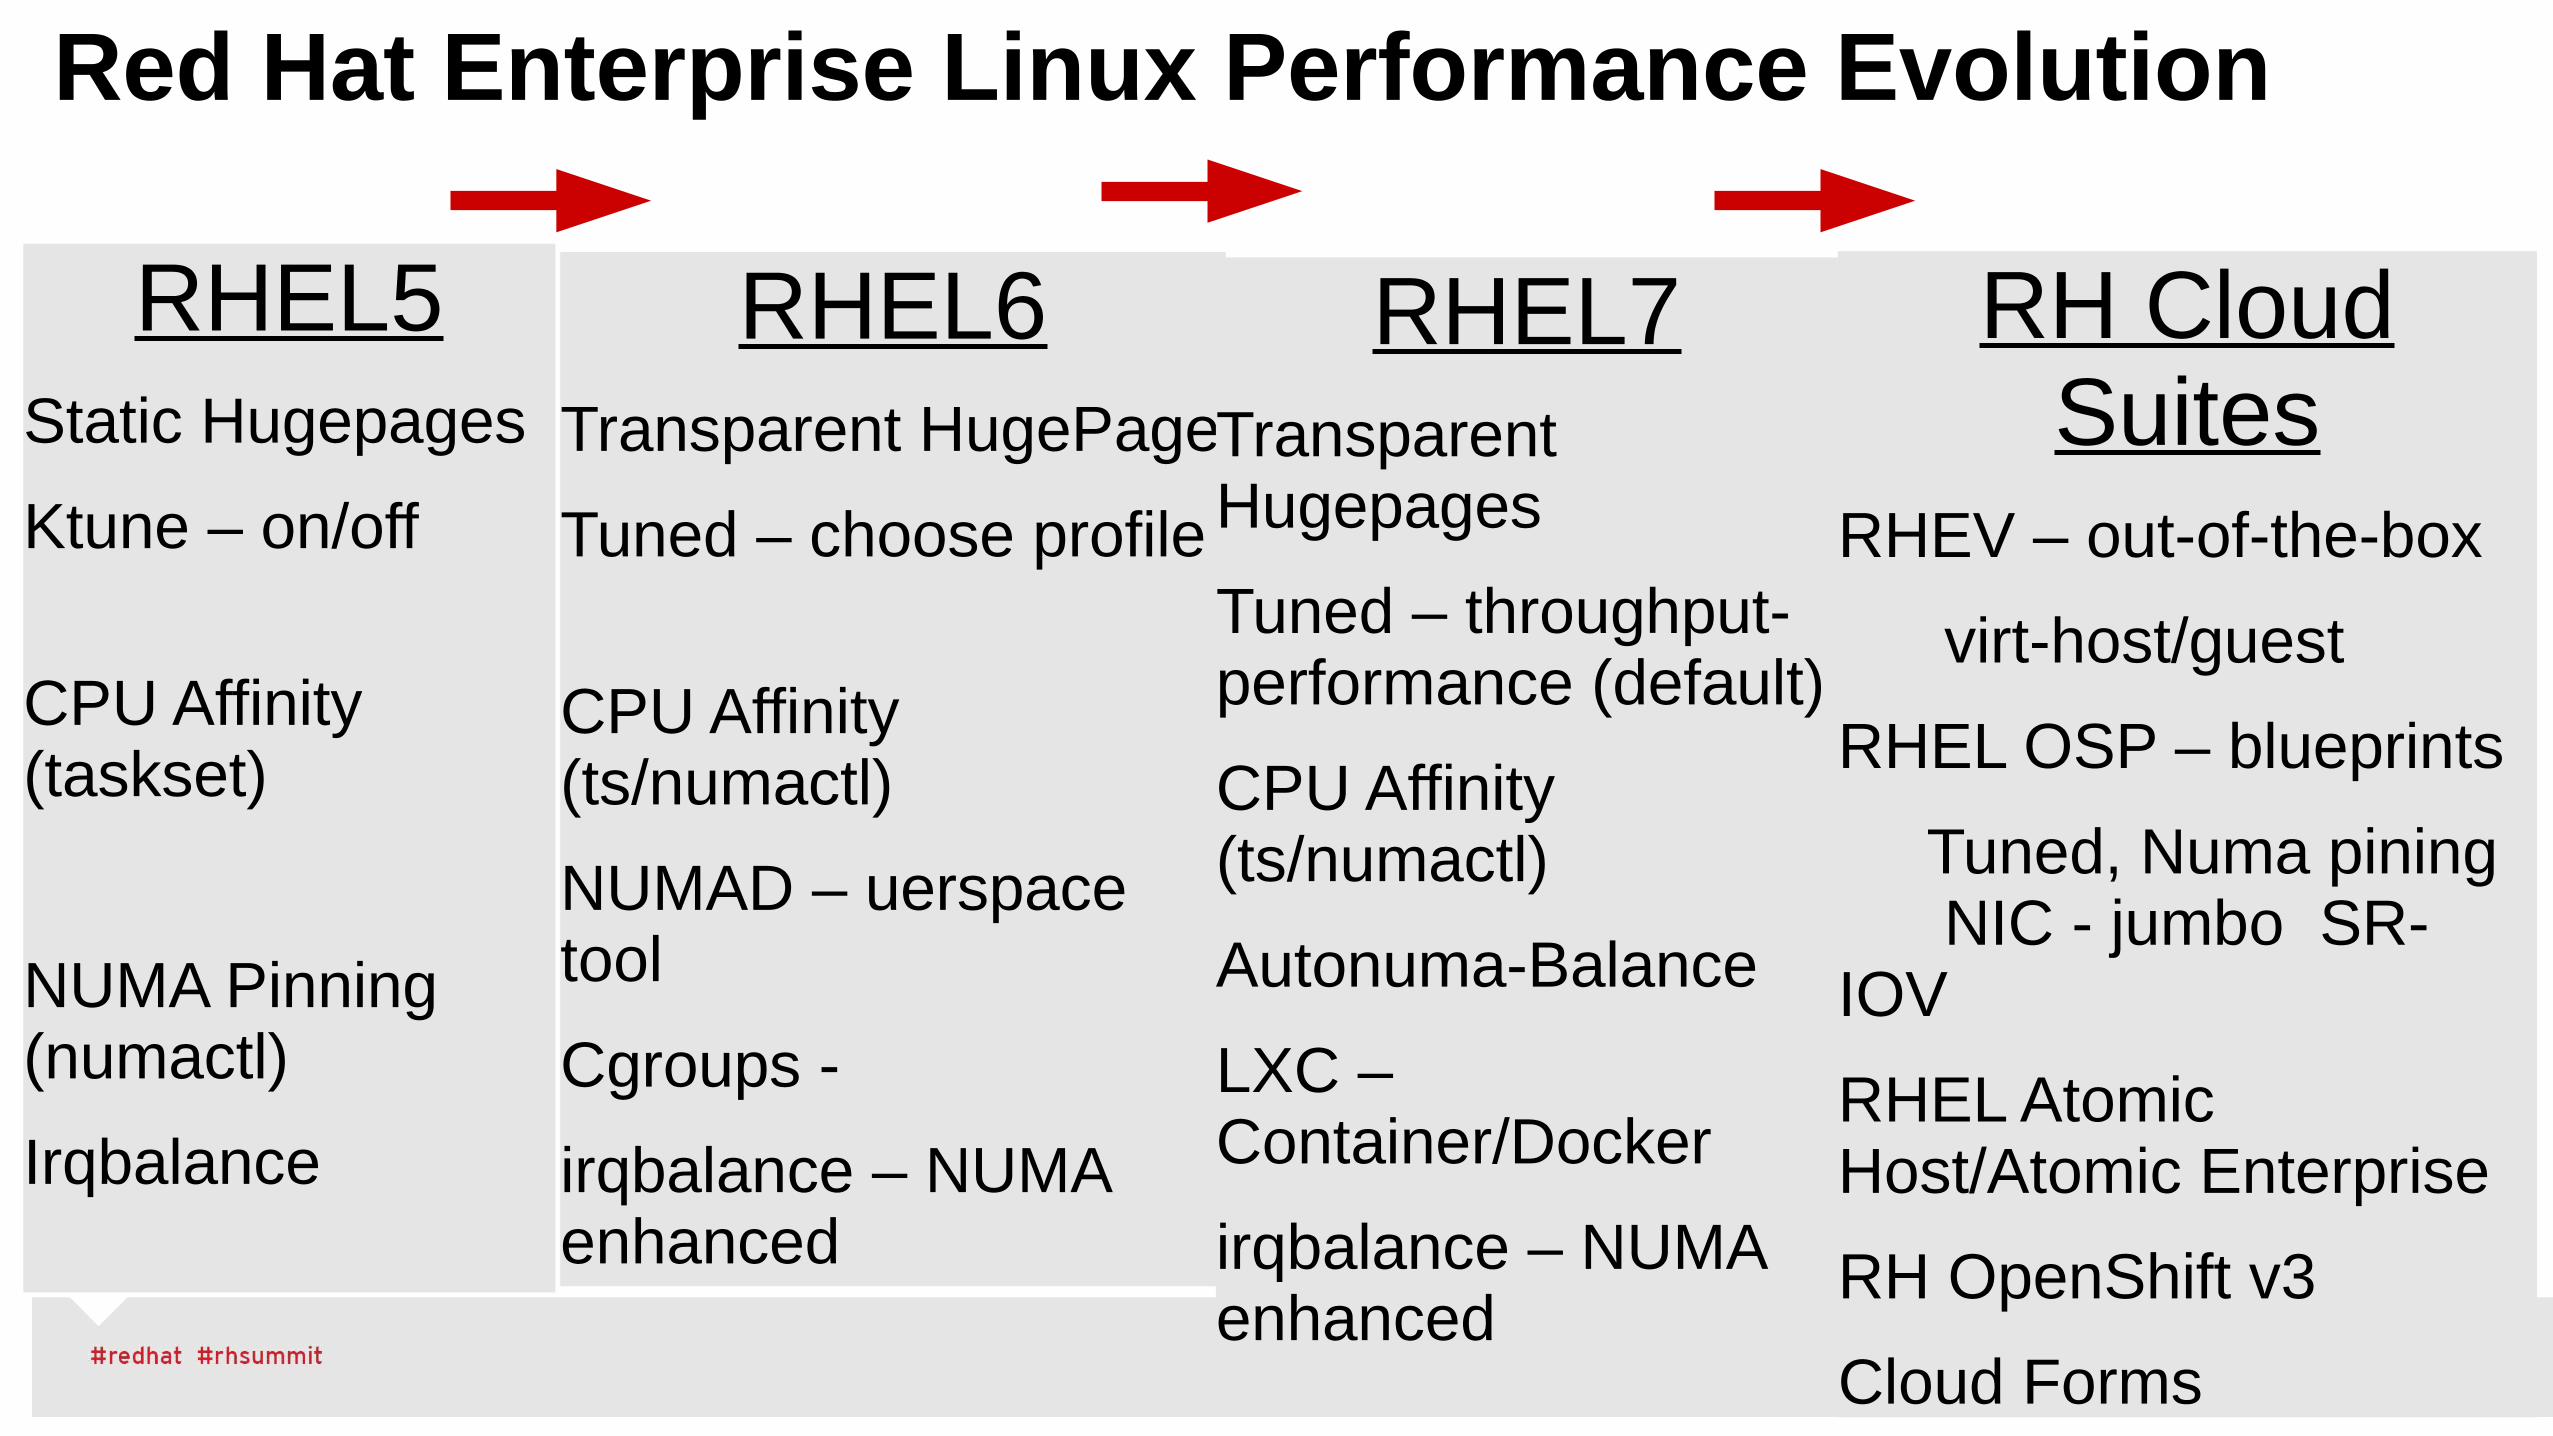
● Part I – RHEL Evolution 5->6->7 – out-of-the-box tuned for Clouds - “tuned”– NonUniform Memory Access (NUMA)– Process Scheduler, Numa awareness, tunables – Transparent Hugepages, Static Hugepages 4K/2MB/1GB– Cgroups – the basis of Linux Containers / Atomic
● Part II– RHEL Atomic / Host, Tuning Optimized for Enterprise – Network Performance and Latency-performance– Disk and Filesystem IO - Throughput-performance– System Performance/Tools – perf, tuna, systemtap, performance-co-pilot
● Performance Birds of the Feather (BoF) Wed 6-8 Room 206
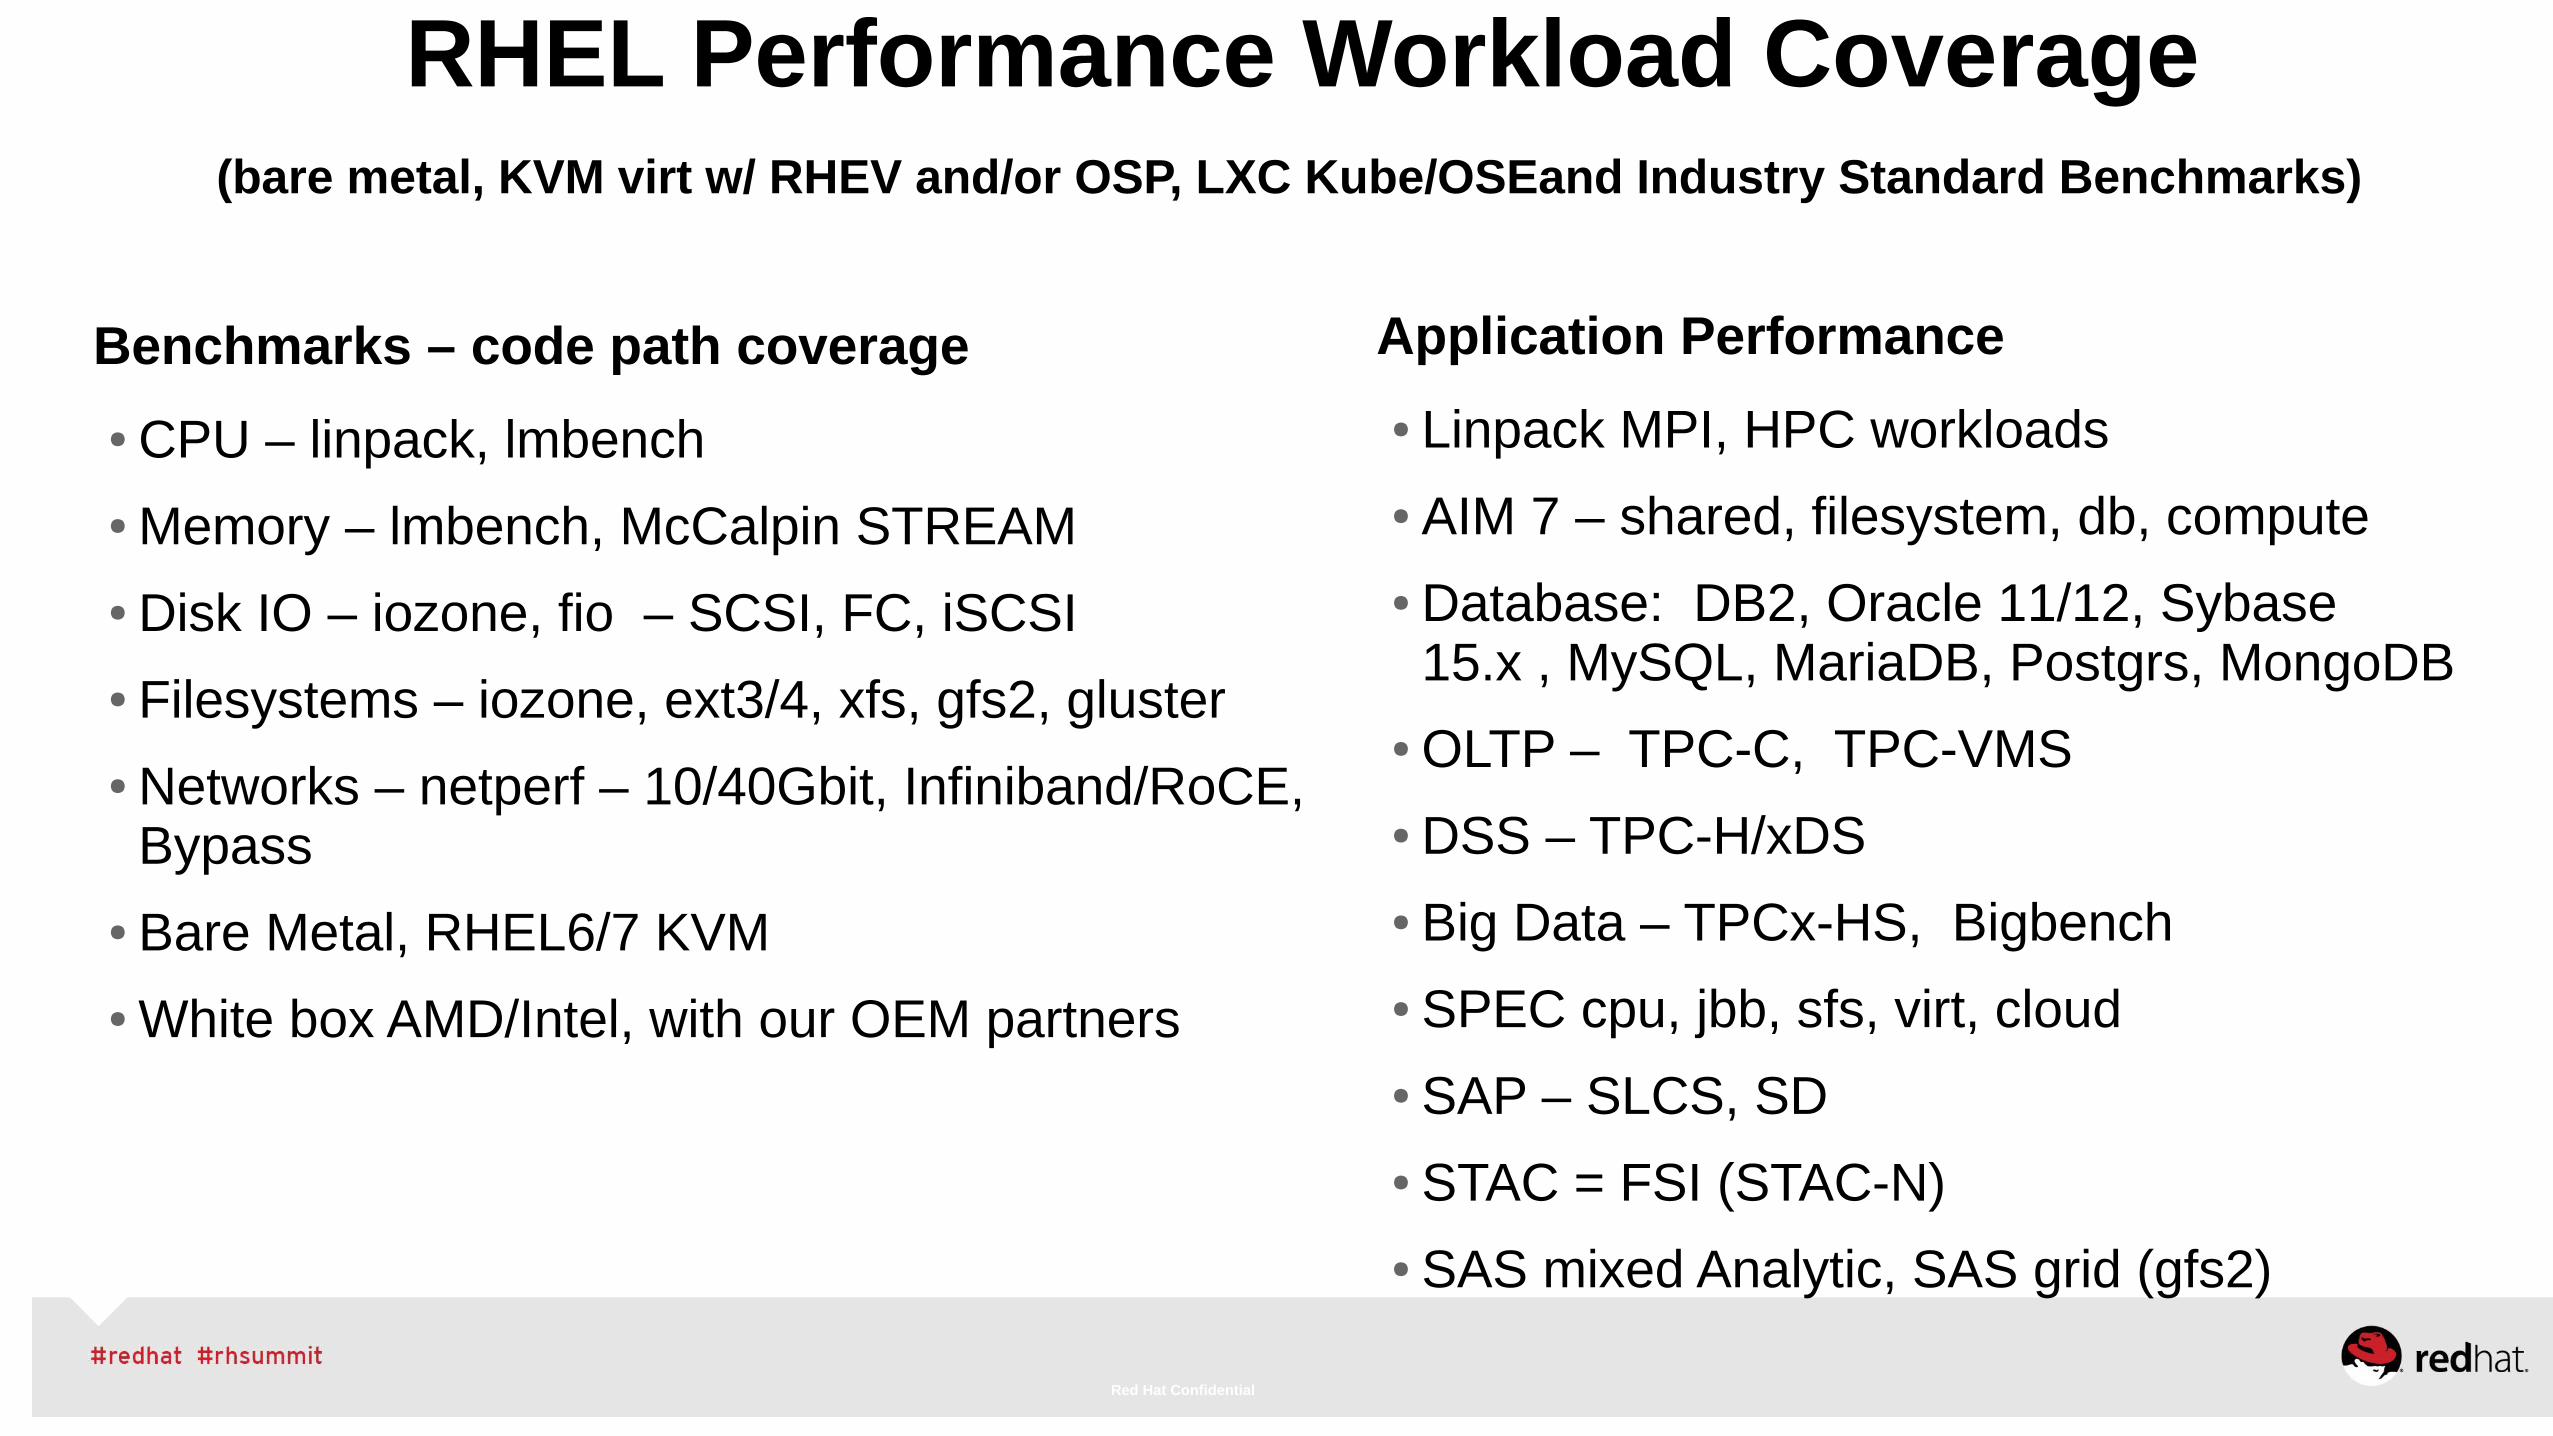
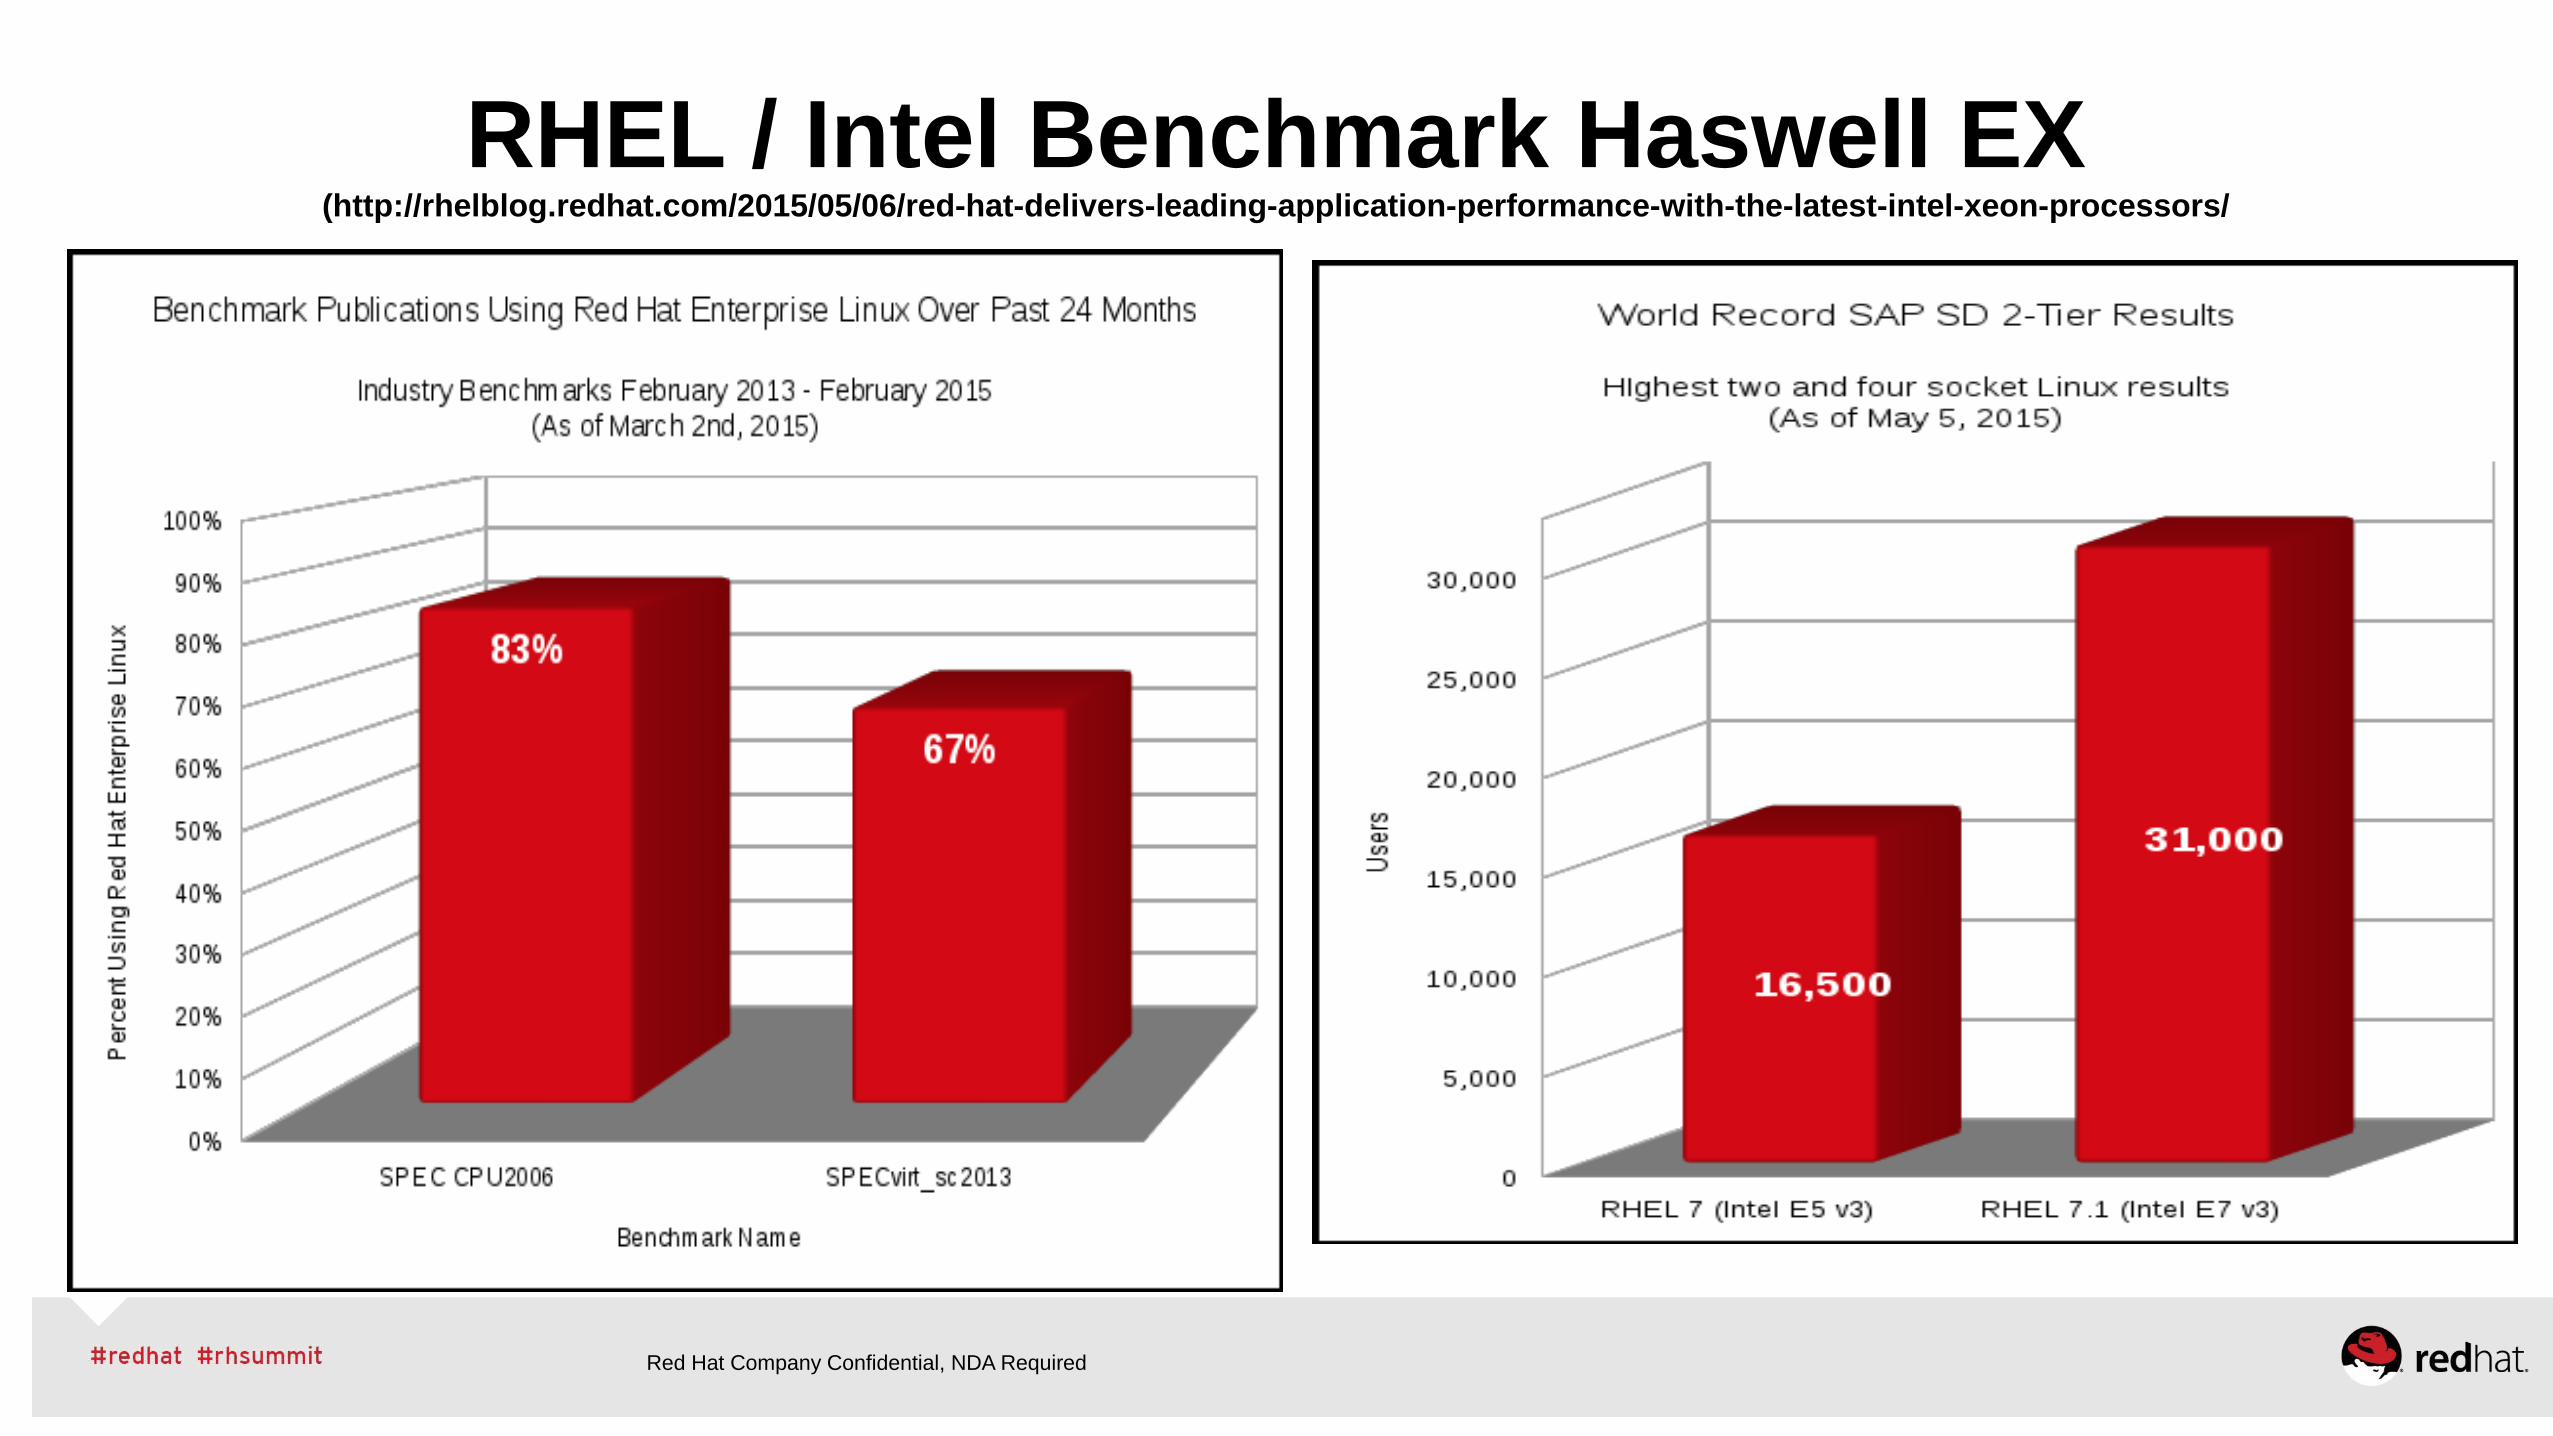
RHEL Performance Workload Coverage (bare metal, KVM virt w/ RHEV and/or OSP, LXC Kube/OSEand Industry Standard Benchmarks)
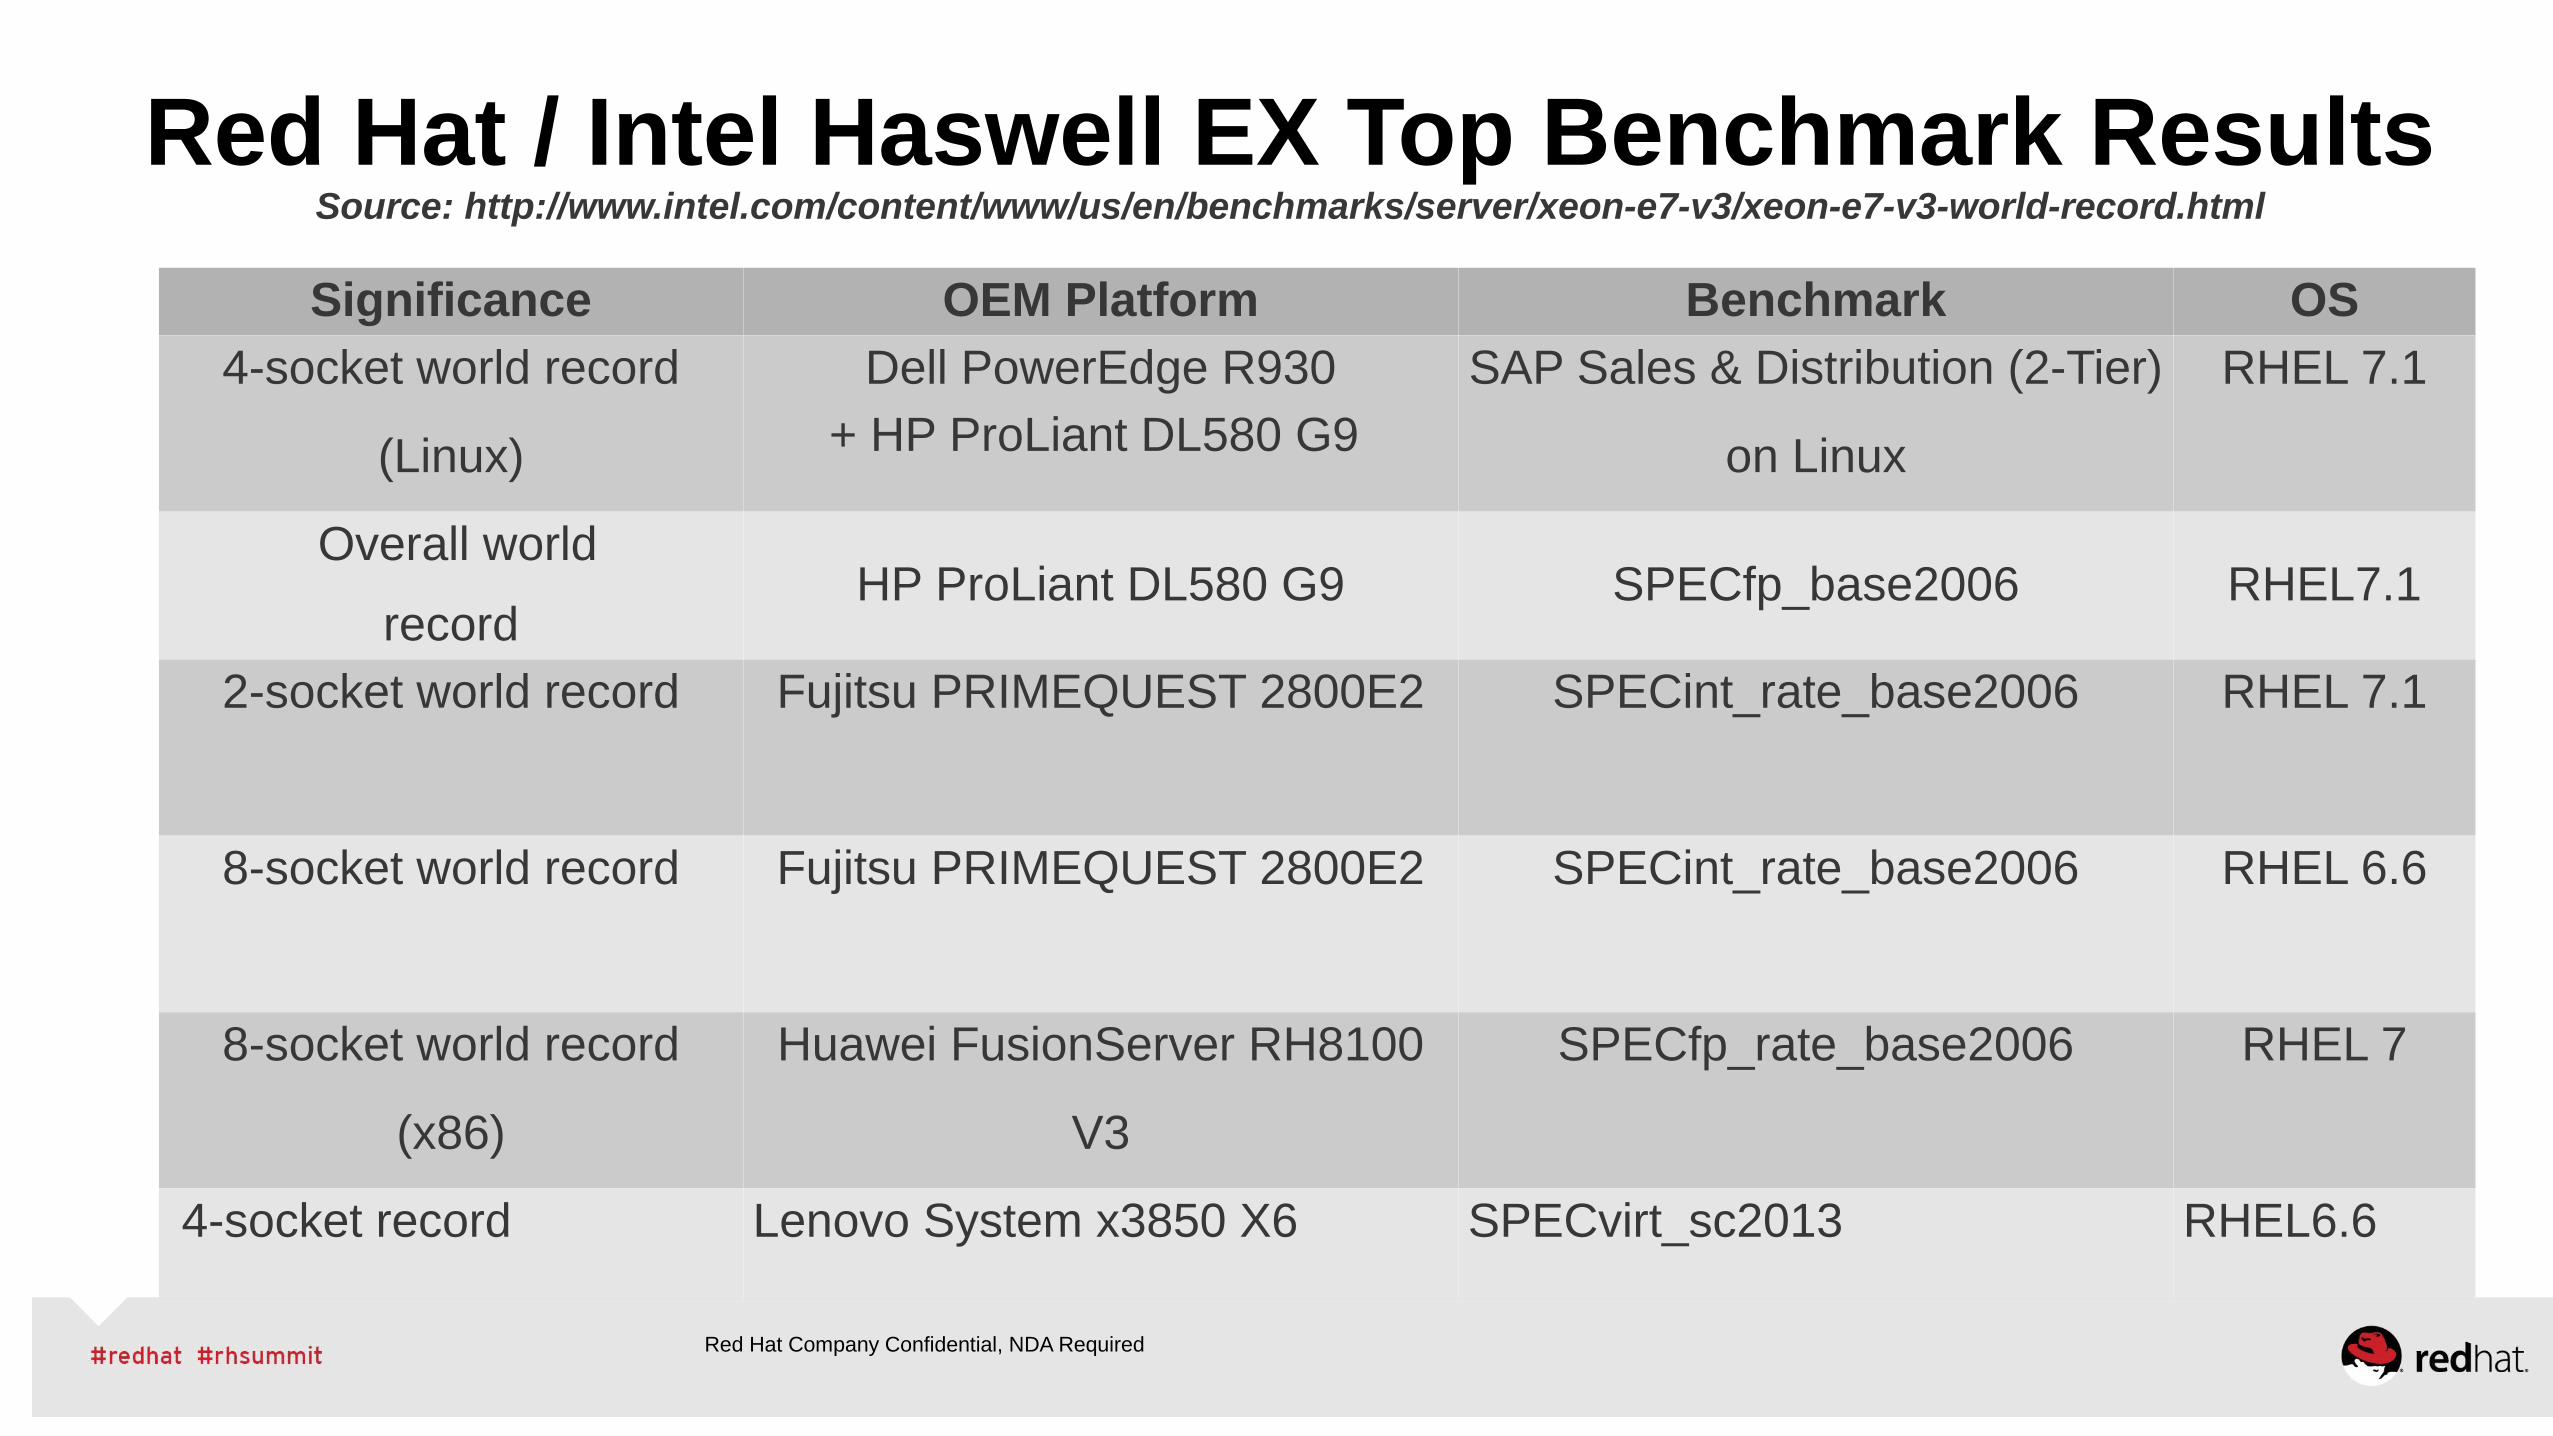
Red Hat / Intel Haswell EX Top Benchmark Results Source: http://www.intel.com/content/www/us/en/benchmarks/server/xeon-e7-v3/xeon-e7-v3-world-record.html
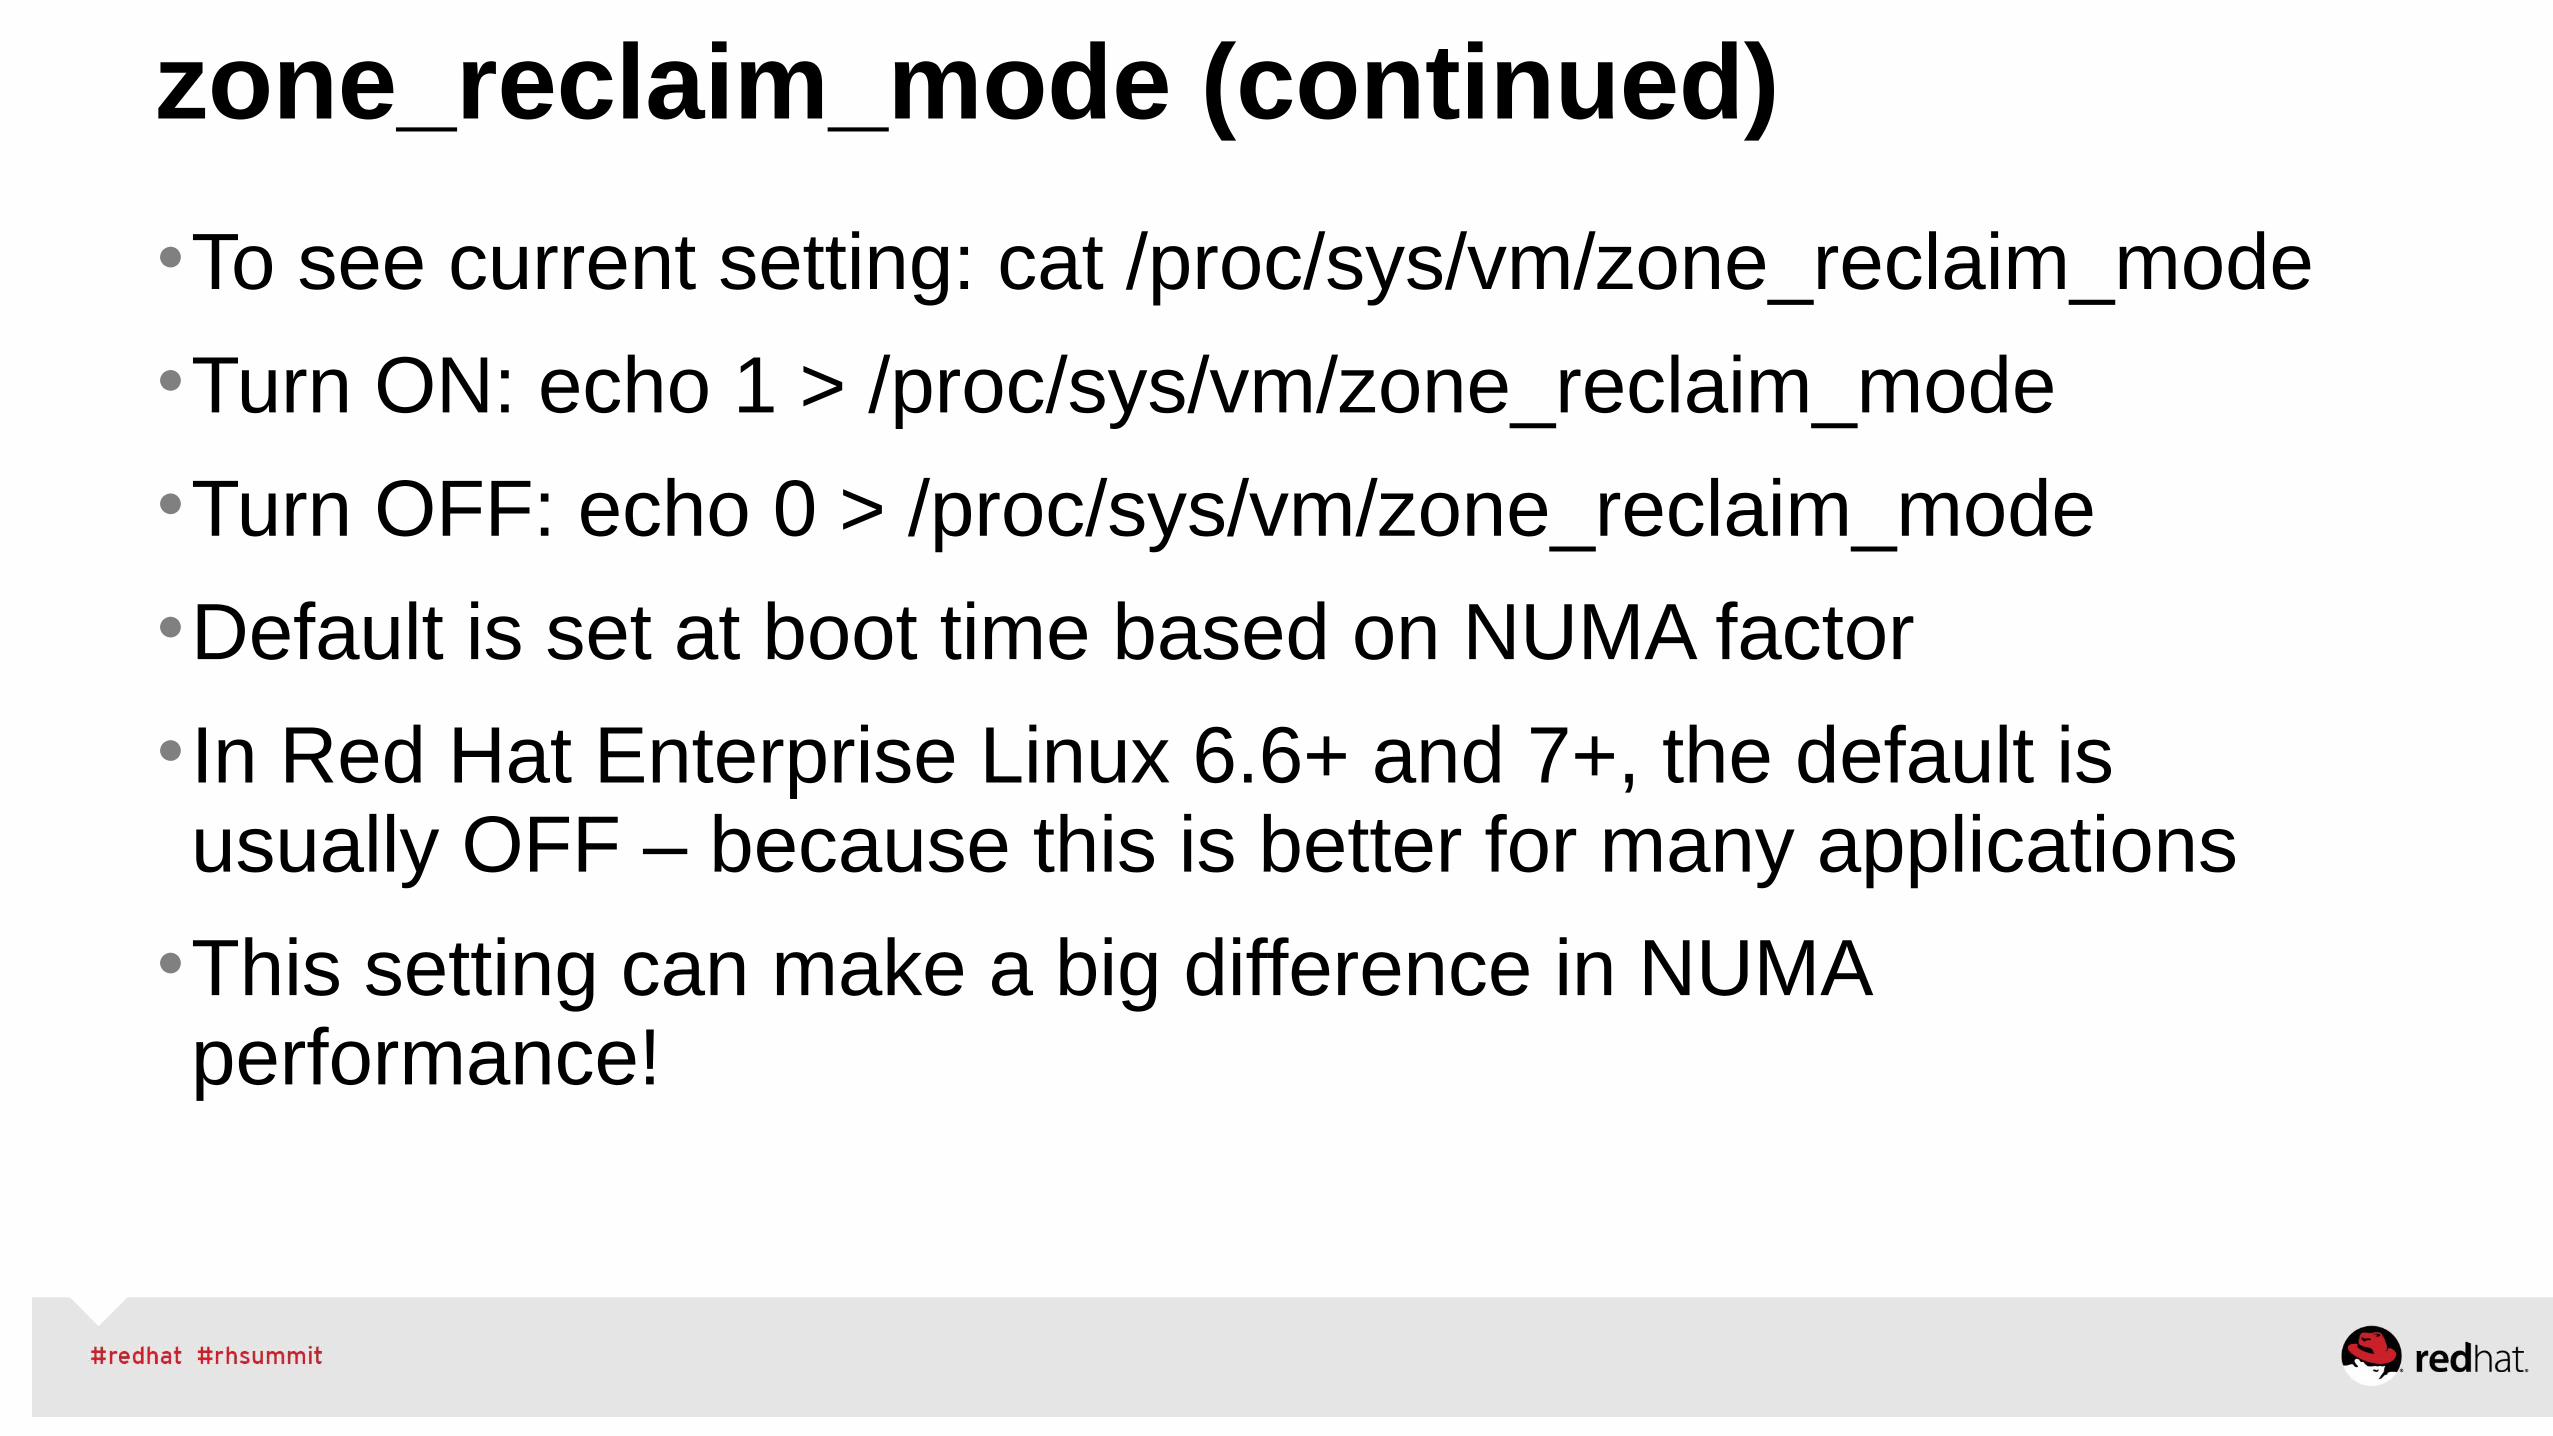
•In Red Hat Enterprise Linux 6.6+ and 7+, the default is usually OFF – because this is better for many applications
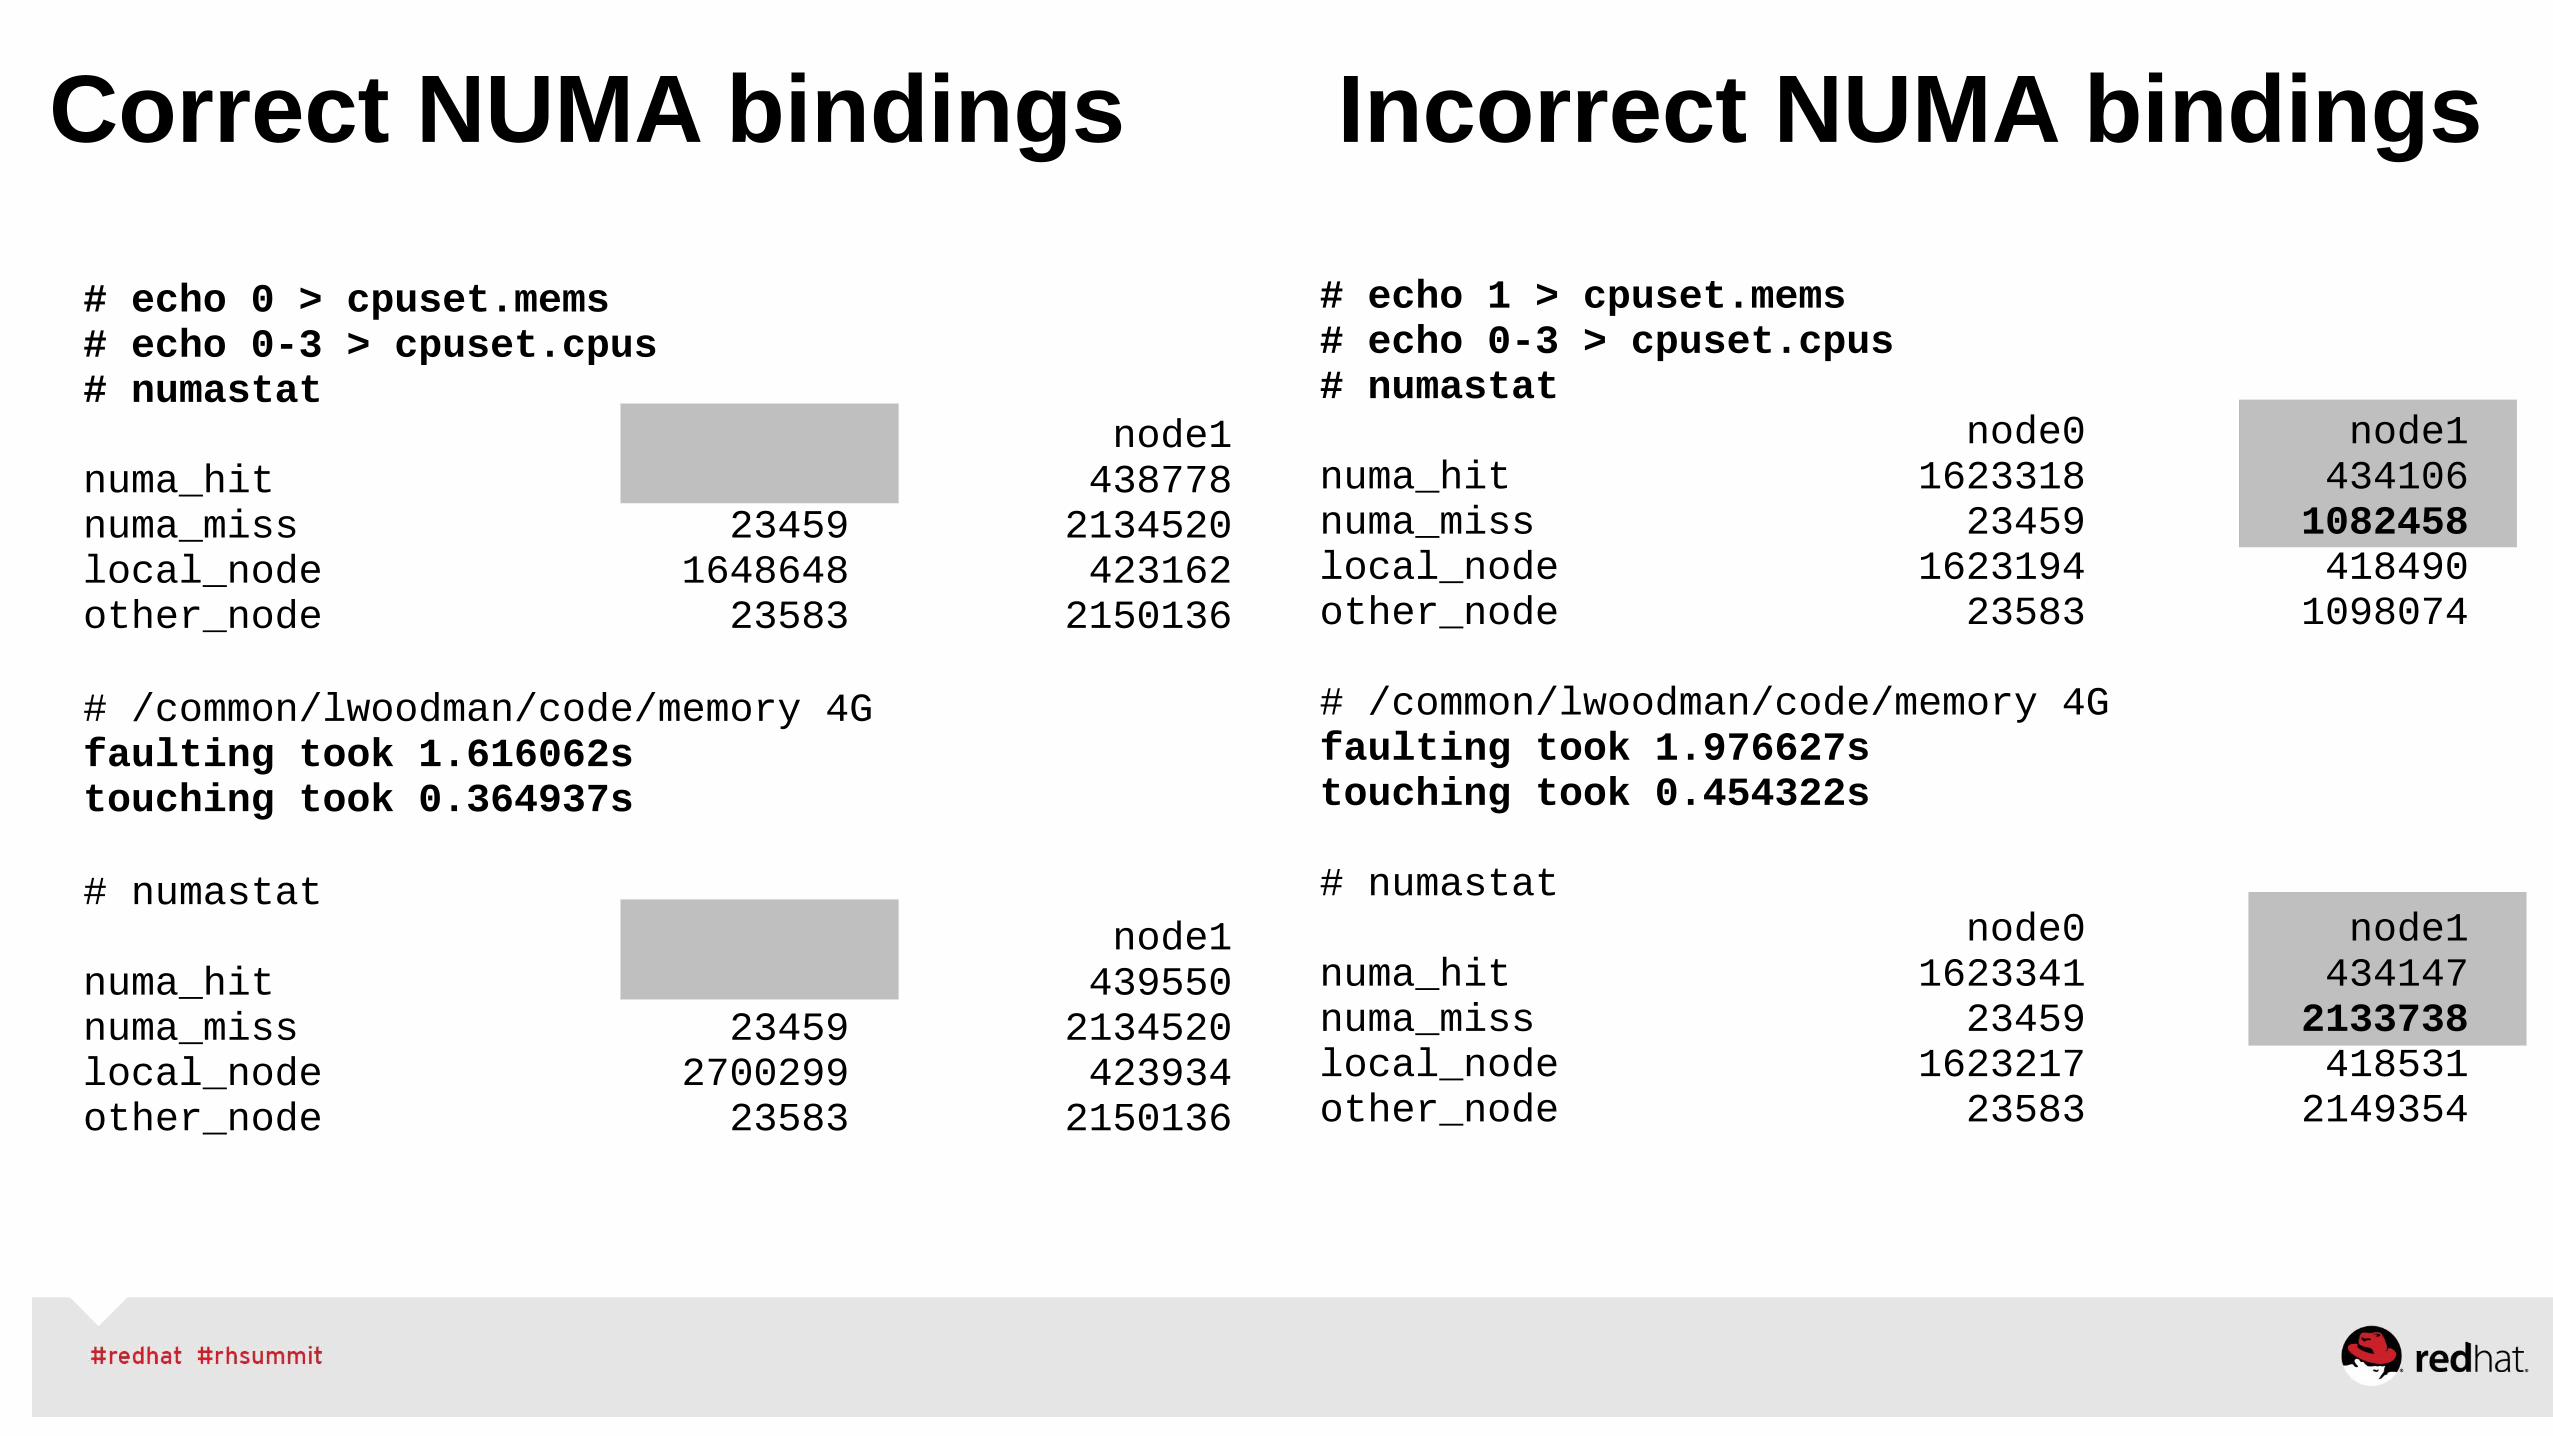
•This setting can make a big difference in NUMA performance!
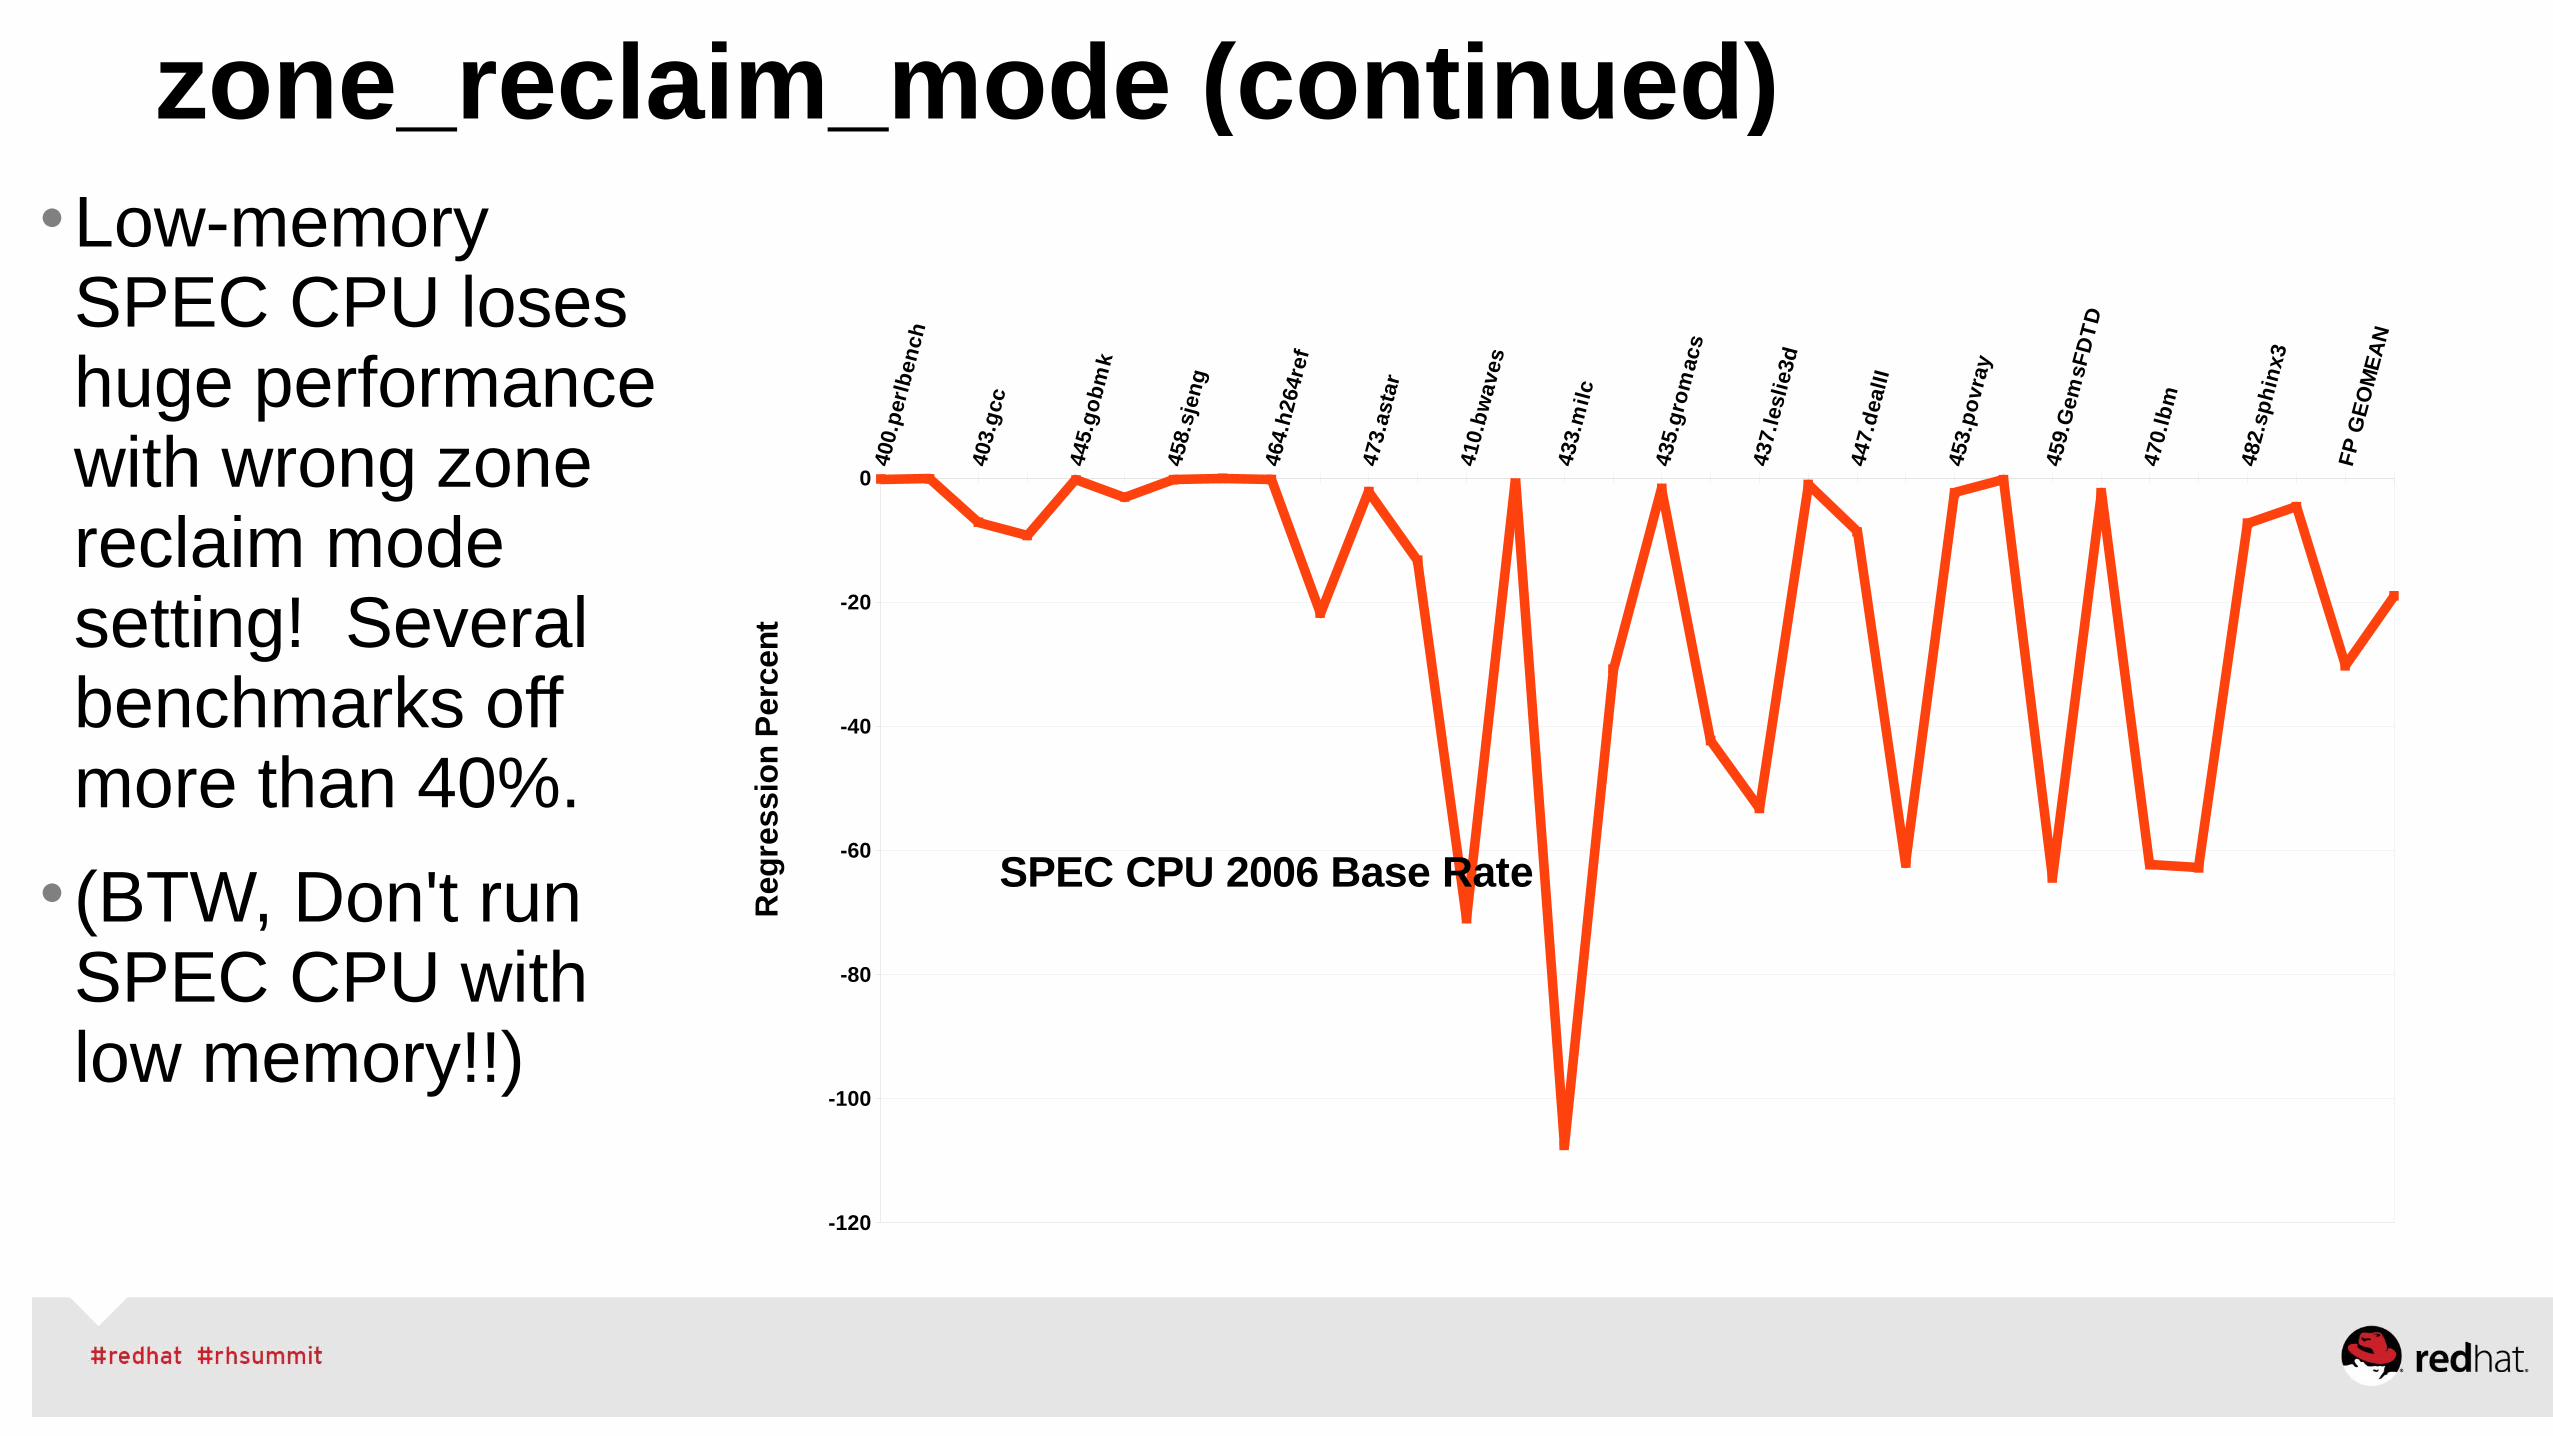
zone_reclaim_mode (continued)
•Low-memory SPEC CPU loses huge performance with wrong zone reclaim mode setting! Several benchmarks off more than 40%.
• (BTW, Don't run SPEC CPU with low memory!!)
zone_reclaim_mode (continued)
400.
per
lben
ch
403.
gcc
445.
go
bm
k
458.
sjen
g
464.
h26
4ref
473.
asta
r
410.
bw
aves
433.
mil
c
435.
gro
mac
s
437.
lesl
ie3d
447.
dea
lII
453.
po
vray
459.
Gem
sFD
TD
470.
lbm
482.
sph
inx3
FP
GE
OM
EA
N
-120
-100
-80
-60
-40
-20
0
SPEC CPU 2006 Base Rate
Reg
ress
ion
Per
cen
t
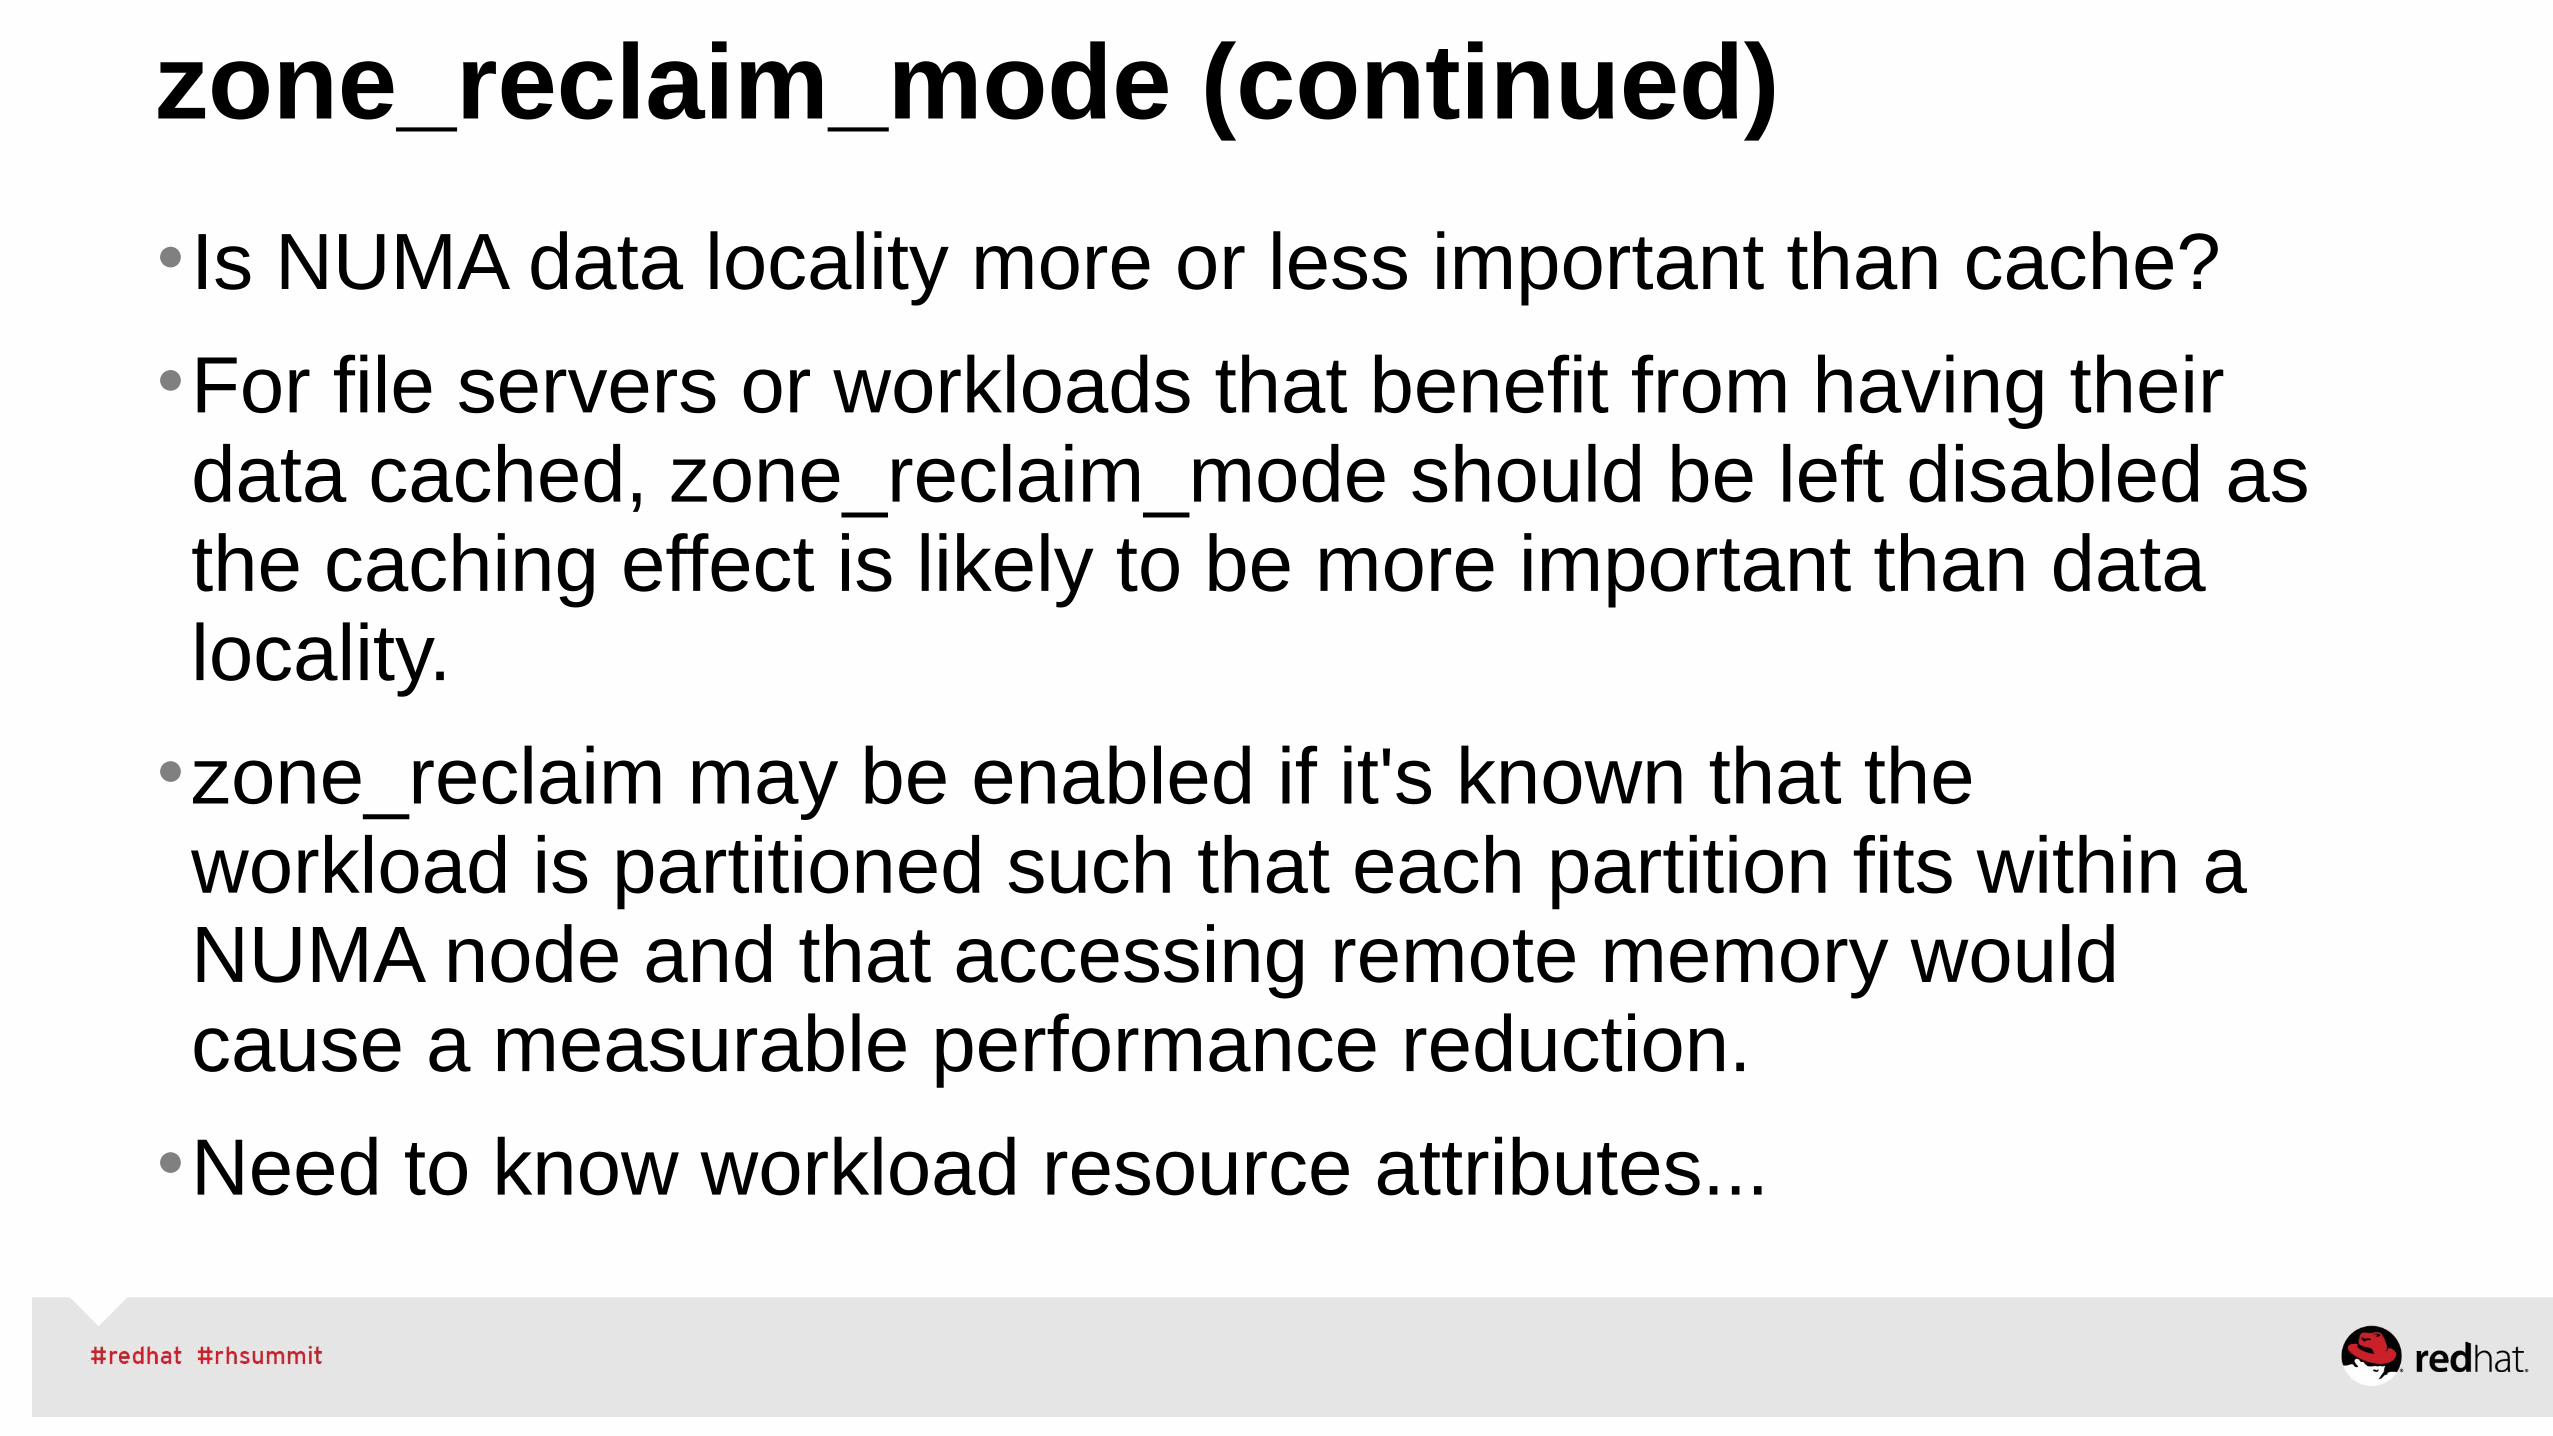
•Is NUMA data locality more or less important than cache?
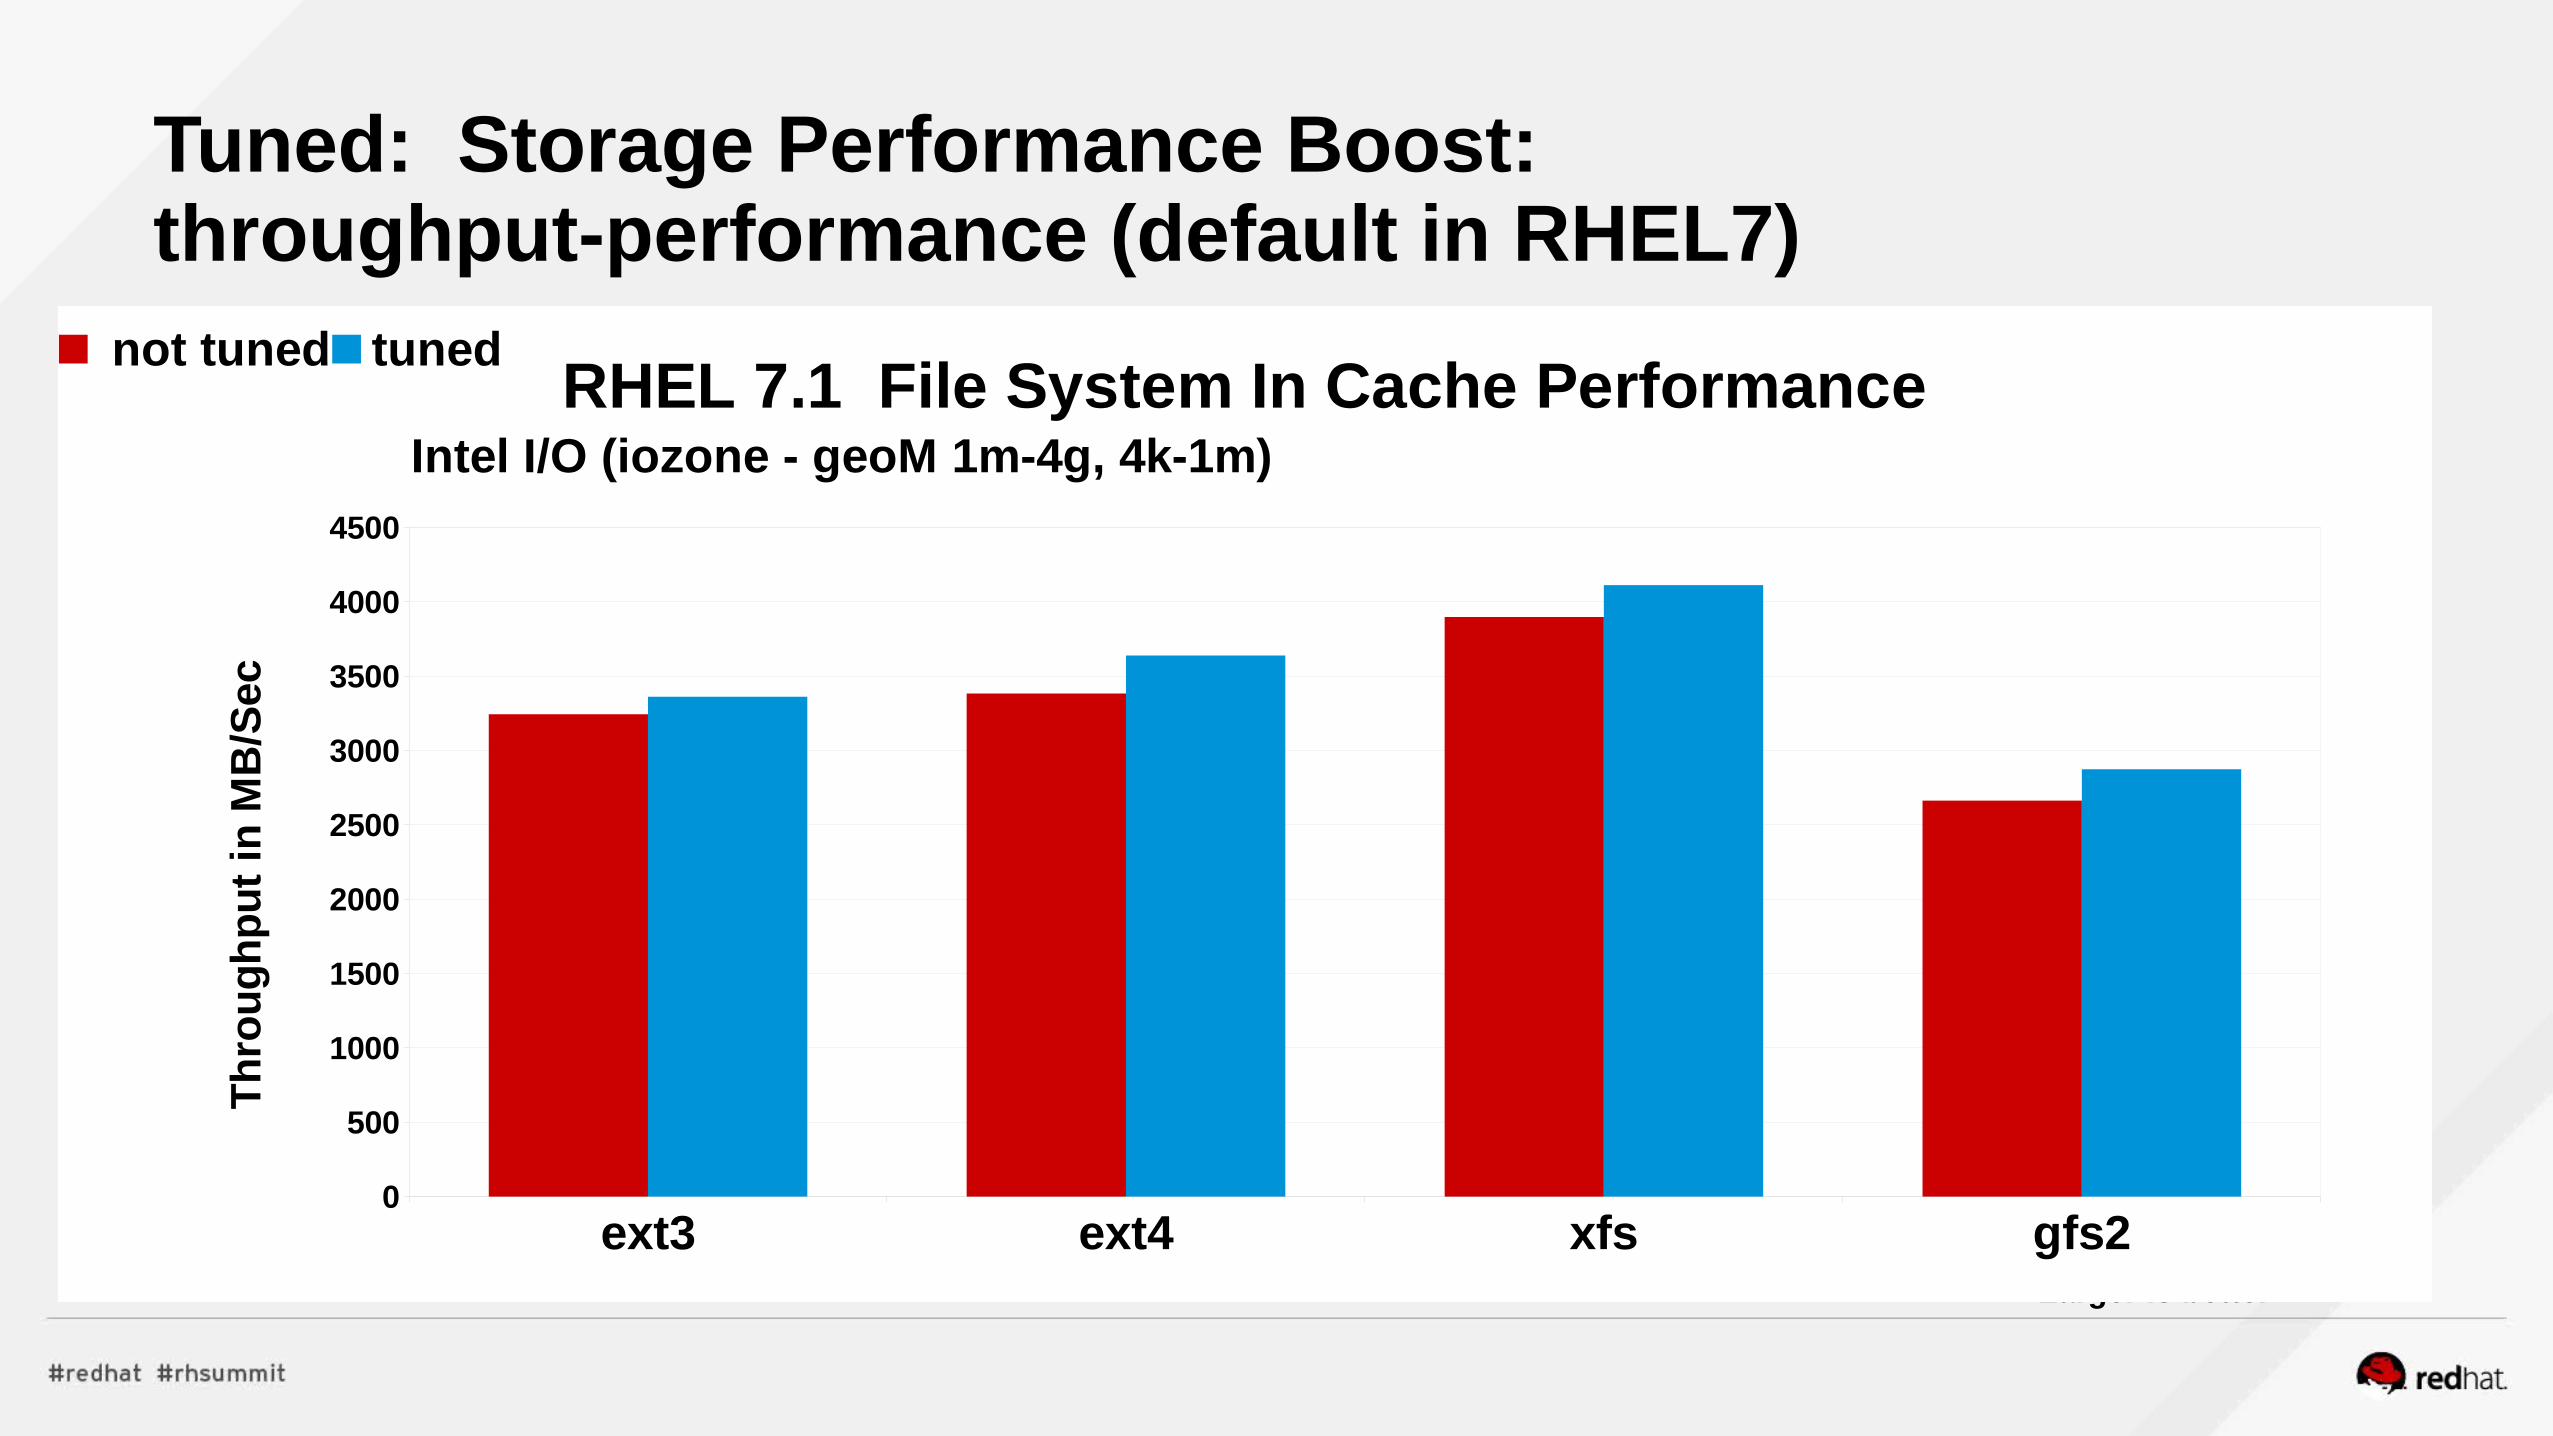
•For file servers or workloads that benefit from having their data cached, zone_reclaim_mode should be left disabled as the caching effect is likely to be more important than data locality.
•zone_reclaim may be enabled if it's known that the workload is partitioned such that each partition fits within a NUMA node and that accessing remote memory would cause a measurable performance reduction.
•Need to know workload resource attributes...
zone_reclaim_mode (continued)
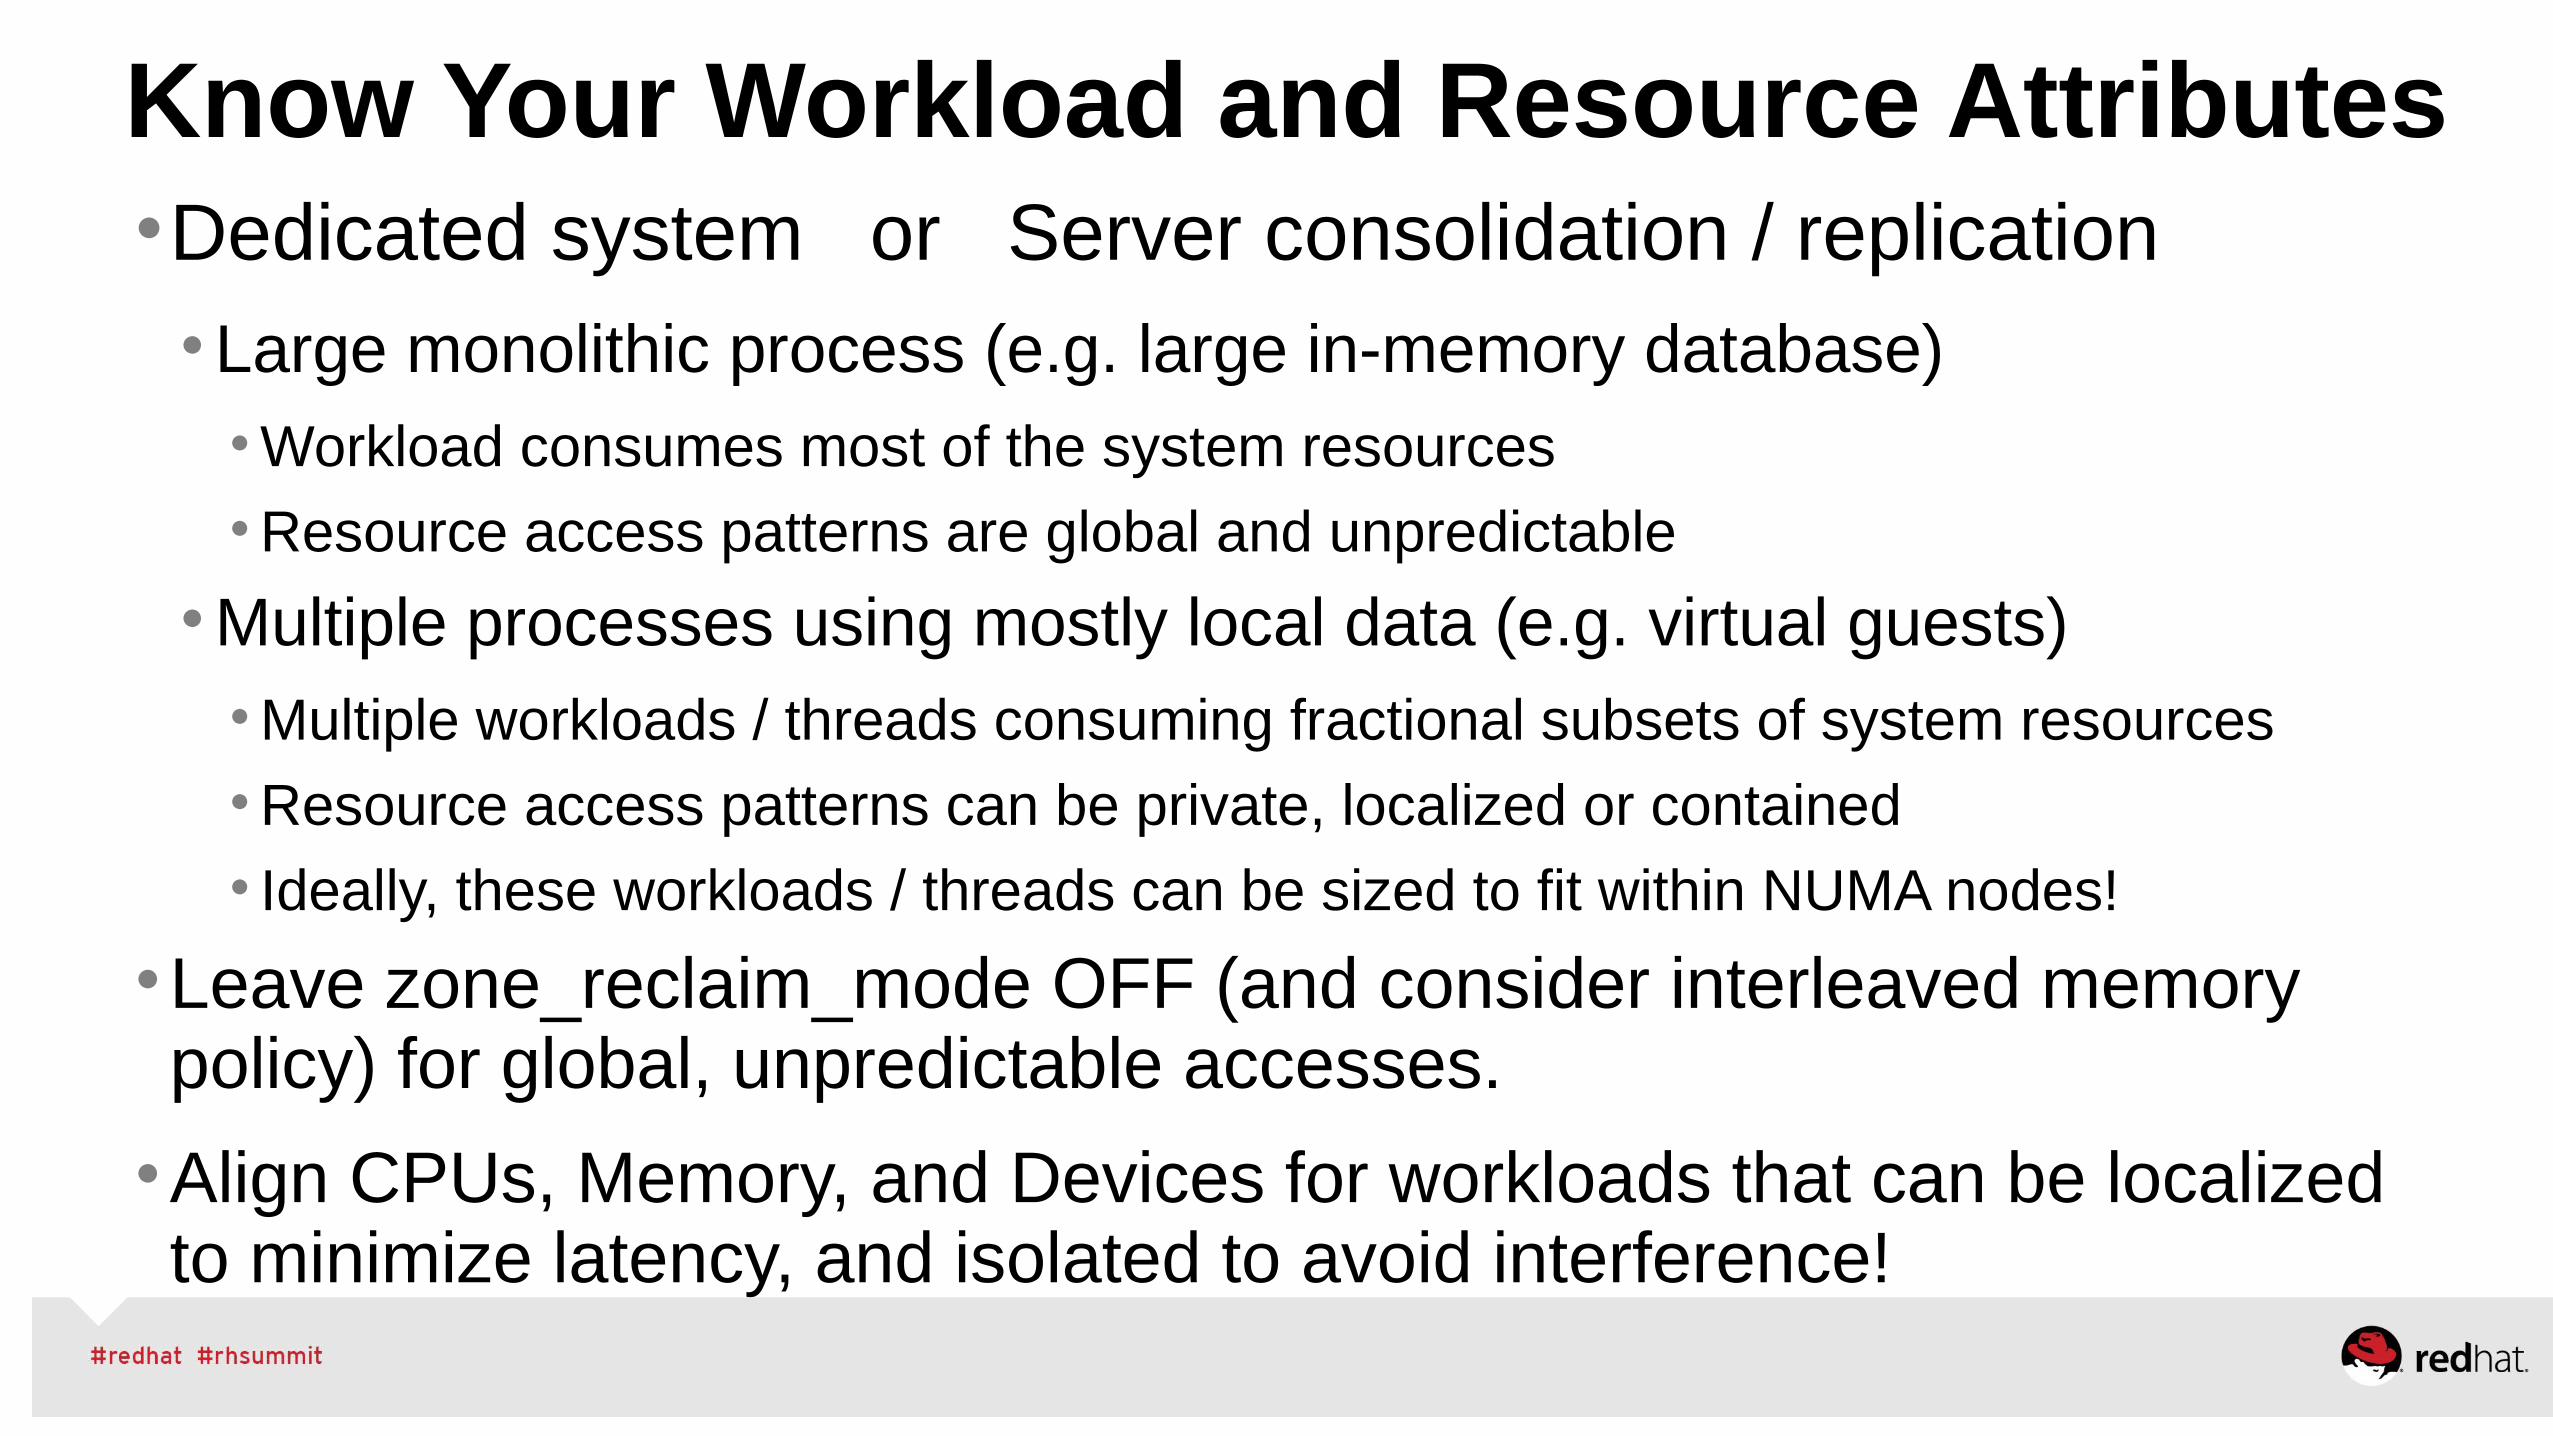
Know Your Workload and Resource Attributes•Dedicated system or Server consolidation / replication•Large monolithic process (e.g. large in-memory database)•Workload consumes most of the system resources
•Resource access patterns are global and unpredictable
•Multiple processes using mostly local data (e.g. virtual guests)•Multiple workloads / threads consuming fractional subsets of system resources
•Resource access patterns can be private, localized or contained
• Ideally, these workloads / threads can be sized to fit within NUMA nodes!
•Leave zone_reclaim_mode OFF (and consider interleaved memory policy) for global, unpredictable accesses.
•Align CPUs, Memory, and Devices for workloads that can be localized to minimize latency, and isolated to avoid interference!
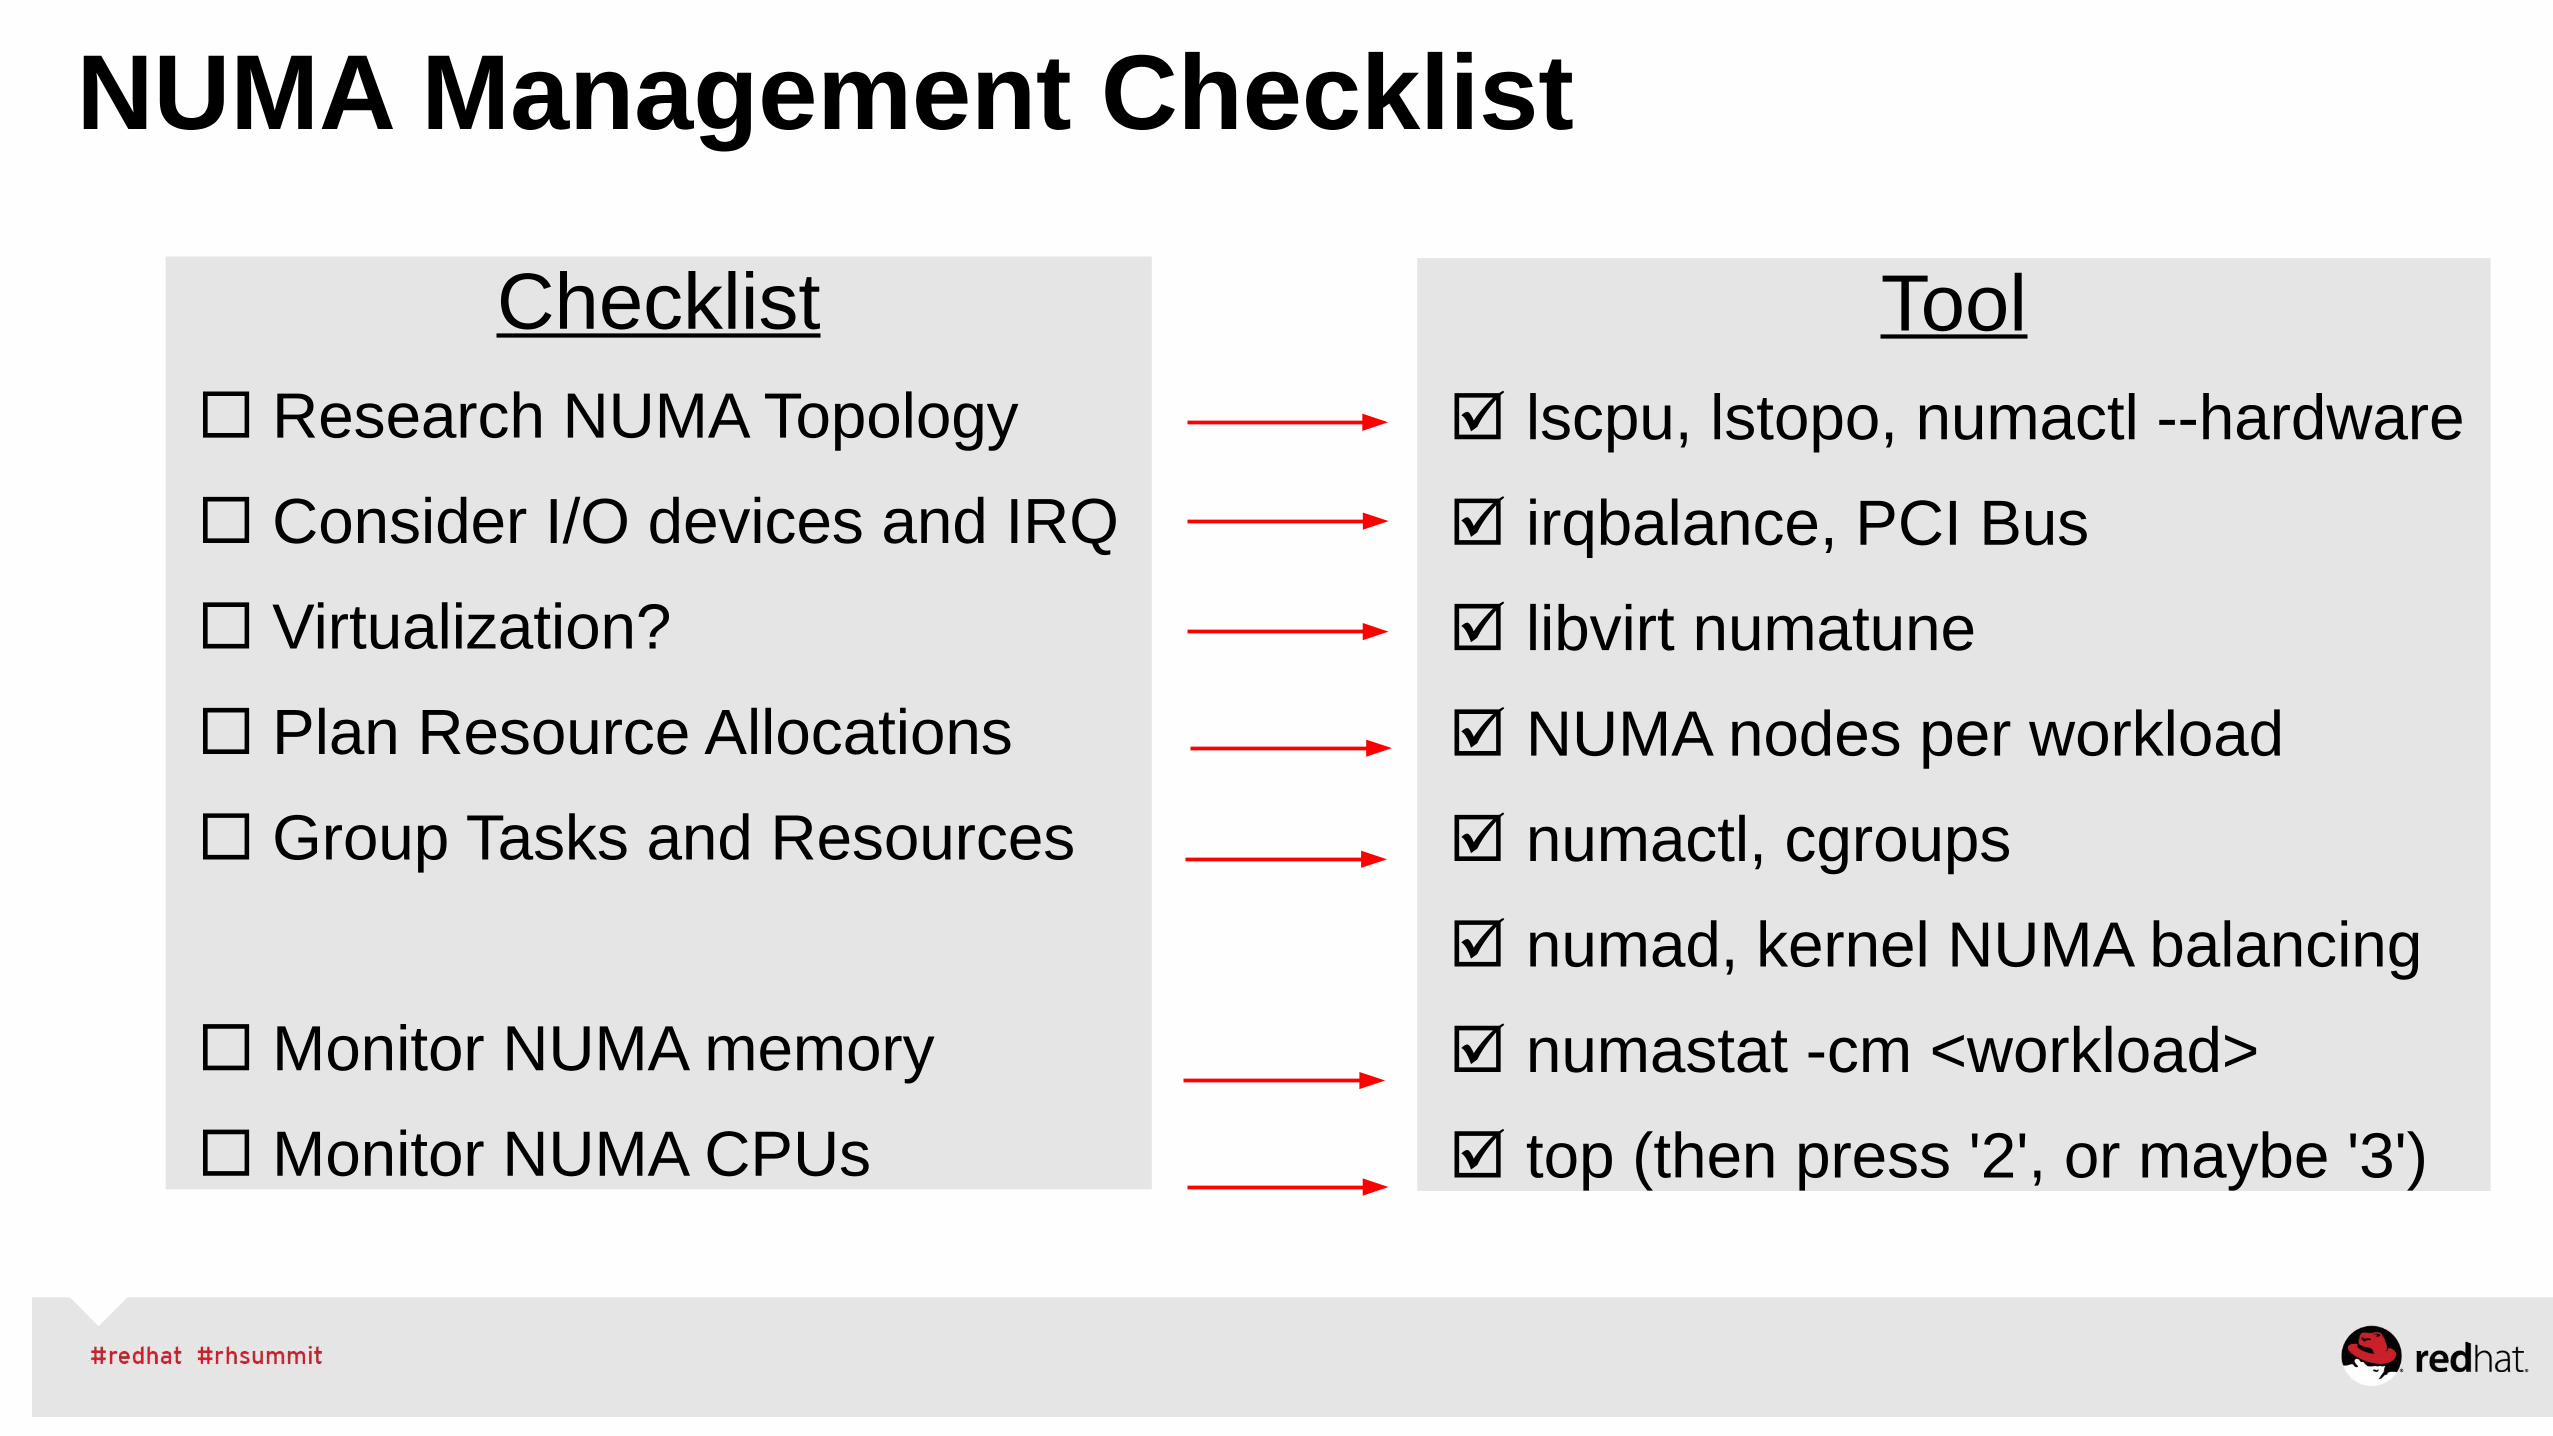
NUMA Management Checklist
Checklist Research NUMA Topology
Consider I/O devices and IRQ
Virtualization?
Plan Resource Allocations
Group Tasks and Resources
Monitor NUMA memory
Monitor NUMA CPUs
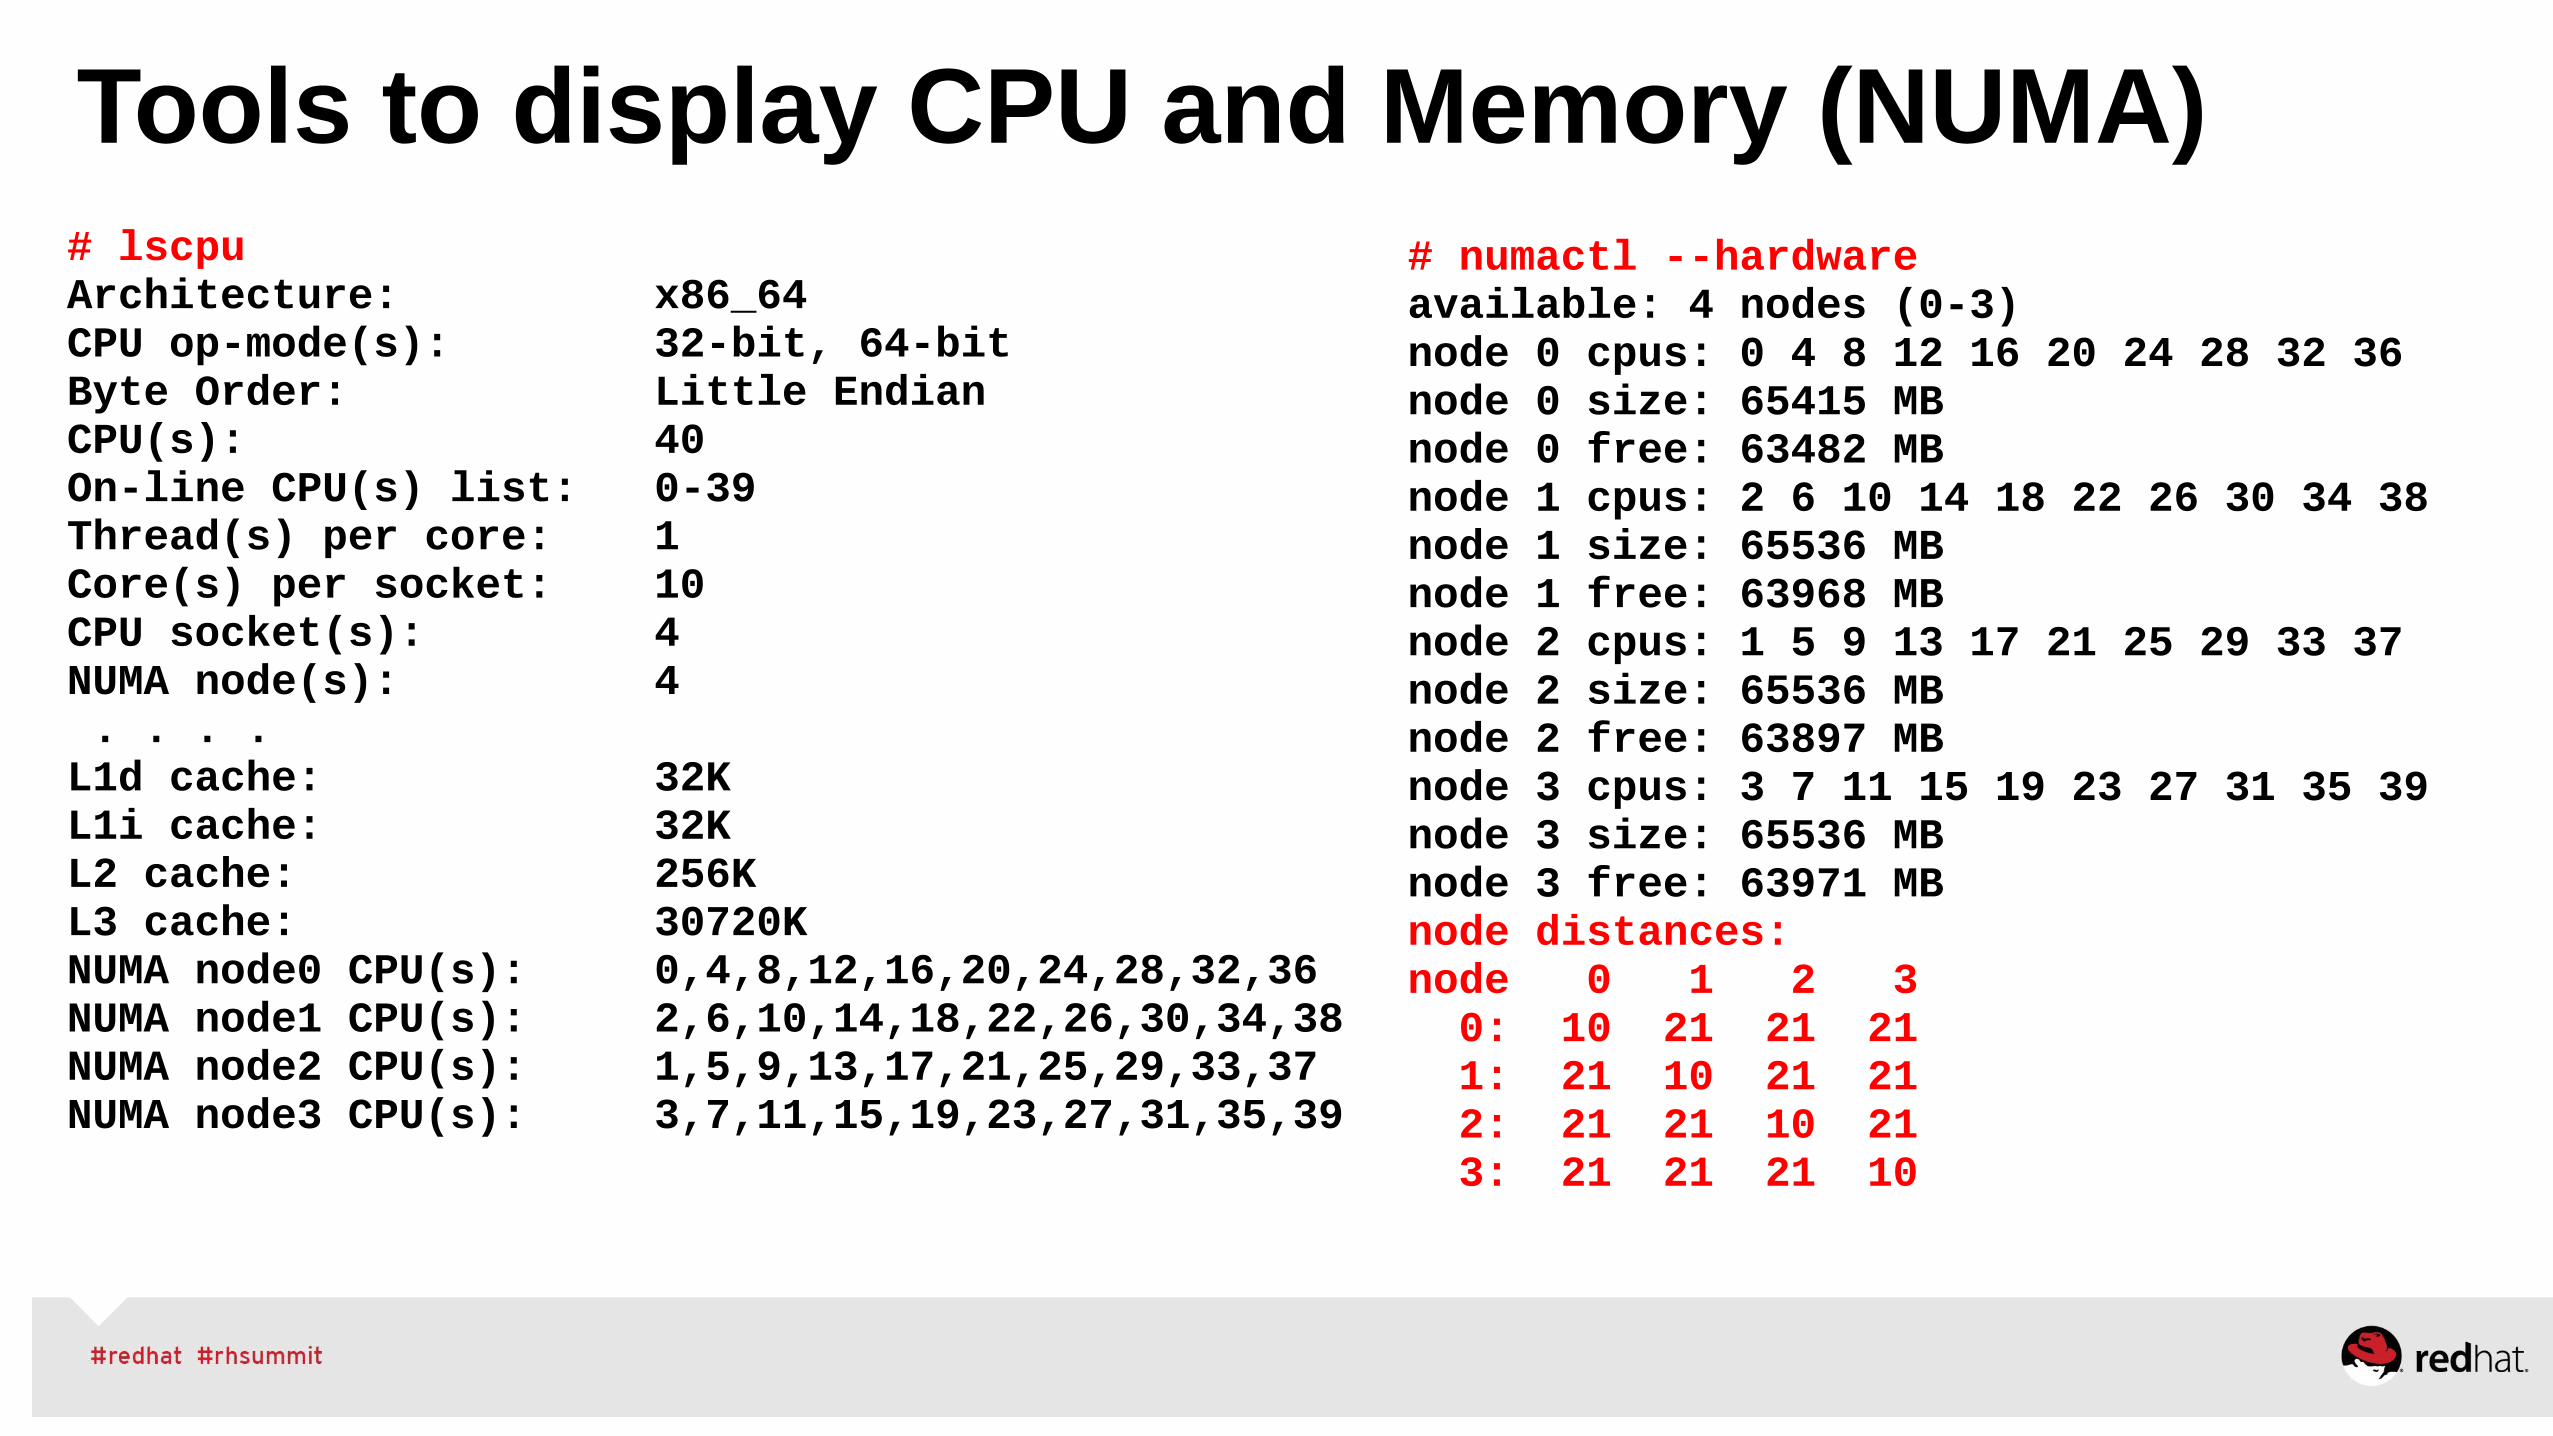
Tool lscpu, lstopo, numactl --hardware
irqbalance, PCI Bus
libvirt numatune
NUMA nodes per workload
numactl, cgroups
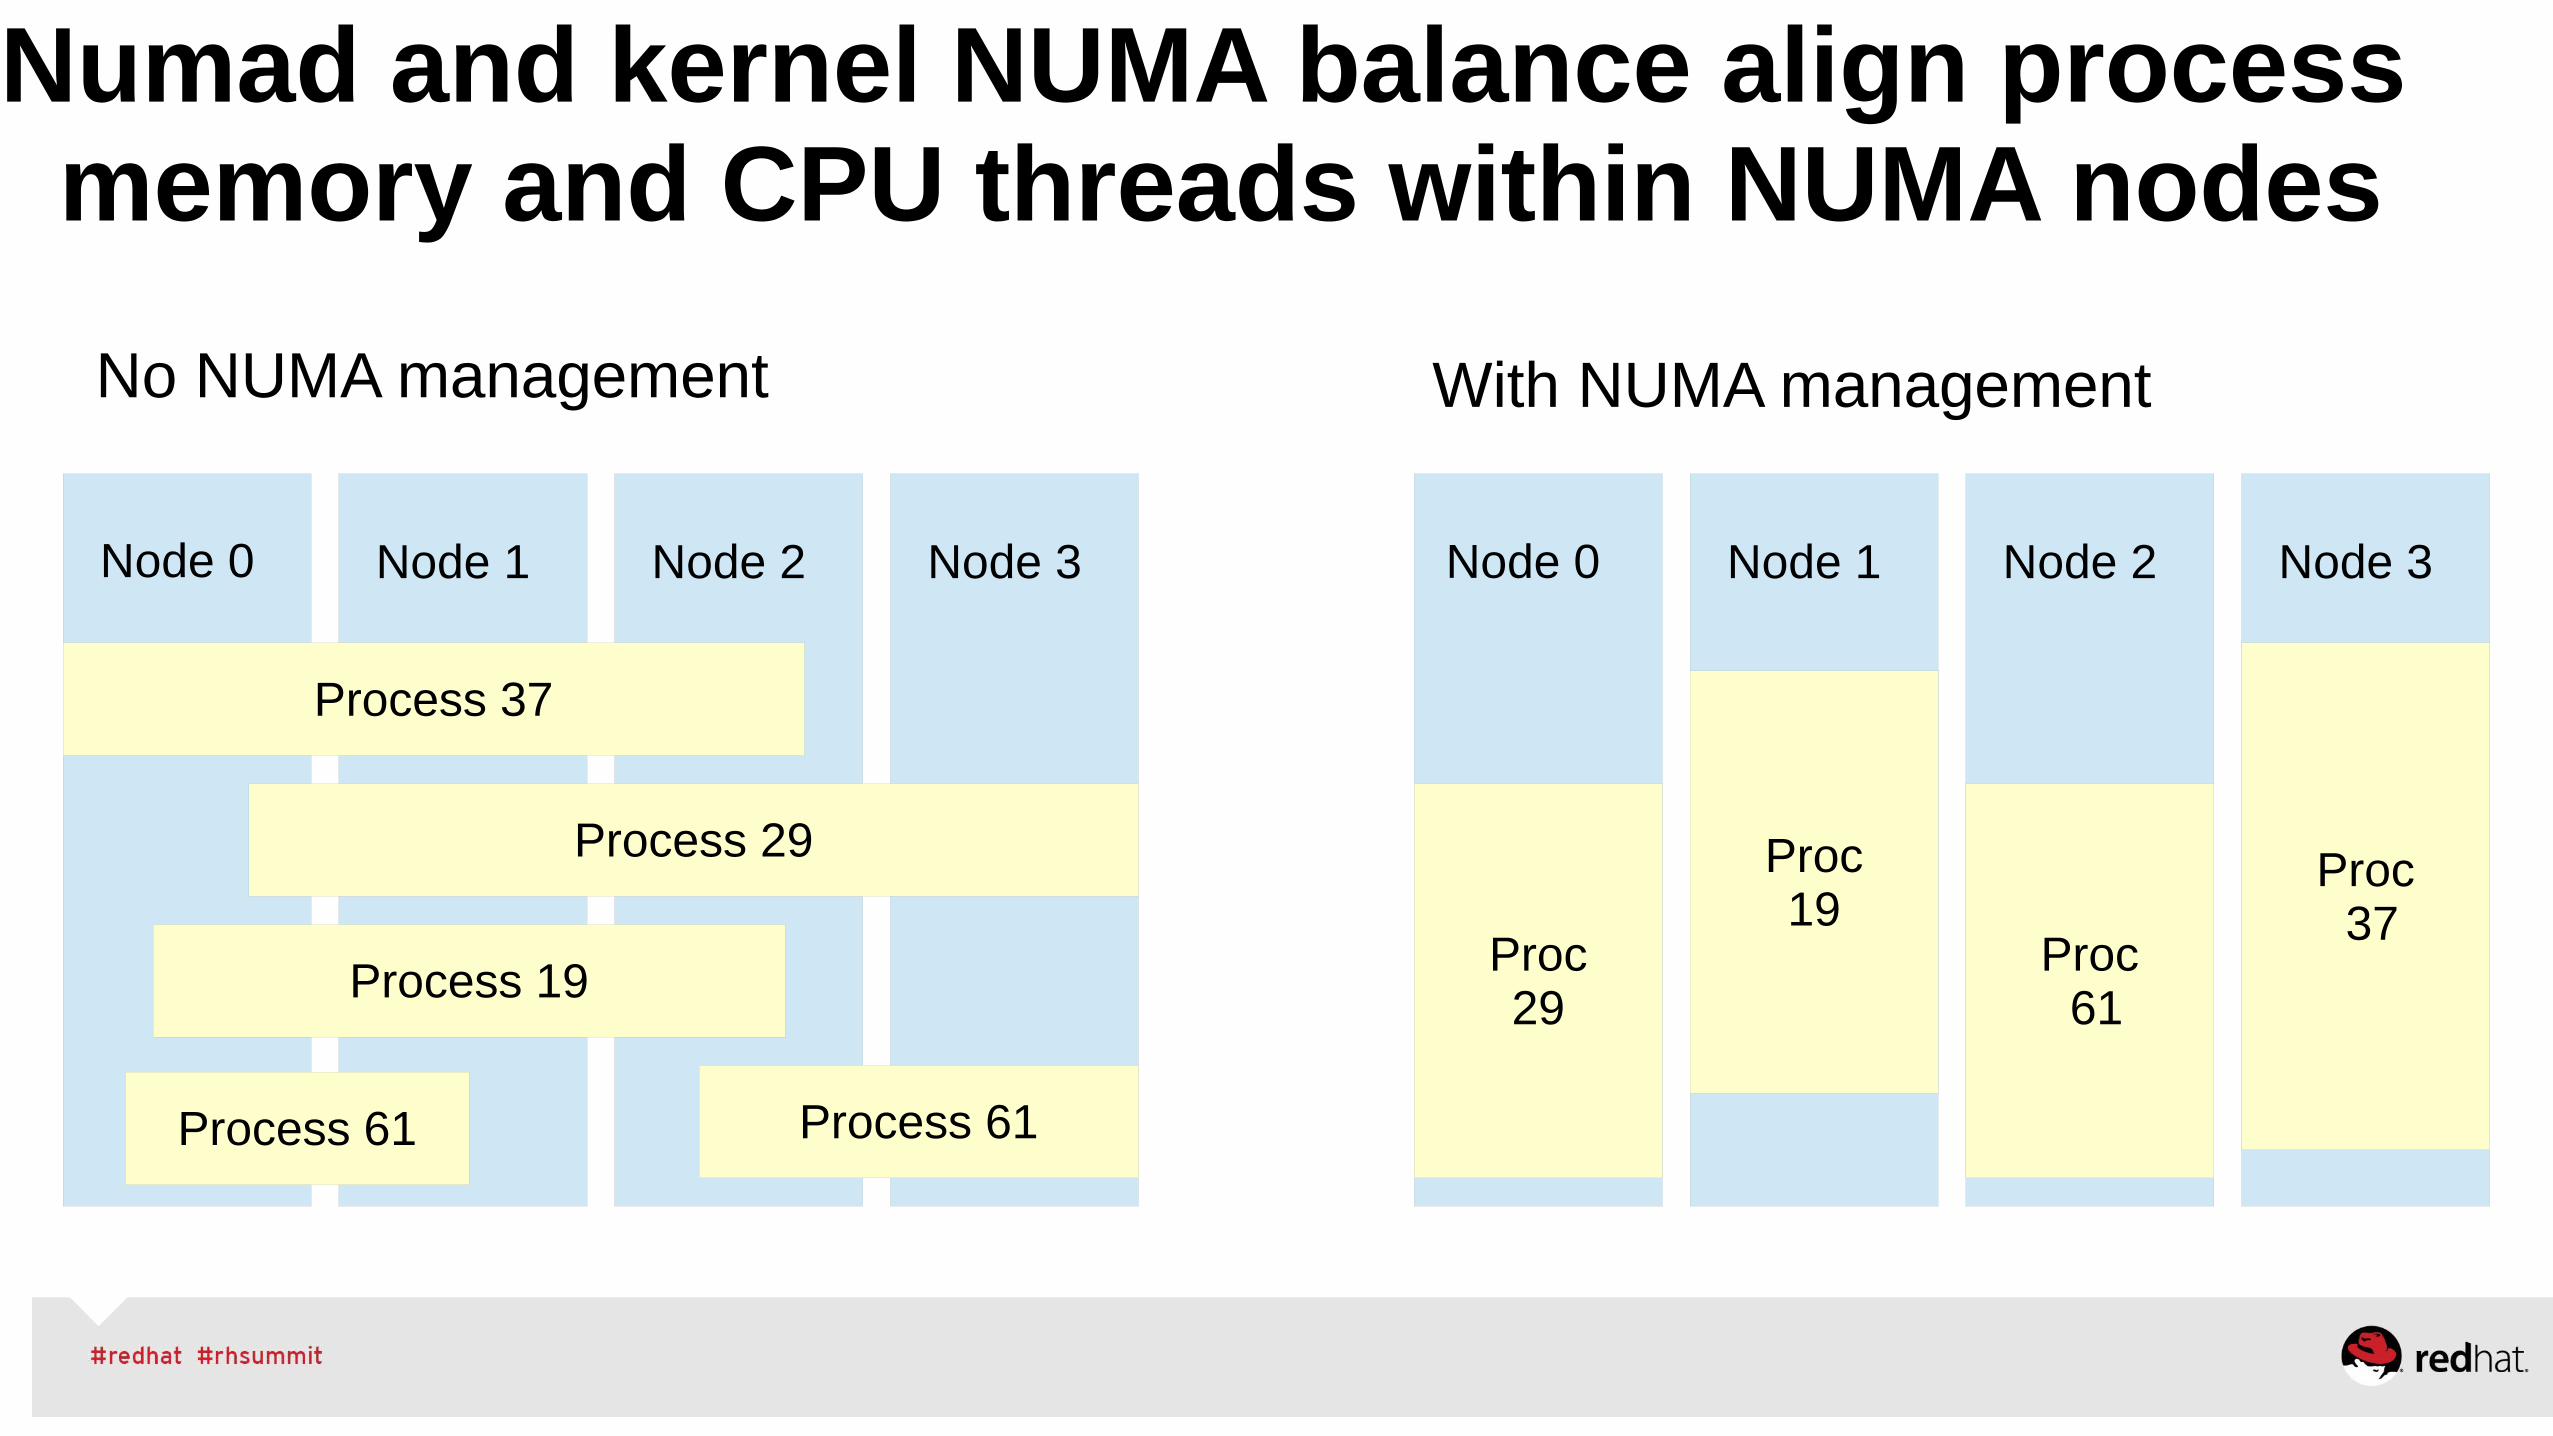
numad, kernel NUMA balancing
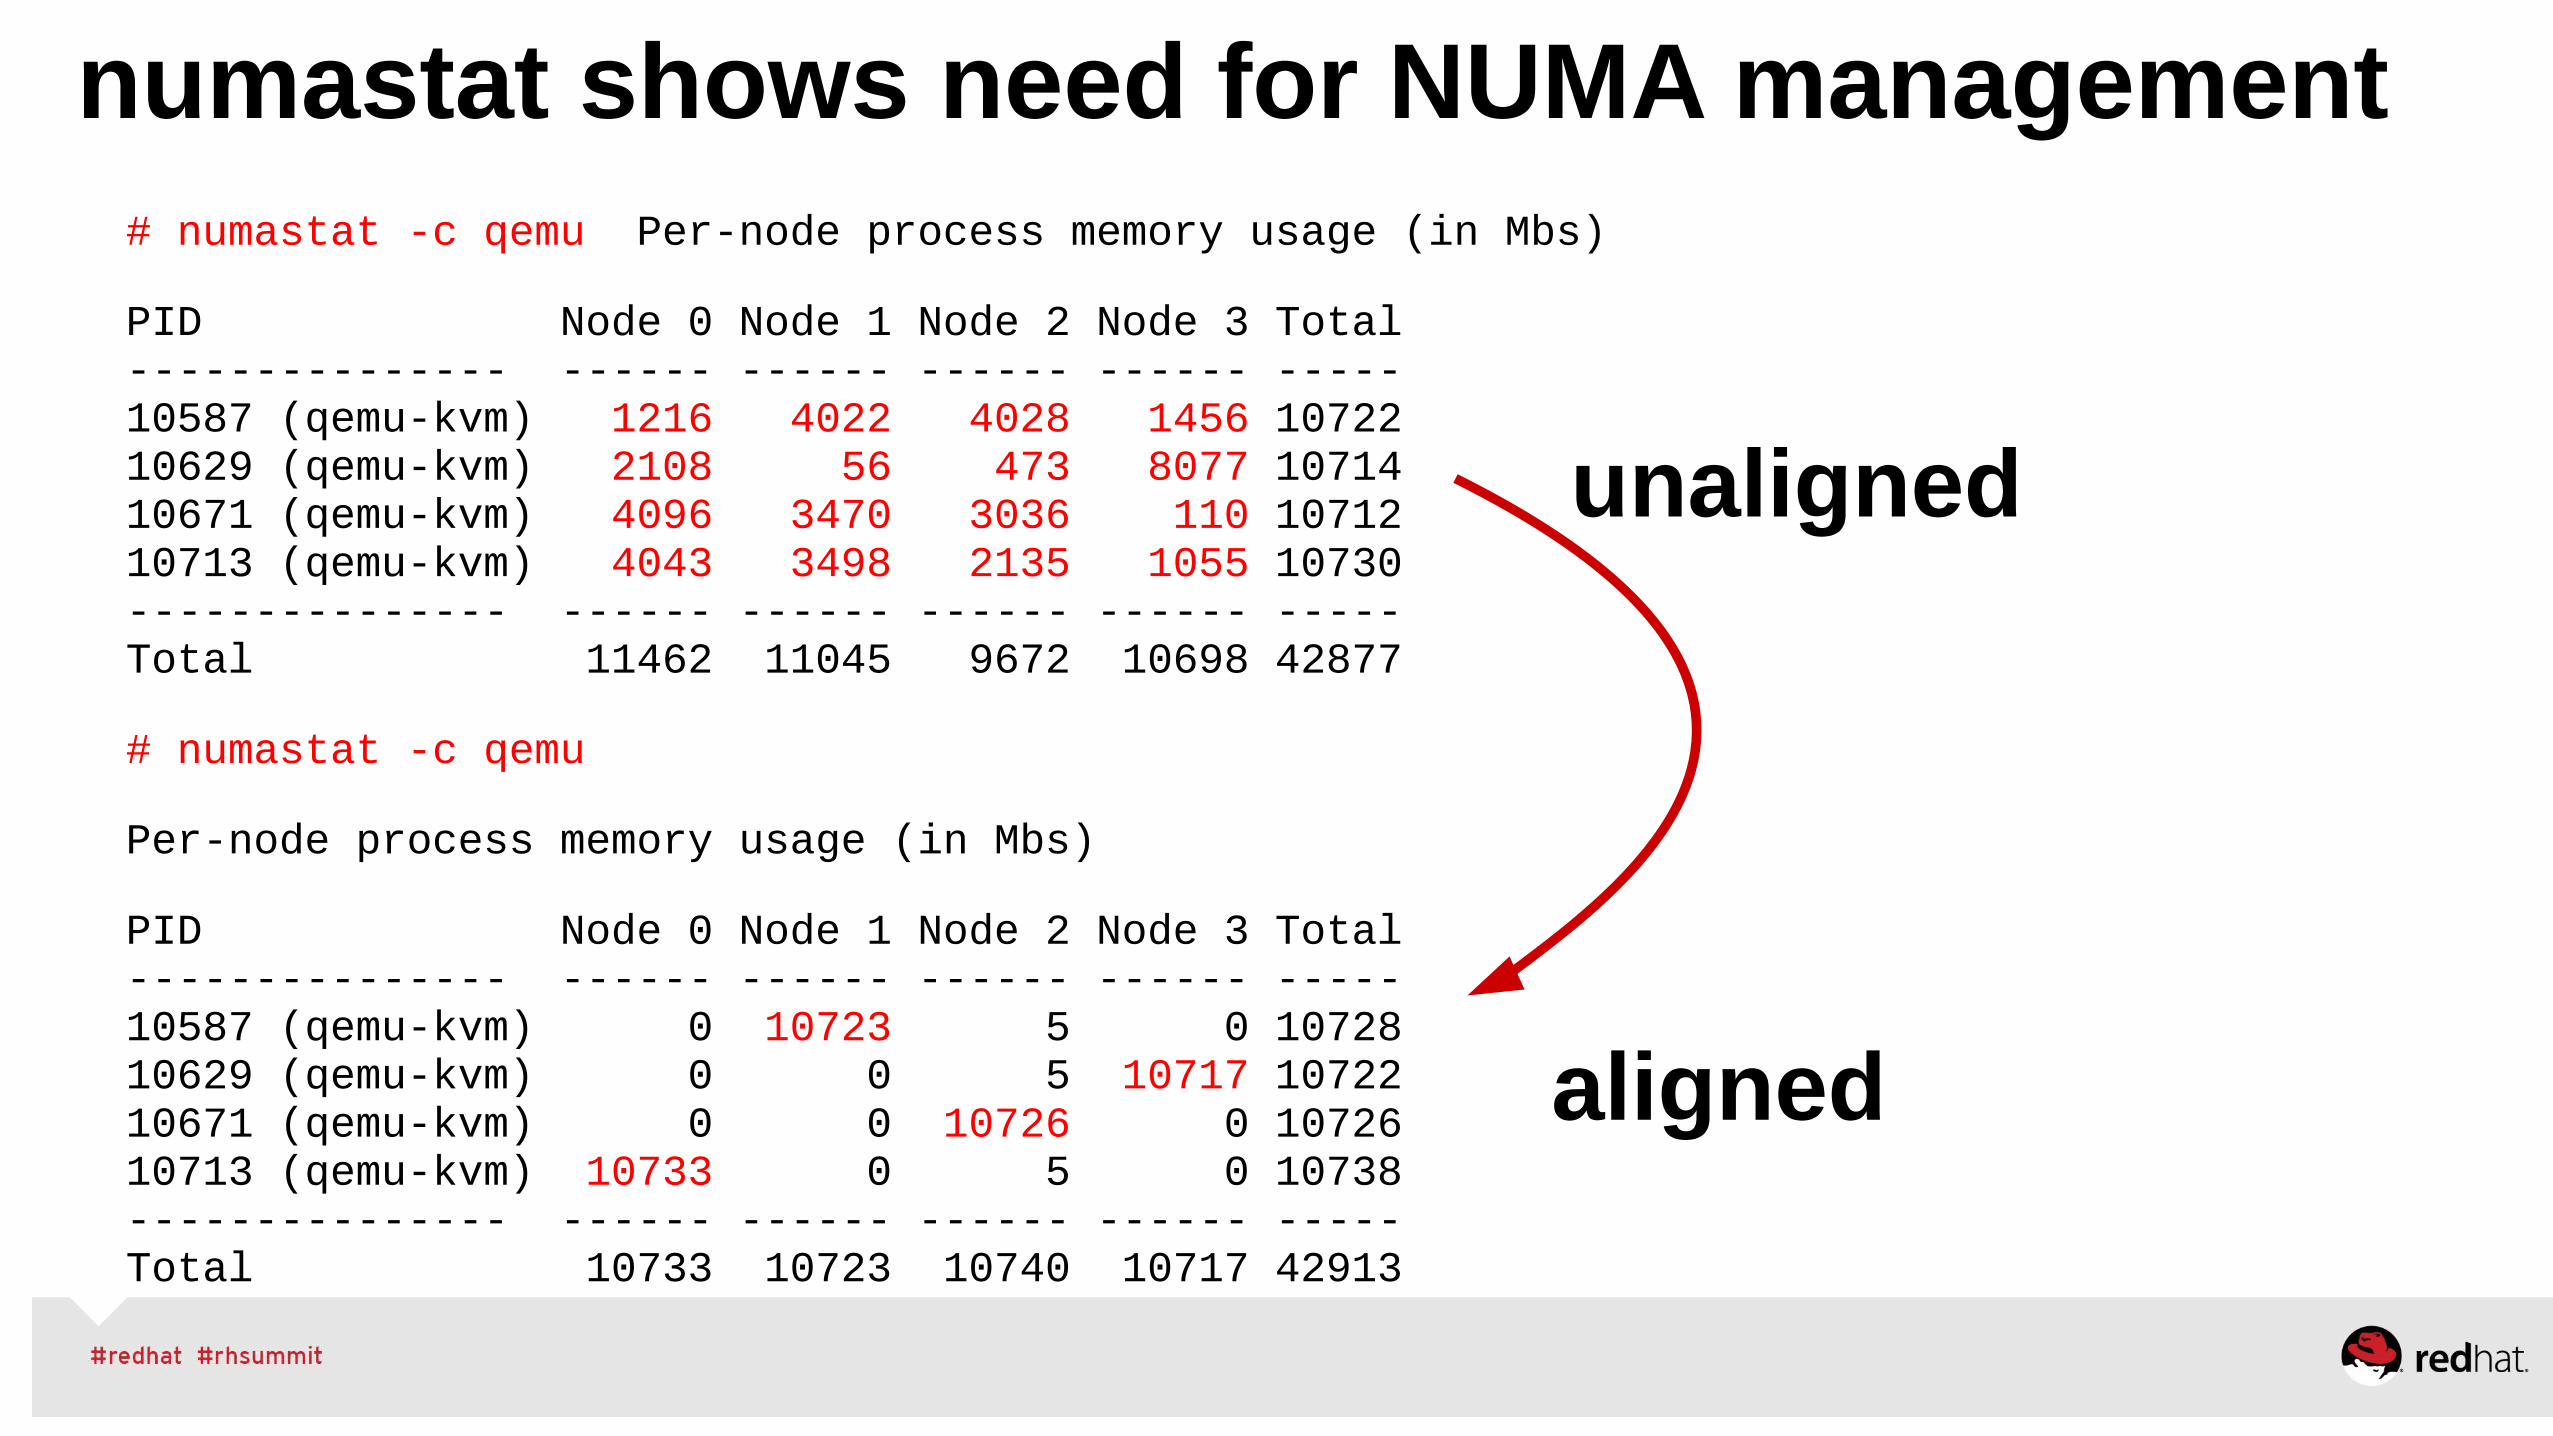
numastat -cm <workload>
top (then press '2', or maybe '3')
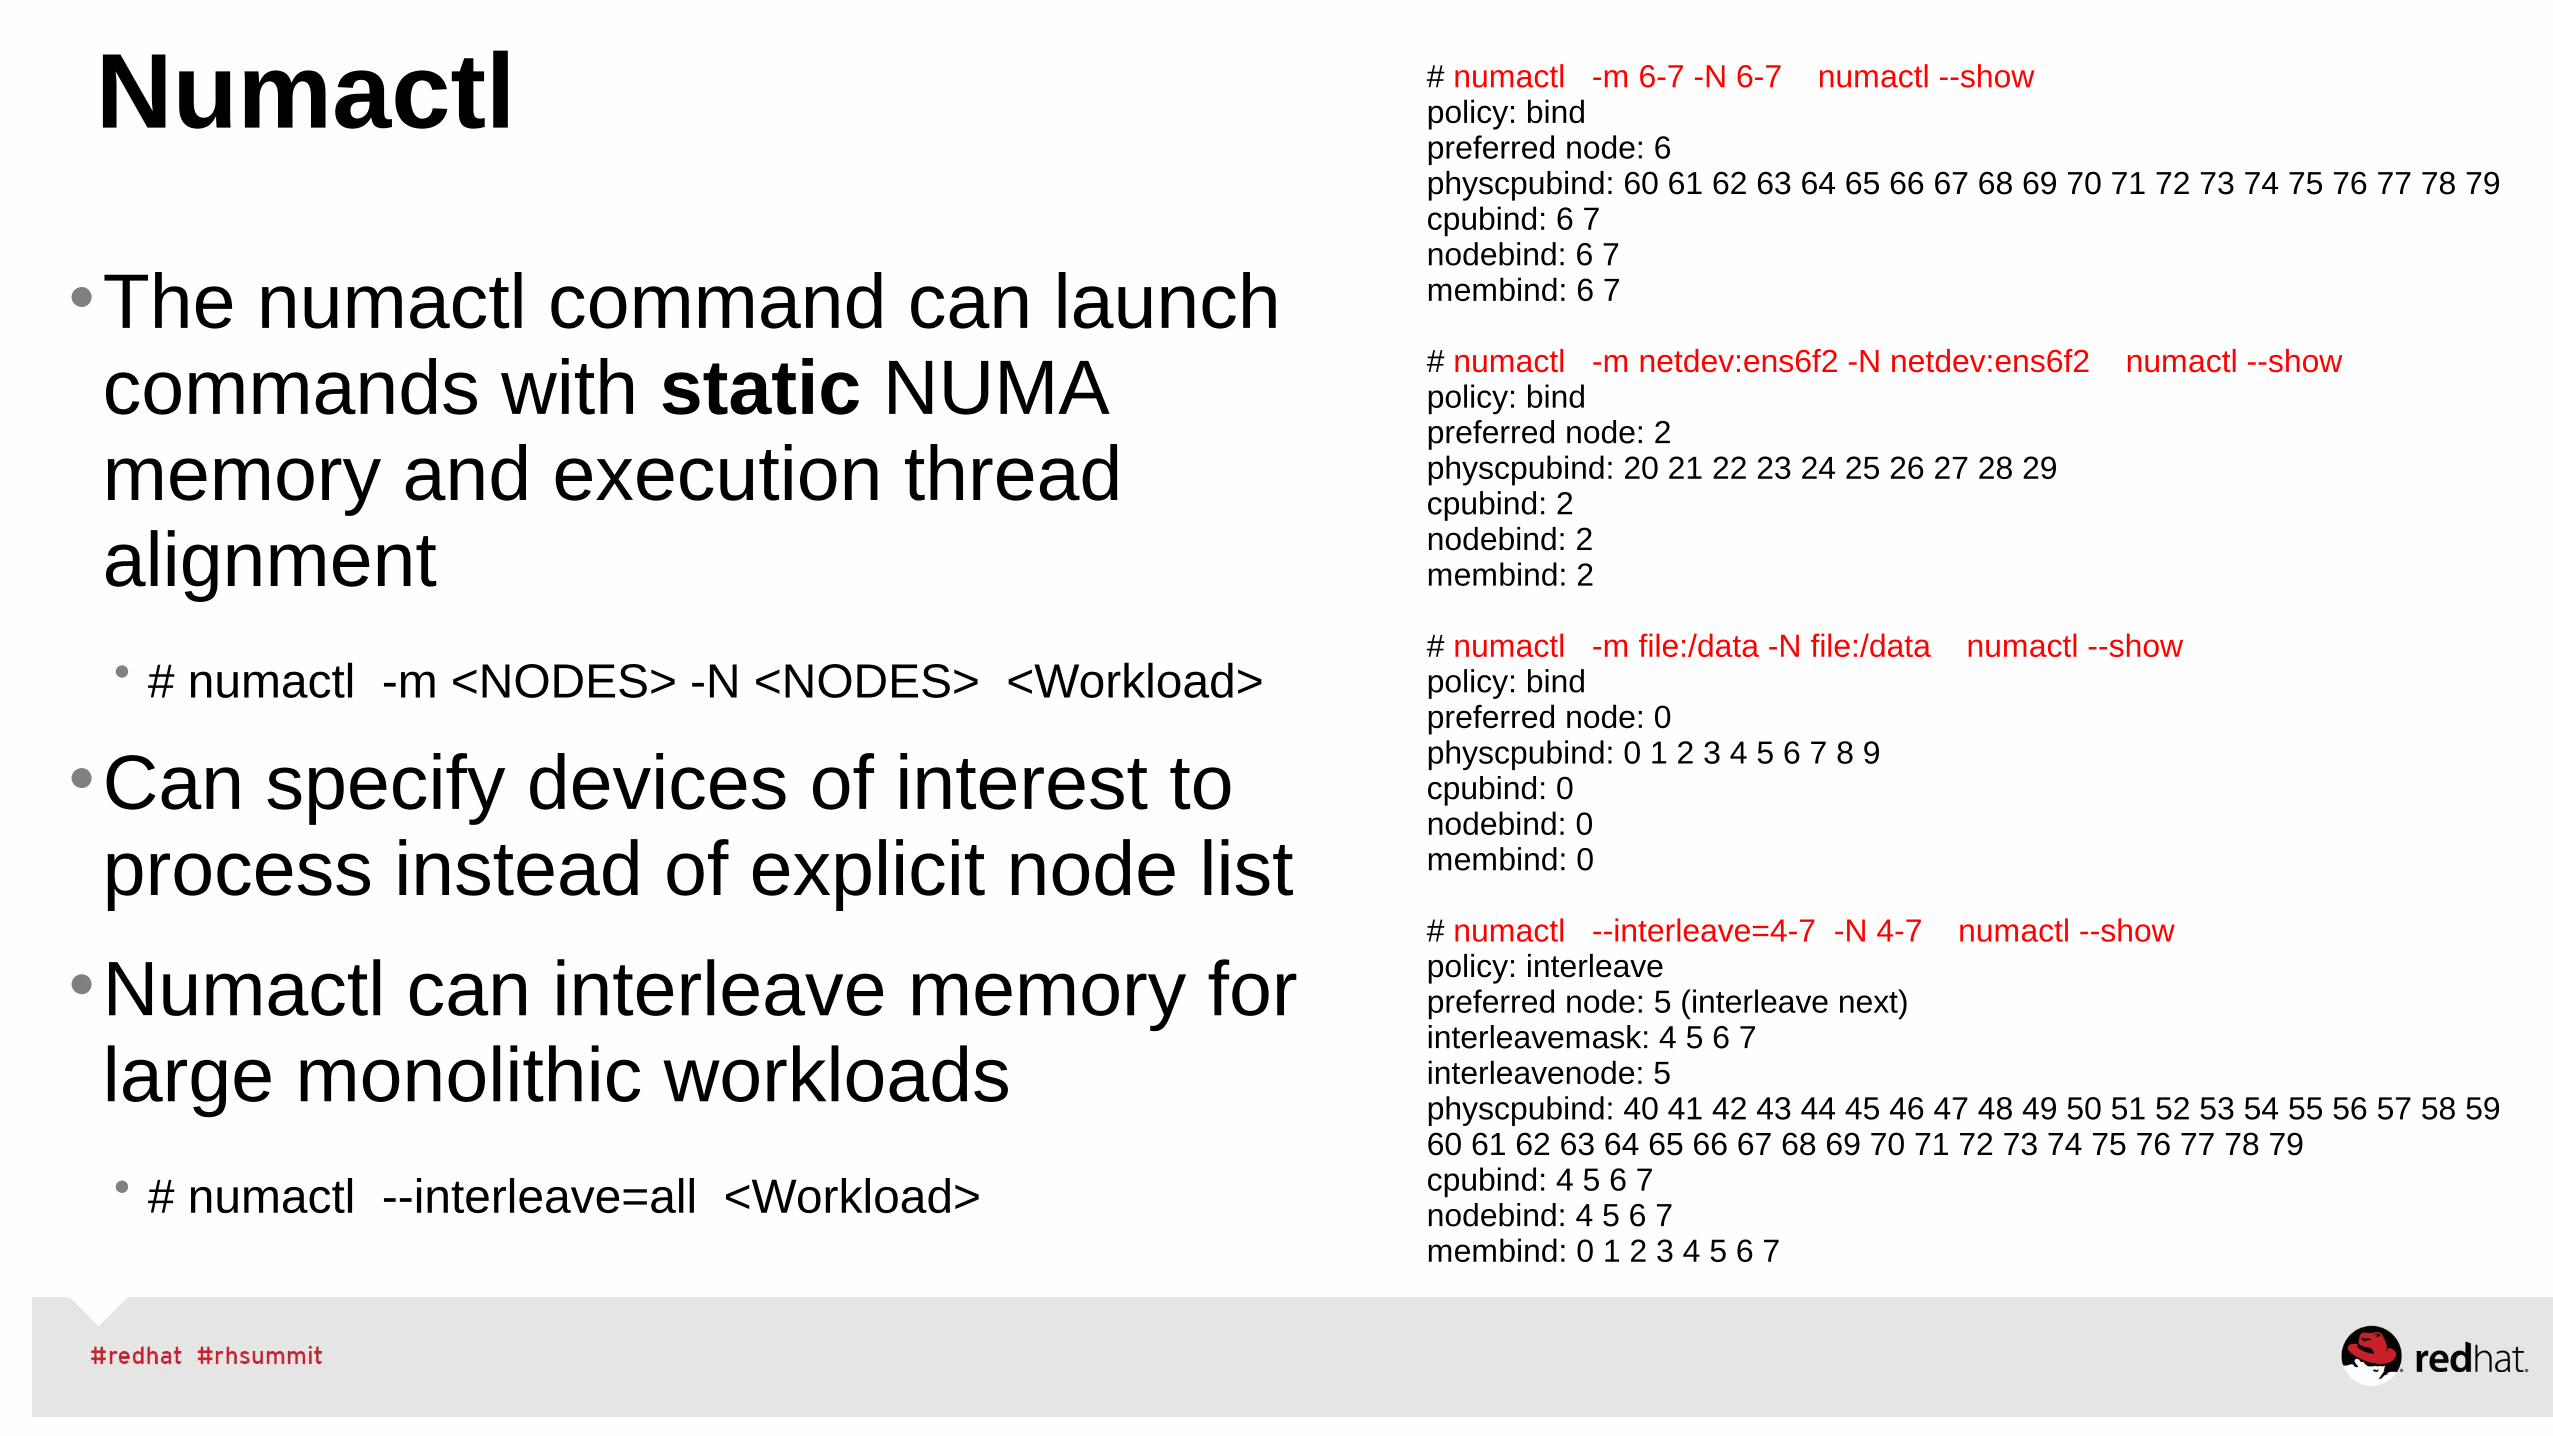
Numactl
•The numactl command can launch commands with static NUMA memory and execution thread alignment • # numactl -m <NODES> -N <NODES> <Workload>
•Can specify devices of interest to process instead of explicit node list
•Numactl can interleave memory for large monolithic workloads• # numactl --interleave=all <Workload>
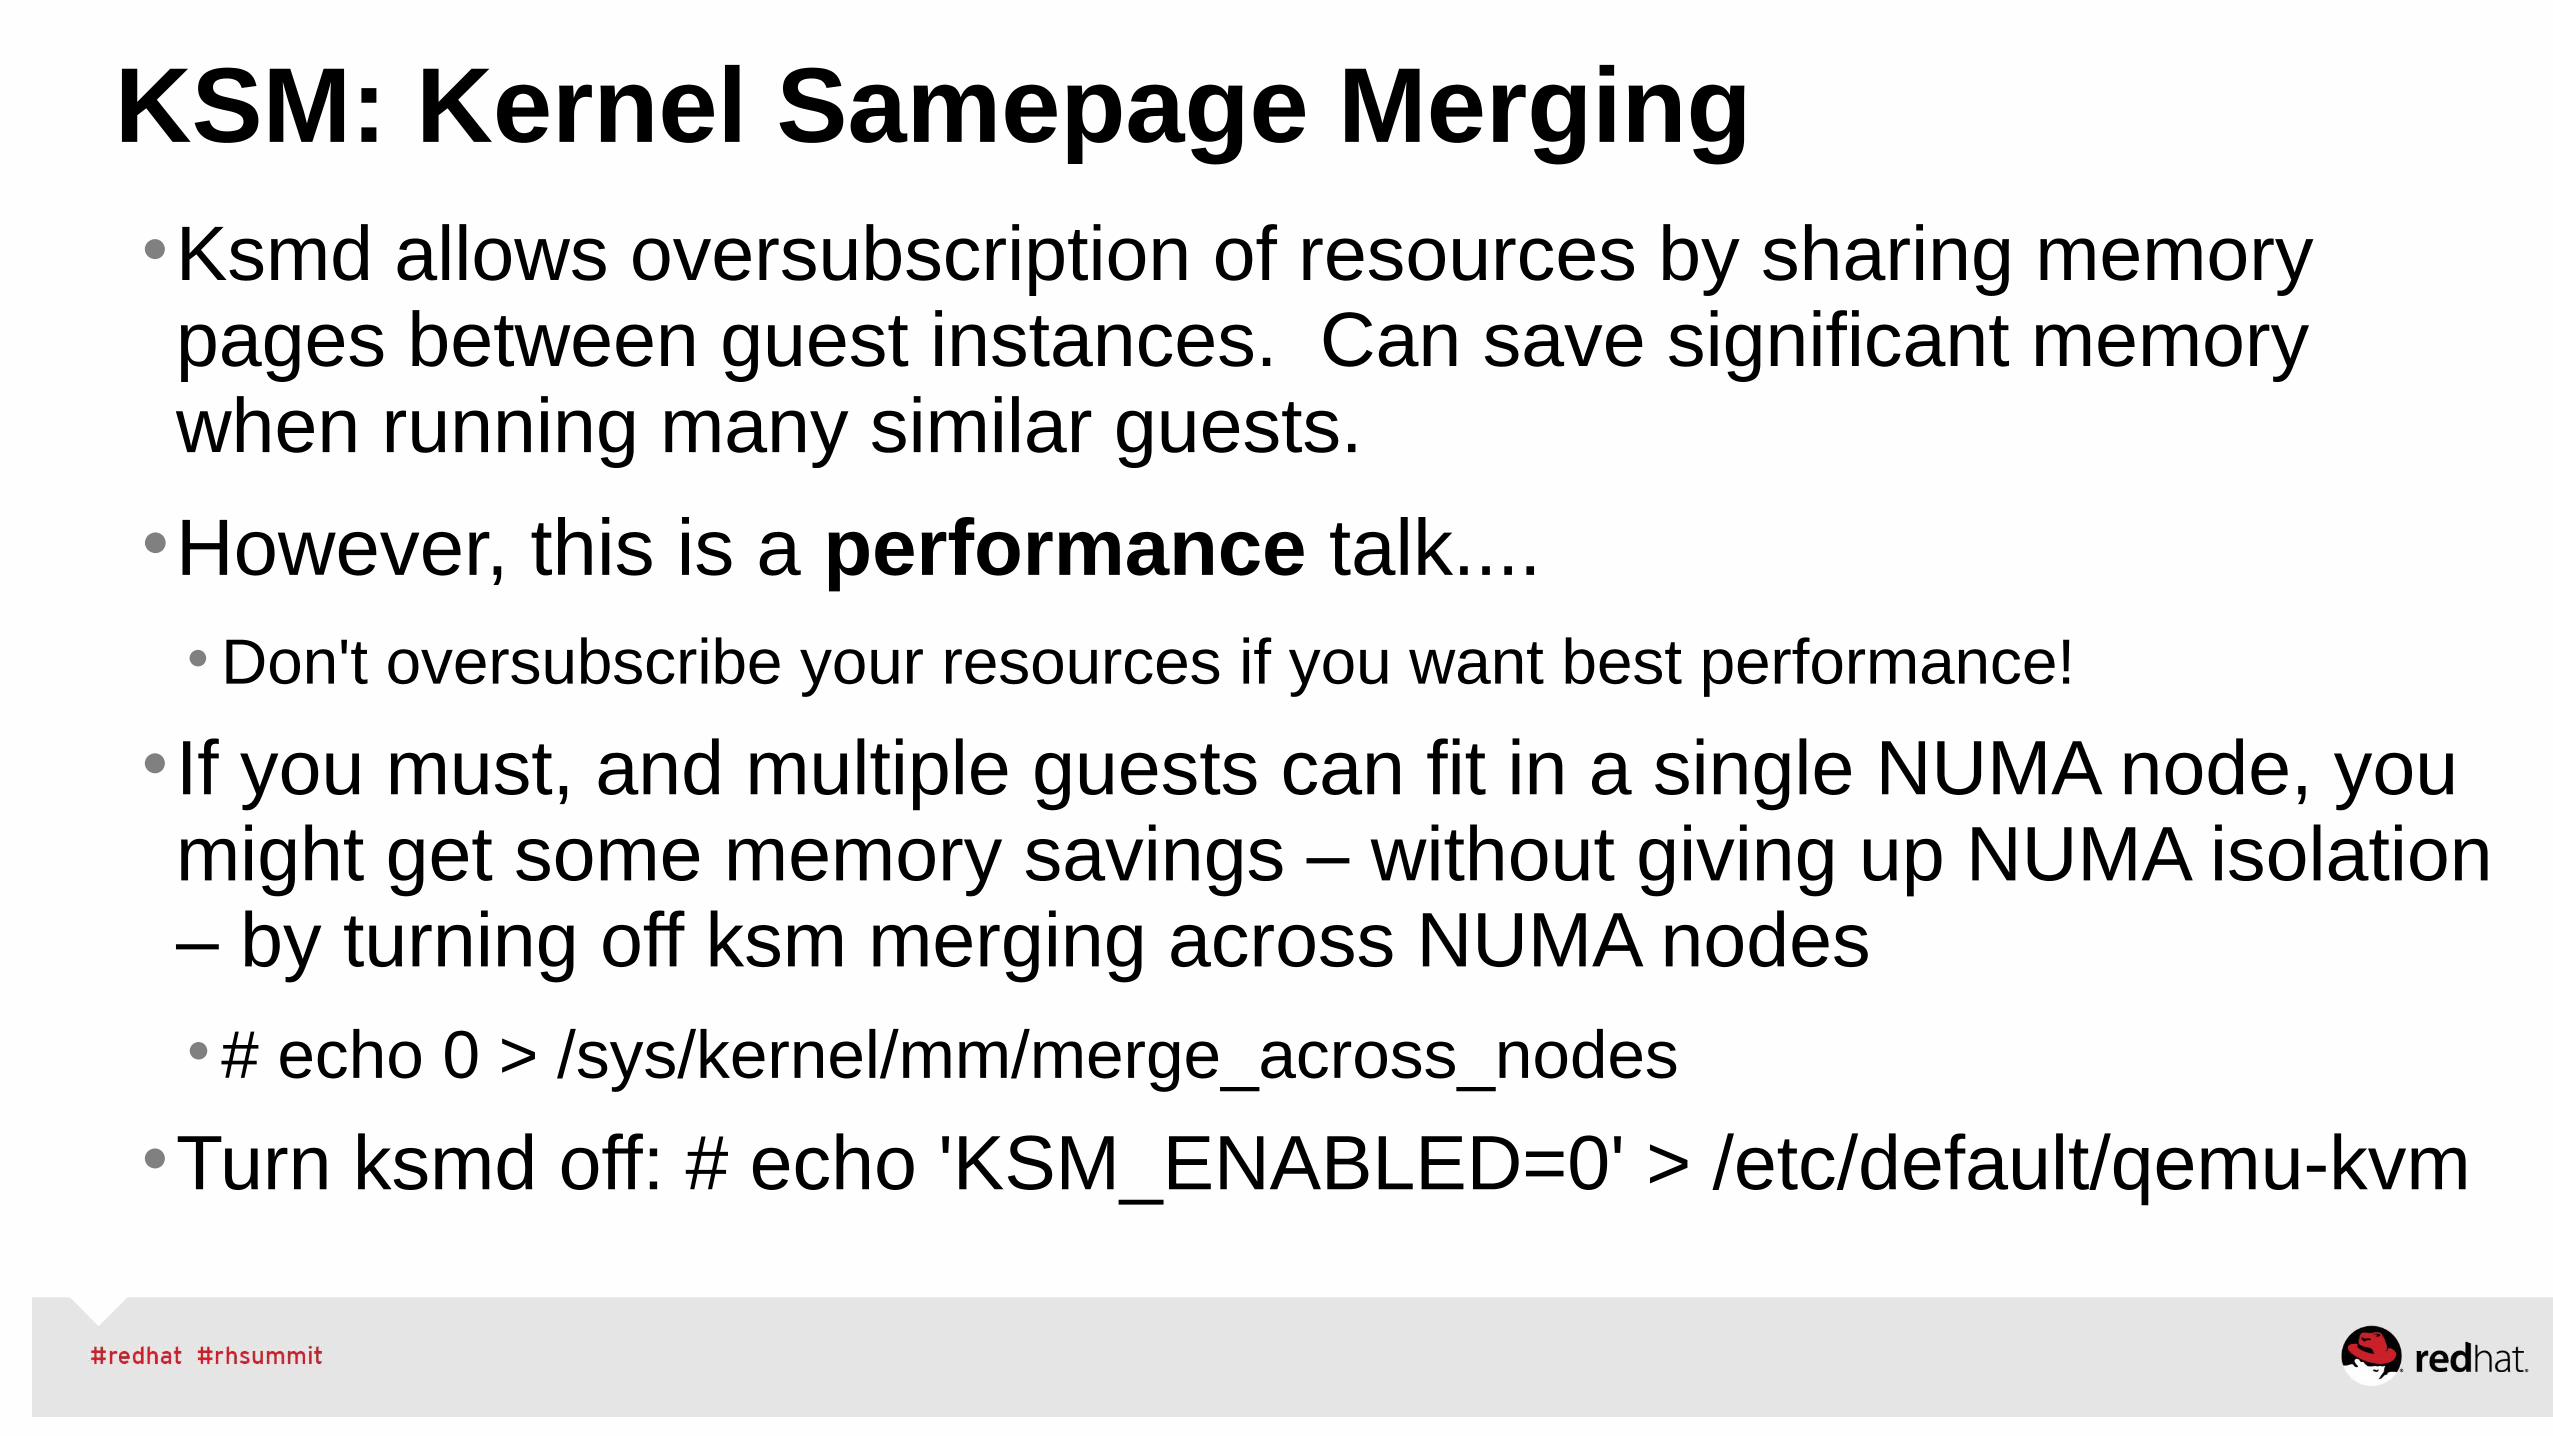
KSM: Kernel Samepage Merging•Ksmd allows oversubscription of resources by sharing memory pages between guest instances. Can save significant memory when running many similar guests.
•However, this is a performance talk.... •Don't oversubscribe your resources if you want best performance!
• If you must, and multiple guests can fit in a single NUMA node, you might get some memory savings – without giving up NUMA isolation – by turning off ksm merging across NUMA nodes
Automate with RHEL7+ kernel NUMA balancing•Periodically unmaps pages to see where memory is used• This sampling approach efficiently ignores unused memory.
•Moves task threads to NUMA nodes with their memory and moves accessed memory to NUMA nodes where threads are executing
•Lazy page migration efficiently moves memory in the background
•Much better than numad at fine grain (thread-level) control
•Enabled and active by default in Red Hat Enterprise Linux 7+
•Other tunables in /proc/sys/kernel/numa*, e.g. can adjust numa_balancing_scan_delay_ms to ignore short-lived processes. Normally don't need to change these.
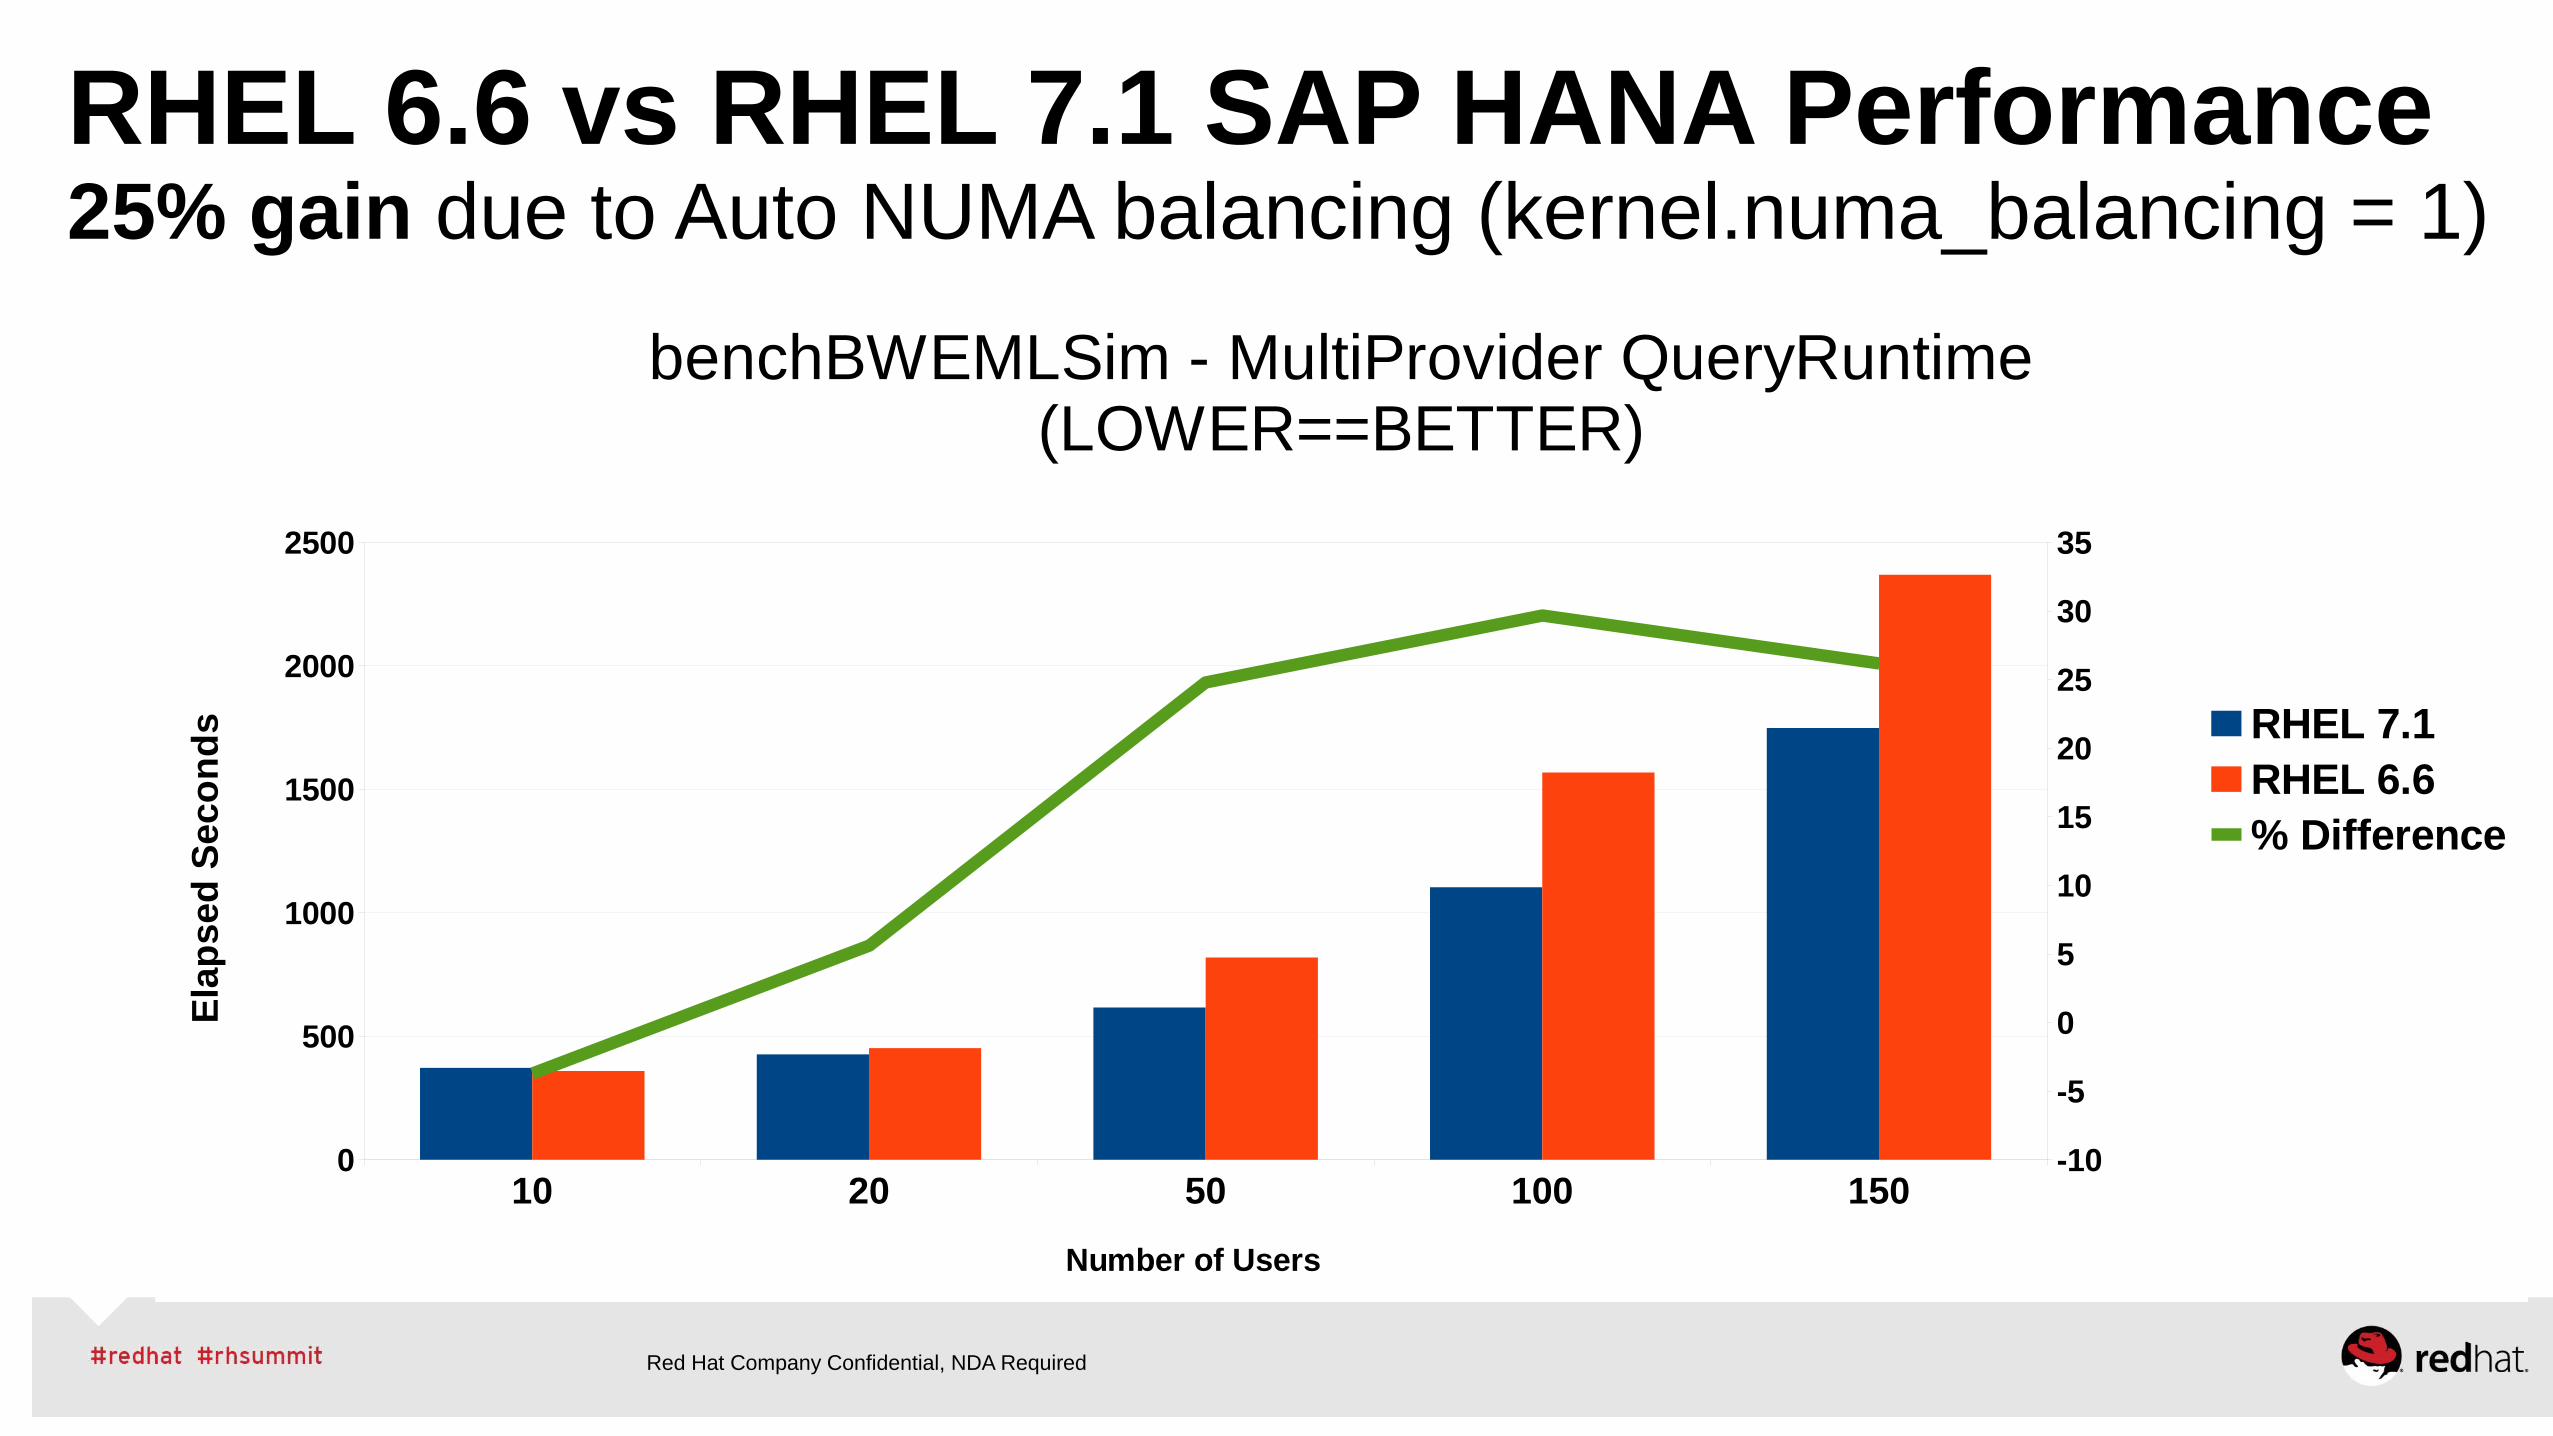
RHEL 6.6 vs RHEL 7.1 SAP HANA Performance25% gain due to Auto NUMA balancing (kernel.numa_balancing = 1)
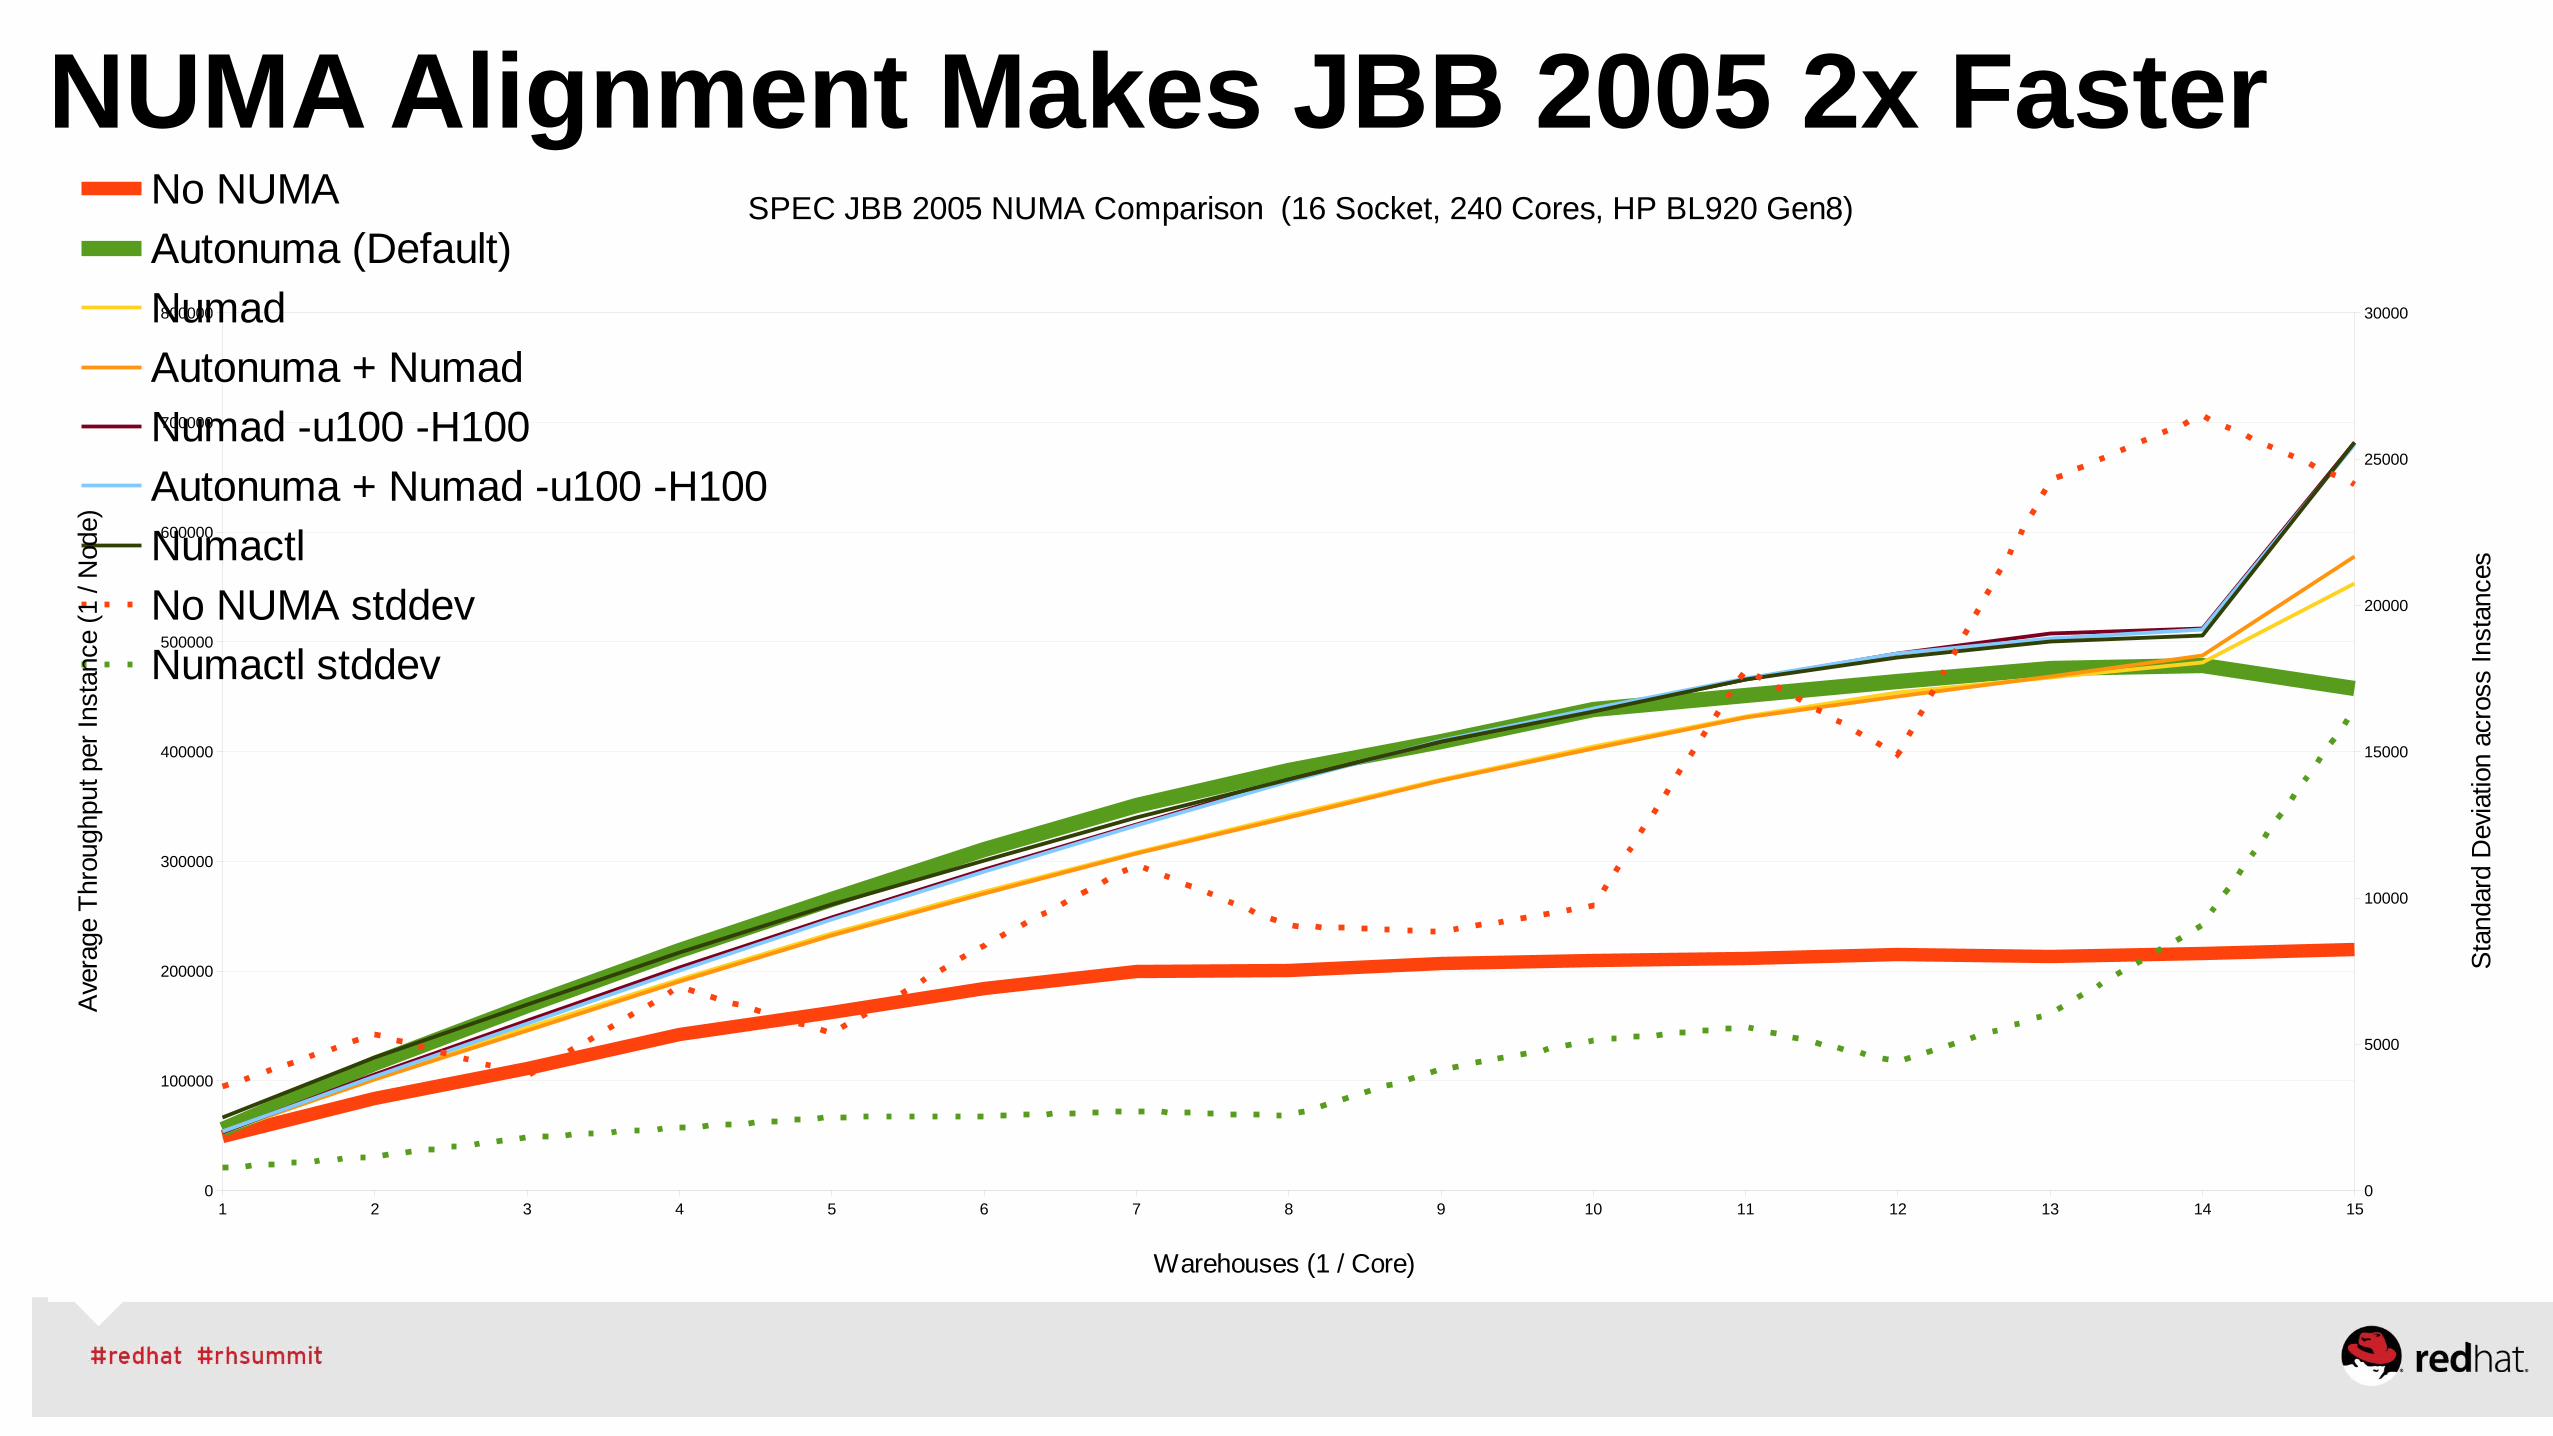
SPEC JBB 2005 NUMA Comparison (16 Socket, 240 Cores, HP BL920 Gen8)No NUMA
Autonuma (Default)
Numad
Autonuma + Numad
Numad -u100 -H100
Autonuma + Numad -u100 -H100
Numactl
No NUMA stddev
Numactl stddev
Warehouses (1 / Core)
Ave
rage
Thr
ough
put p
er In
stan
ce (
1 / N
ode)
Sta
ndar
d D
evia
tion
acro
ss In
stan
ces
Summary - Red Hat Enterprise Linux Automates NUMA Management!•With Red Hat Enterprise Linux 6.4+, careful use of numad can significantly improve performance and automate NUMA management on systems with server consolidation or replicated parallel workloads.
•With Red Hat Enterprise Linux 7+, most users will get good NUMA system memory management for most applications out of the box!
•Automated NUMA management is especially valuable in dynamic server environments with changing workload conditions.
Red Hat Enterprise Linux Scheduler
RHEL Scheduler Tunables
Implements multiple red/black trees asrun queues for sockets and cores (asopposed to one run queue per processor or per system)
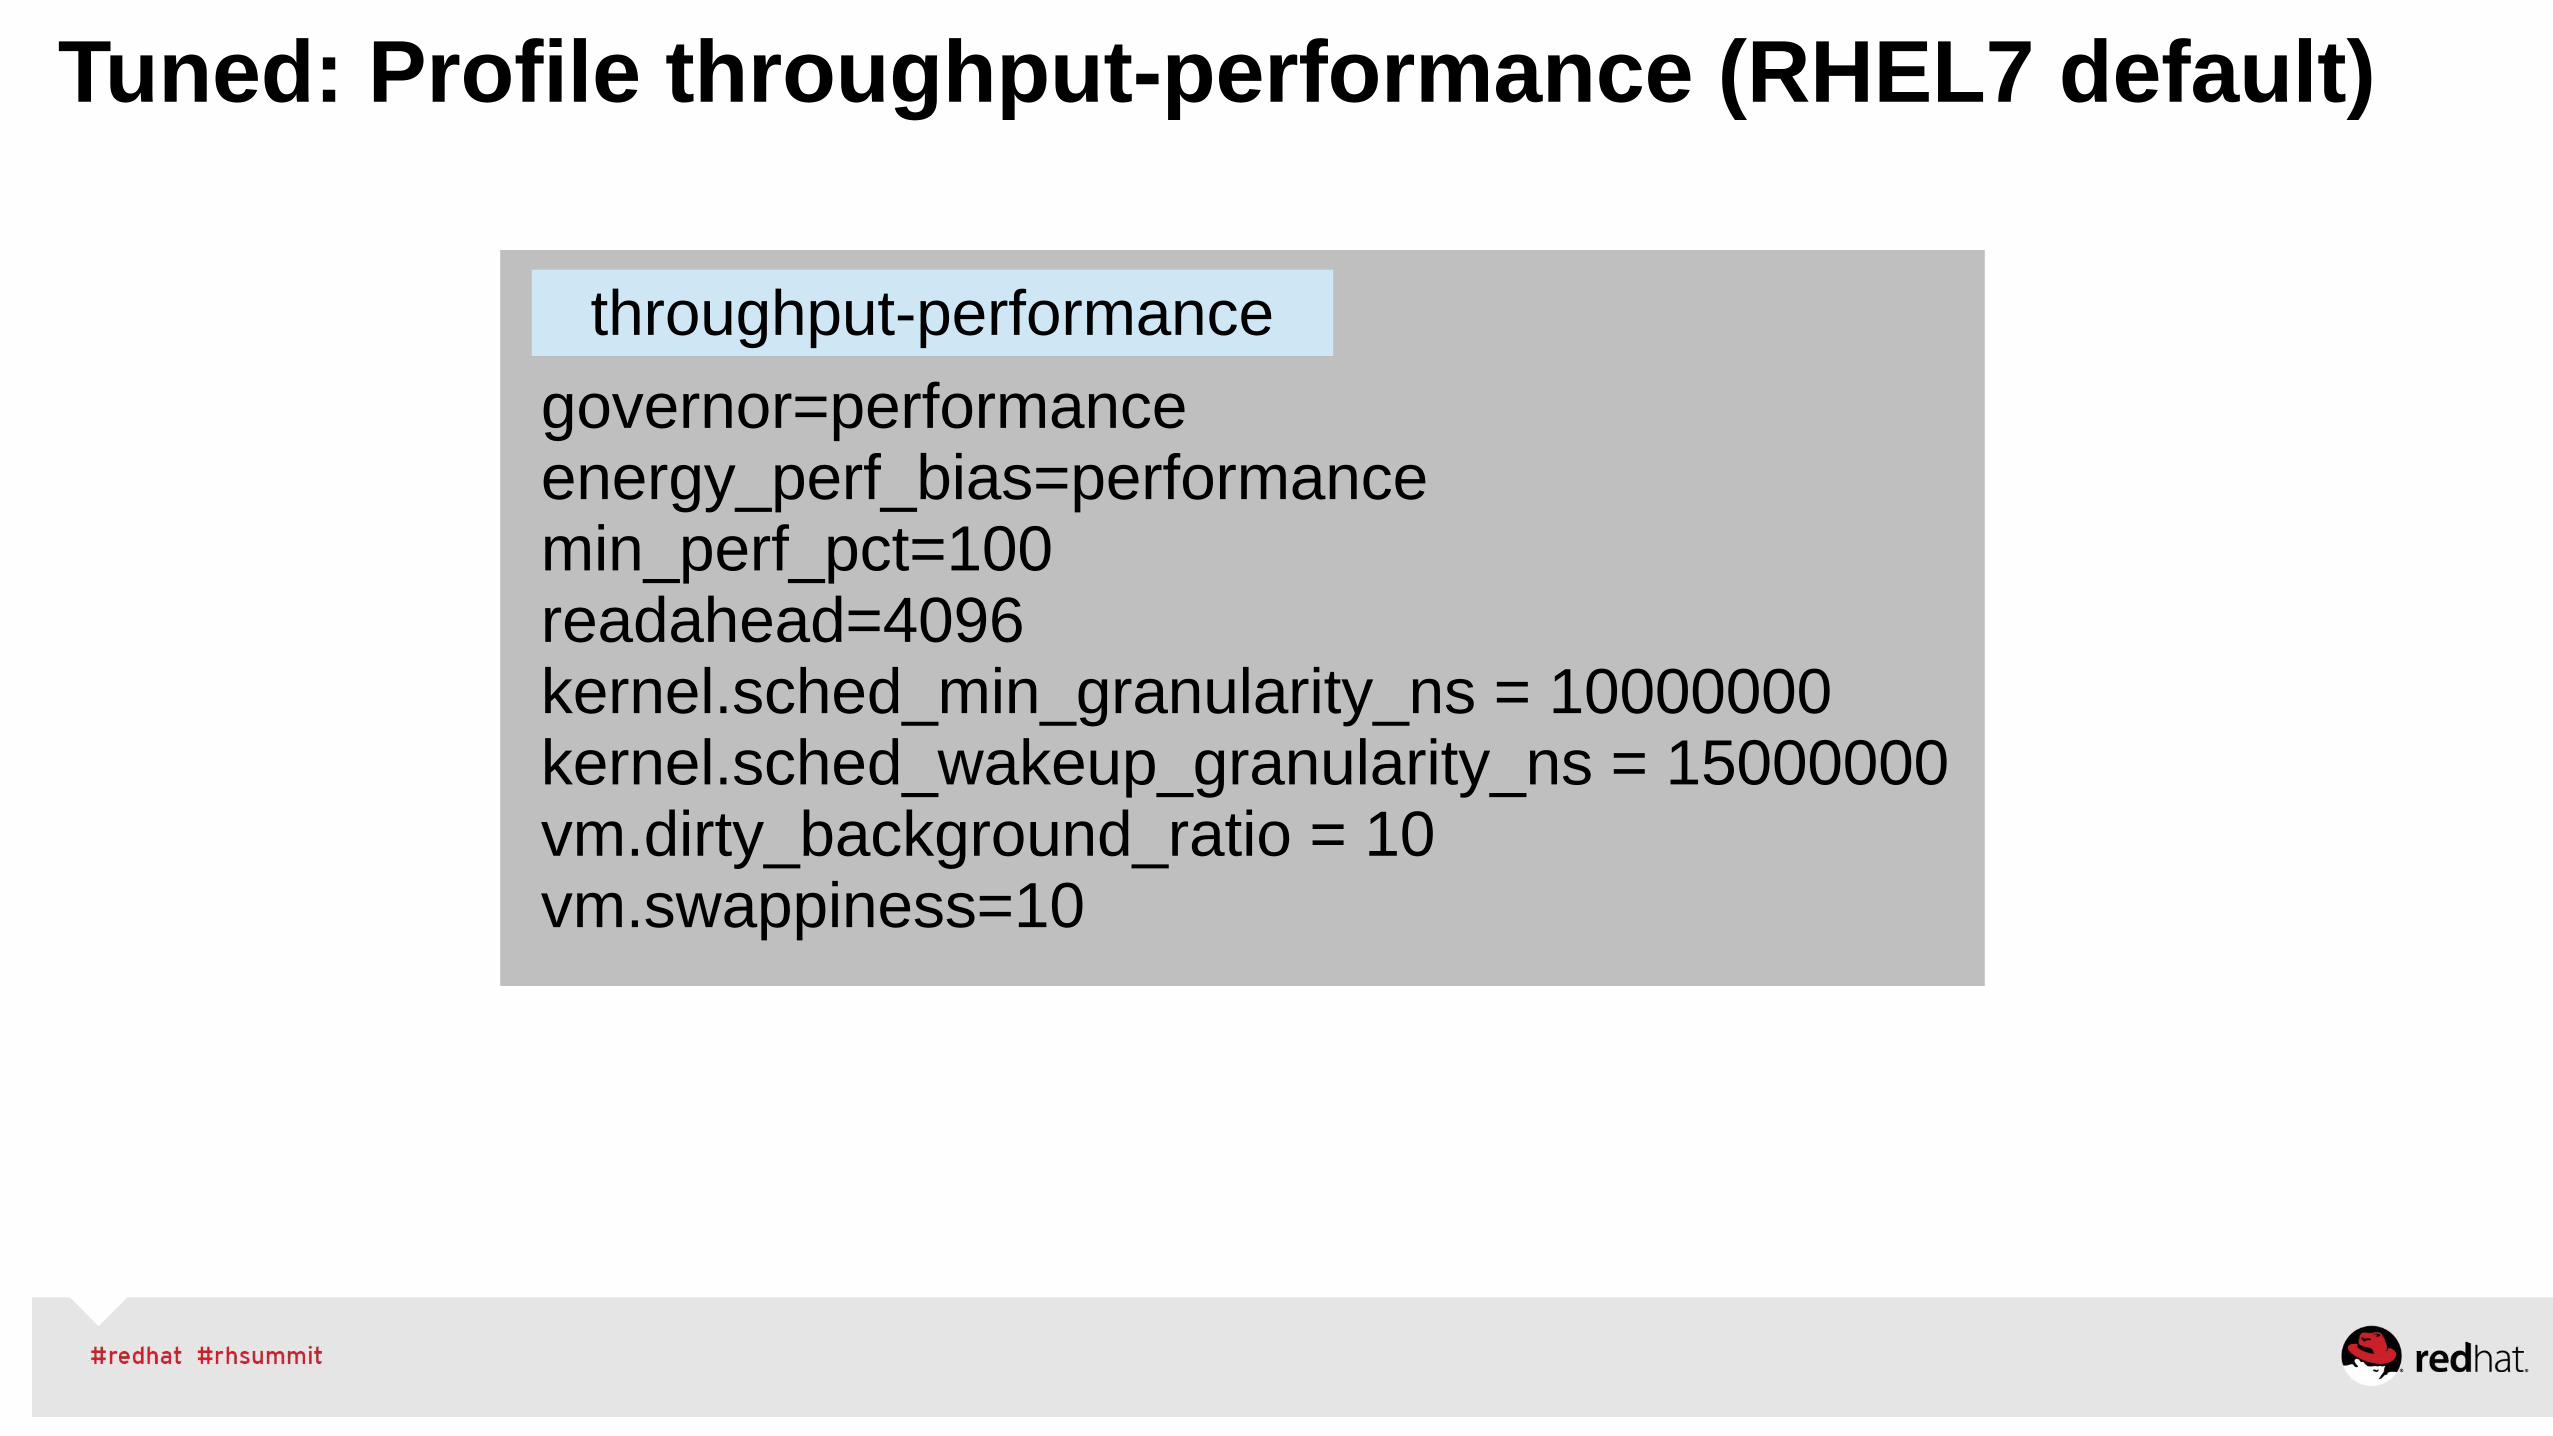
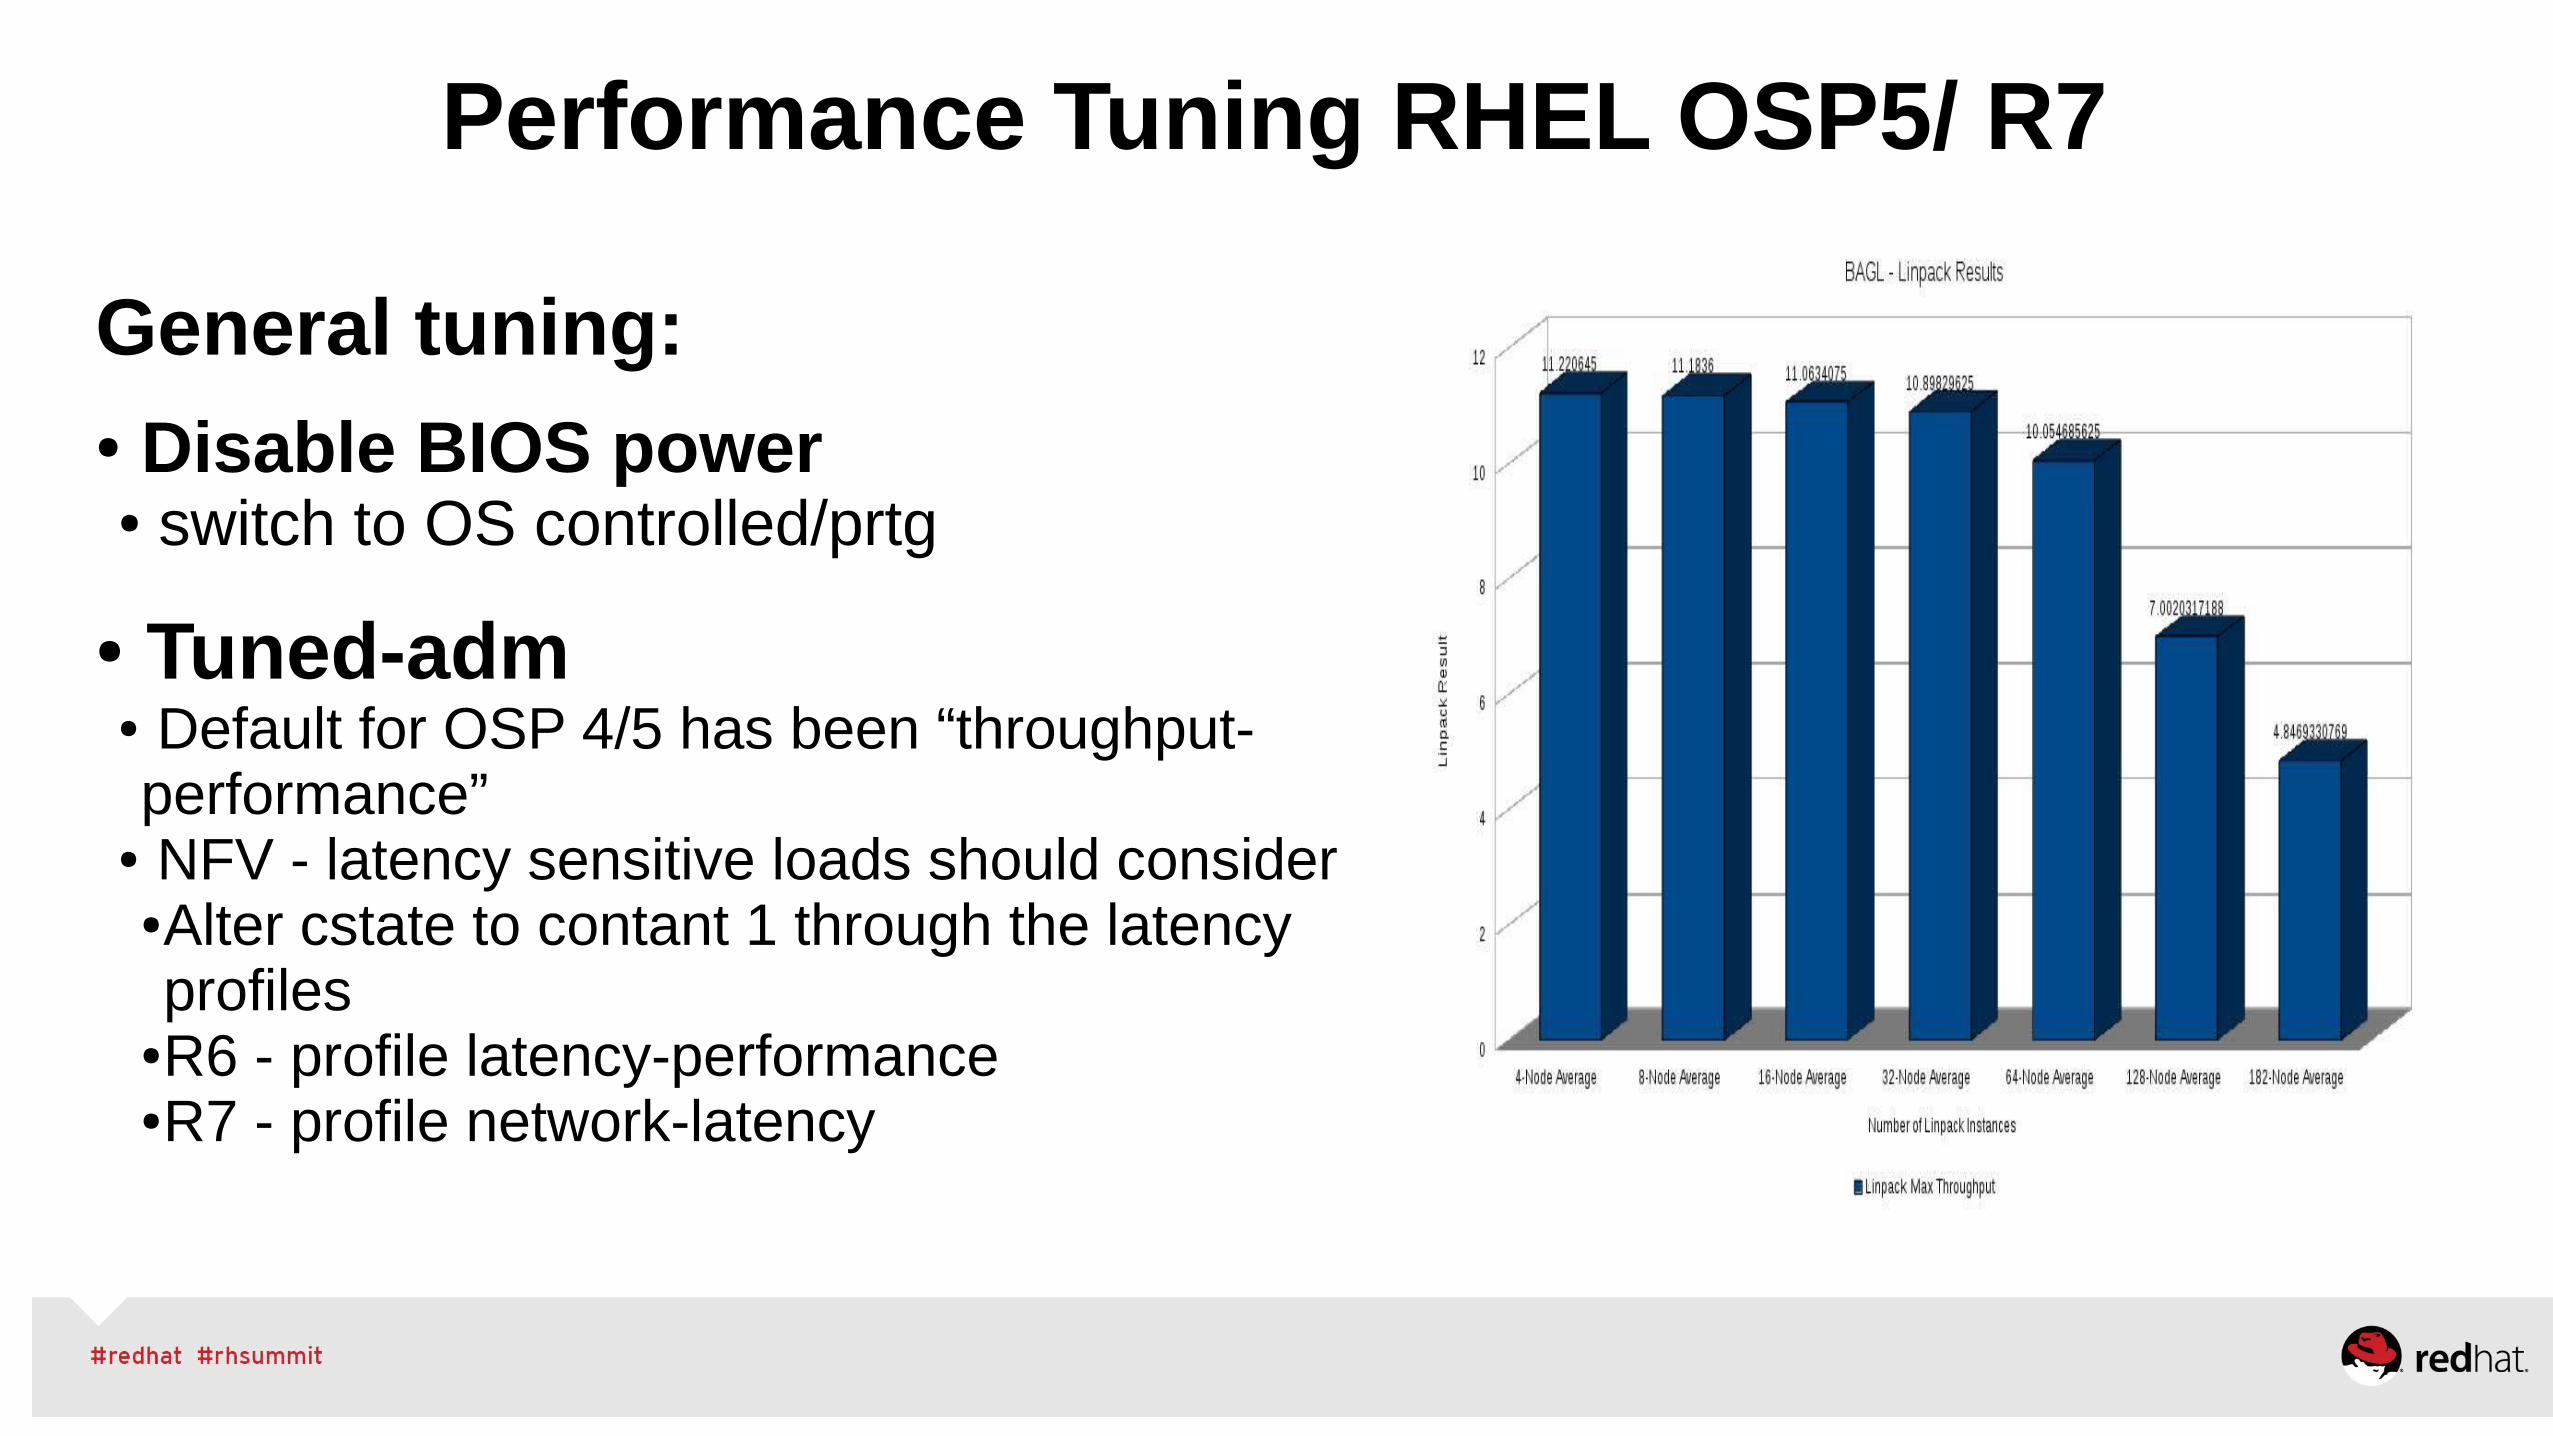
•RHEL6/7 Tuned-adm will increase quantum on par with RHEL5
–echo 10000000 > /proc/sys/kernel/sched_min_granularity_ns●Minimal preemption granularity for CPU bound tasks. See sched_latency_ns for details. The default value is 4000000 (ns).
–echo 15000000 > /proc/sys/kernel/sched_wakeup_granularity_ns●The wake-up preemption granularity.● Increasing this variable reduces wake-up preemption, reducing disturbance of compute bound tasks.
●Decreasing it improves wake-up latency and throughput for latency critical tasks, particularly when a short duty cycle load component must compete with CPU bound components. The default value is 5000000 (ns).
Finer Grained Scheduler Tuning
•Scheduler tries to keep all CPUs busy by moving tasks form overloaded CPUs to idle CPUs
•Detect using “perf stat”, look for excessive “migrations”
• /proc/sys/kernel/sched_migration_cost
–Amount of time after the last execution that a task is considered to be “cache hot” in migration decisions. A “hot” task is less likely to be migrated, so increasing this variable reduces task migrations. The default value is 500000 (ns).
– If the CPU idle time is higher than expected when there are runnable processes, try reducing this value. If tasks bounce between CPUs or nodes too often, try increasing it.
•Rule of thumb – increase by 2-10x to reduce load balancing (tuned does this)
•Use 10x on large systems when many CGROUPs are actively used (ex: RHEV/ KVM/RHOS)
Load Balancing
fork() behavior
sched_child_runs_first●Controls whether parent or child runs first●Default is 0: parent continues before children run.●Default is different than RHEL5
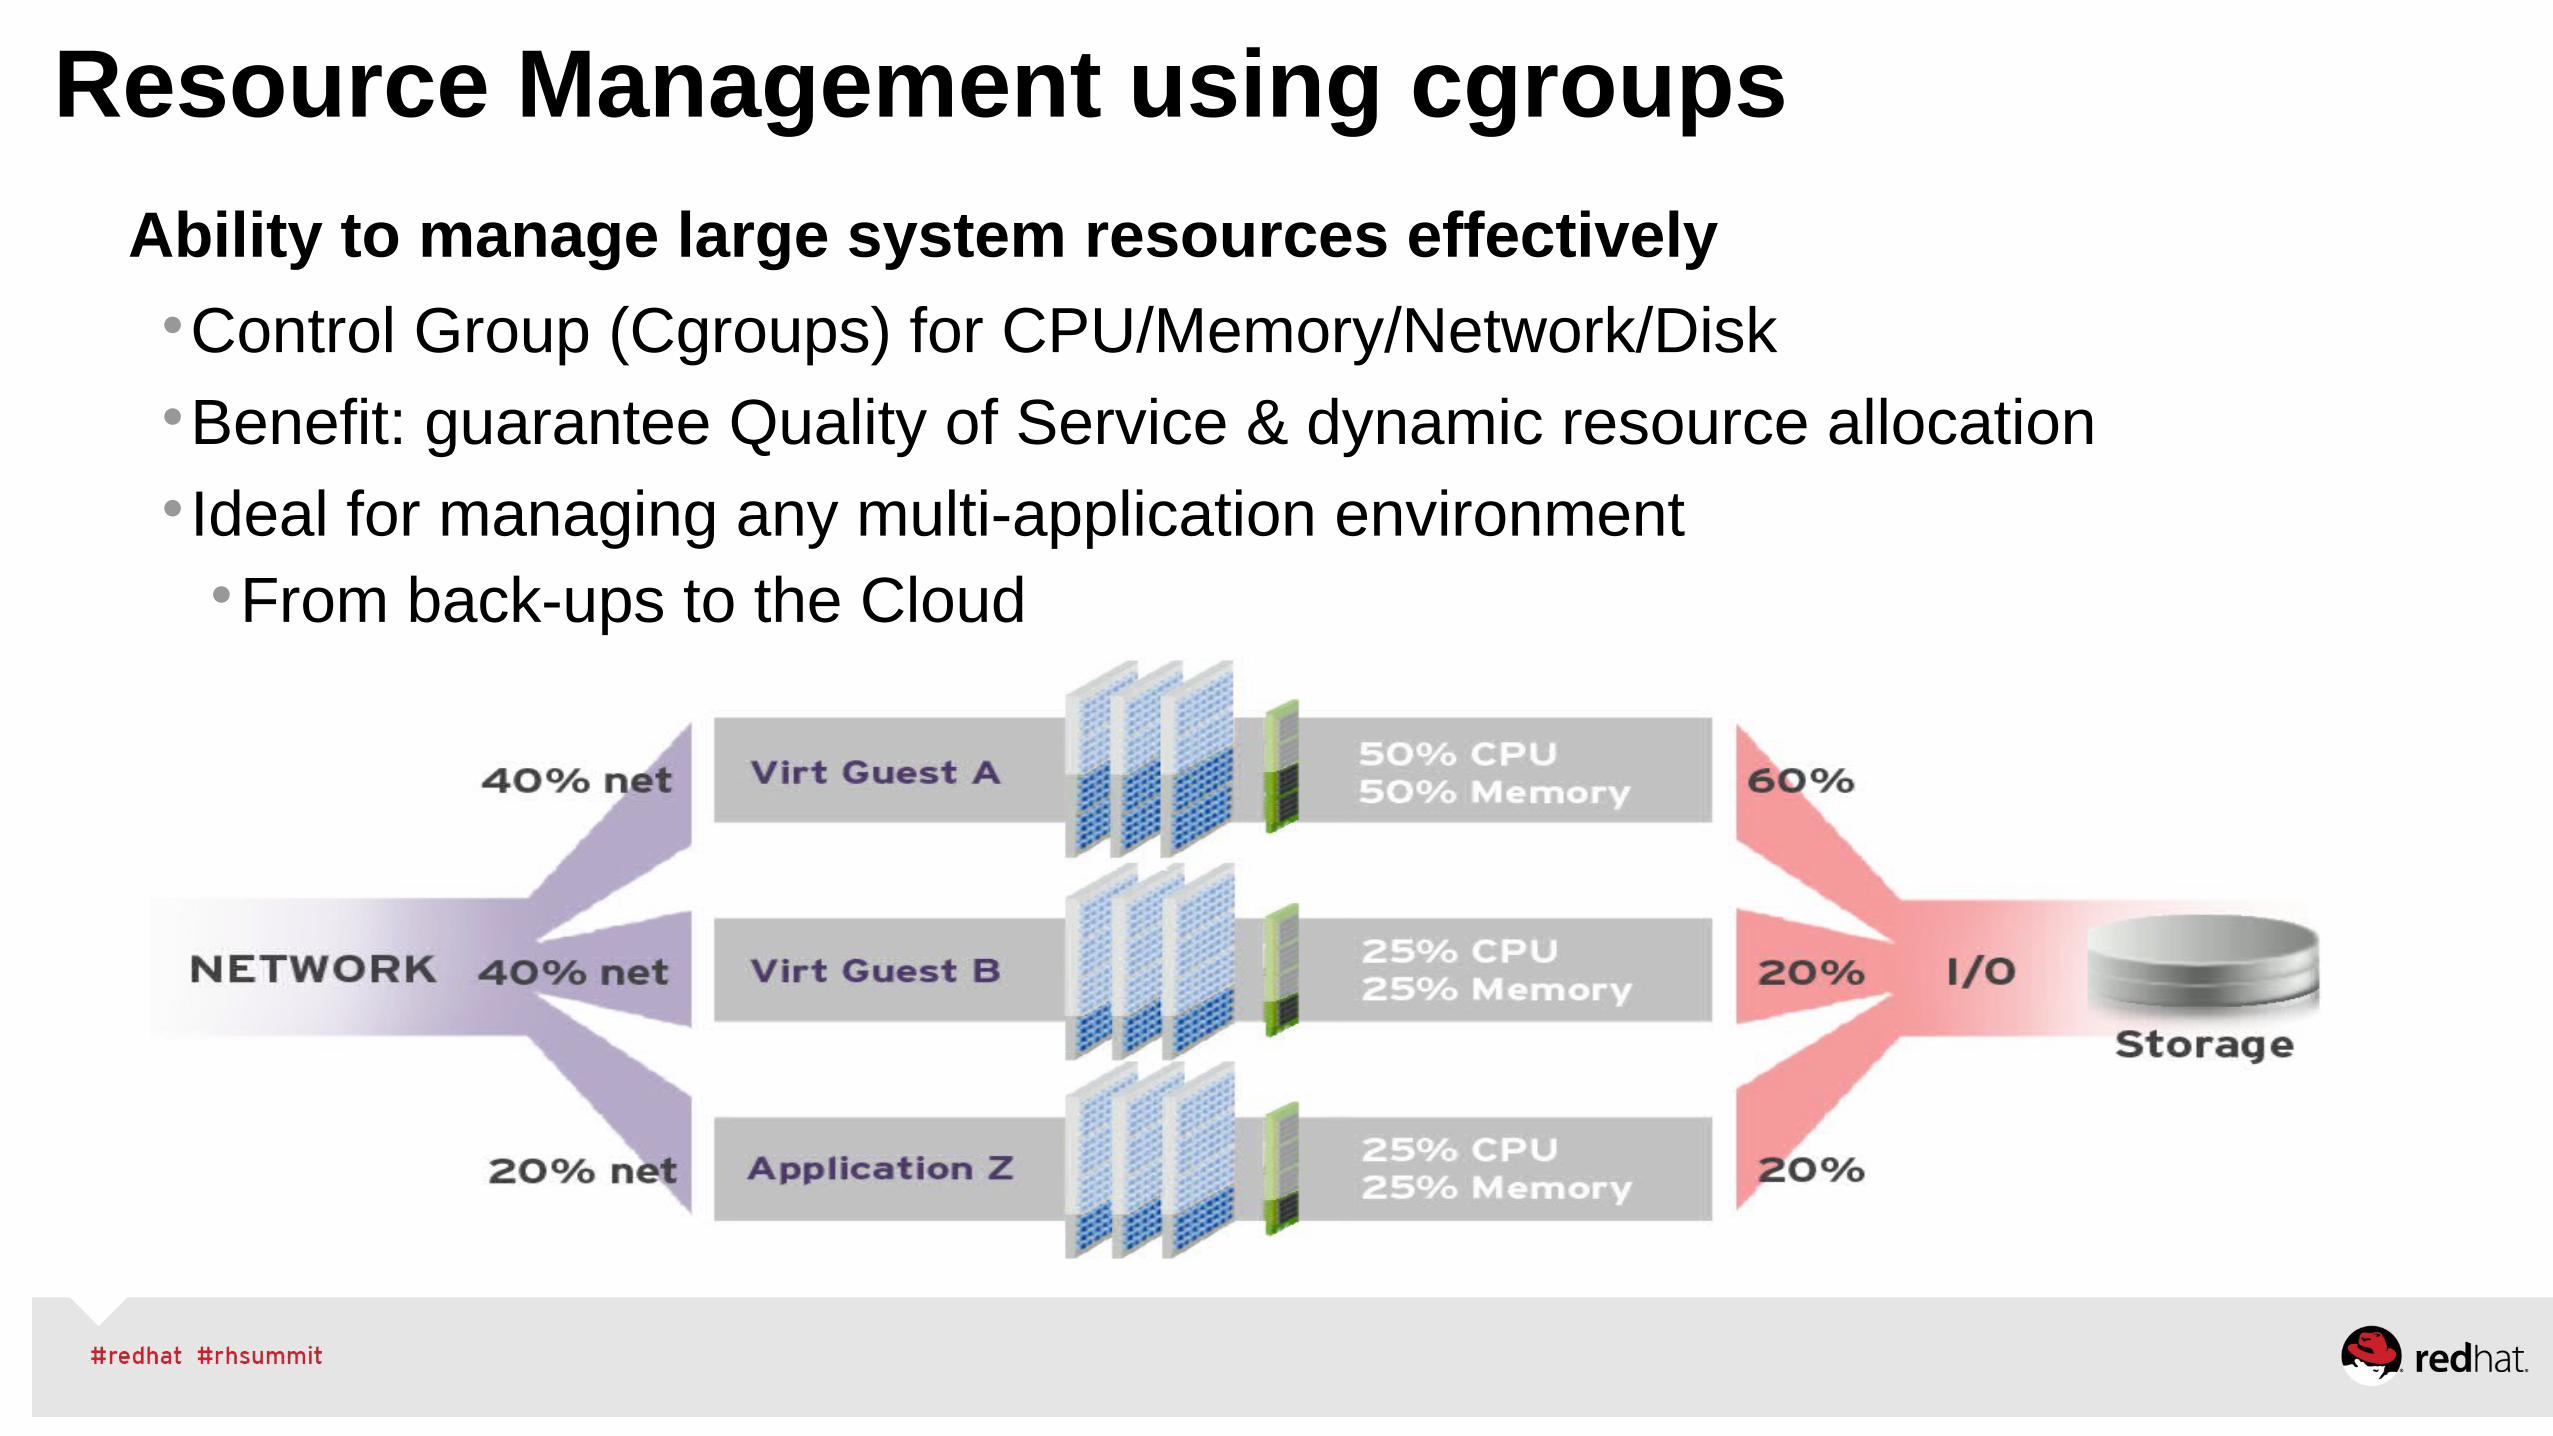
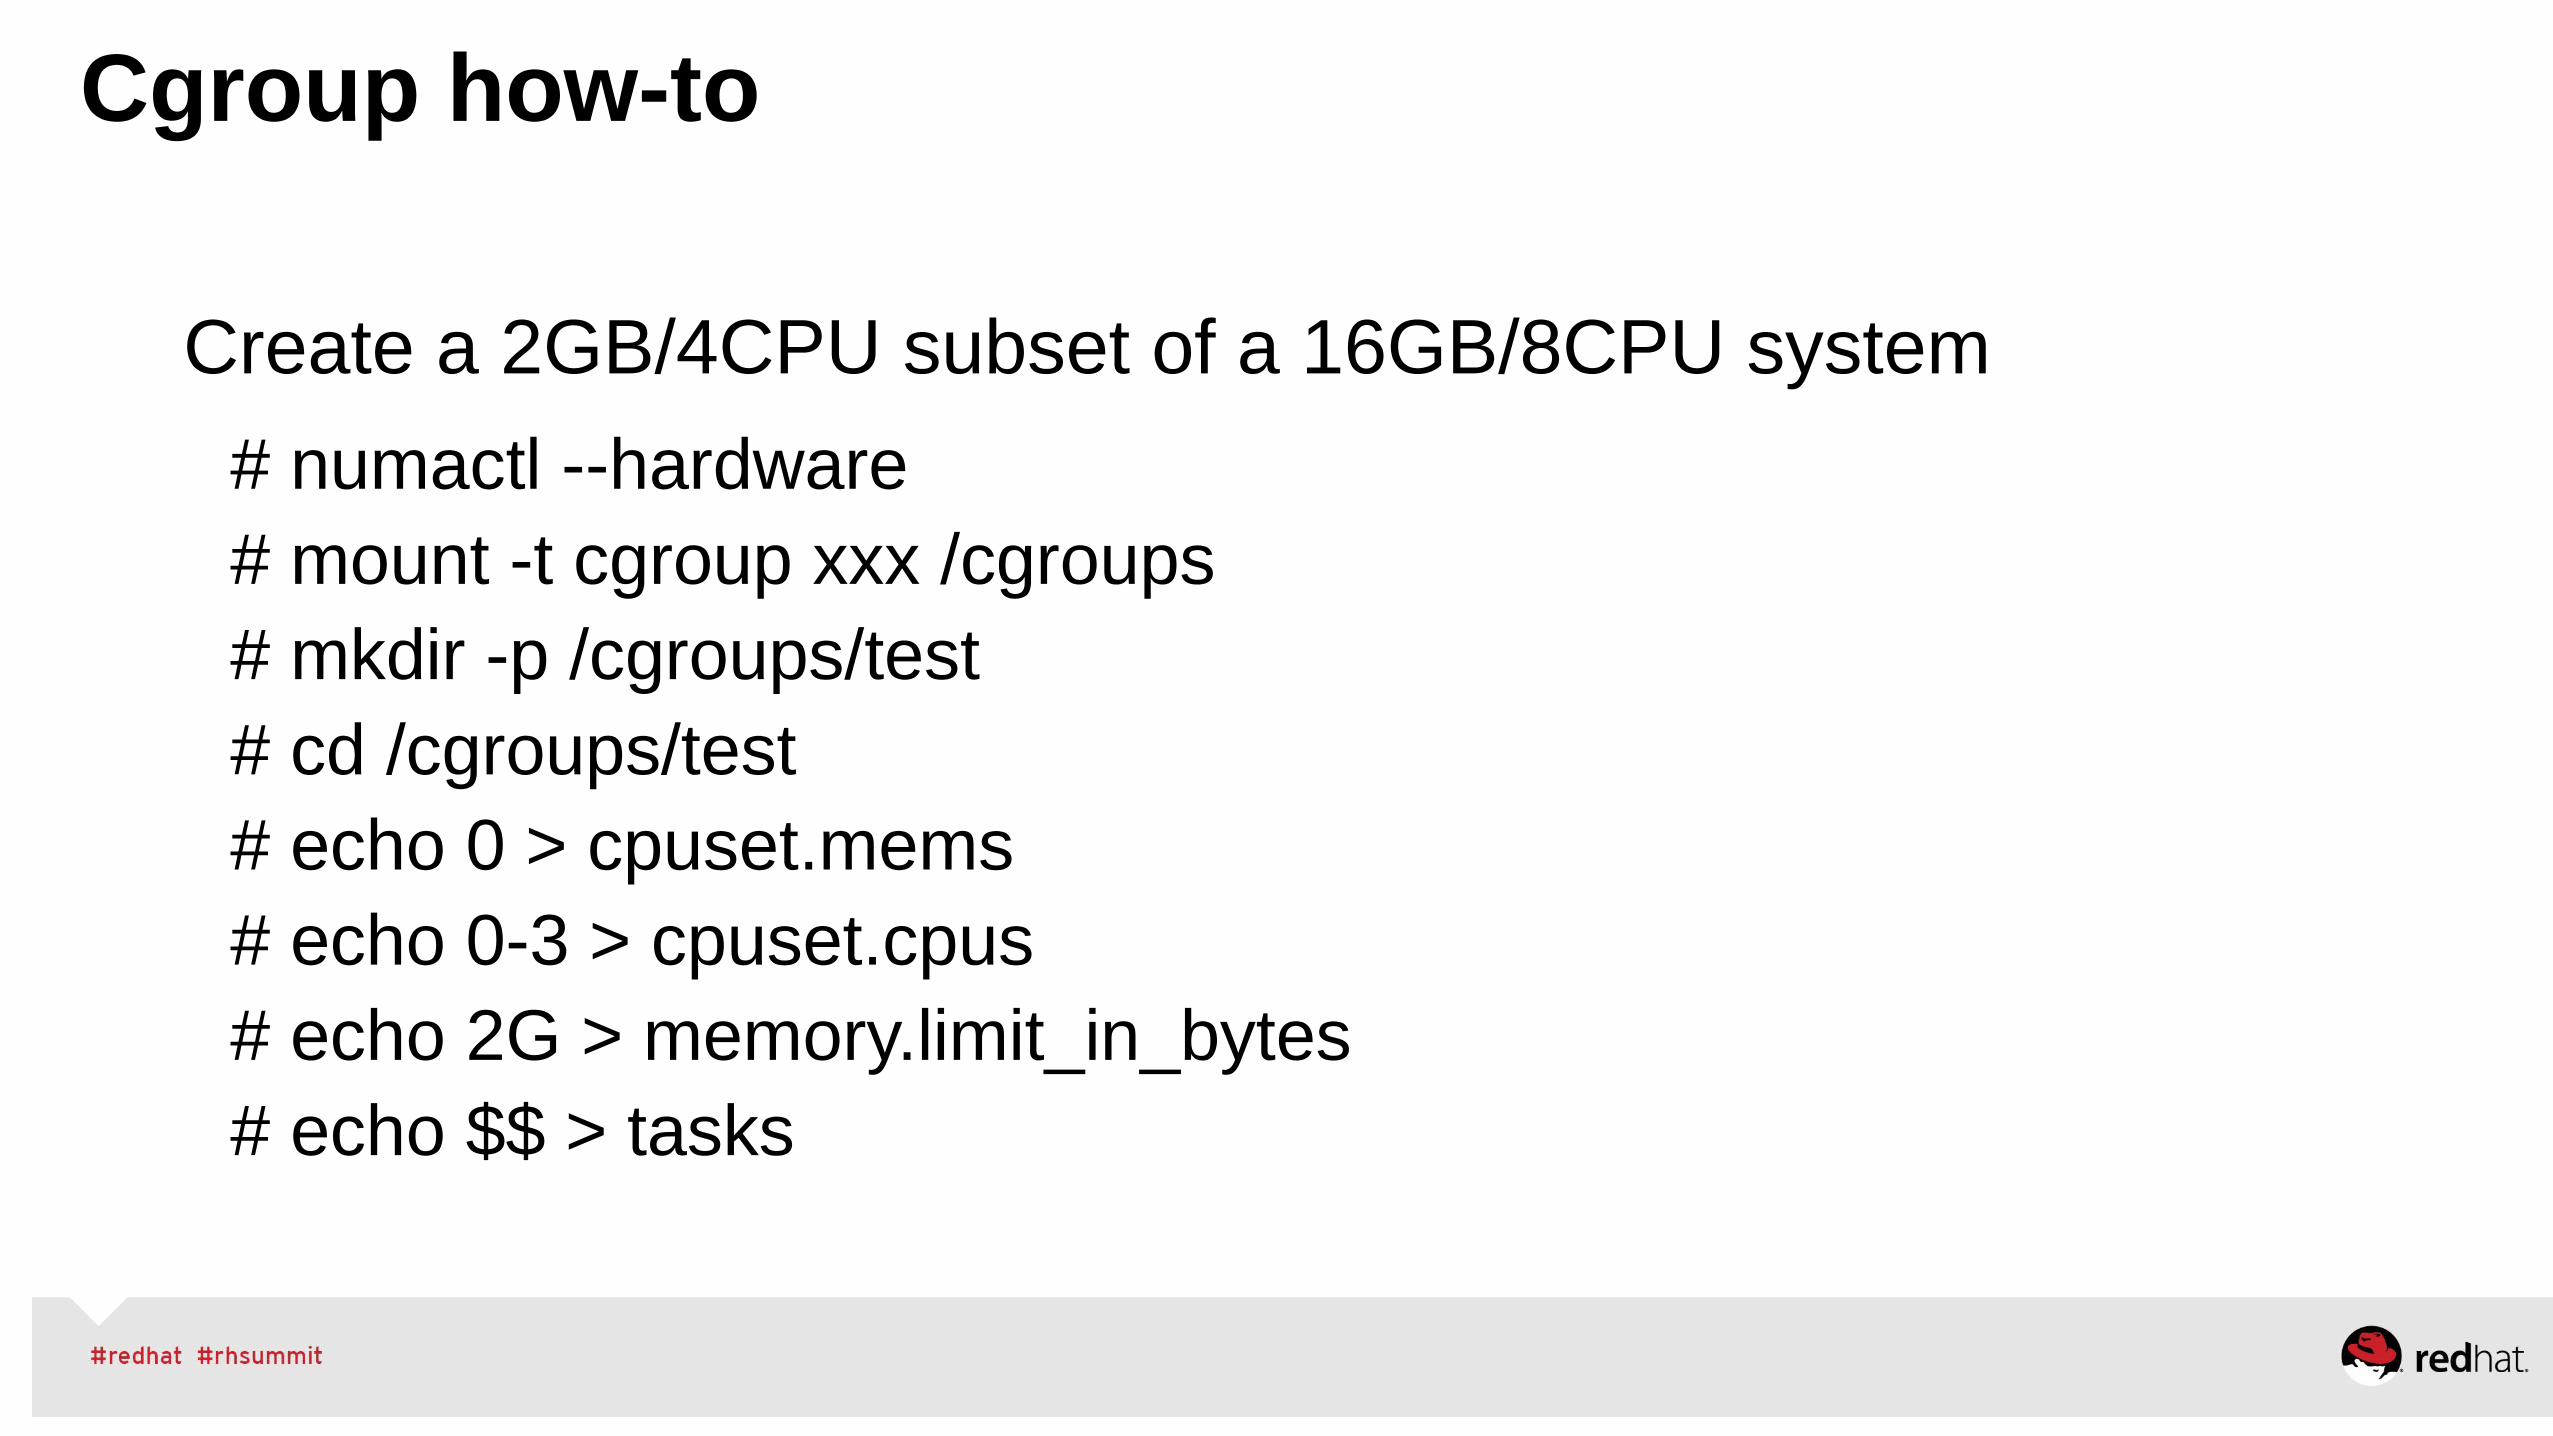
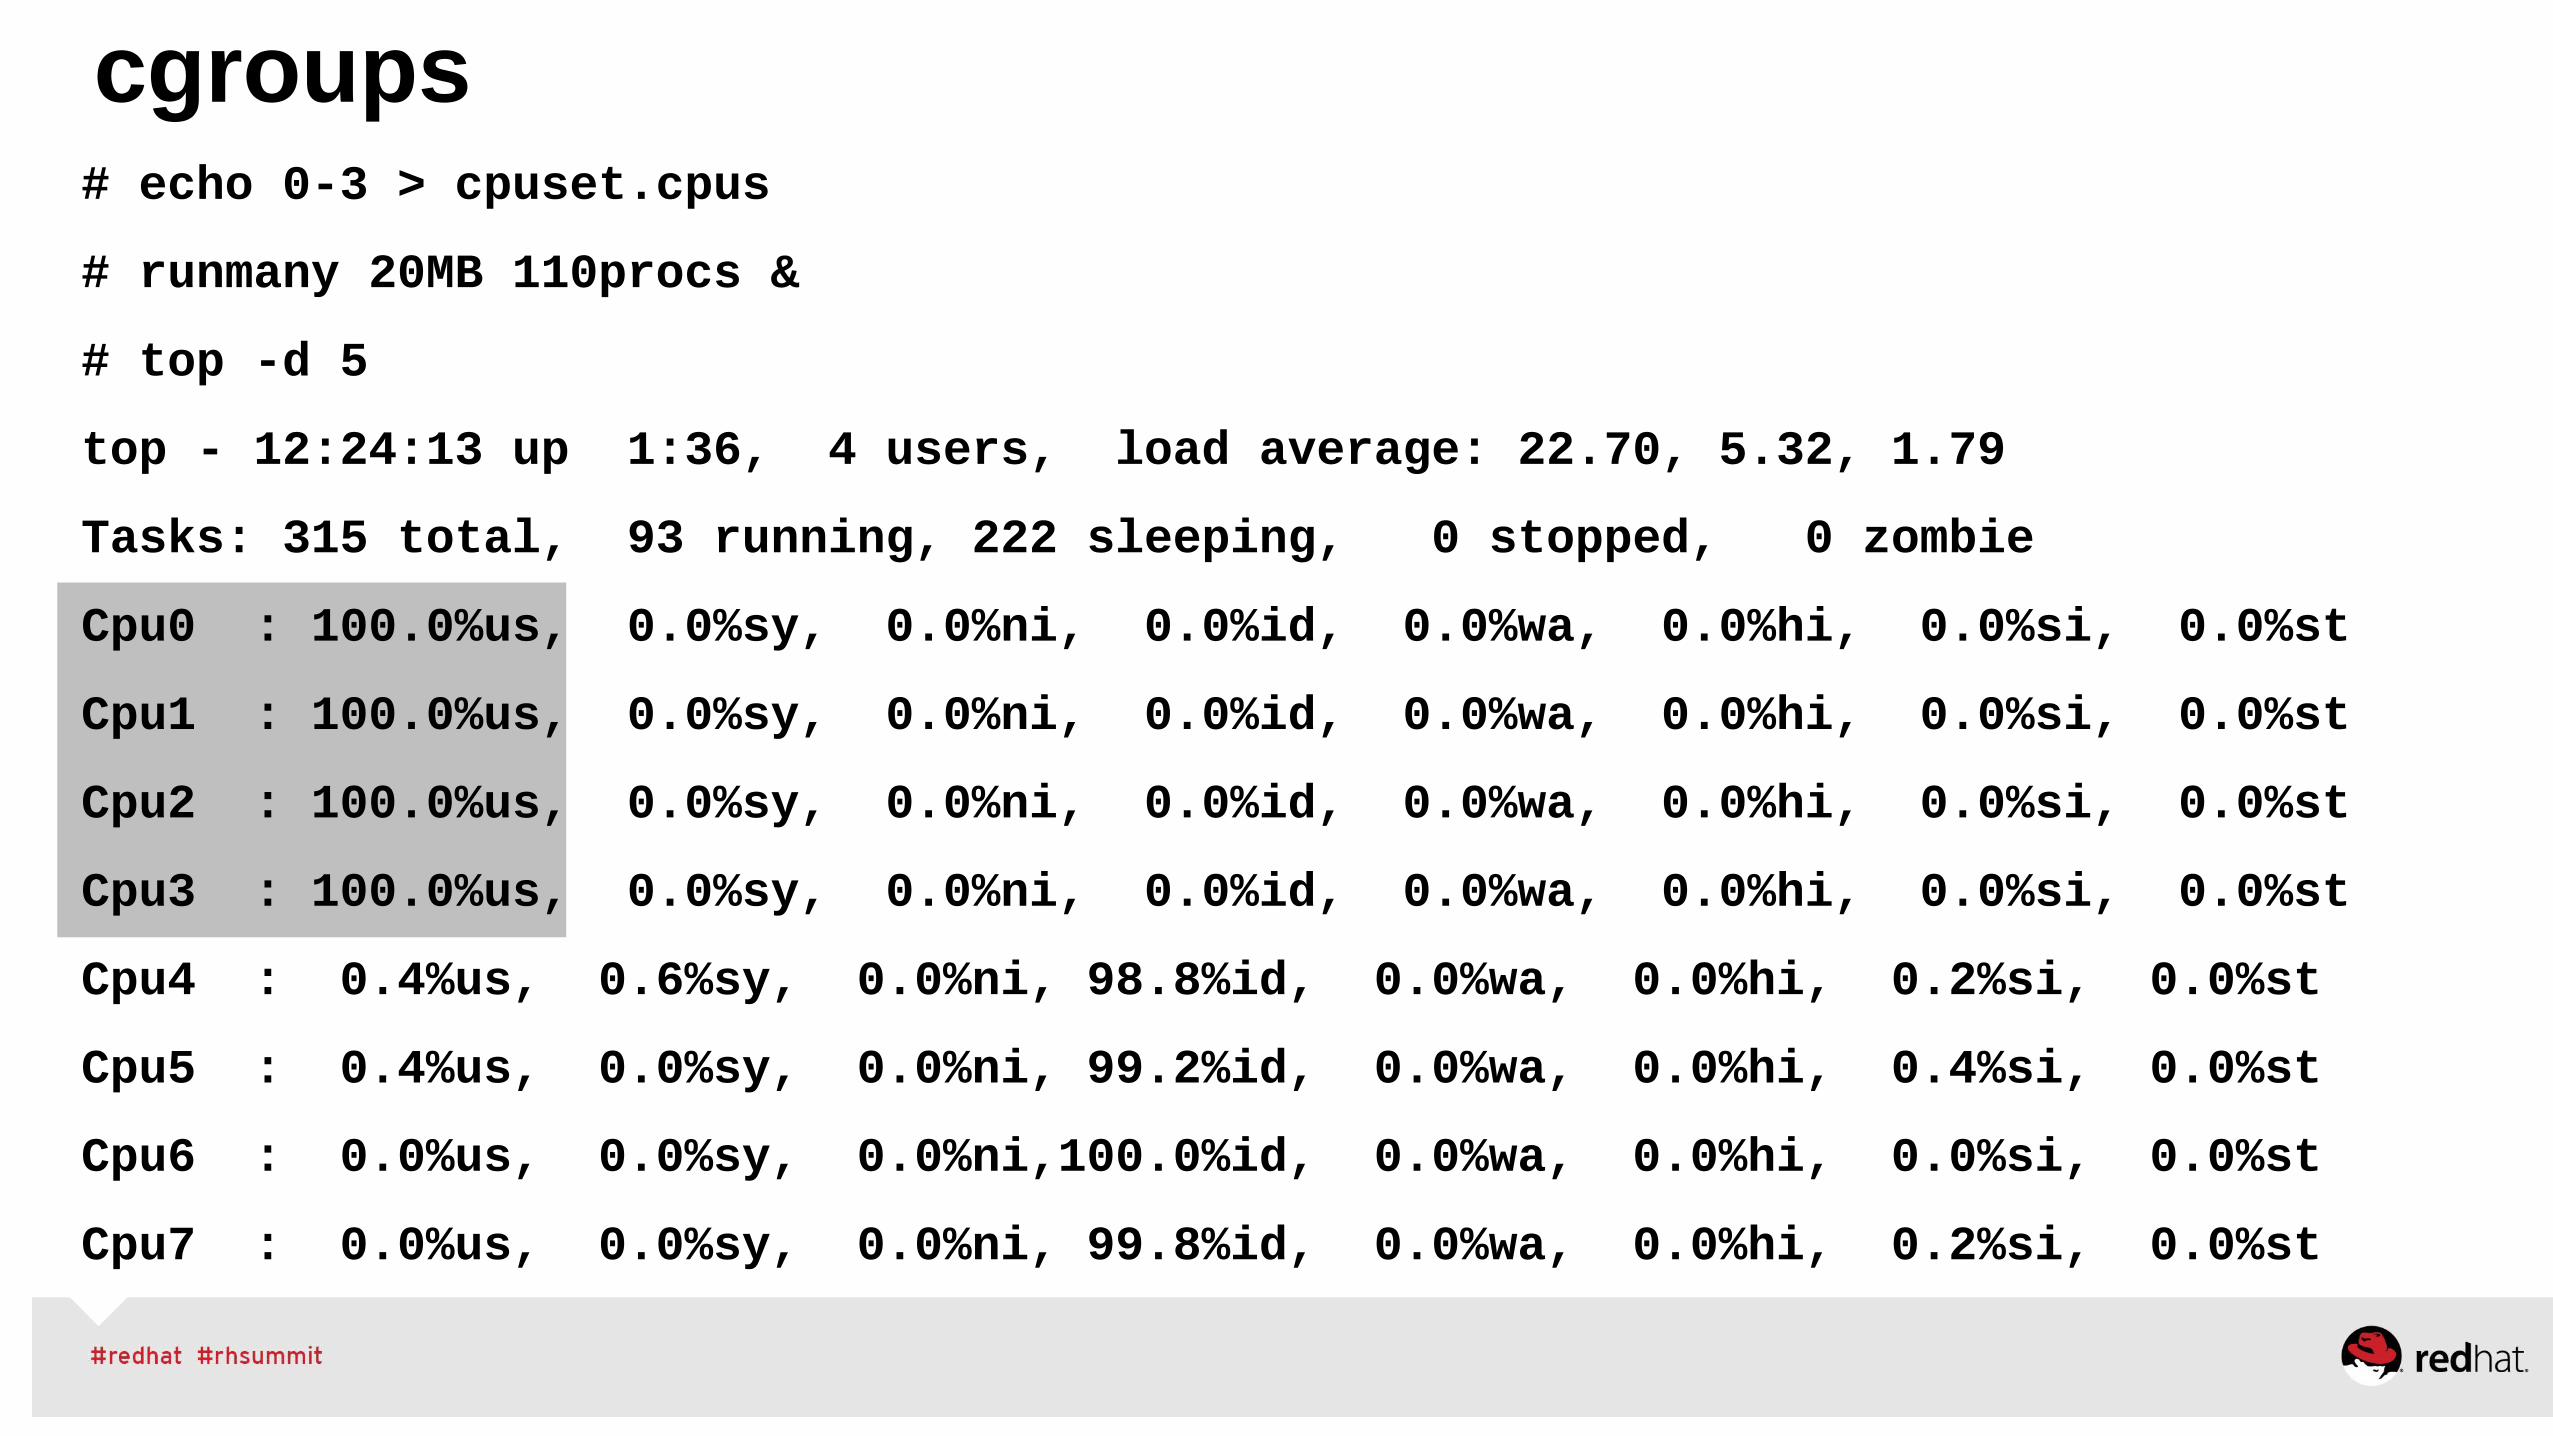
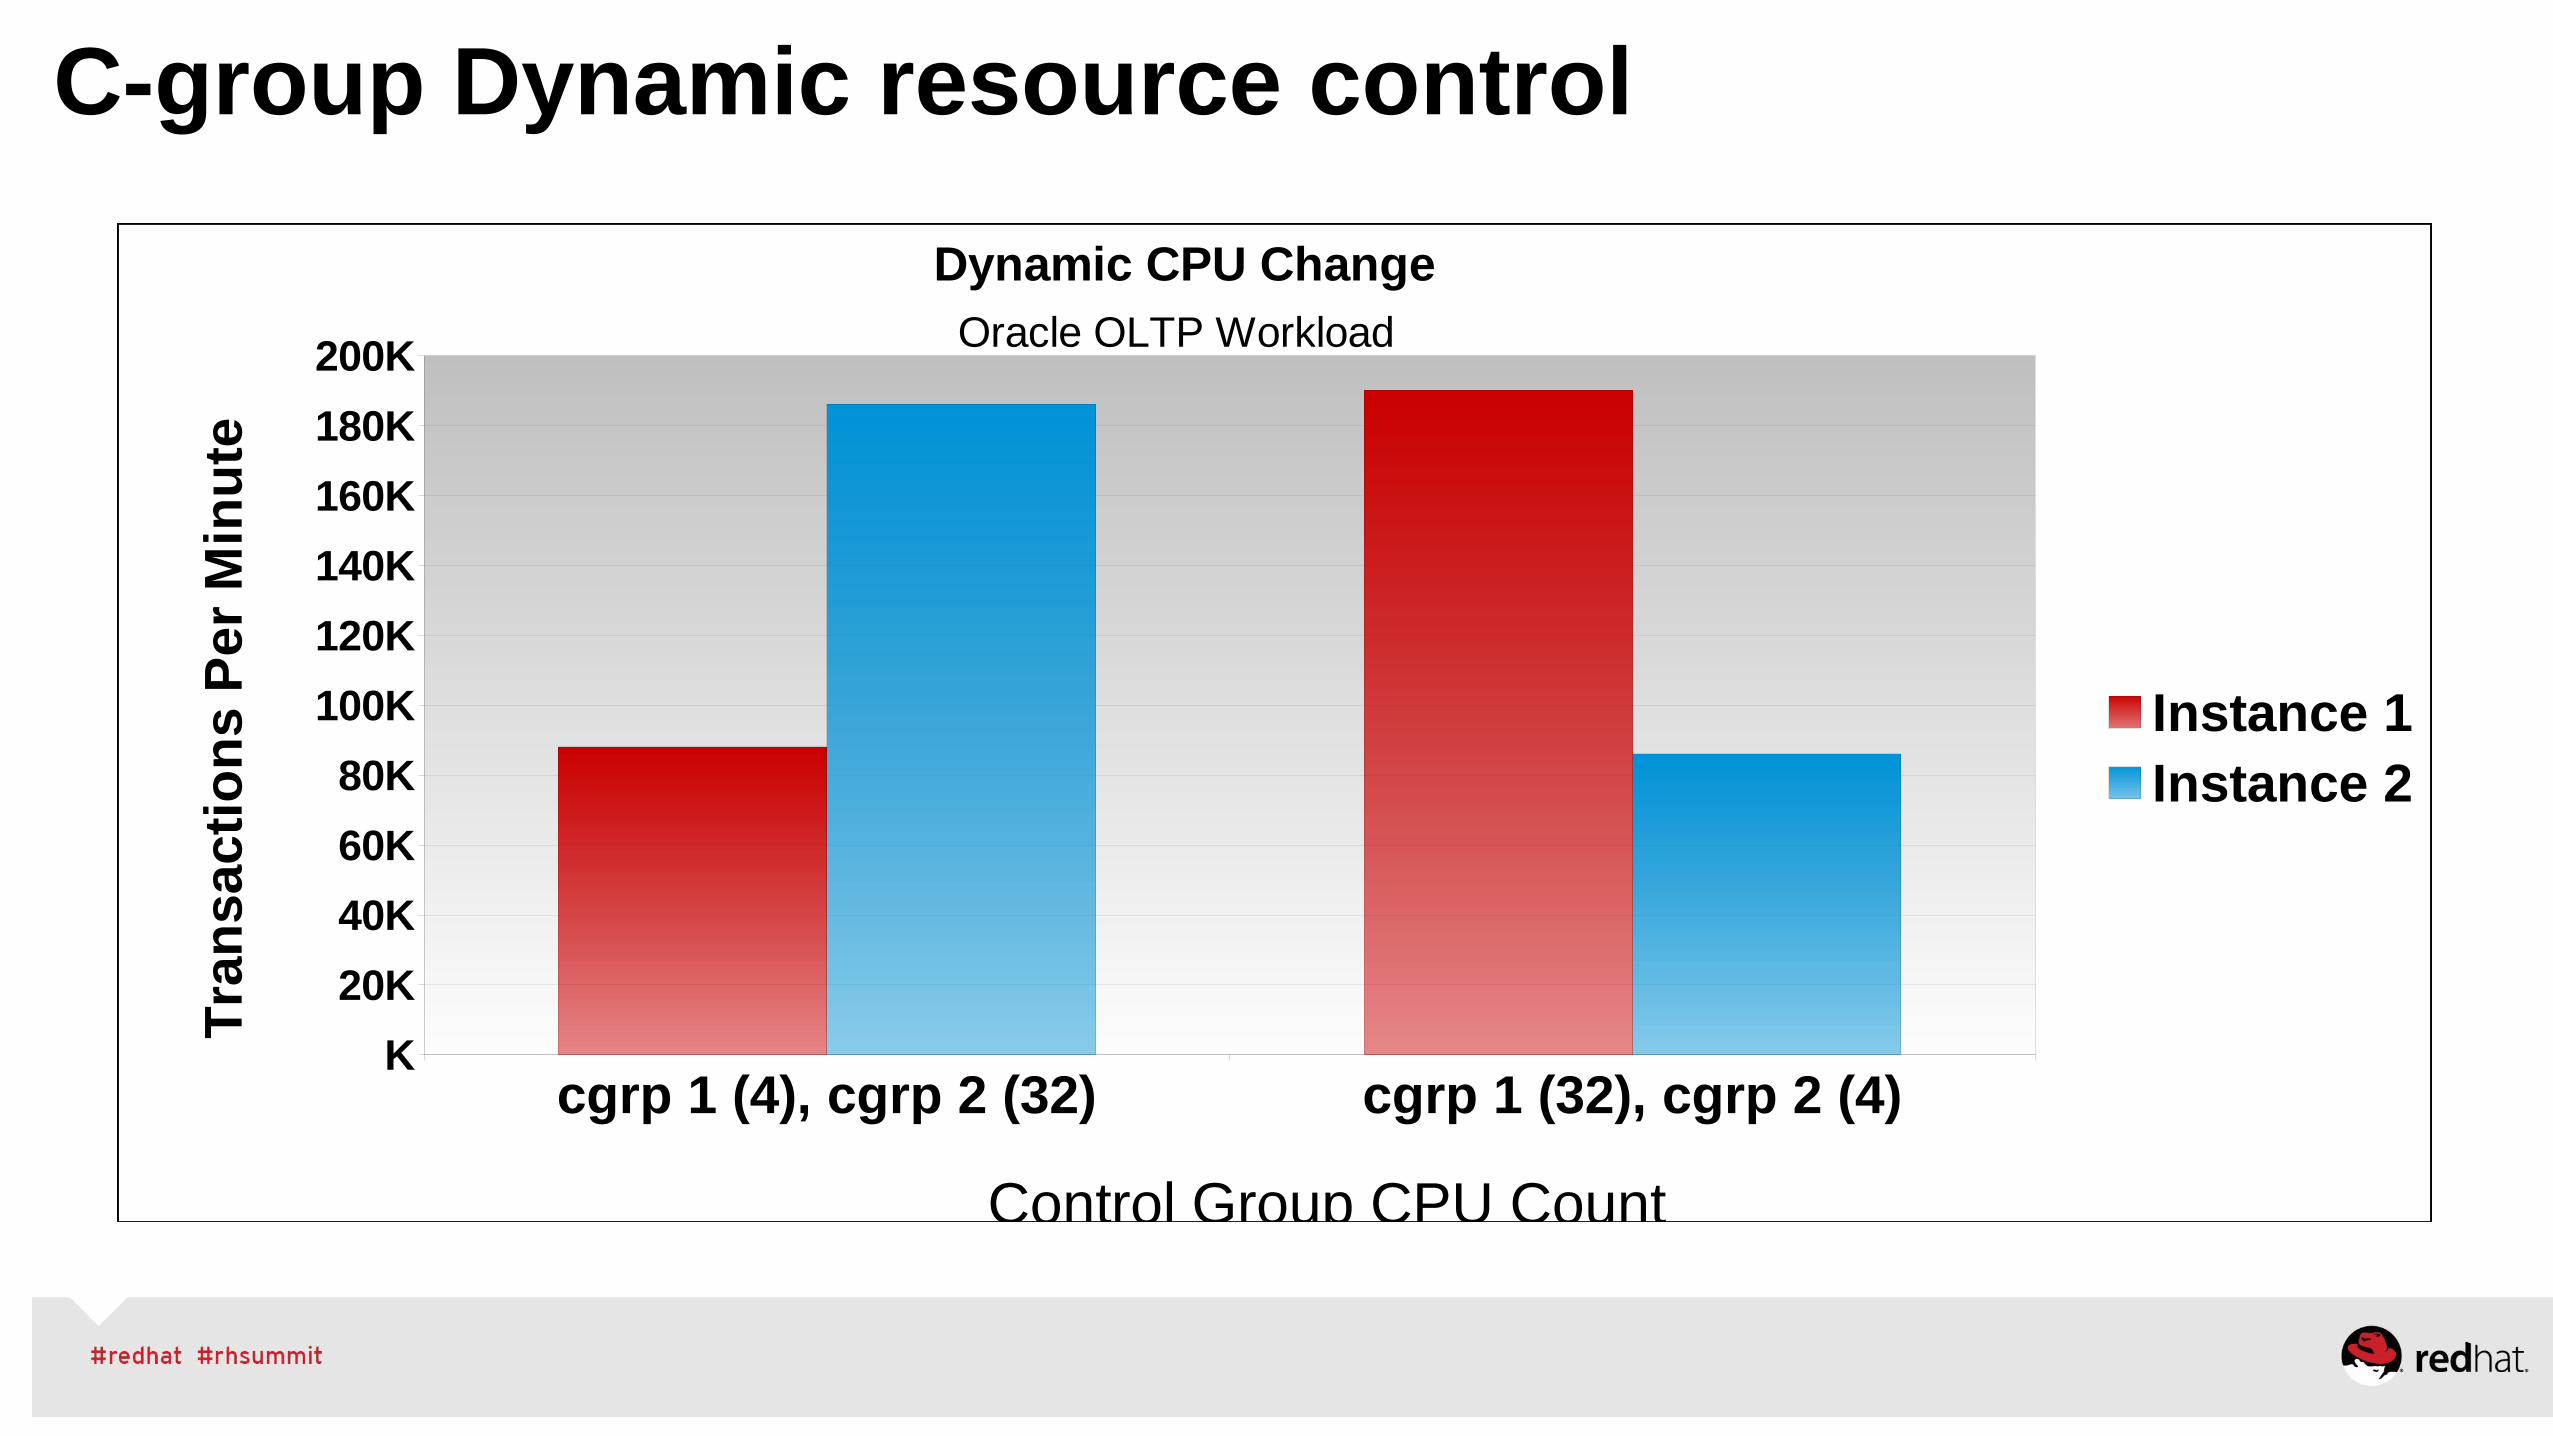
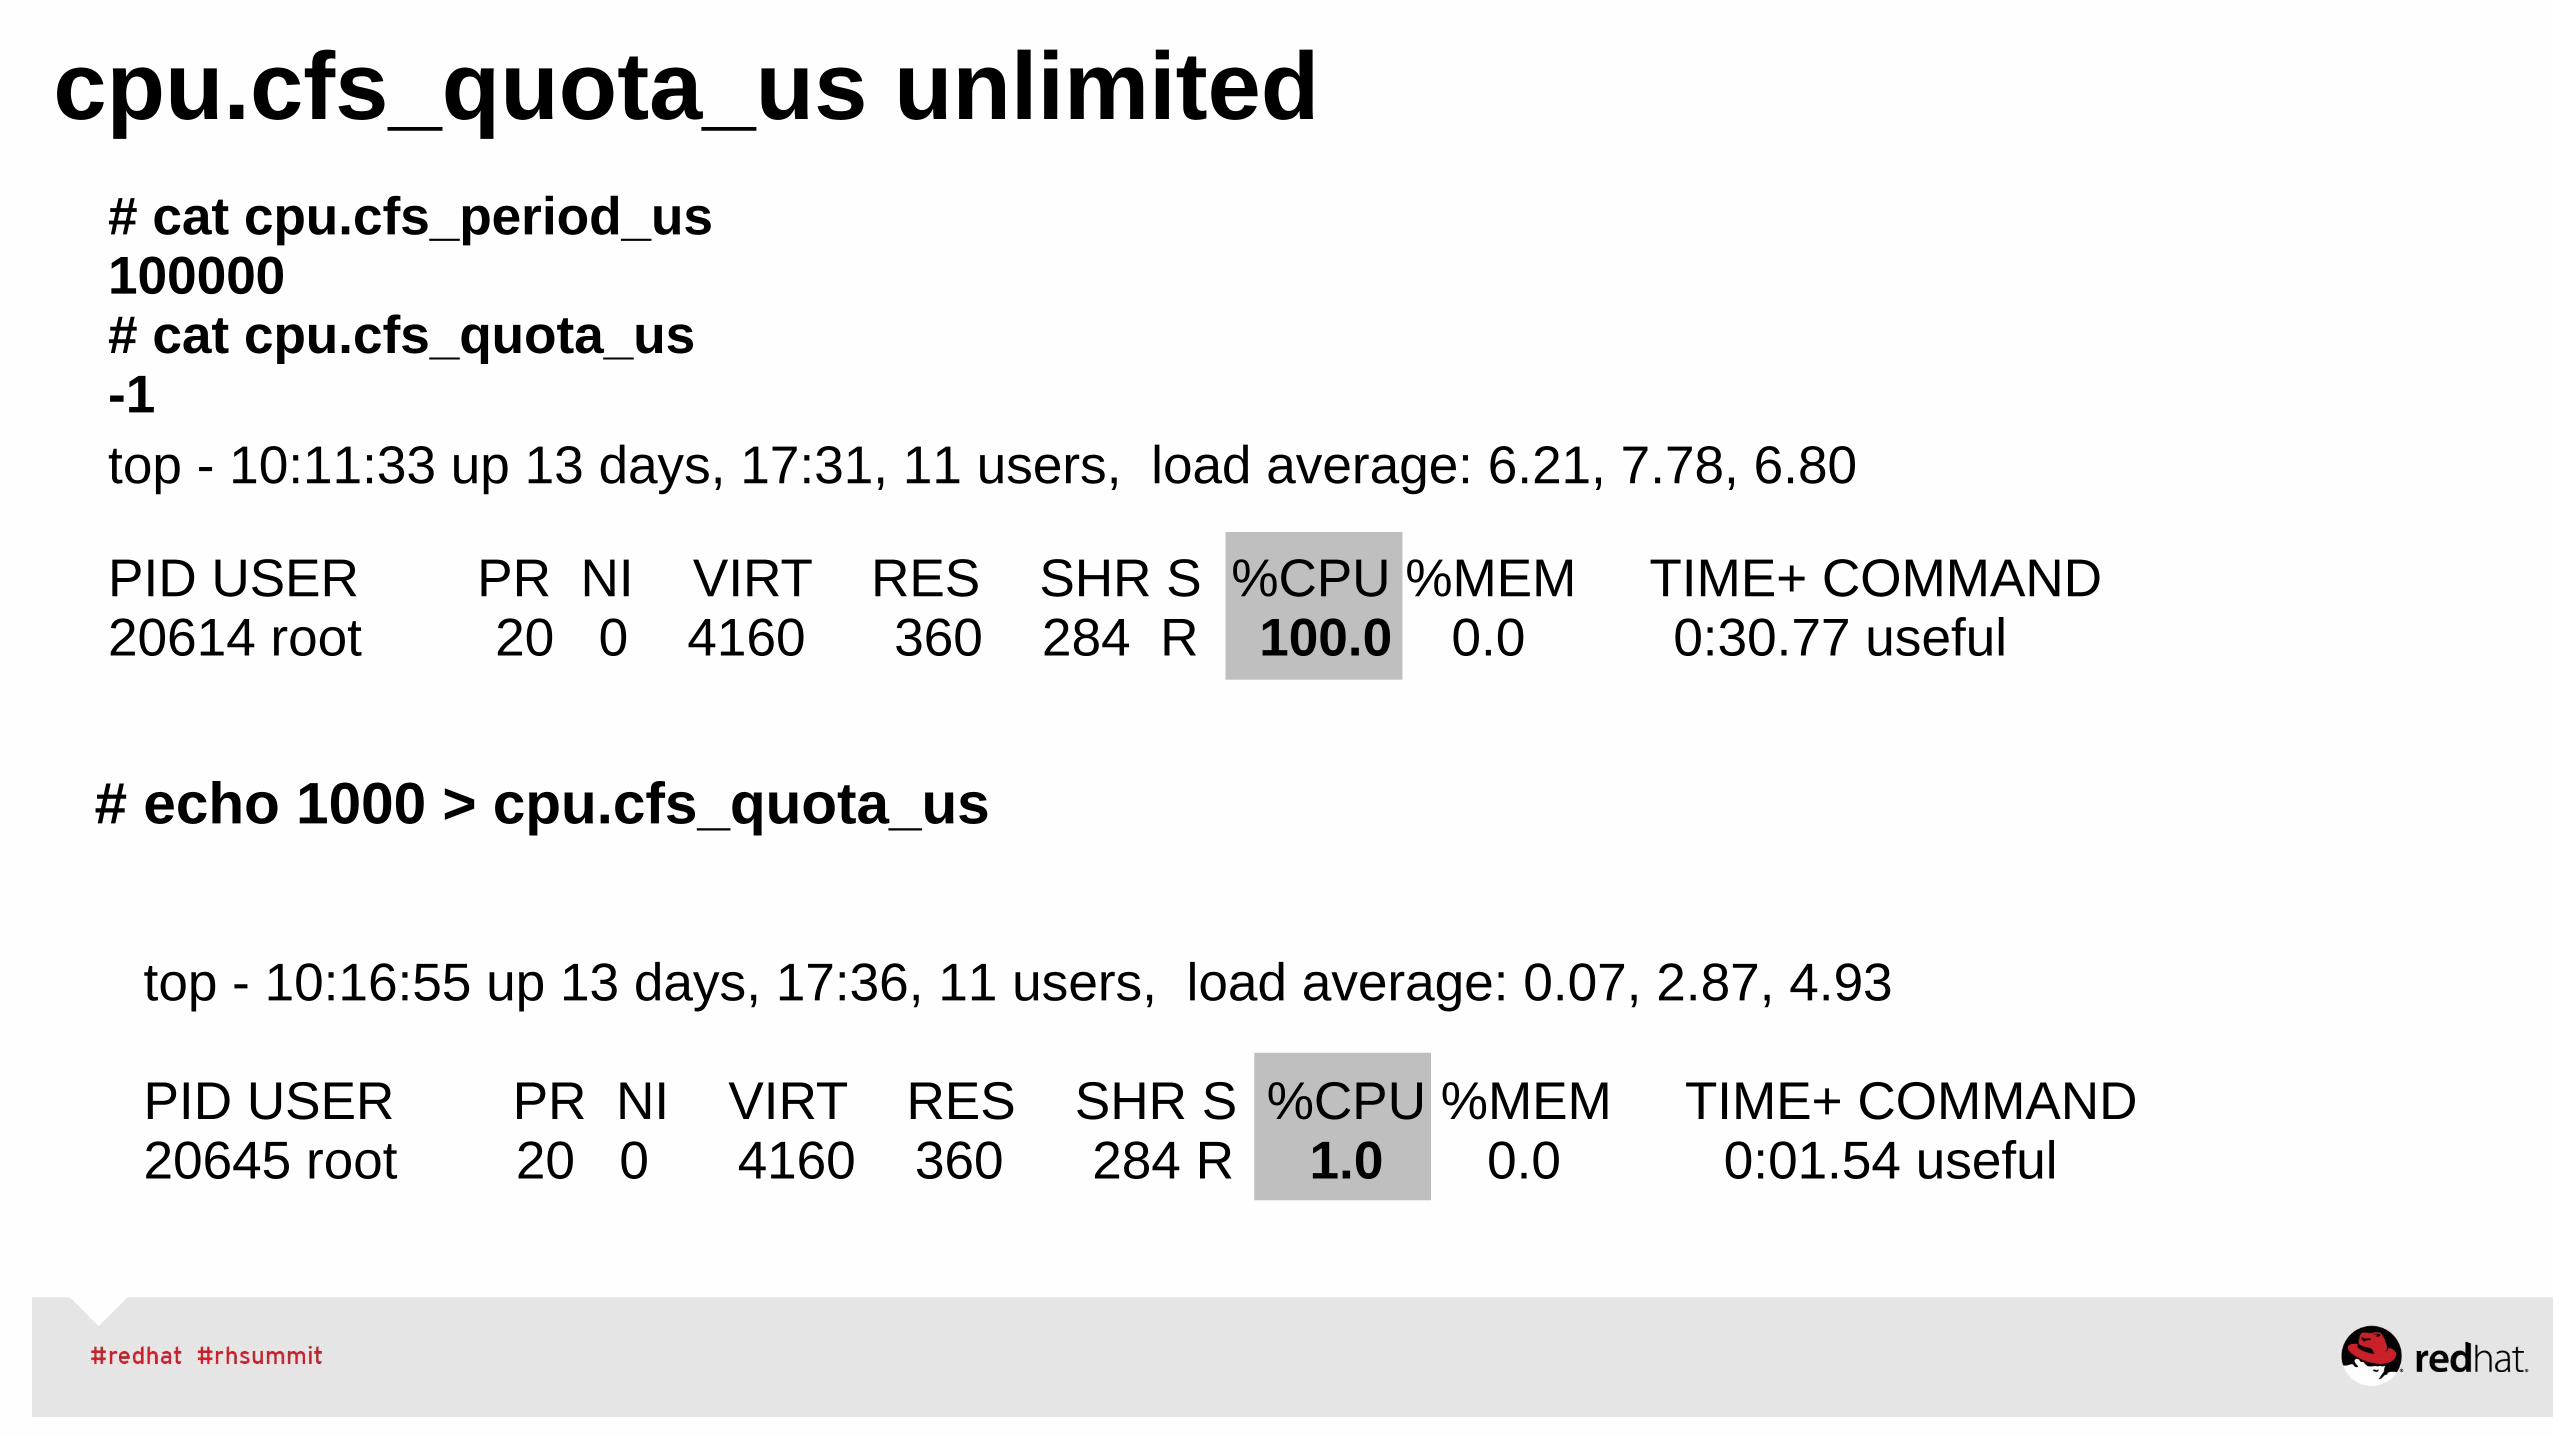
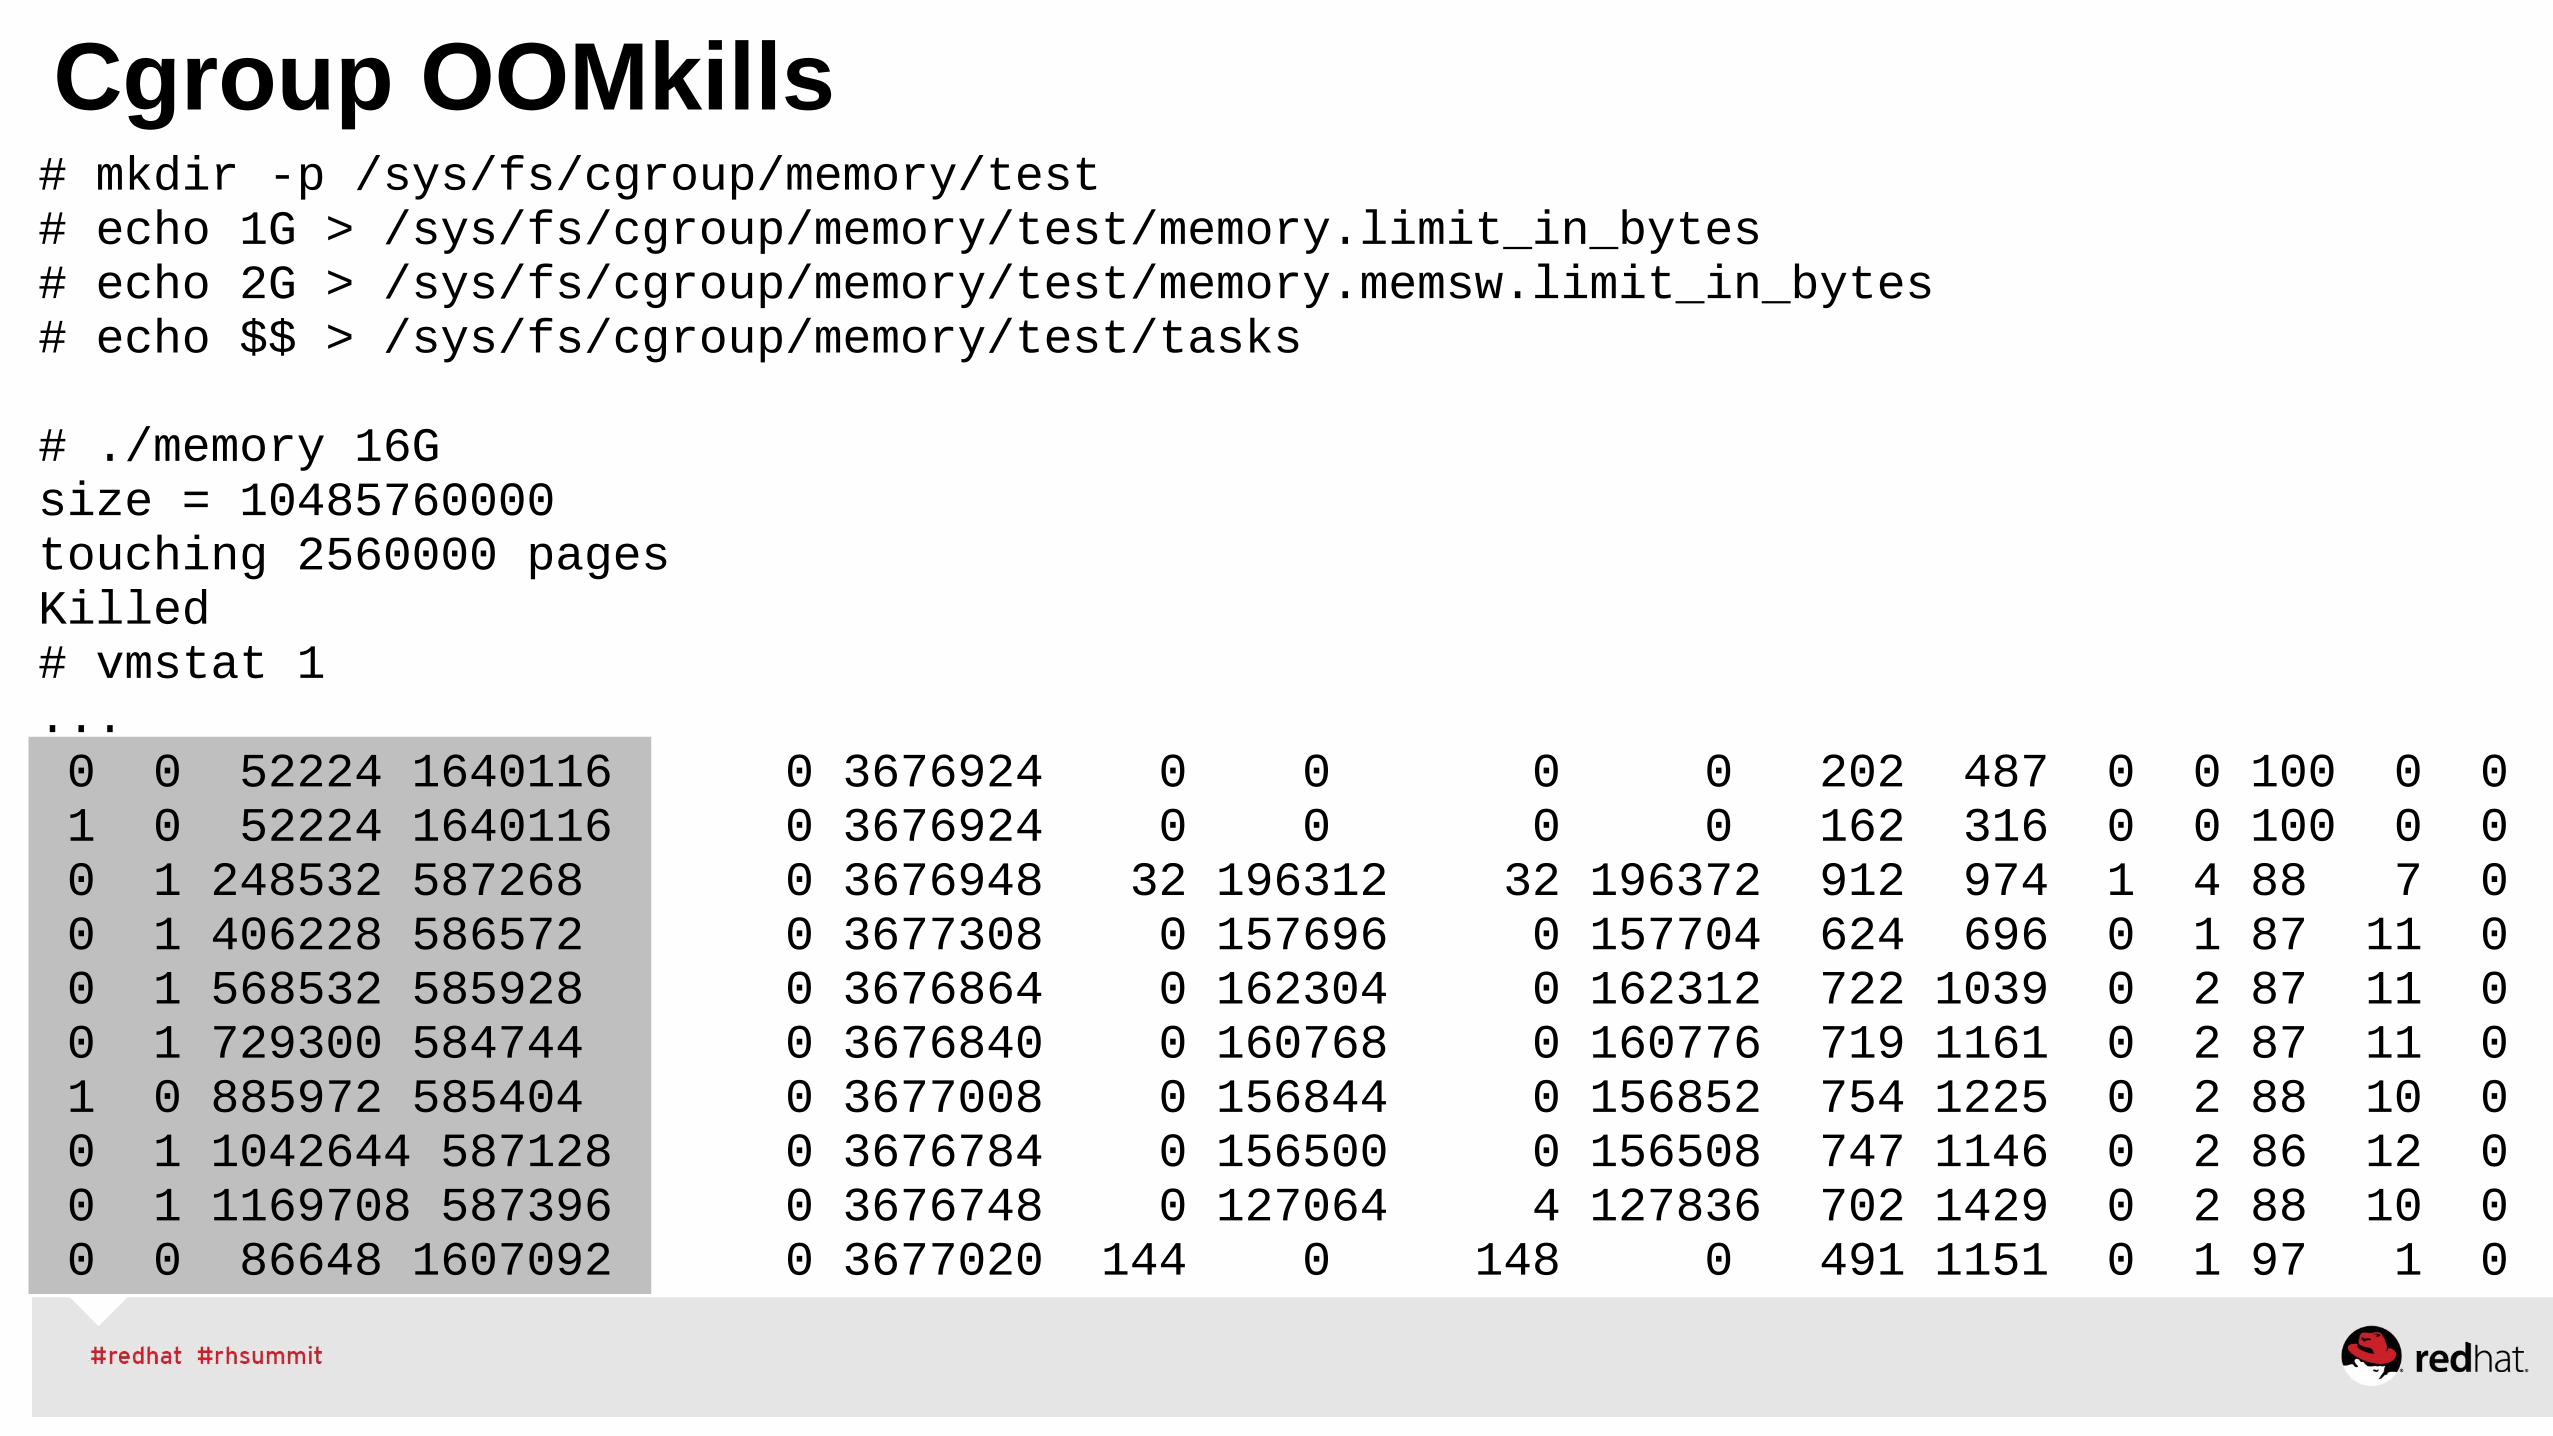
Ability to manage large system resources effectivelyControl Group (Cgroups) for CPU/Memory/Network/DiskBenefit: guarantee Quality of Service & dynamic resource allocationIdeal for managing any multi-application environment
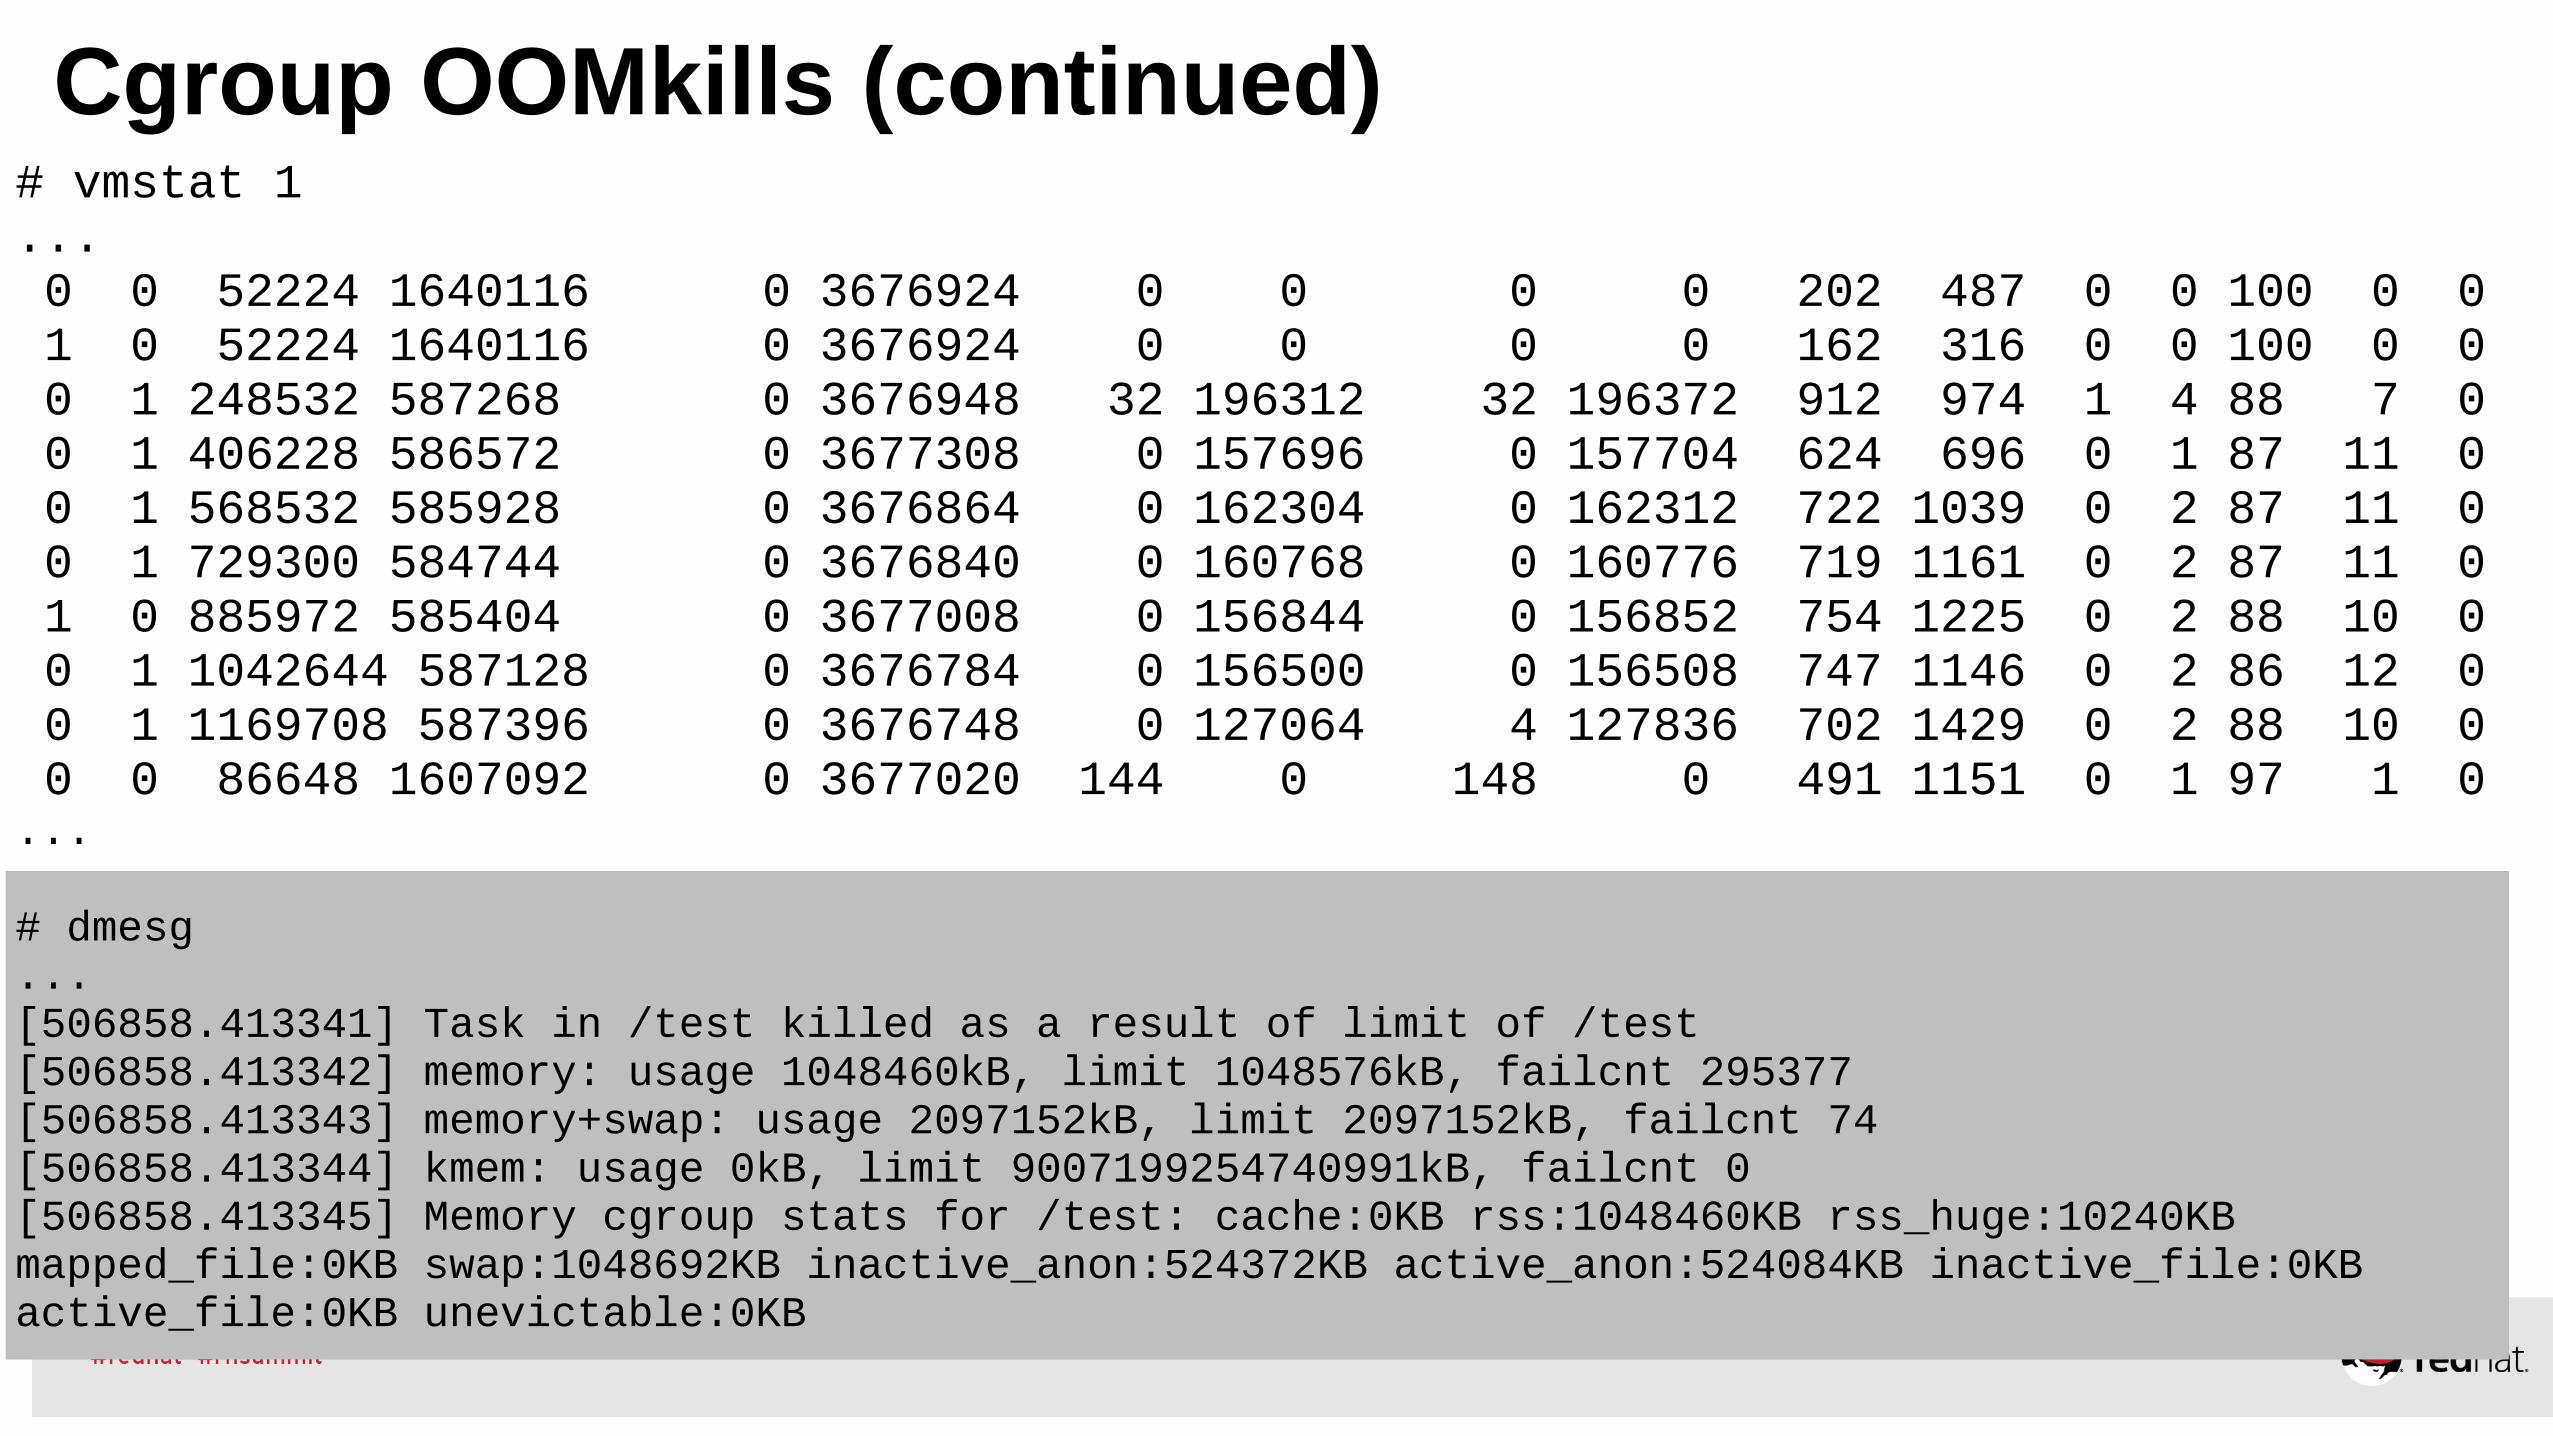
# dmesg...[506858.413341] Task in /test killed as a result of limit of /test[506858.413342] memory: usage 1048460kB, limit 1048576kB, failcnt 295377[506858.413343] memory+swap: usage 2097152kB, limit 2097152kB, failcnt 74[506858.413344] kmem: usage 0kB, limit 9007199254740991kB, failcnt 0[506858.413345] Memory cgroup stats for /test: cache:0KB rss:1048460KB rss_huge:10240KB mapped_file:0KB swap:1048692KB inactive_anon:524372KB active_anon:524084KB inactive_file:0KB active_file:0KB unevictable:0KB
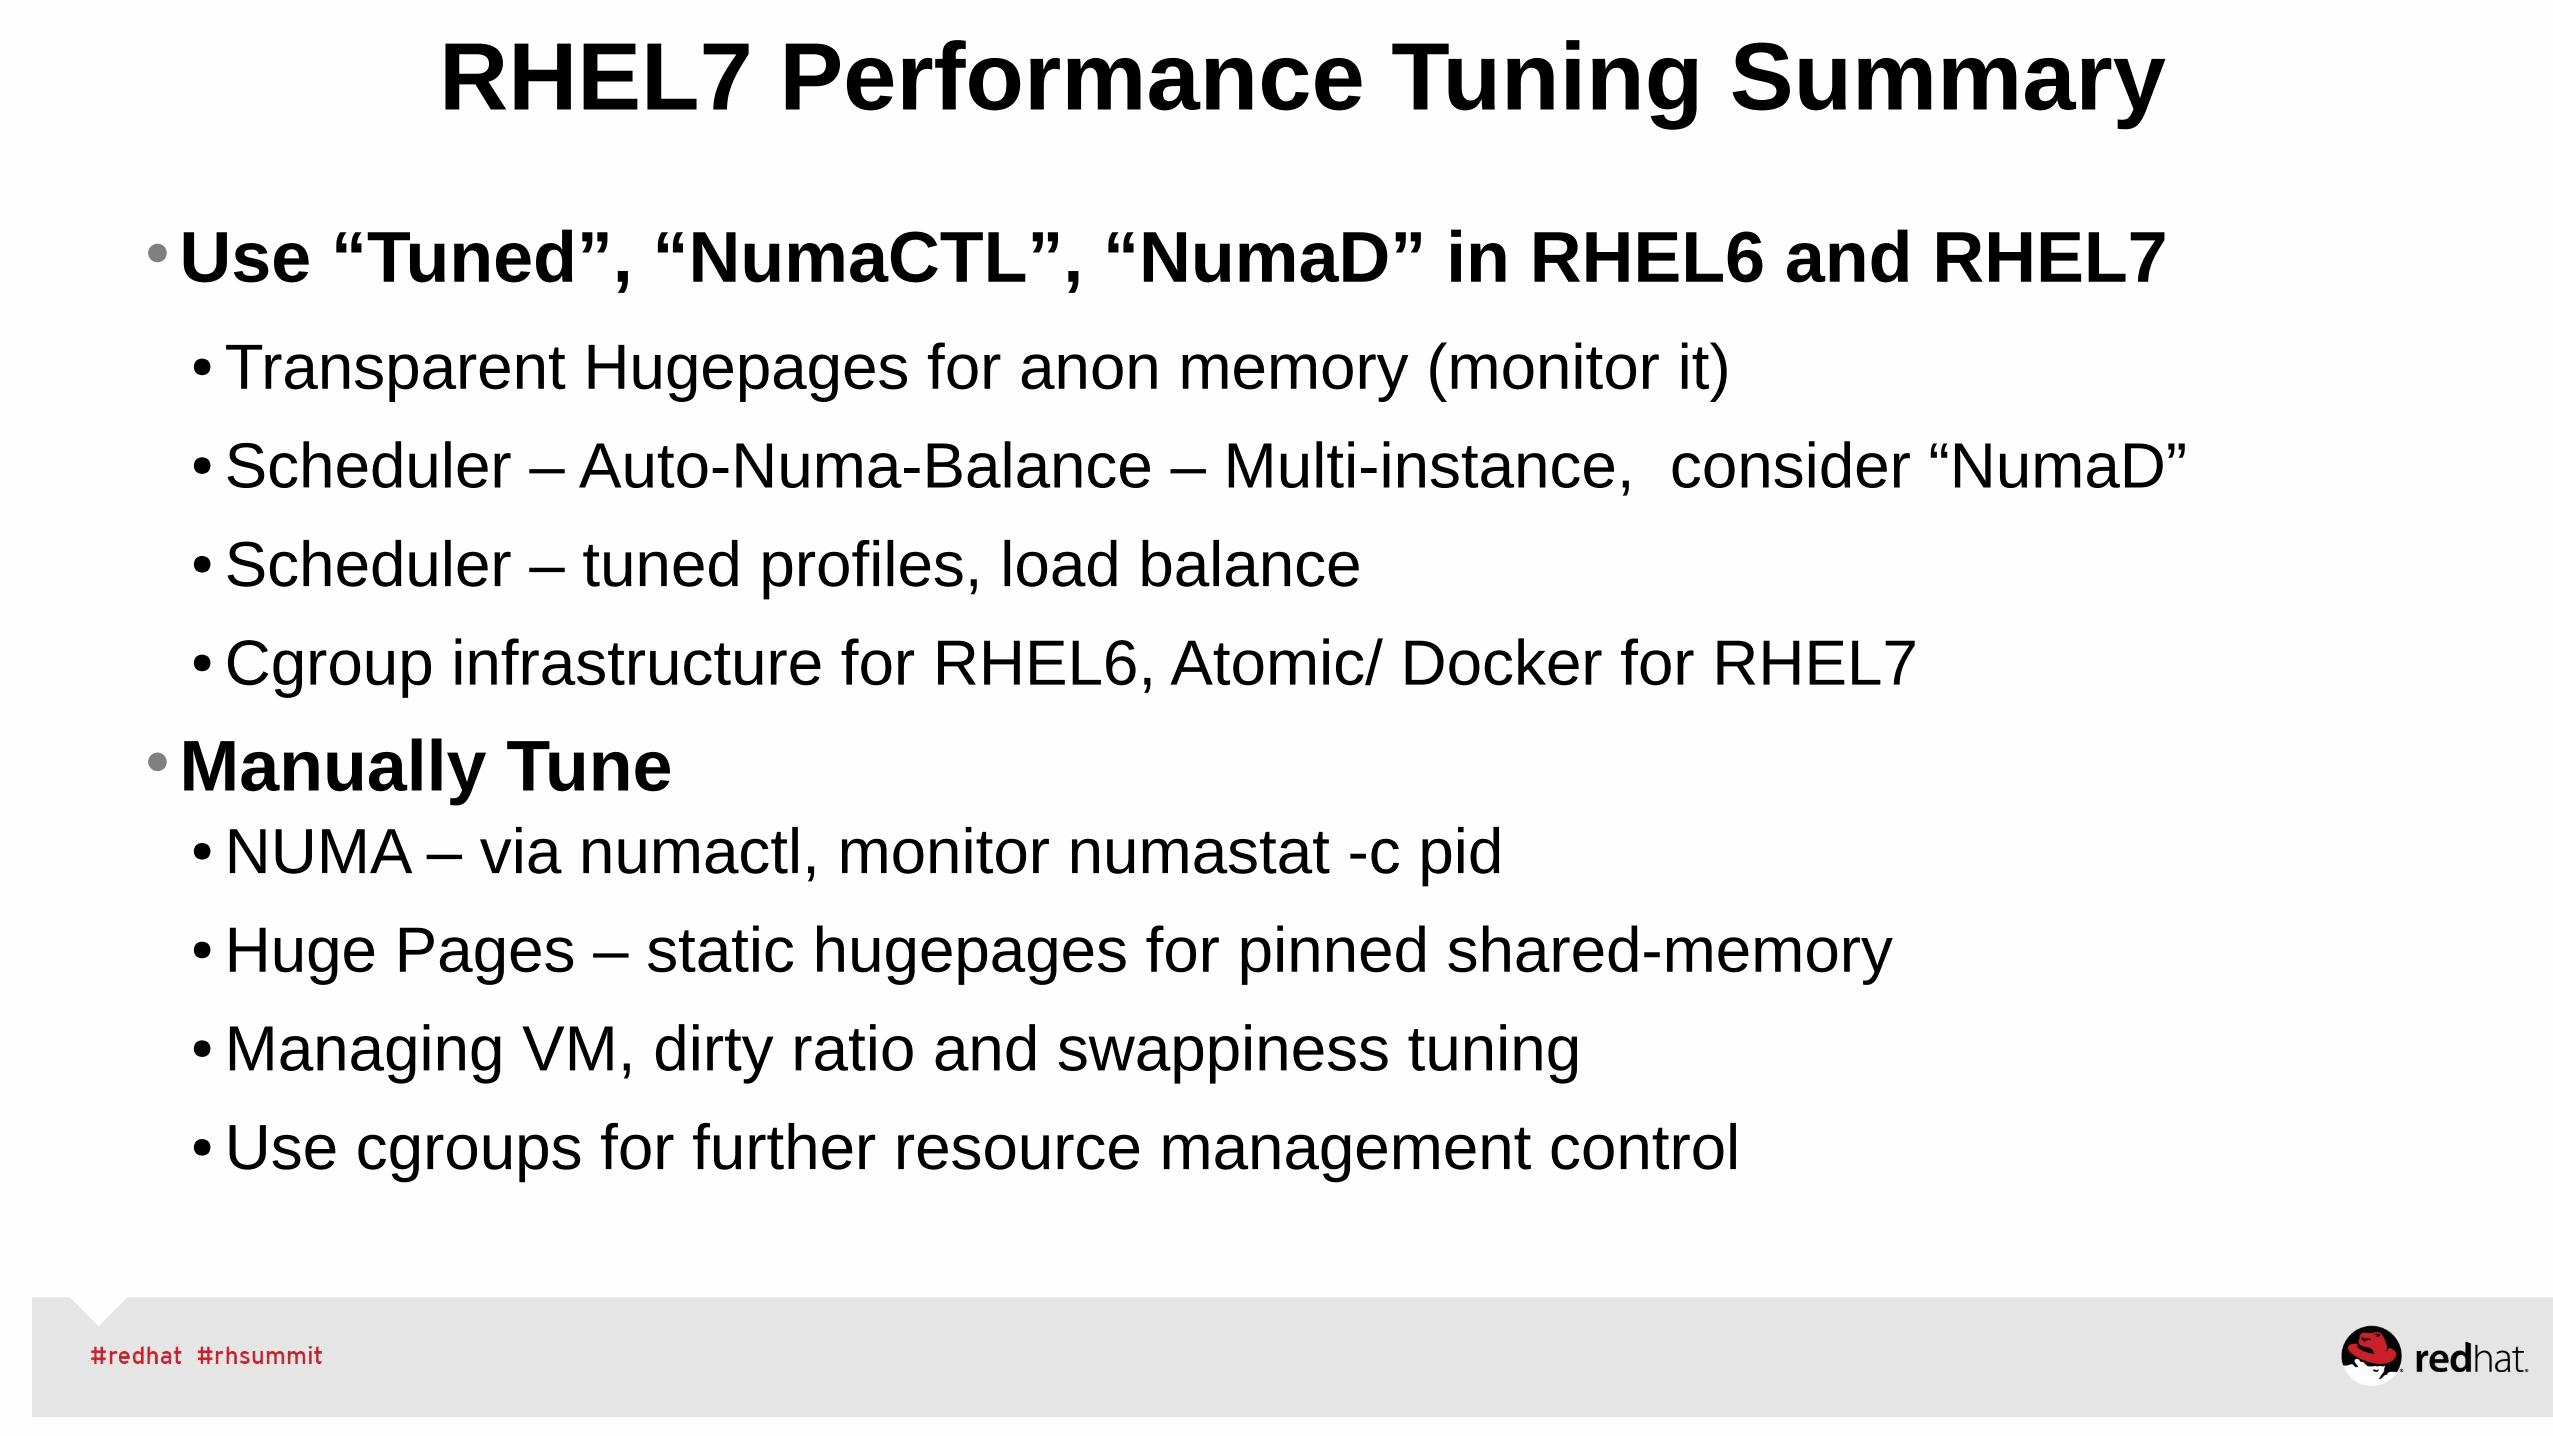
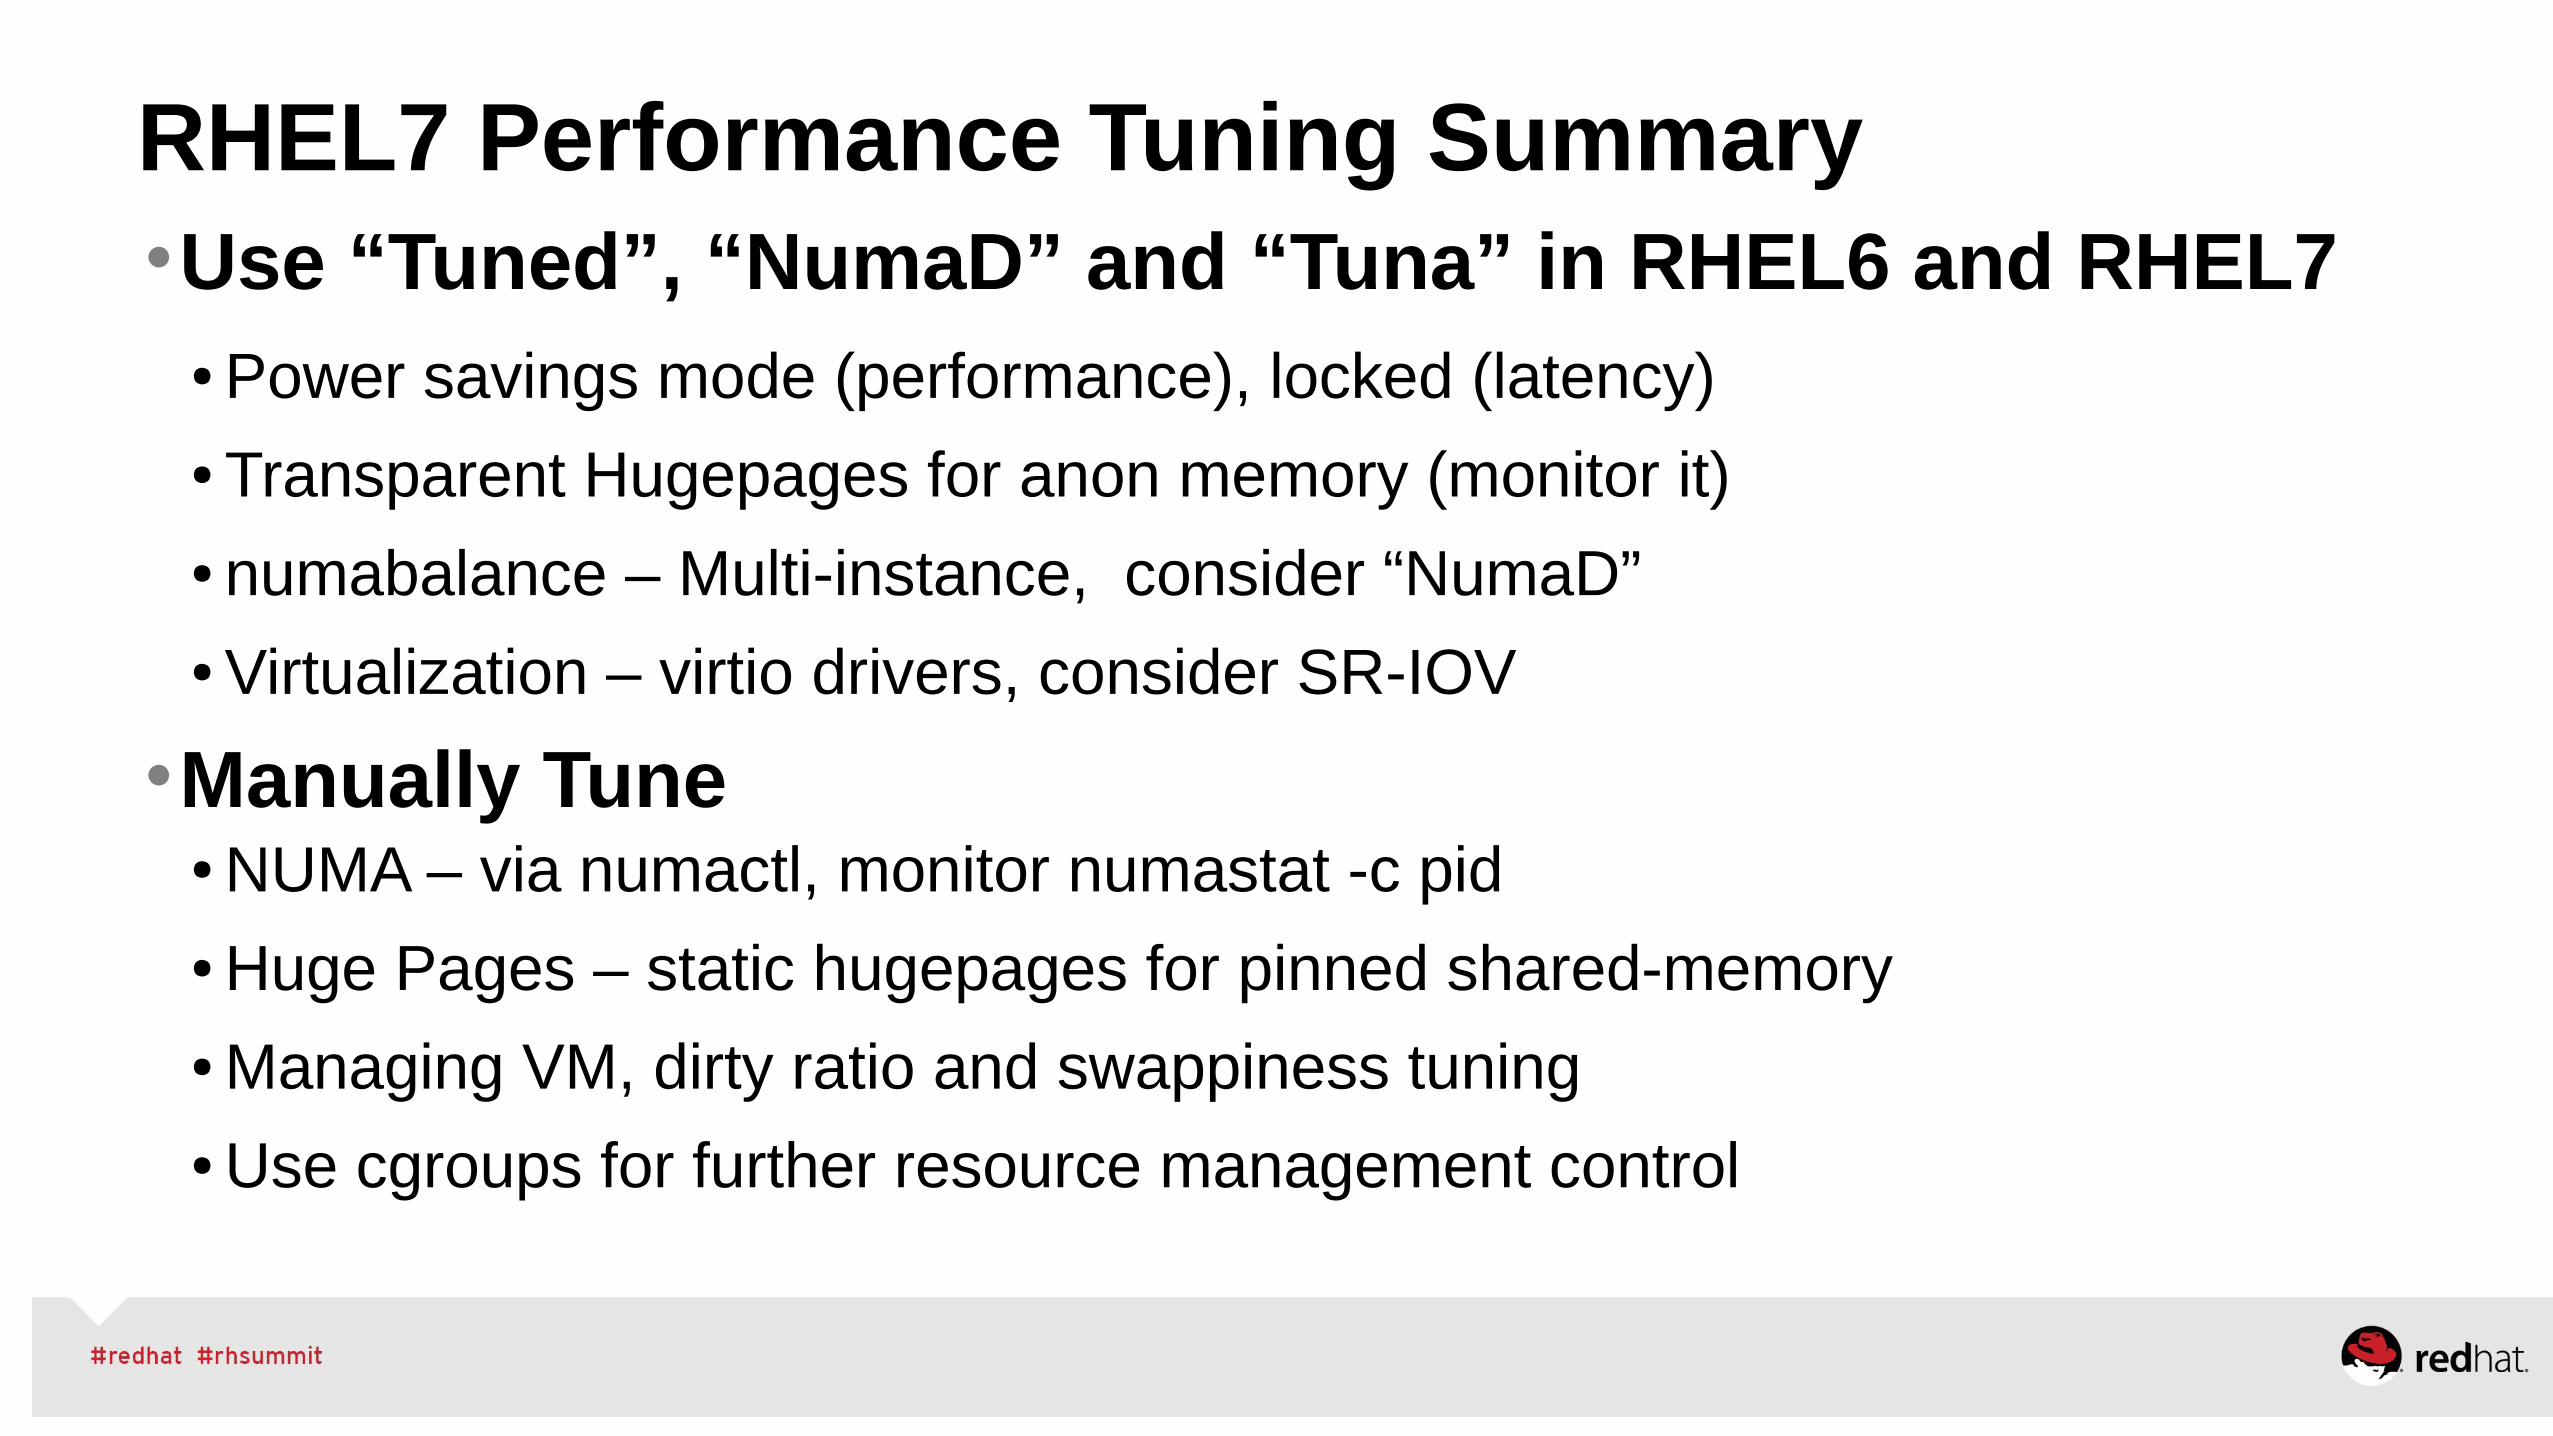
RHEL7 Performance Tuning Summary
•Use “Tuned”, “NumaCTL”, “NumaD” in RHEL6 and RHEL7● Transparent Hugepages for anon memory (monitor it)● Scheduler – Auto-Numa-Balance – Multi-instance, consider “NumaD”● Scheduler – tuned profiles, load balance● Cgroup infrastructure for RHEL6, Atomic/ Docker for RHEL7
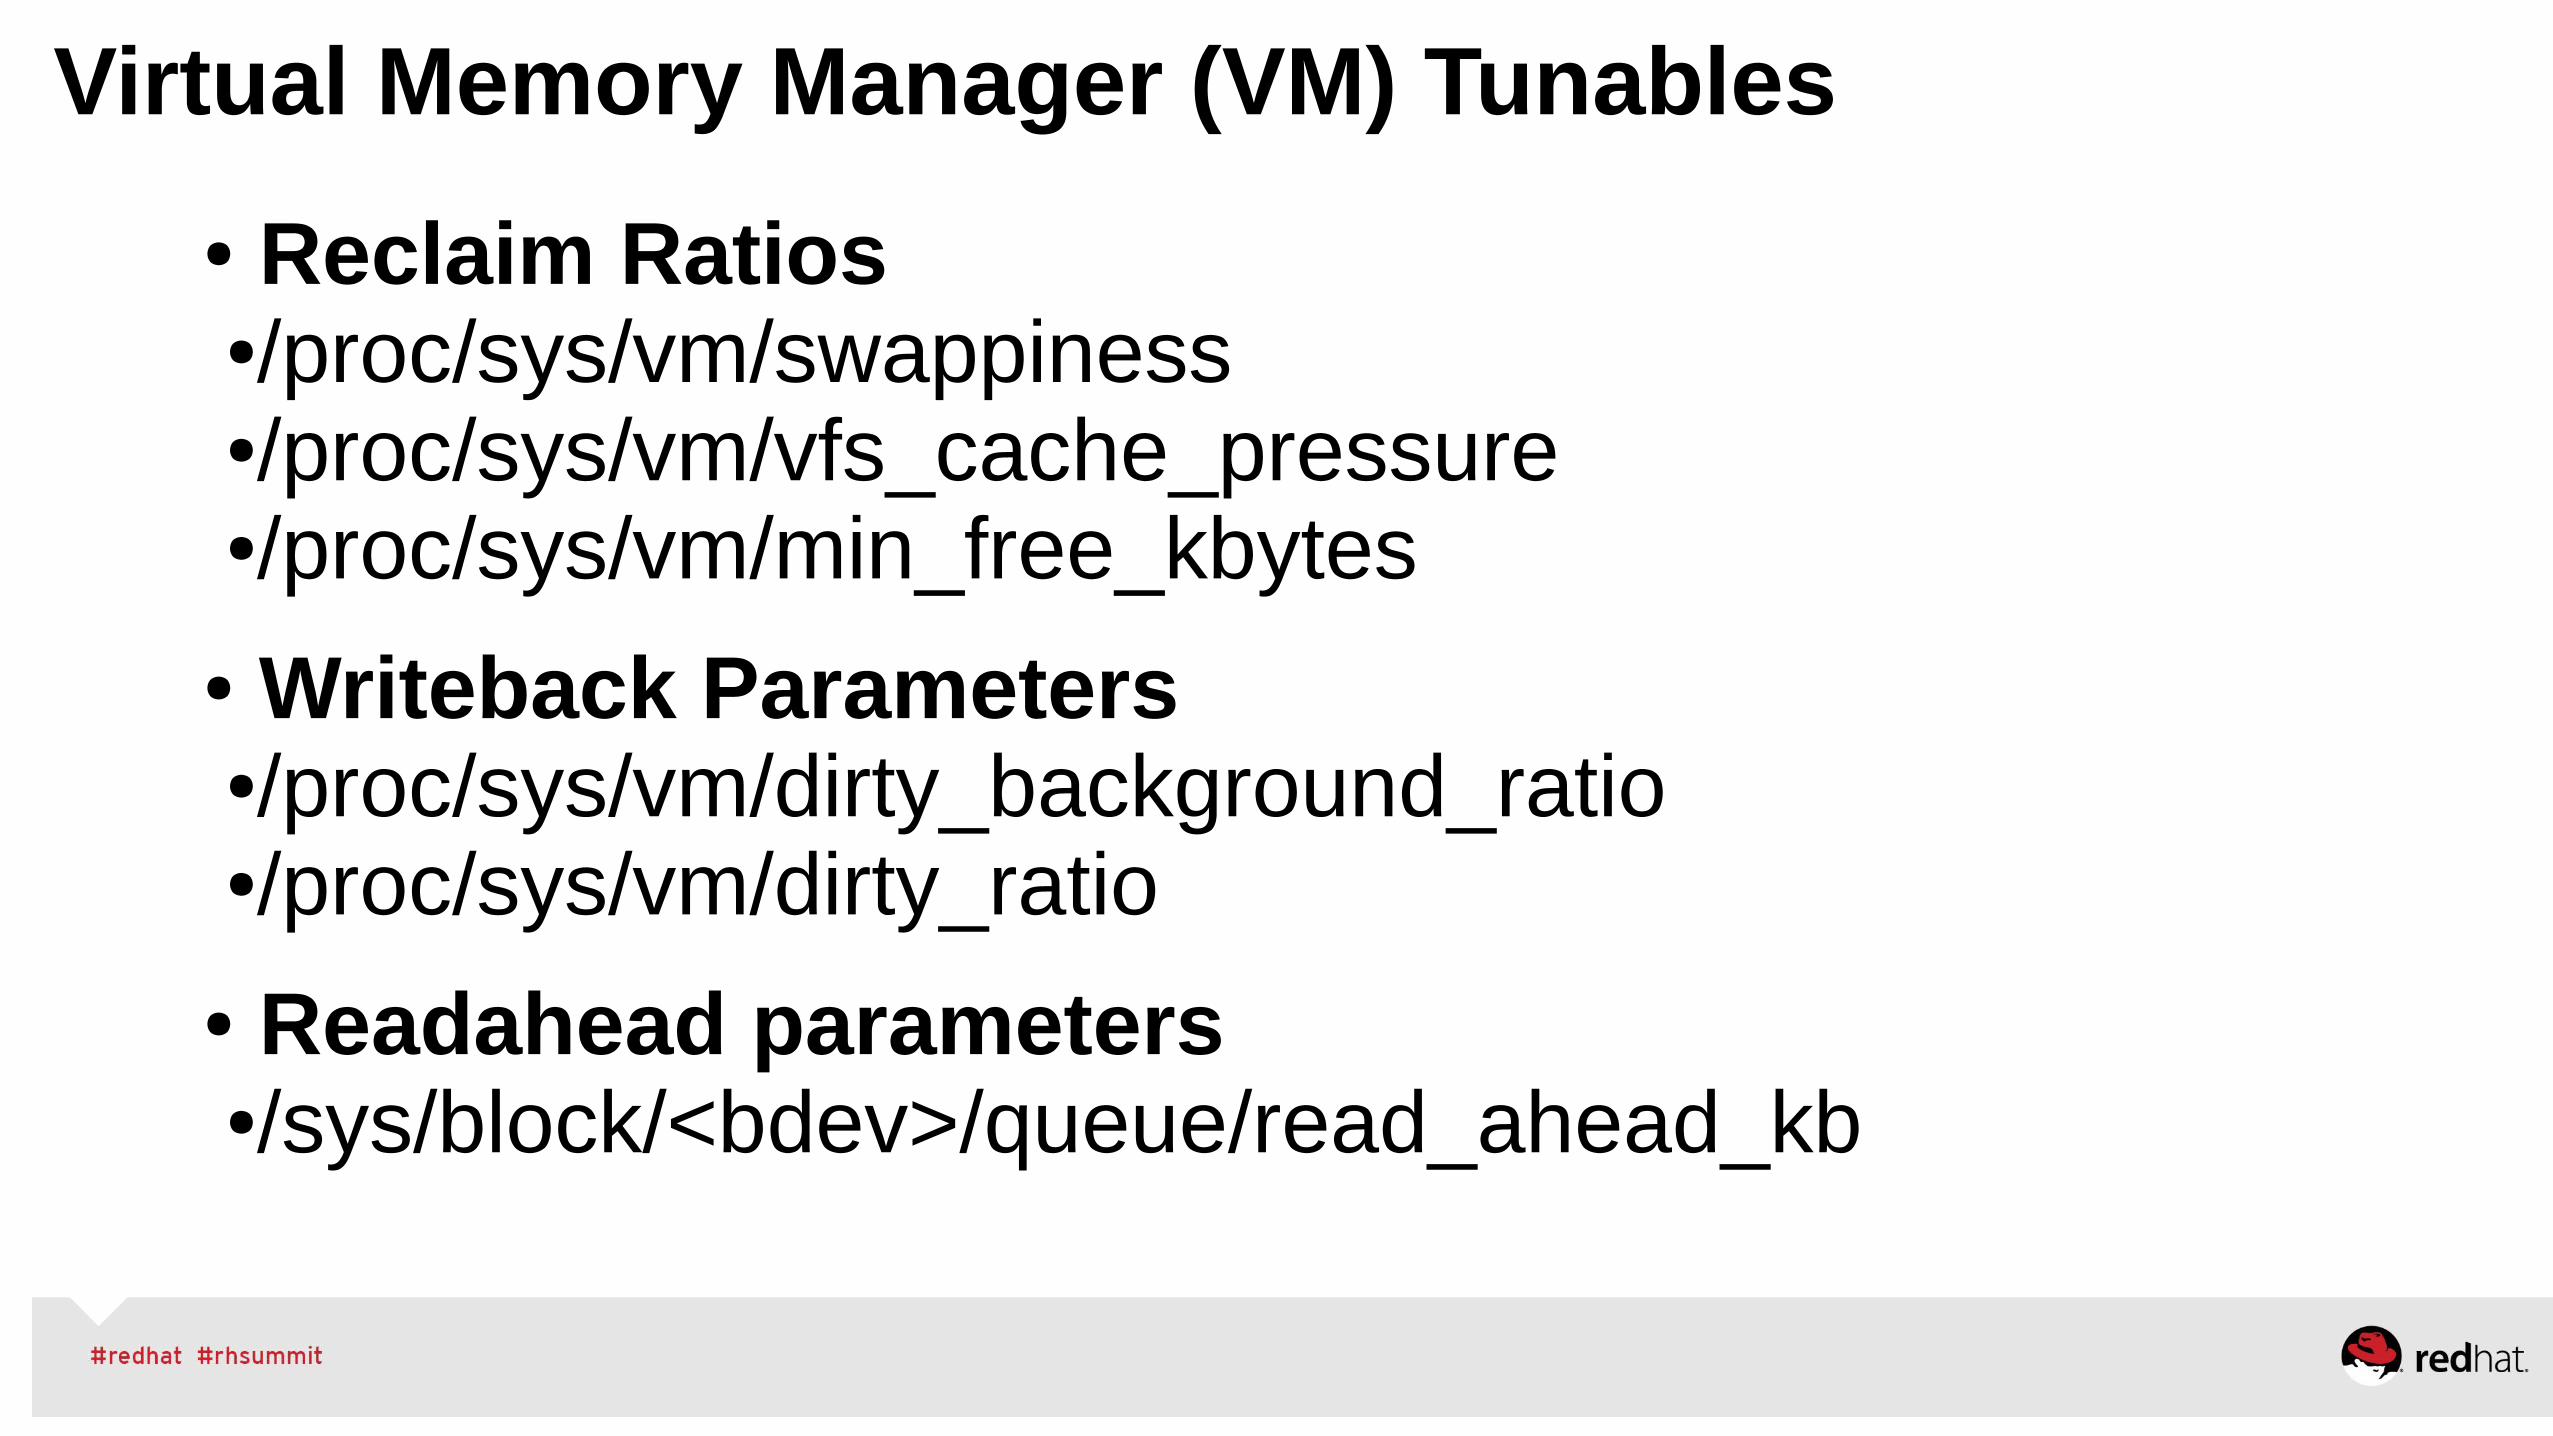
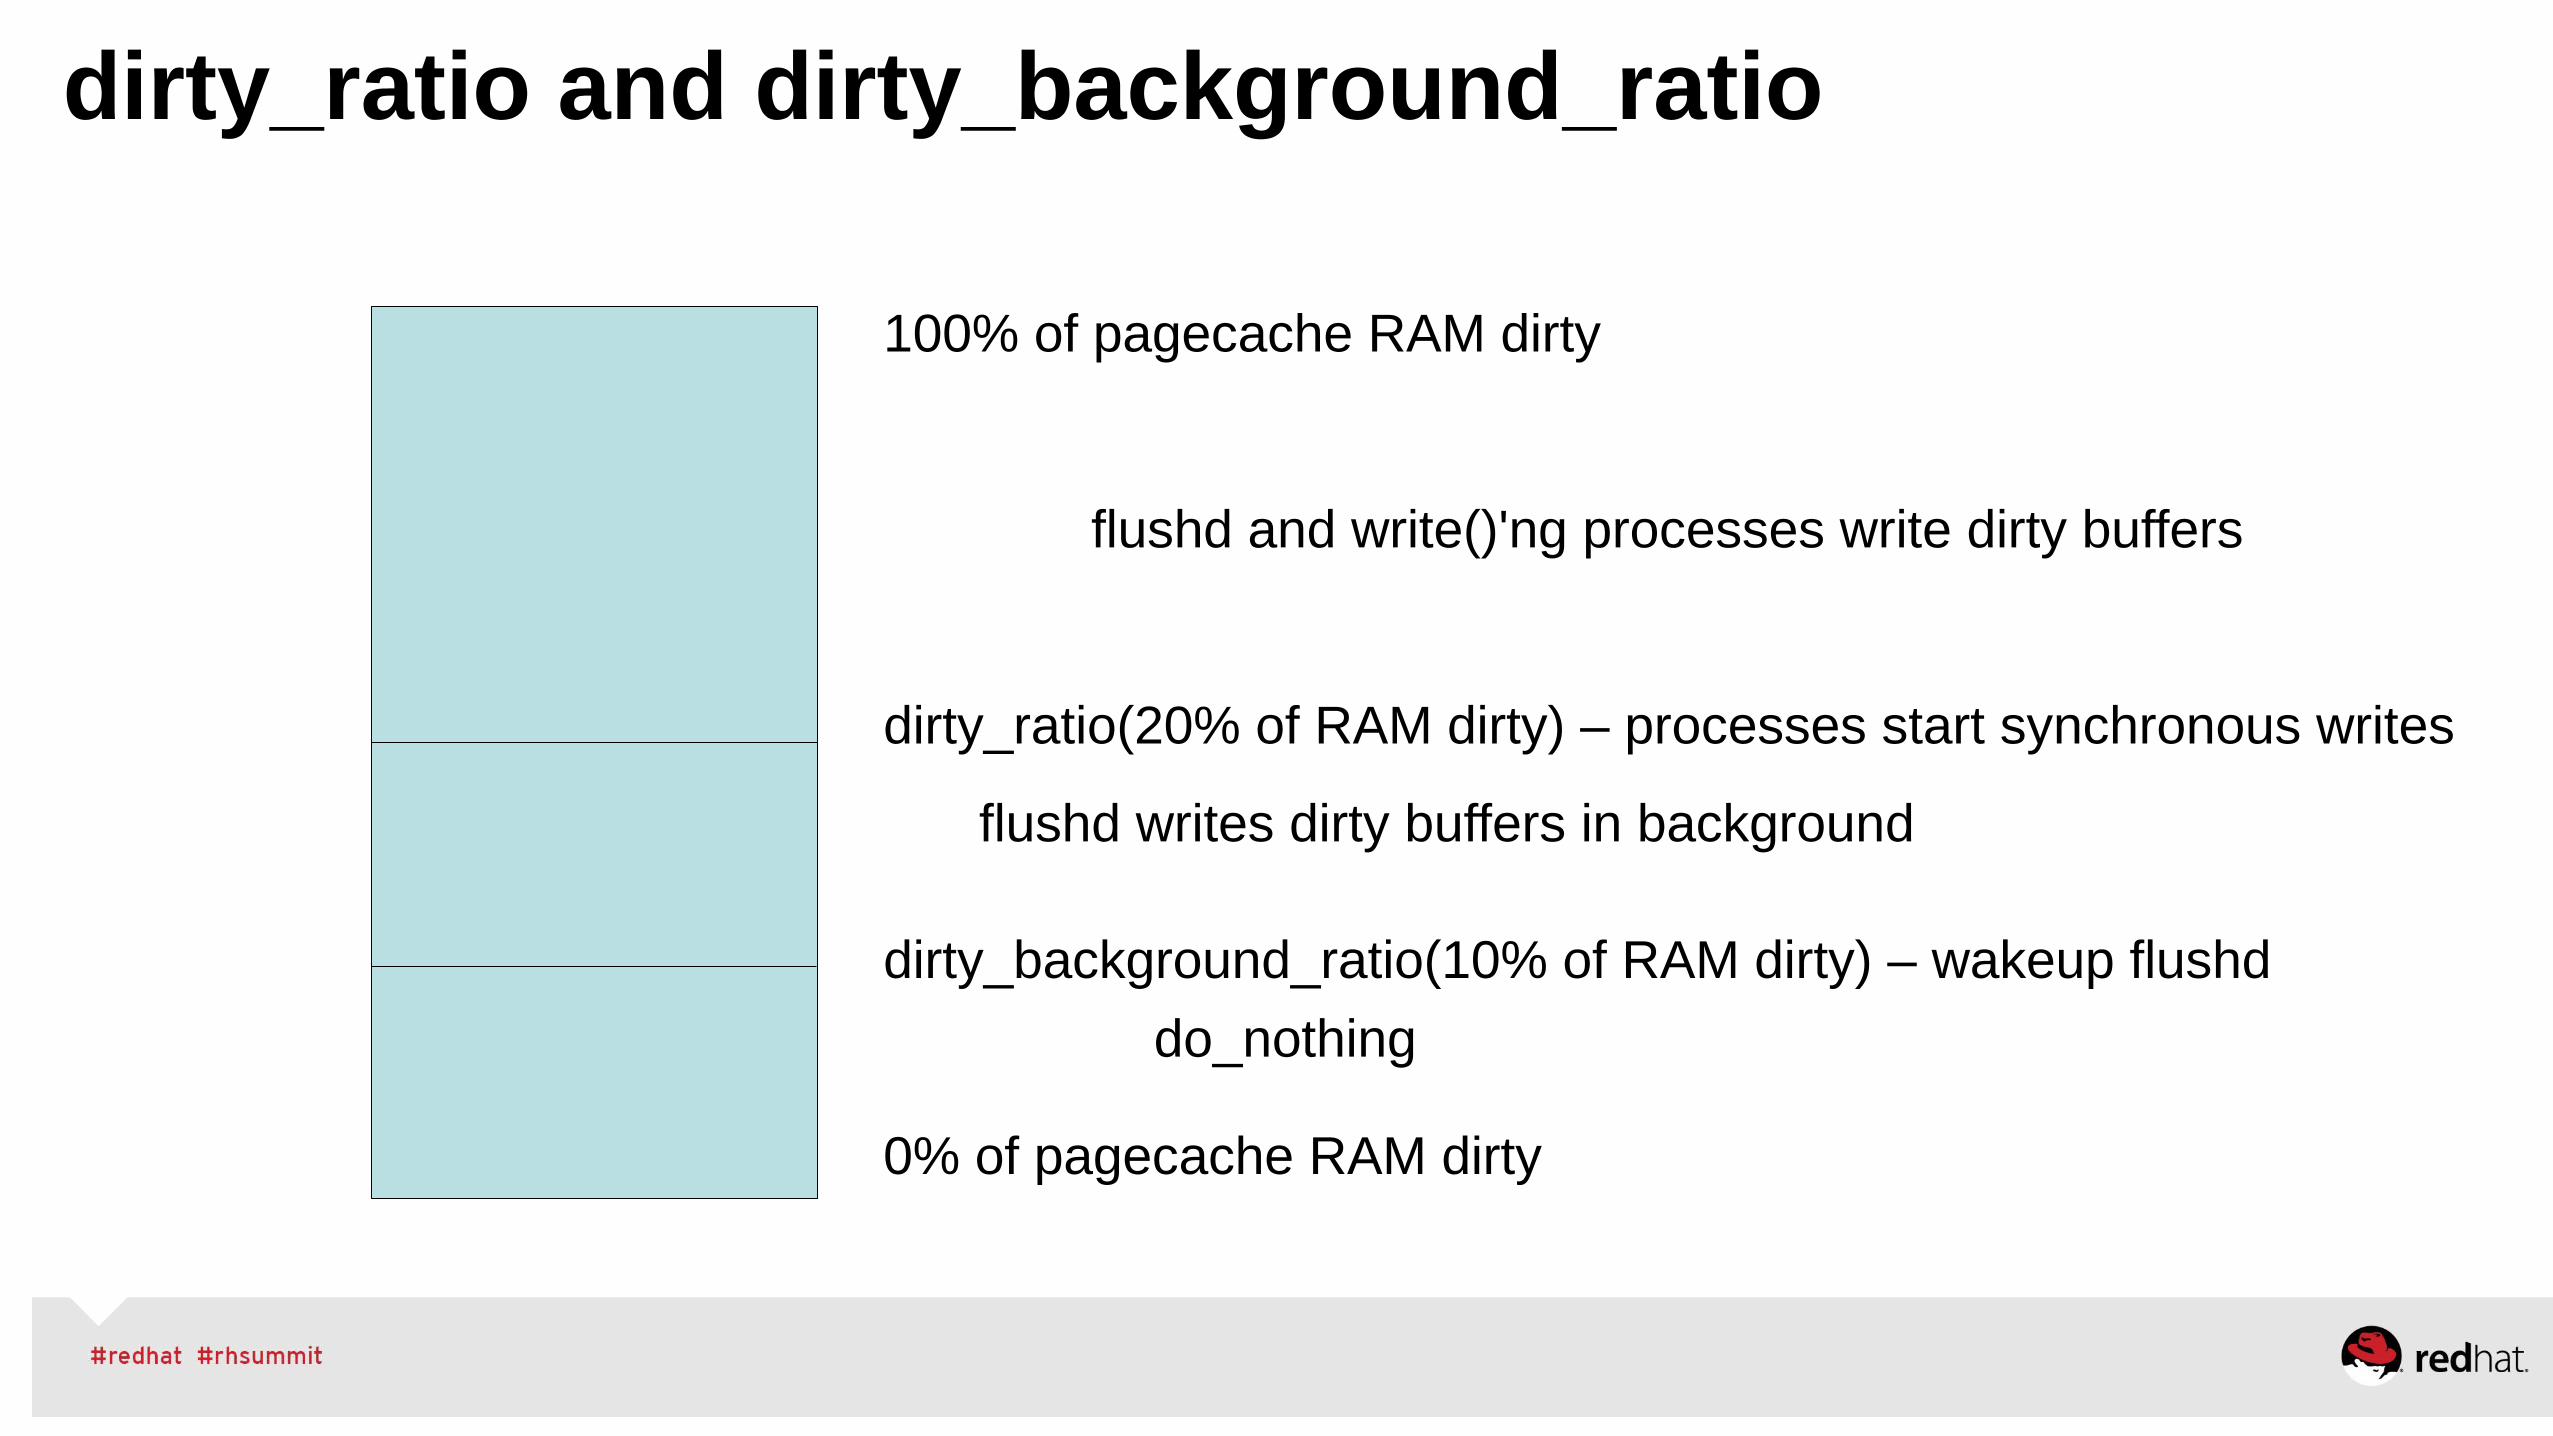
•Manually Tune● NUMA – via numactl, monitor numastat -c pid● Huge Pages – static hugepages for pinned shared-memory● Managing VM, dirty ratio and swappiness tuning● Use cgroups for further resource management control
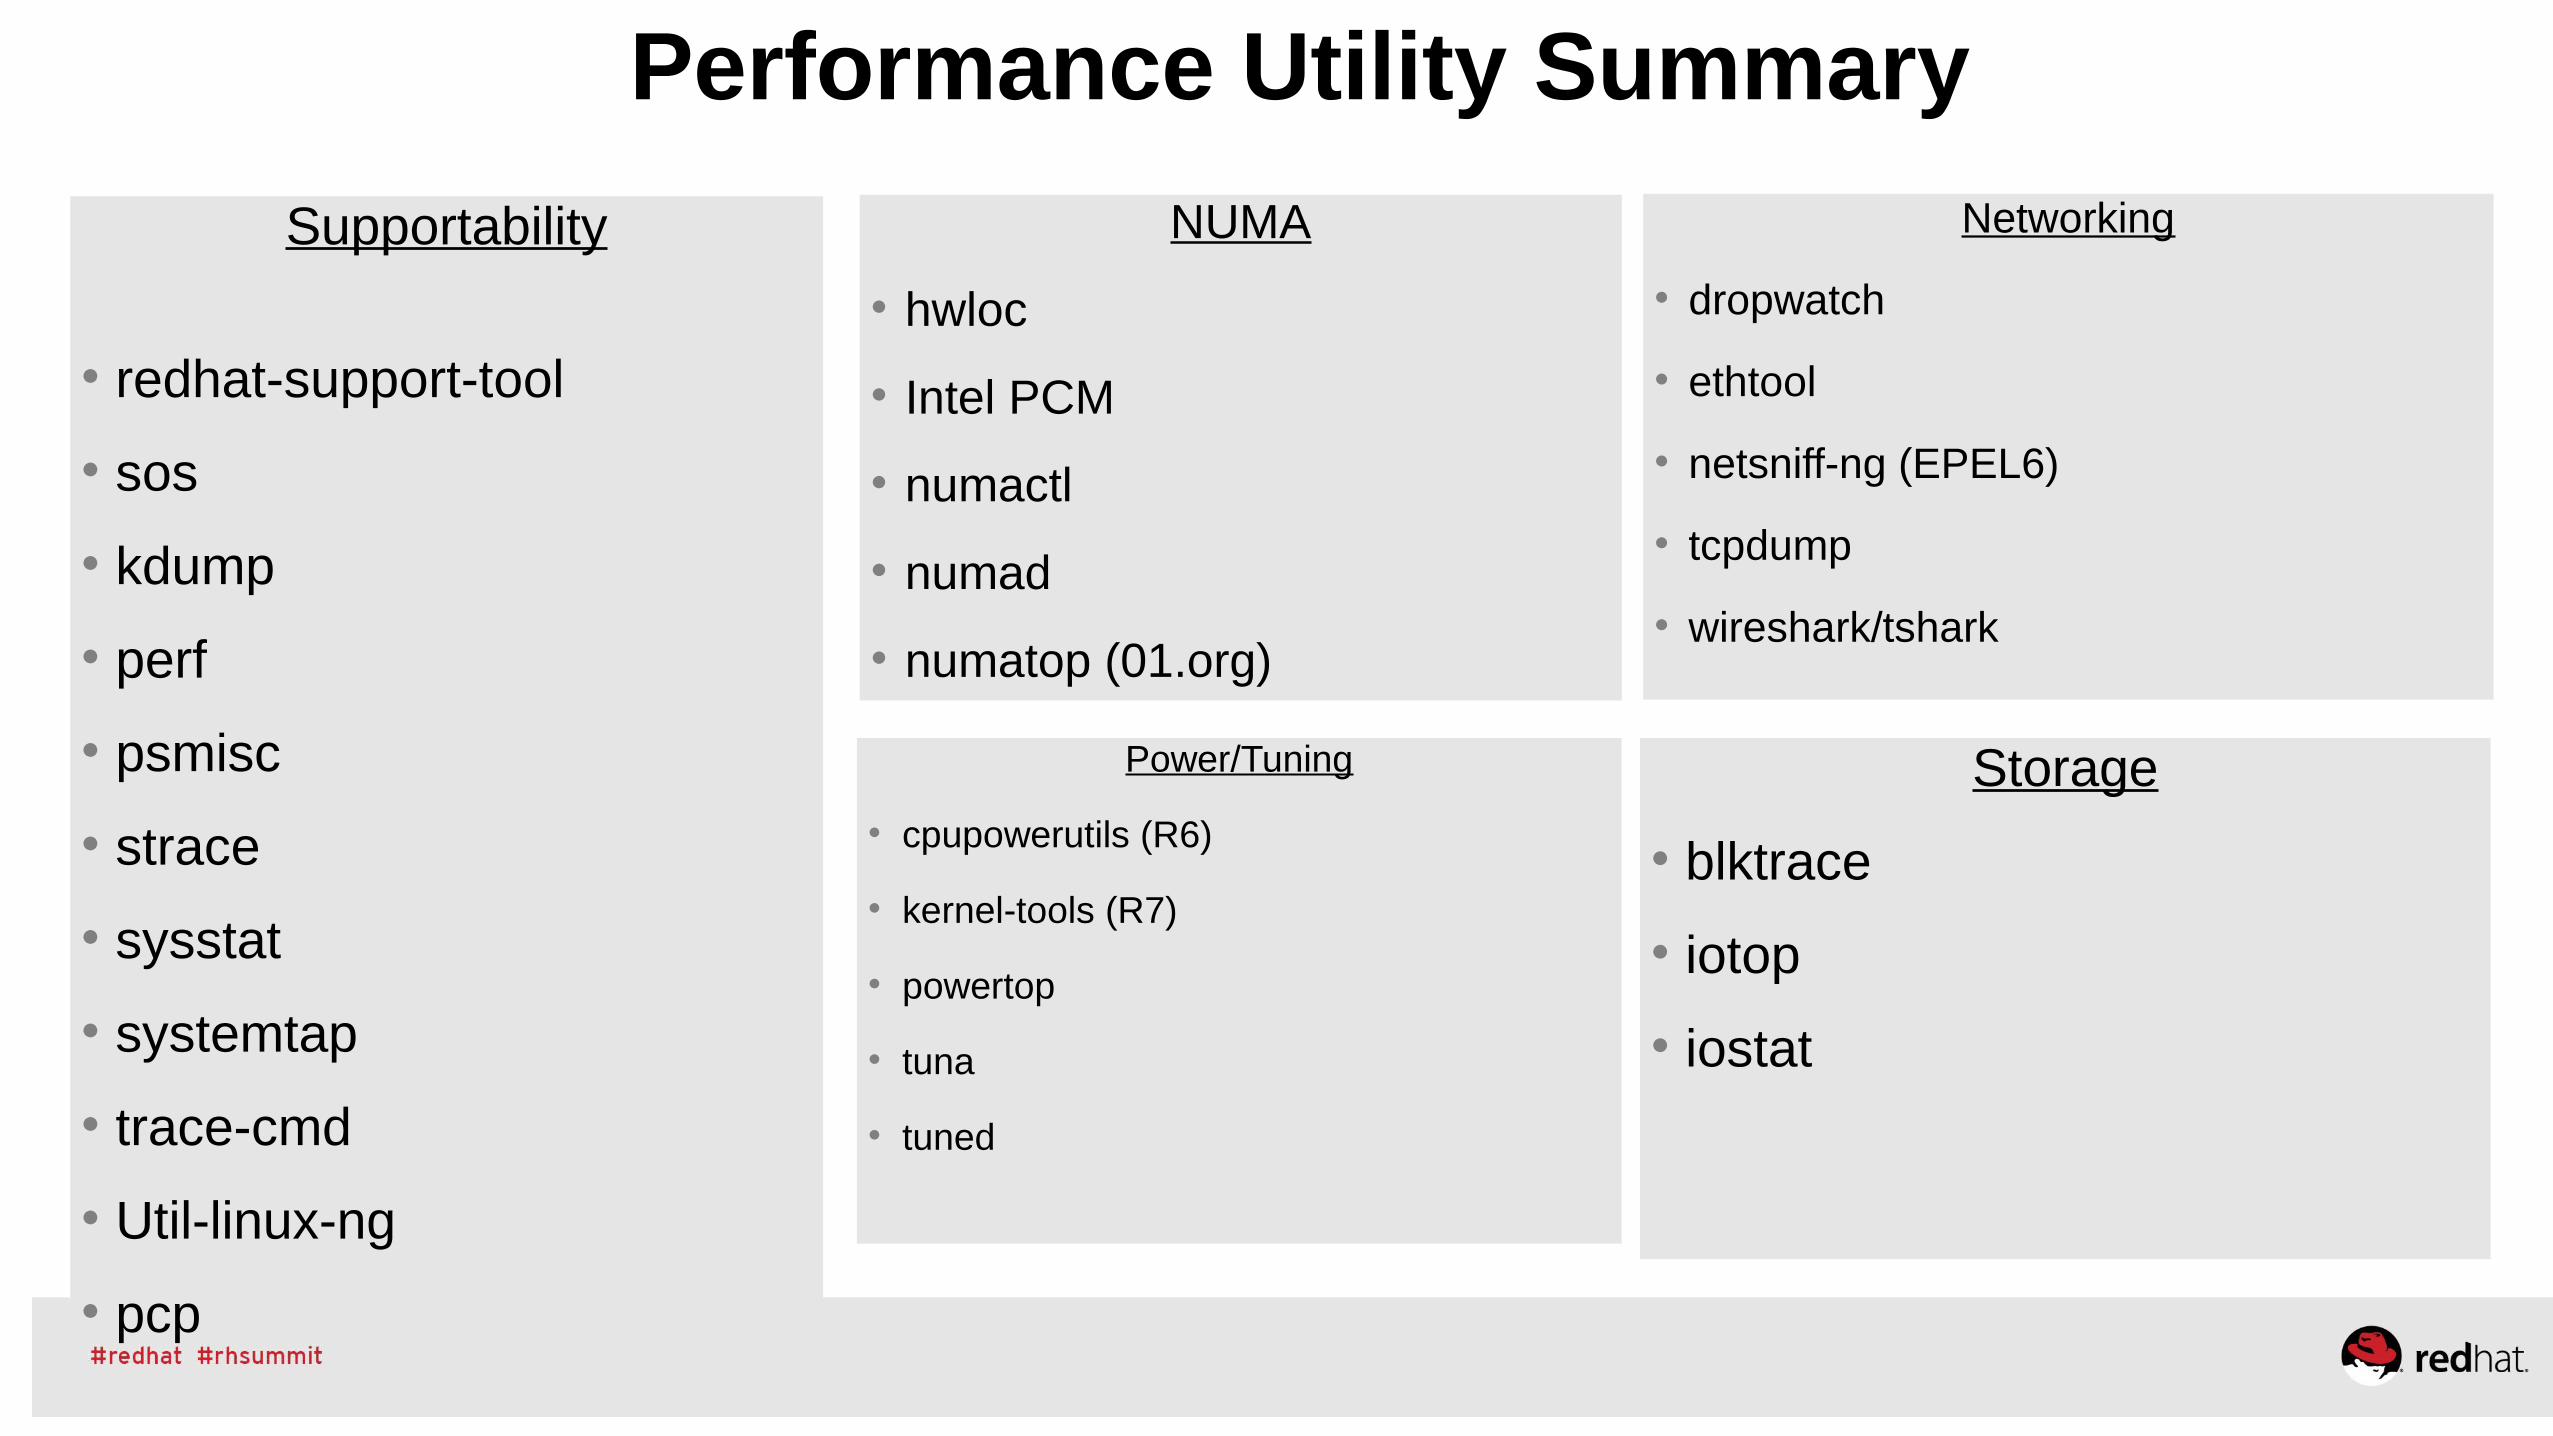
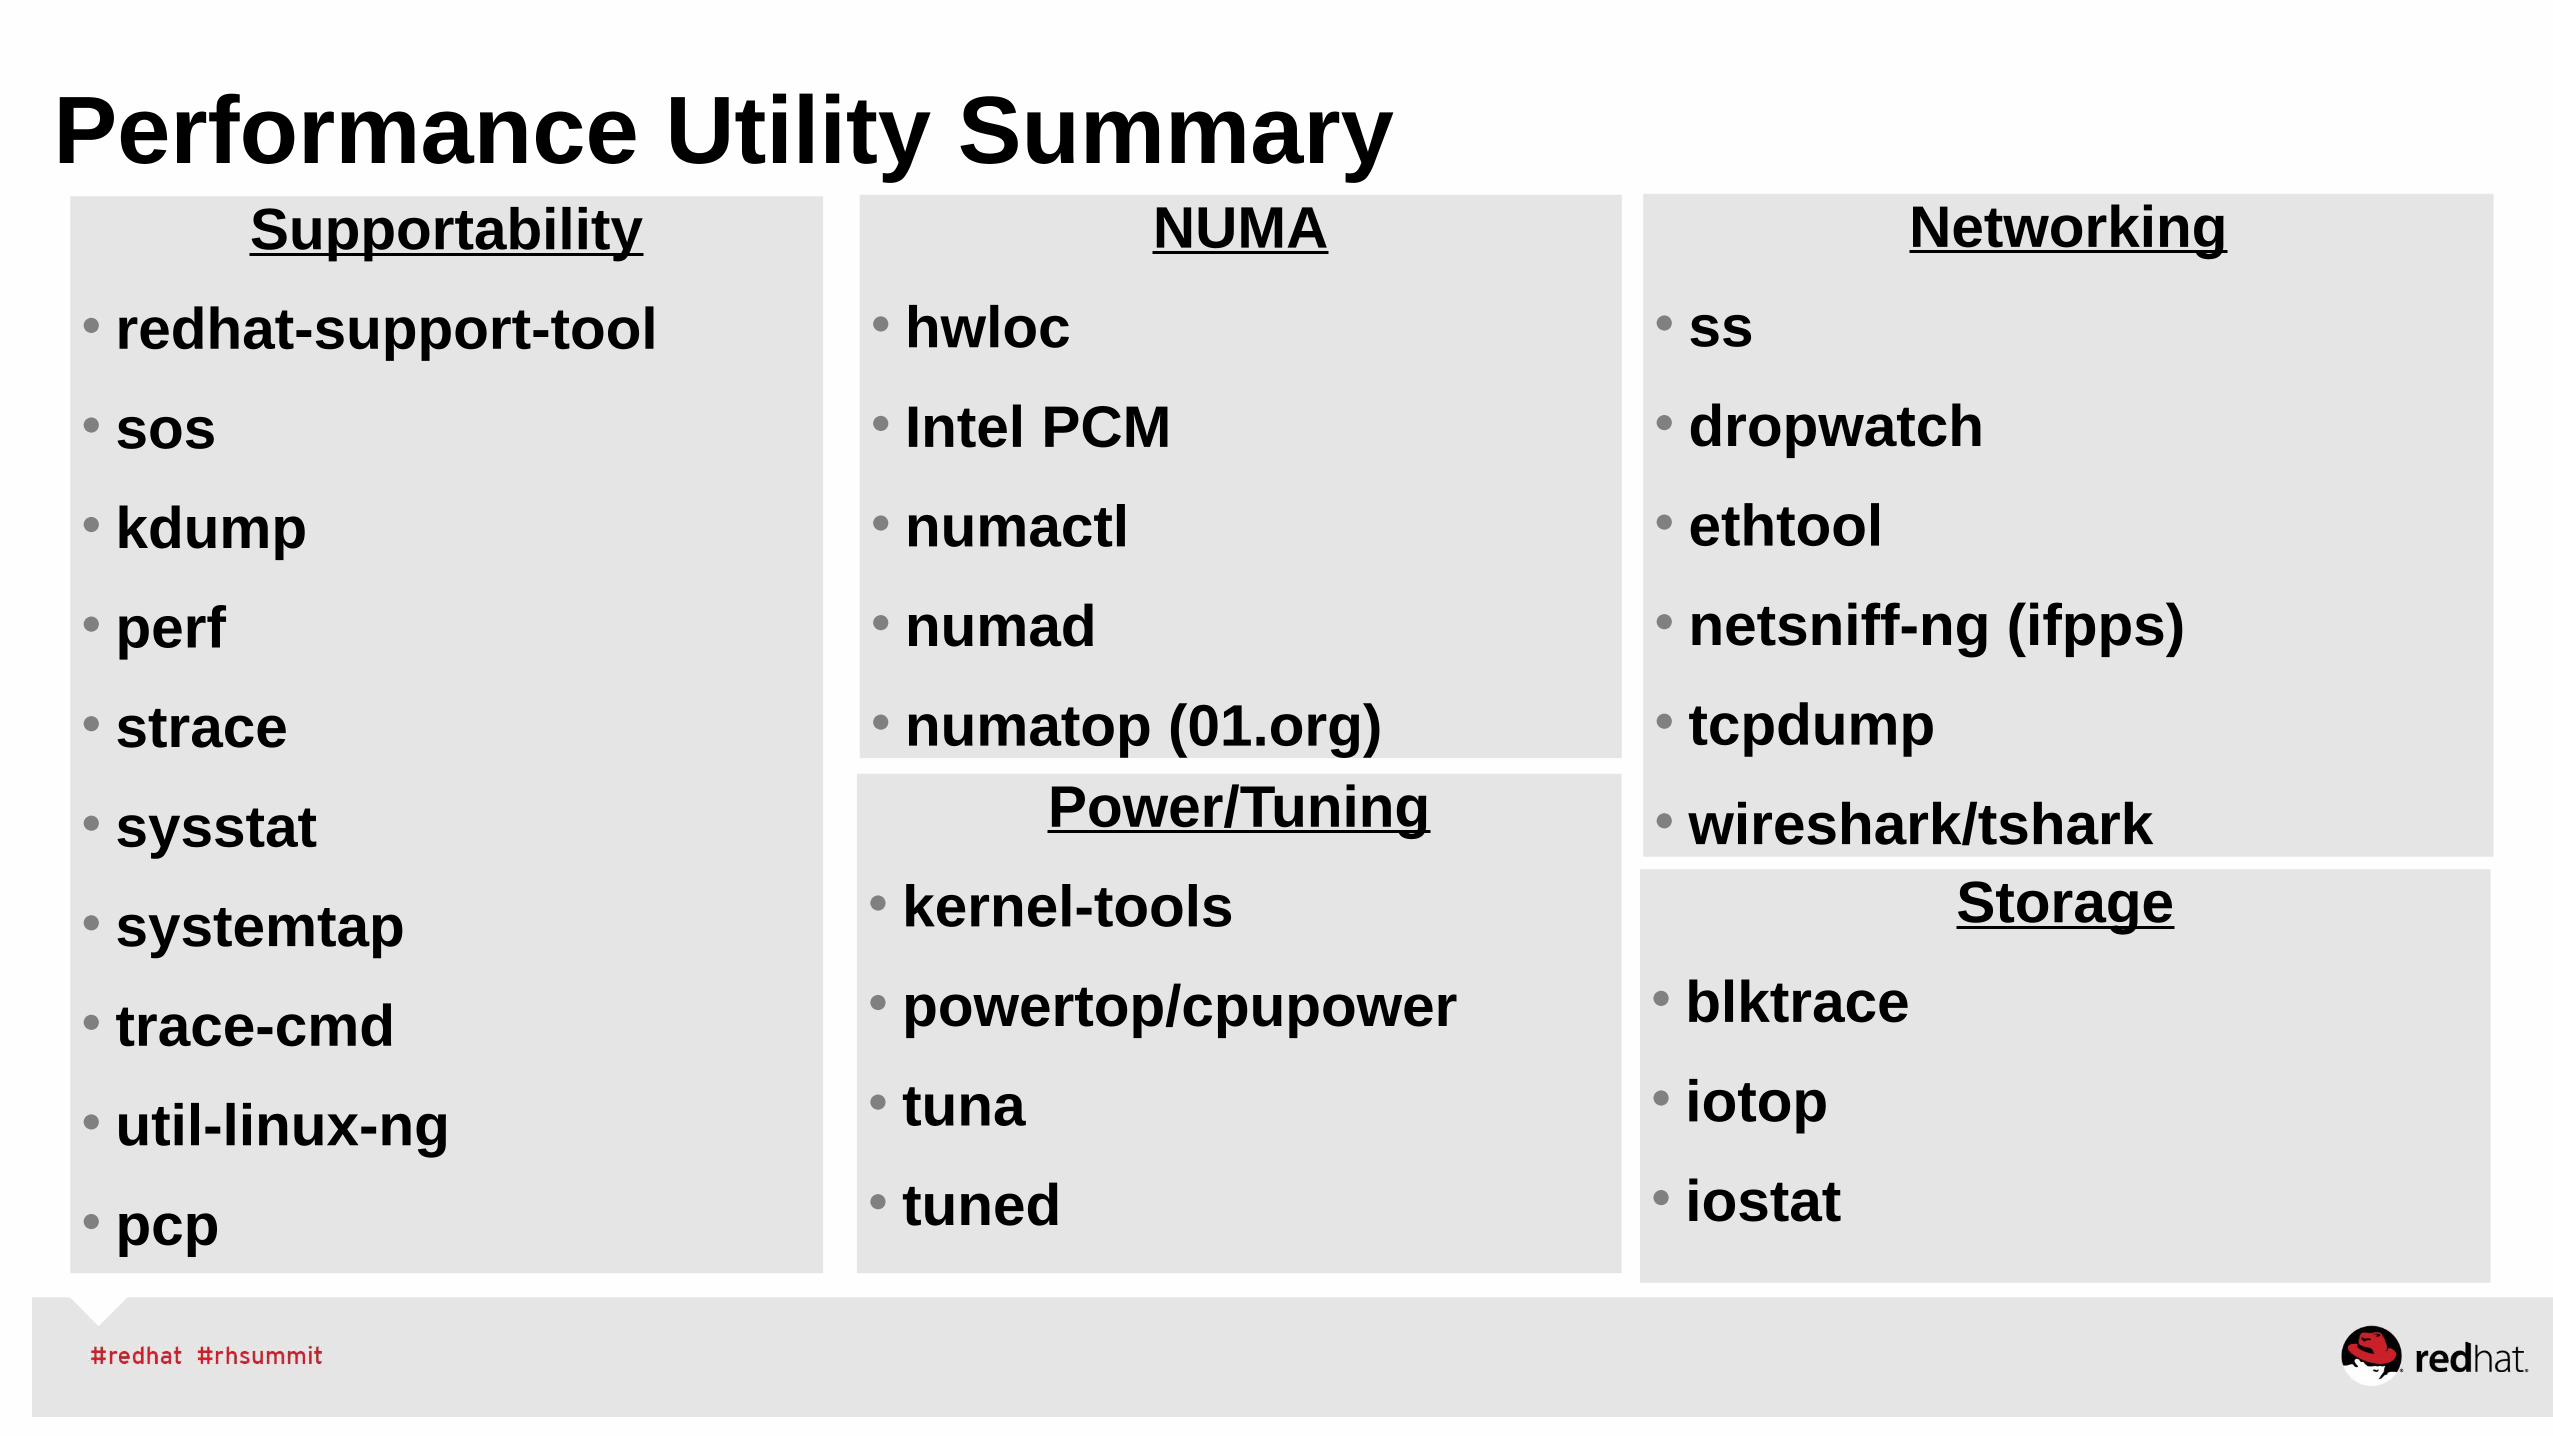
Performance Utility Summary
Supportability
• redhat-support-tool
• sos
• kdump
• perf
• psmisc
• strace
• sysstat
• systemtap
• trace-cmd
• Util-linux-ng
• pcp
NUMA
• hwloc
• Intel PCM
• numactl
• numad
• numatop (01.org)
Power/Tuning
• cpupowerutils (R6)
• kernel-tools (R7)
• powertop
• tuna
• tuned
Networking
• dropwatch
• ethtool
• netsniff-ng (EPEL6)
• tcpdump
• wireshark/tshark
Storage
• blktrace
• iotop
• iostat
Performance Analysis and Tuning – Part 2
D. John Shakshober (Shak) - Sr Consulting Eng / Director Performance Engineering
Larry Woodman - Senior Consulting Engineer / Kernel VM
Jeremy Eder - Principal Performance Engineering
Bill Gray - Principal Performance Engineer
Agenda: Performance Analysis Tuning Part II
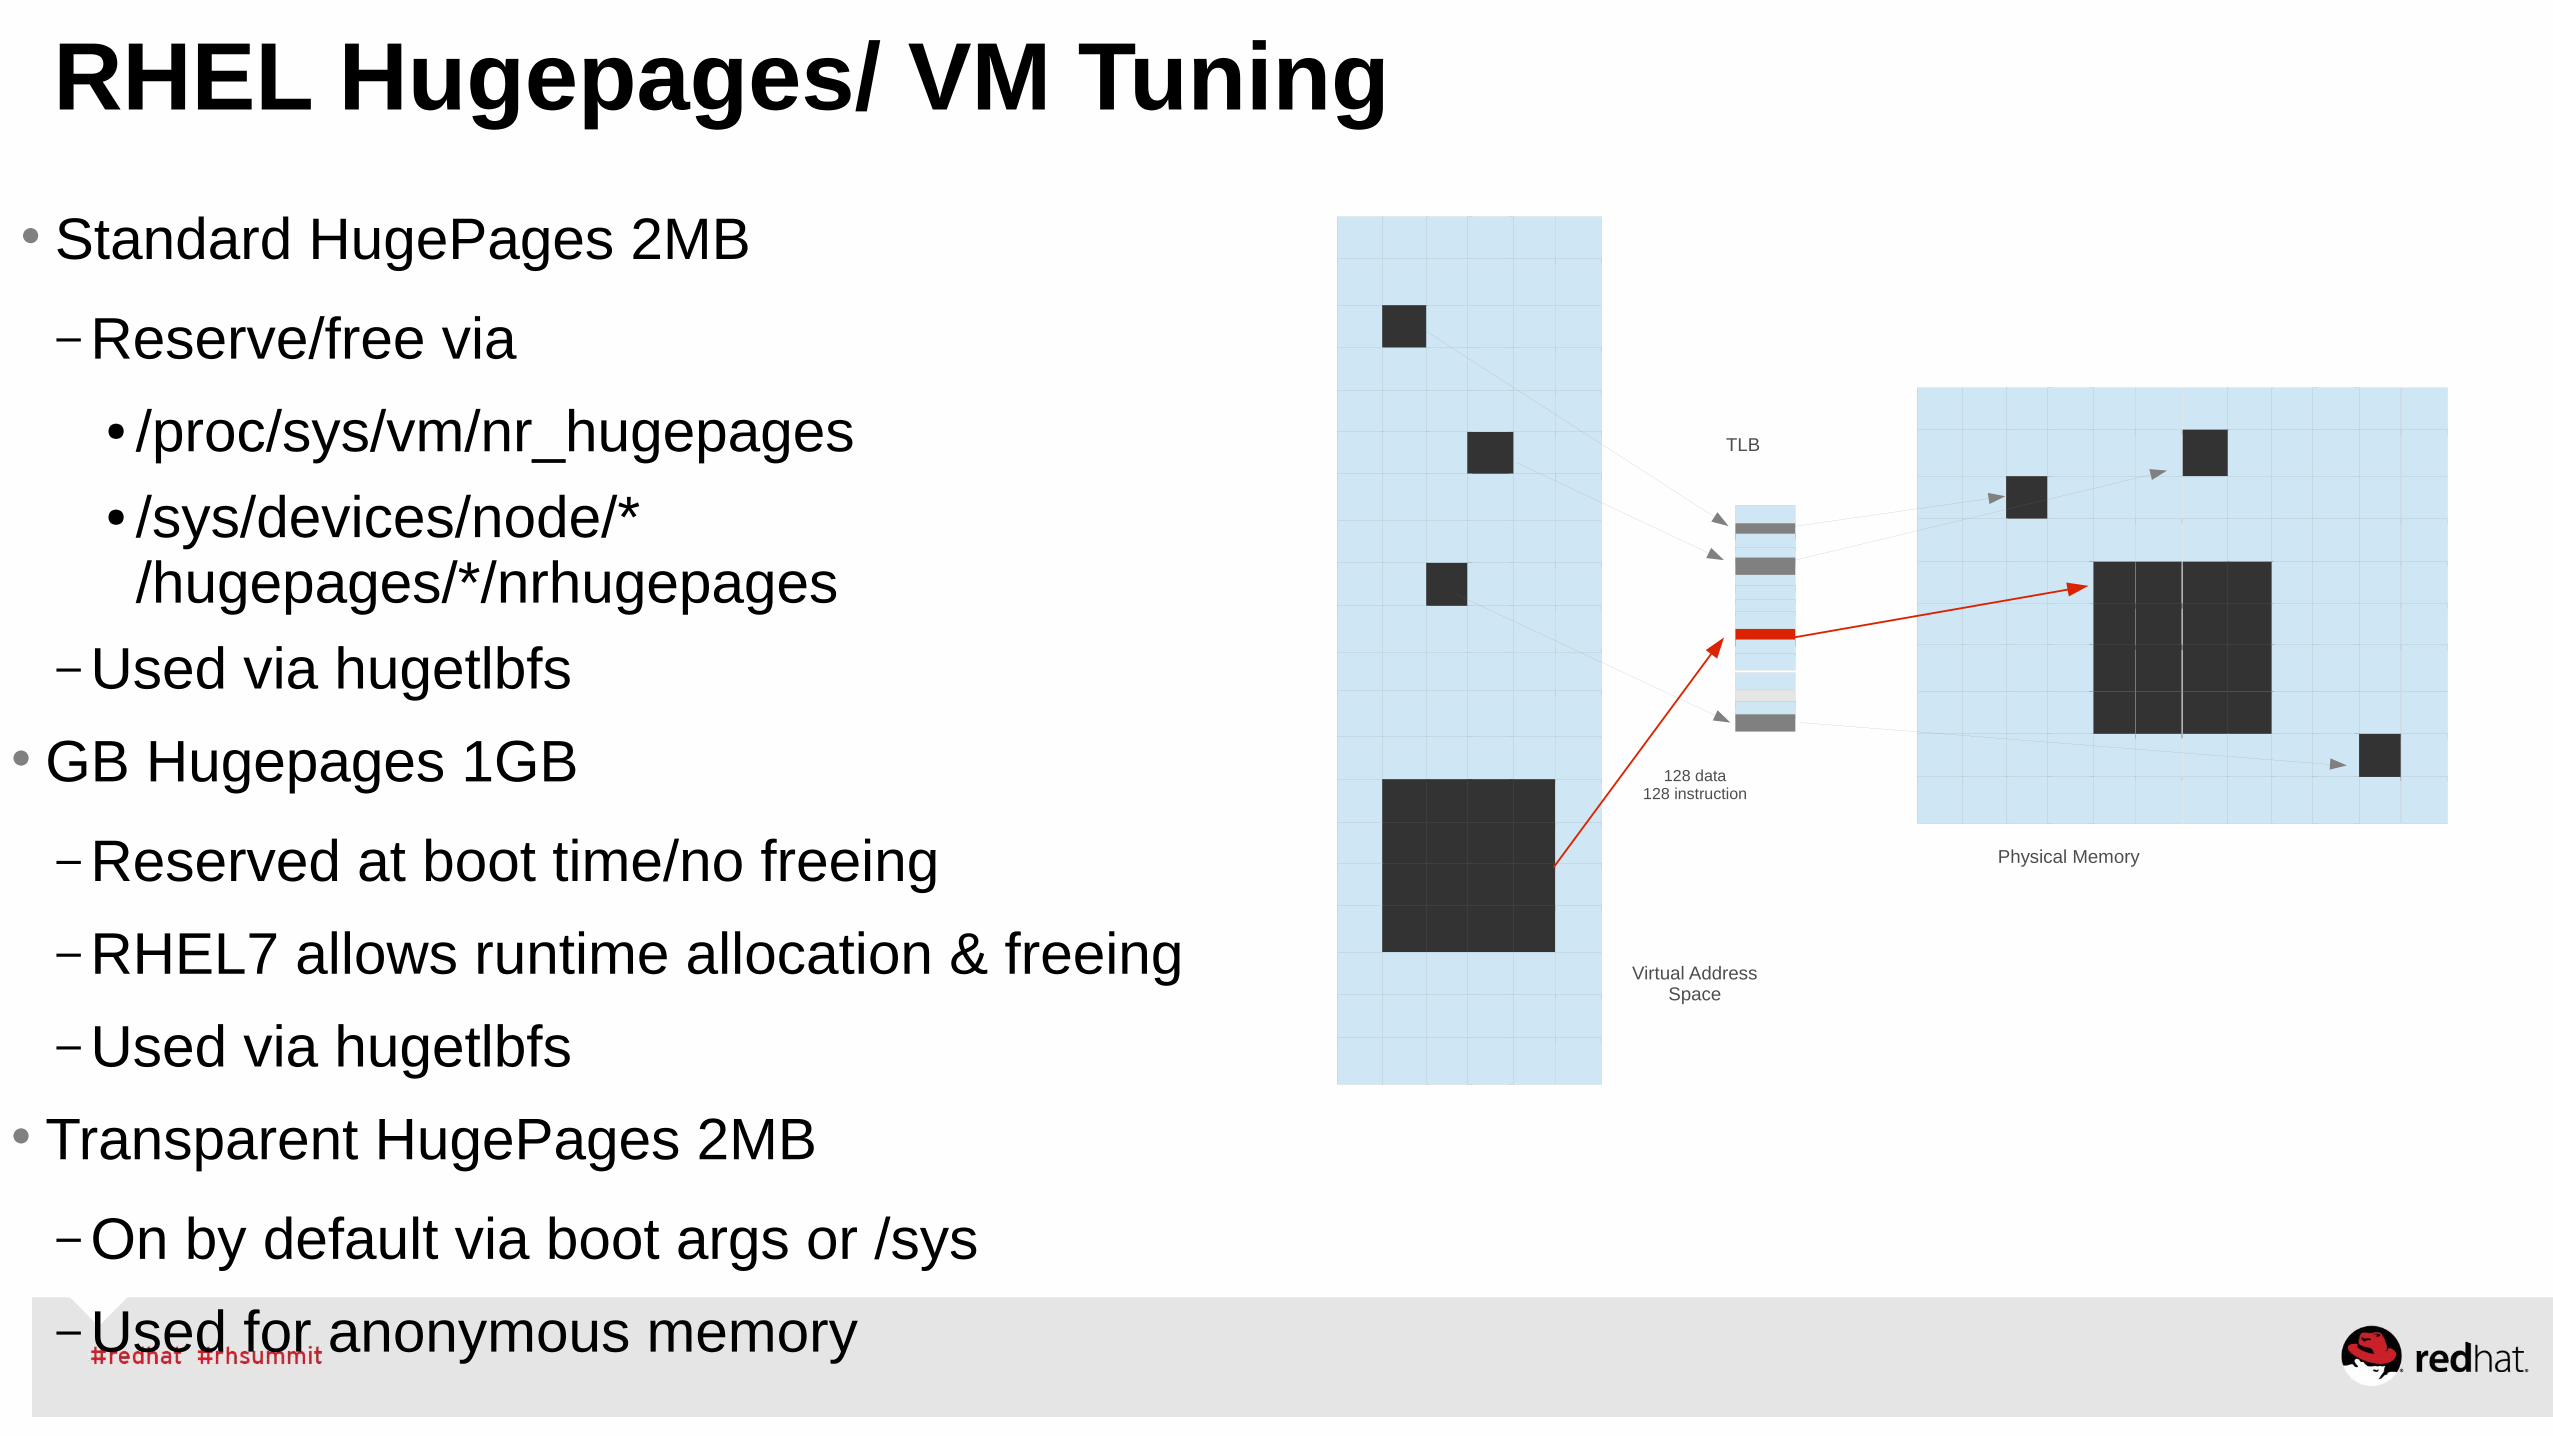
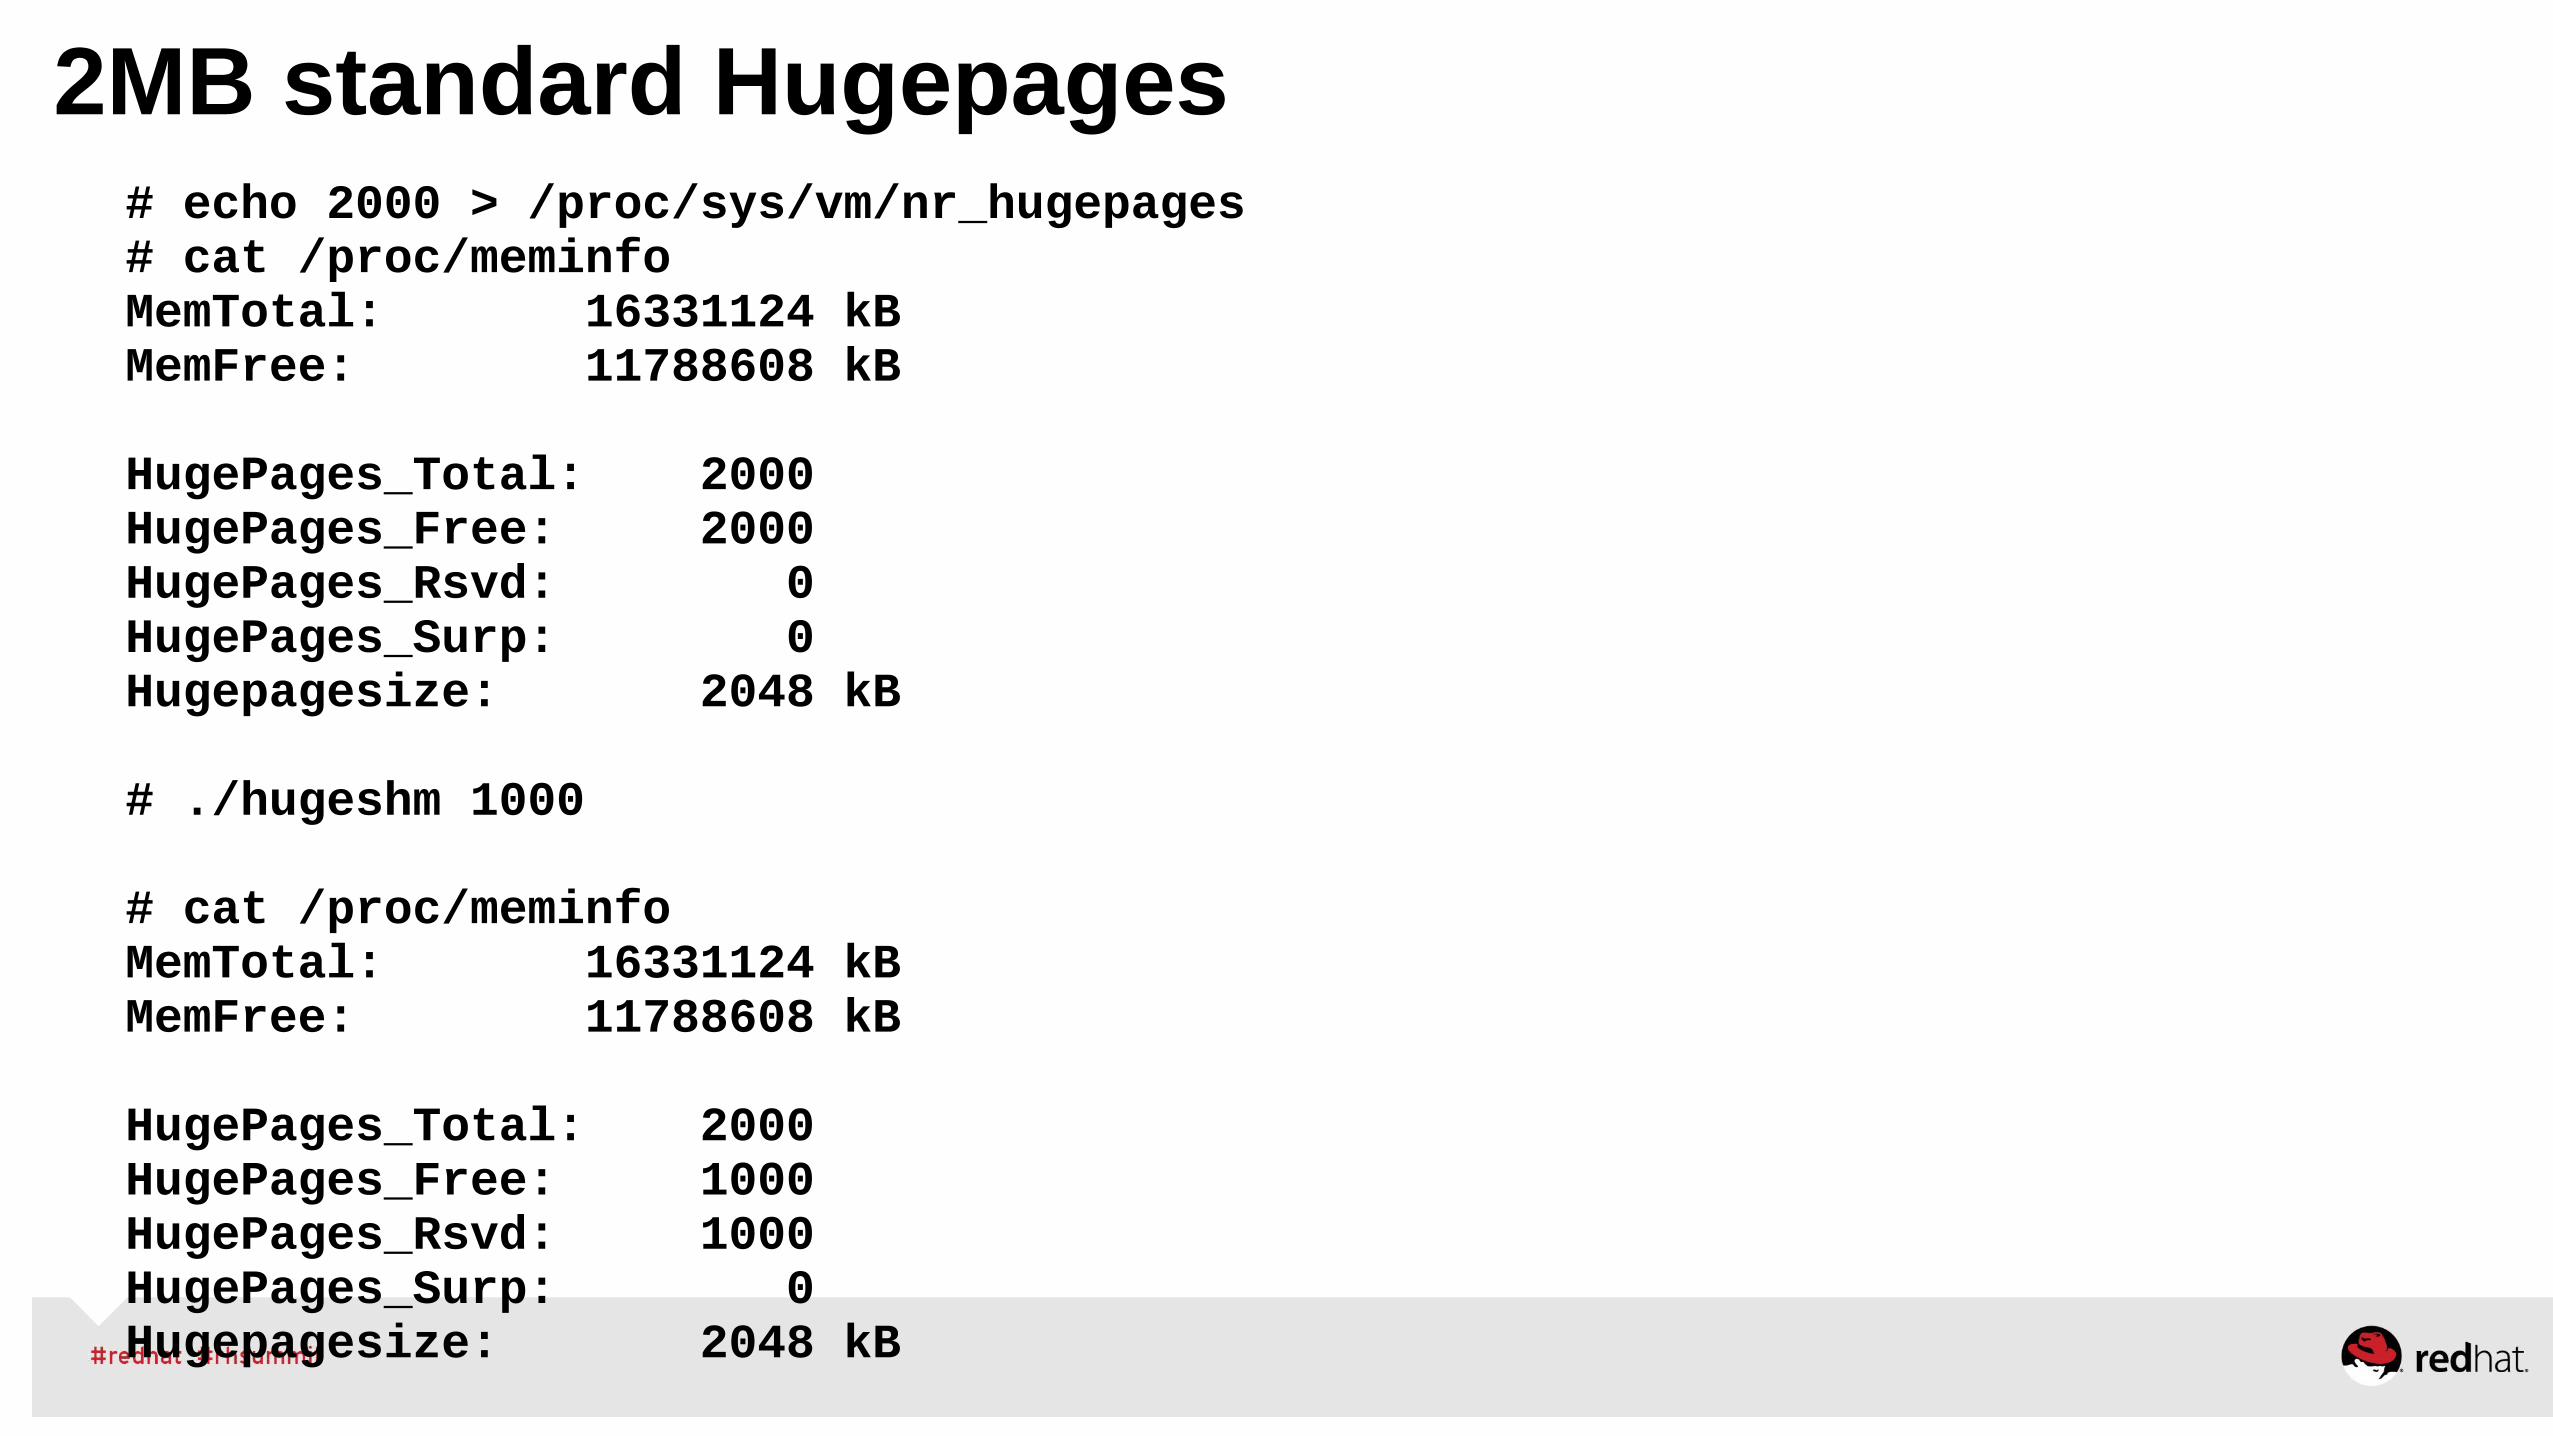
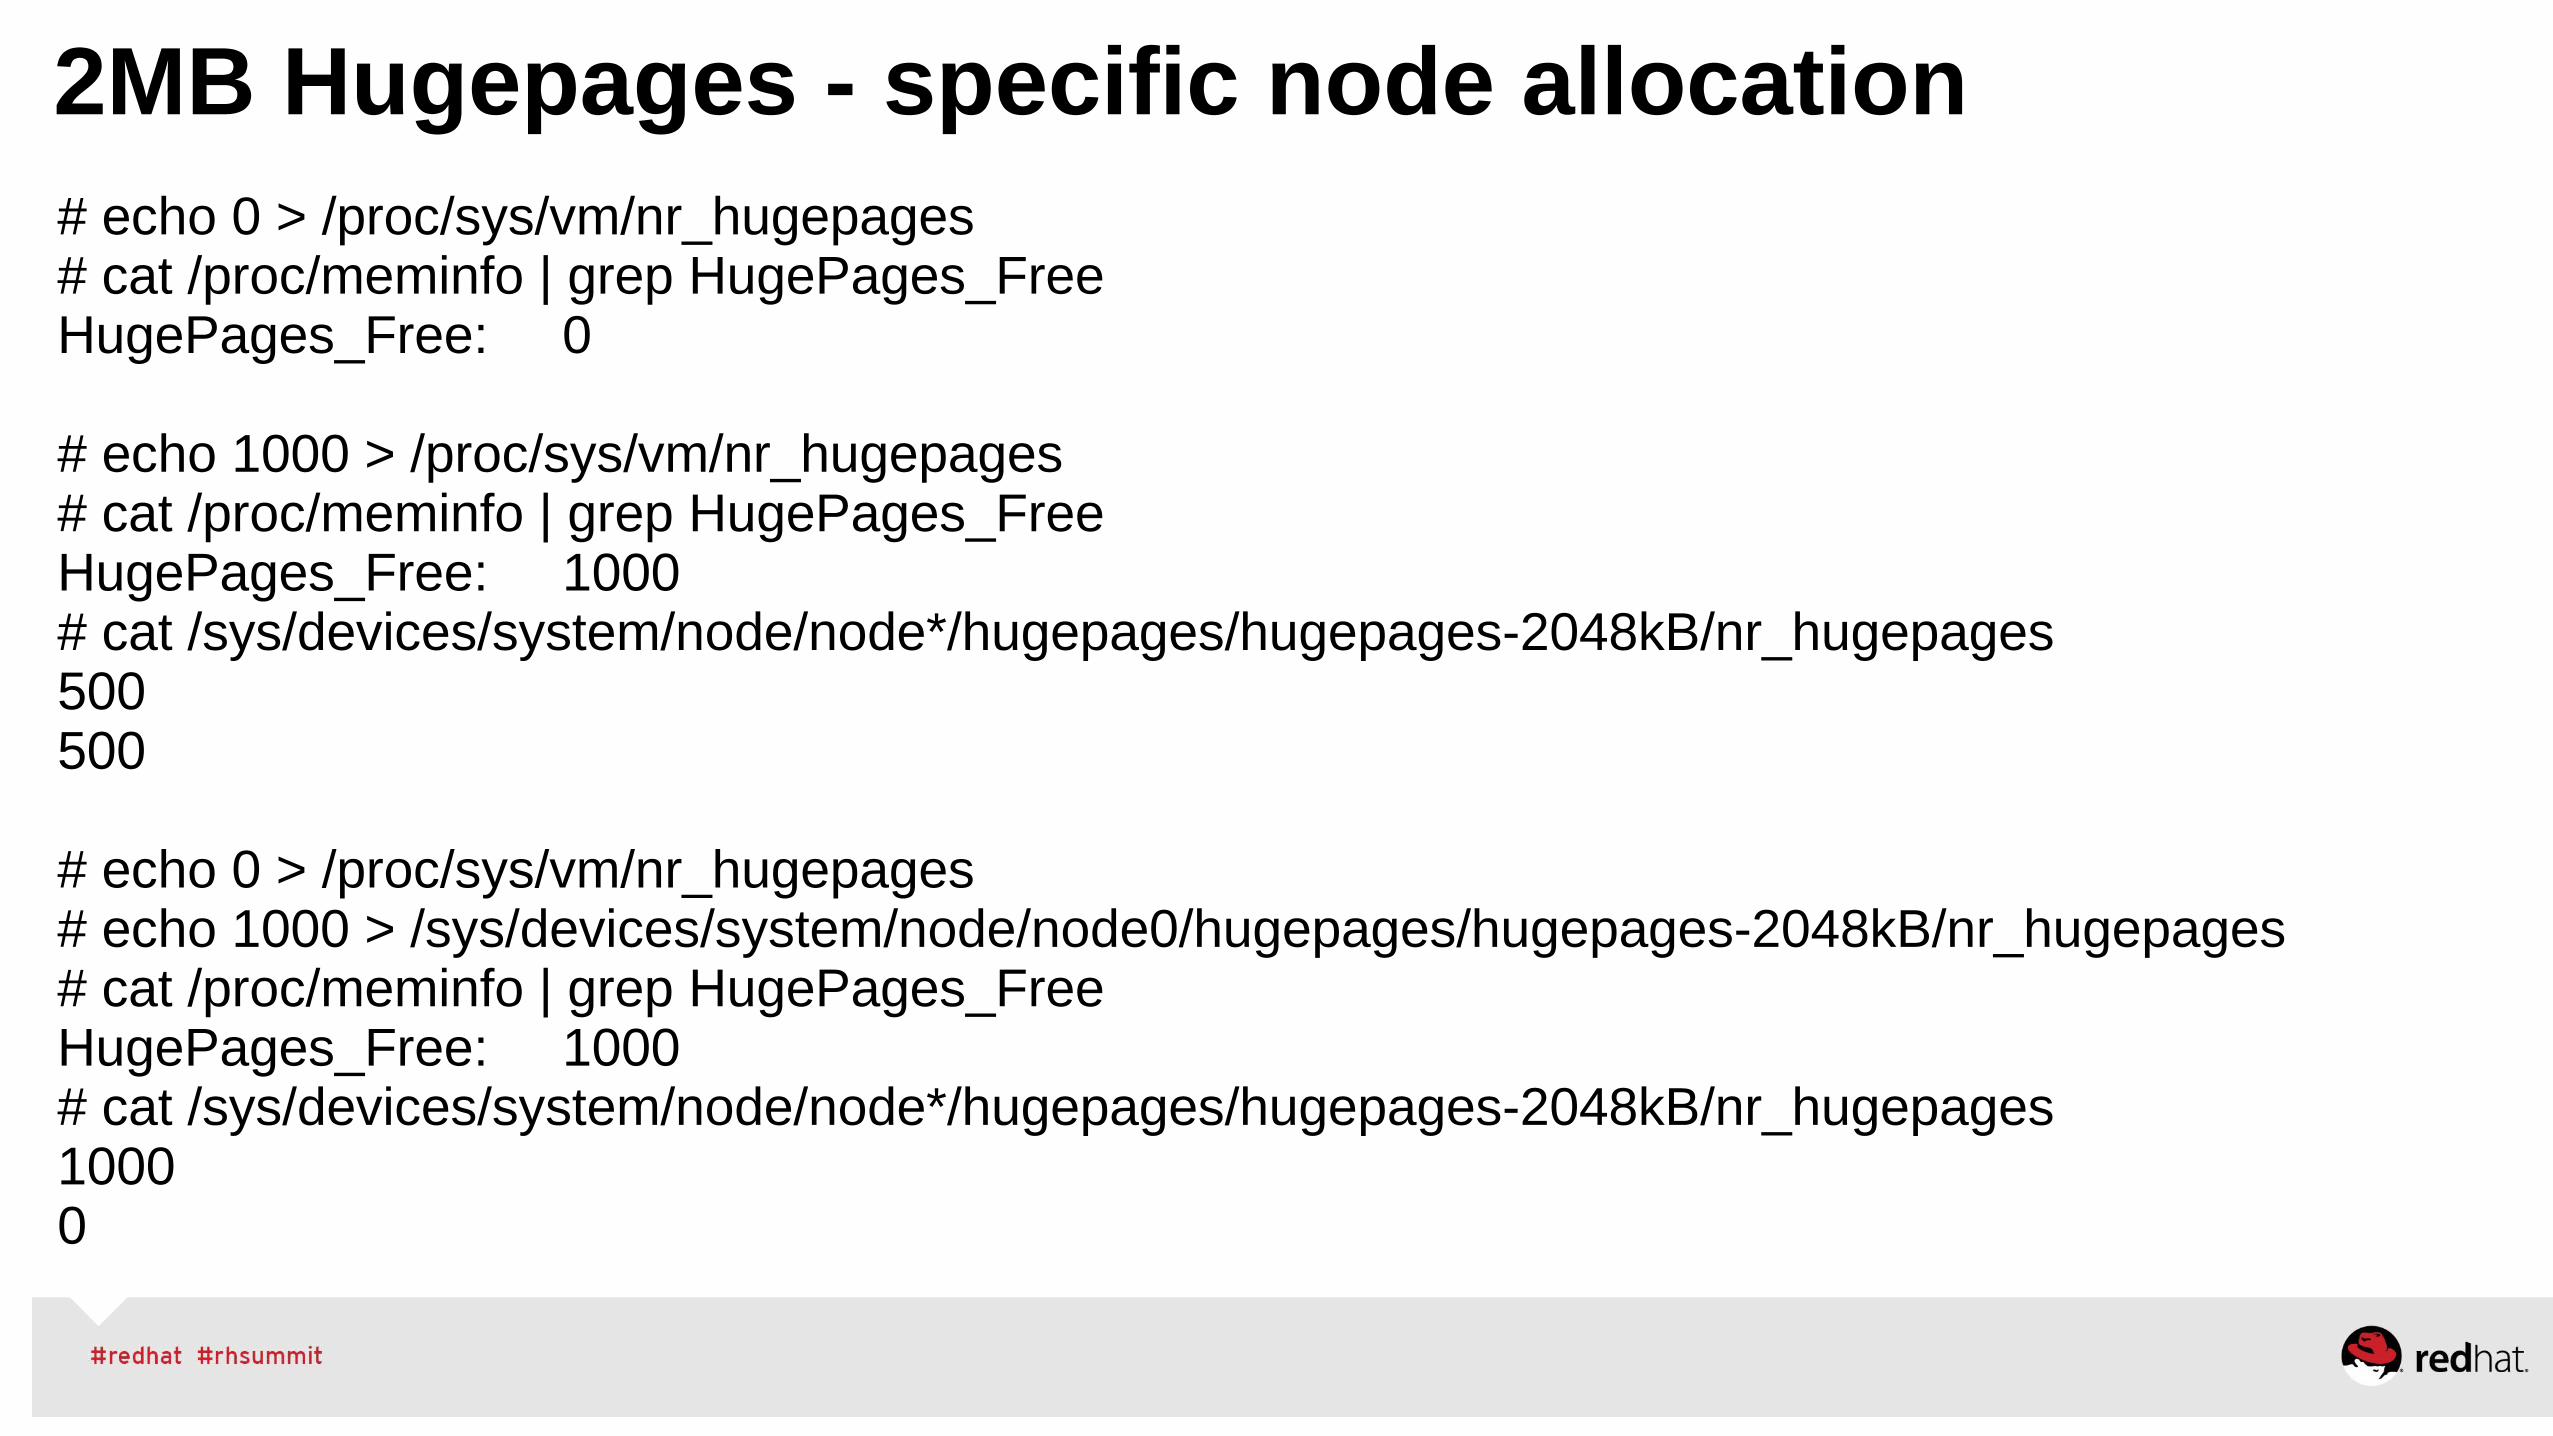
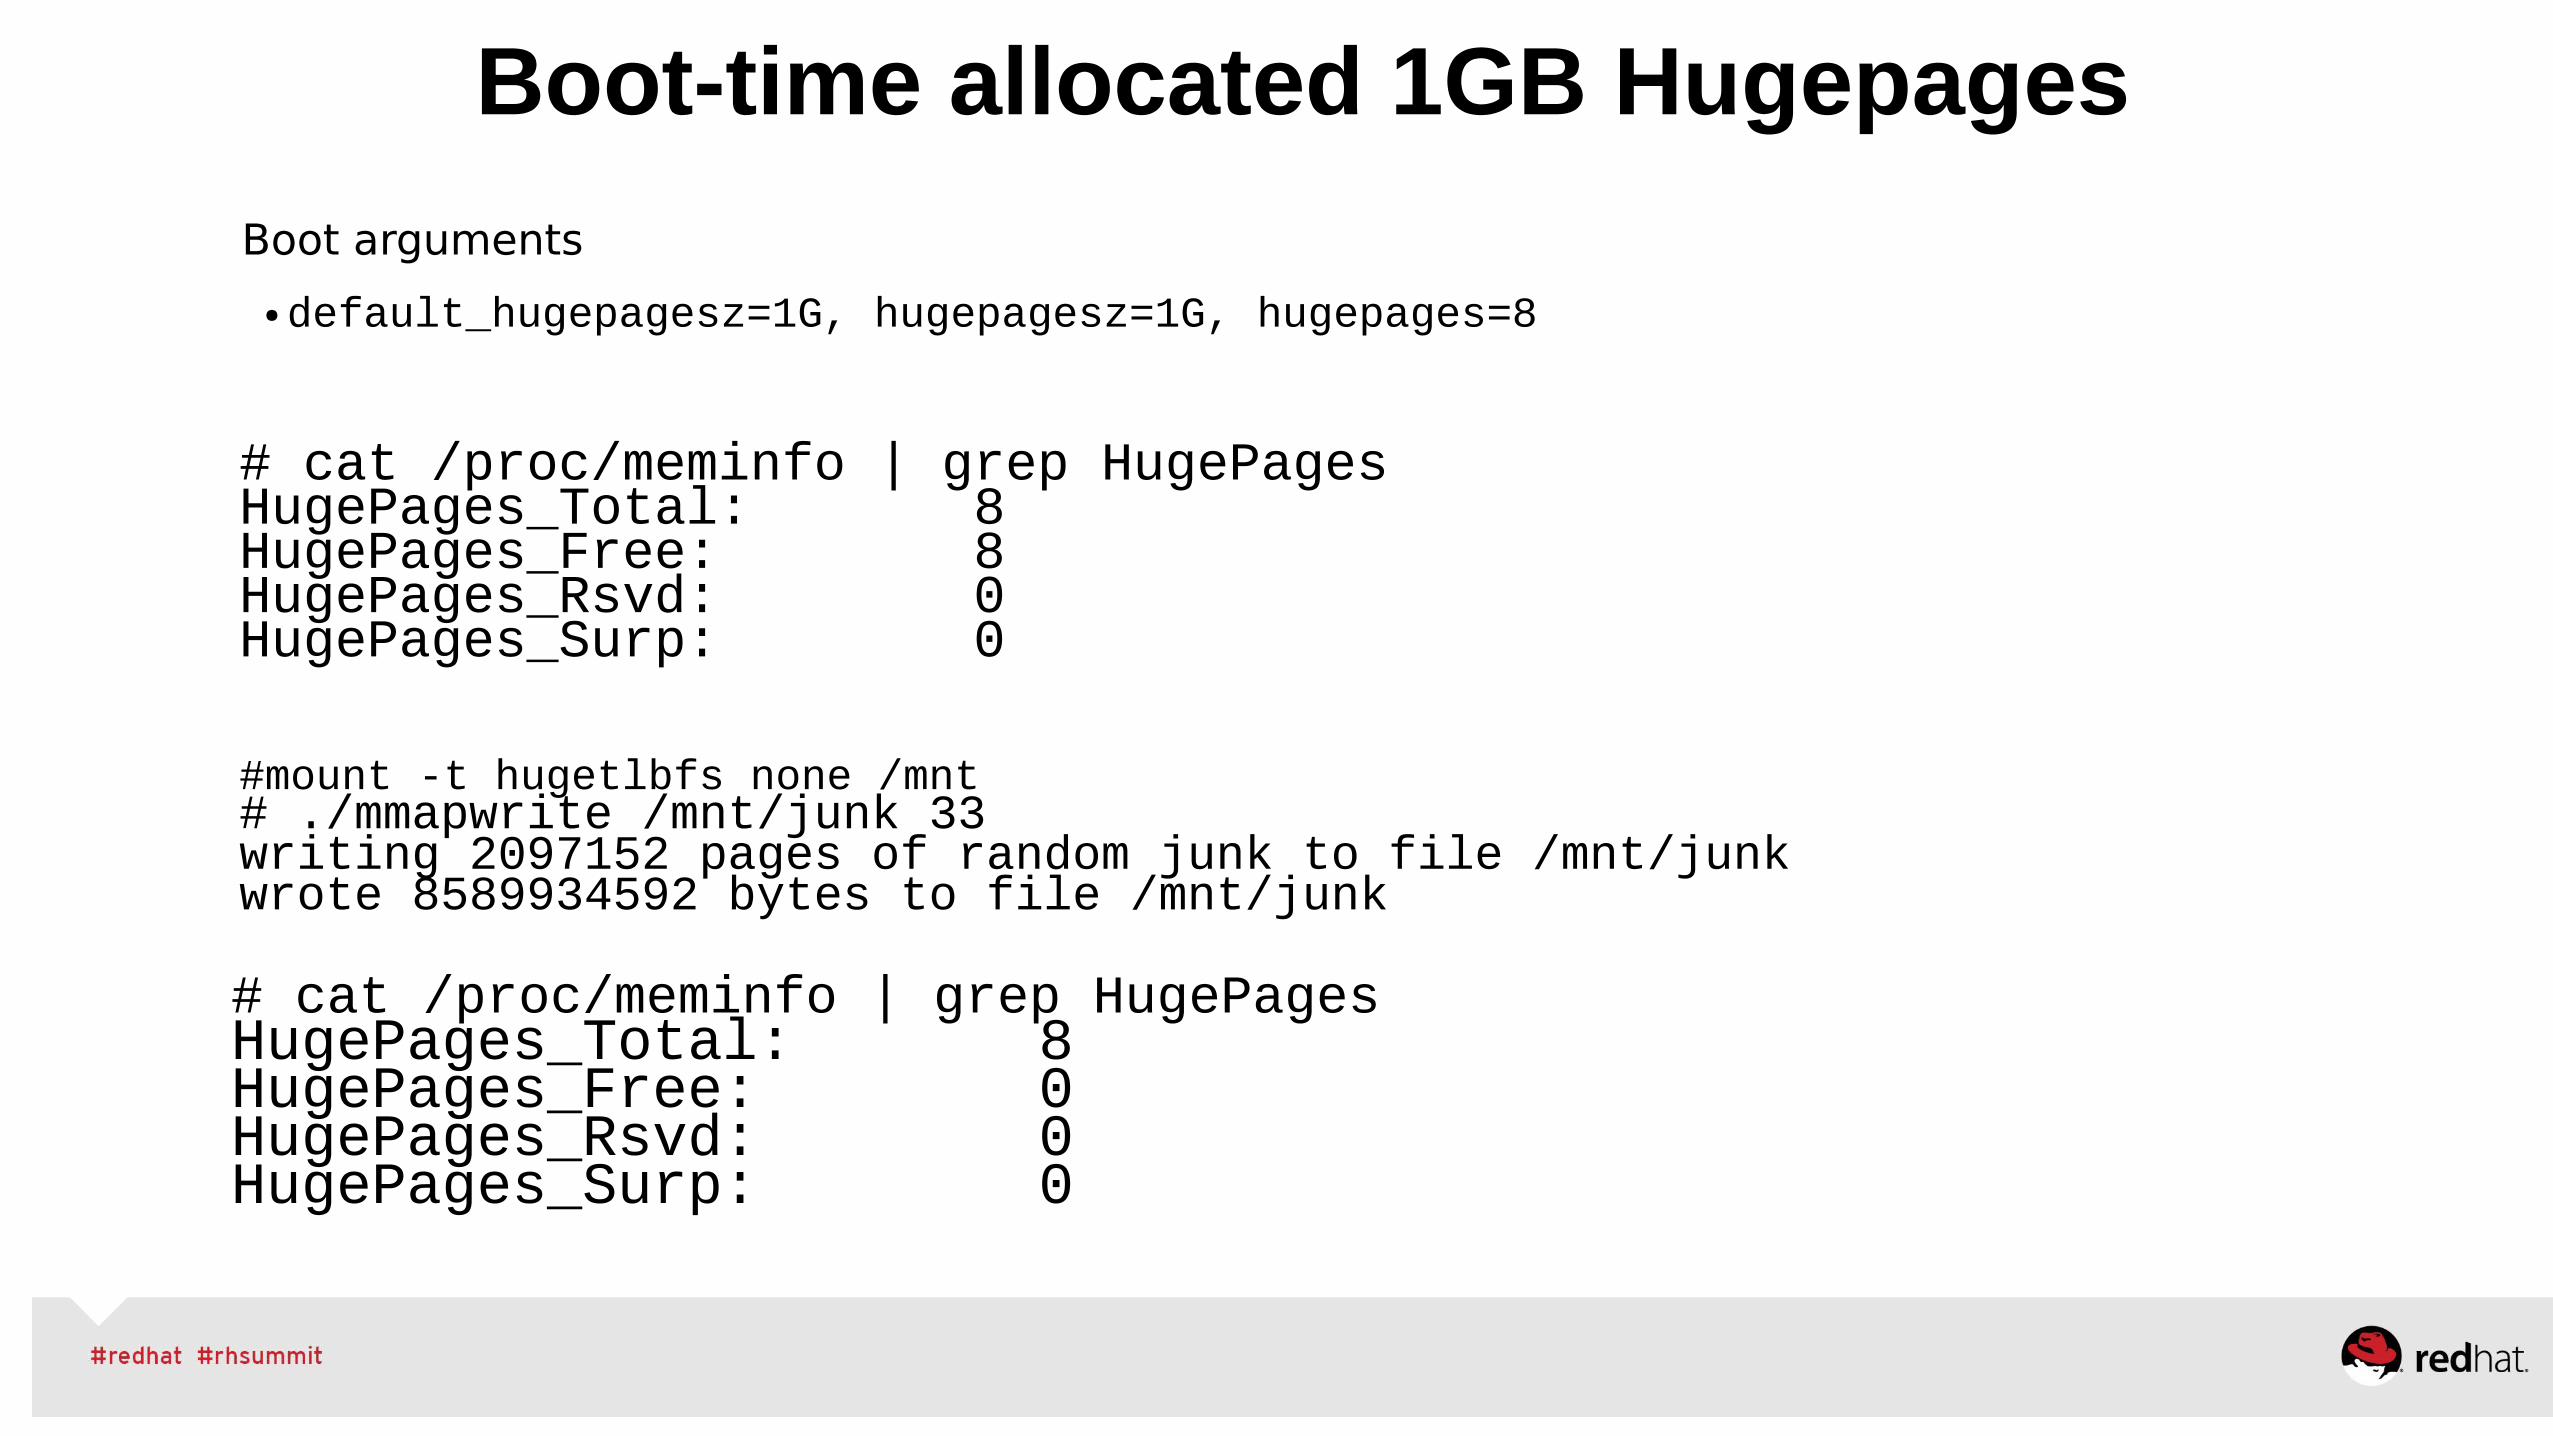
● Part I – RHEL Evolution 5->6->7 – out-of-the-box tuned for Clouds - “tuned”– NonUniform Memory Access (NUMA) – Cgroups – the basis of Linux Containers / Atomic– Process Scheduler, Numa awareness, tunables – Transparent Hugepages, Static Hugepages 4K/2MB/1GB
● Part II– RHEL Atomic / Platform, Tuning Optimized for Enterprise – Network Performance and Latency-performance, Real Time– Disk and Filesystem IO - Throughput-performance– Cloud Performance Topics OpenShift, OpenStack - NFV
● Performance Birds of the Feather (BoF) Wed 6-8 Room 206
74
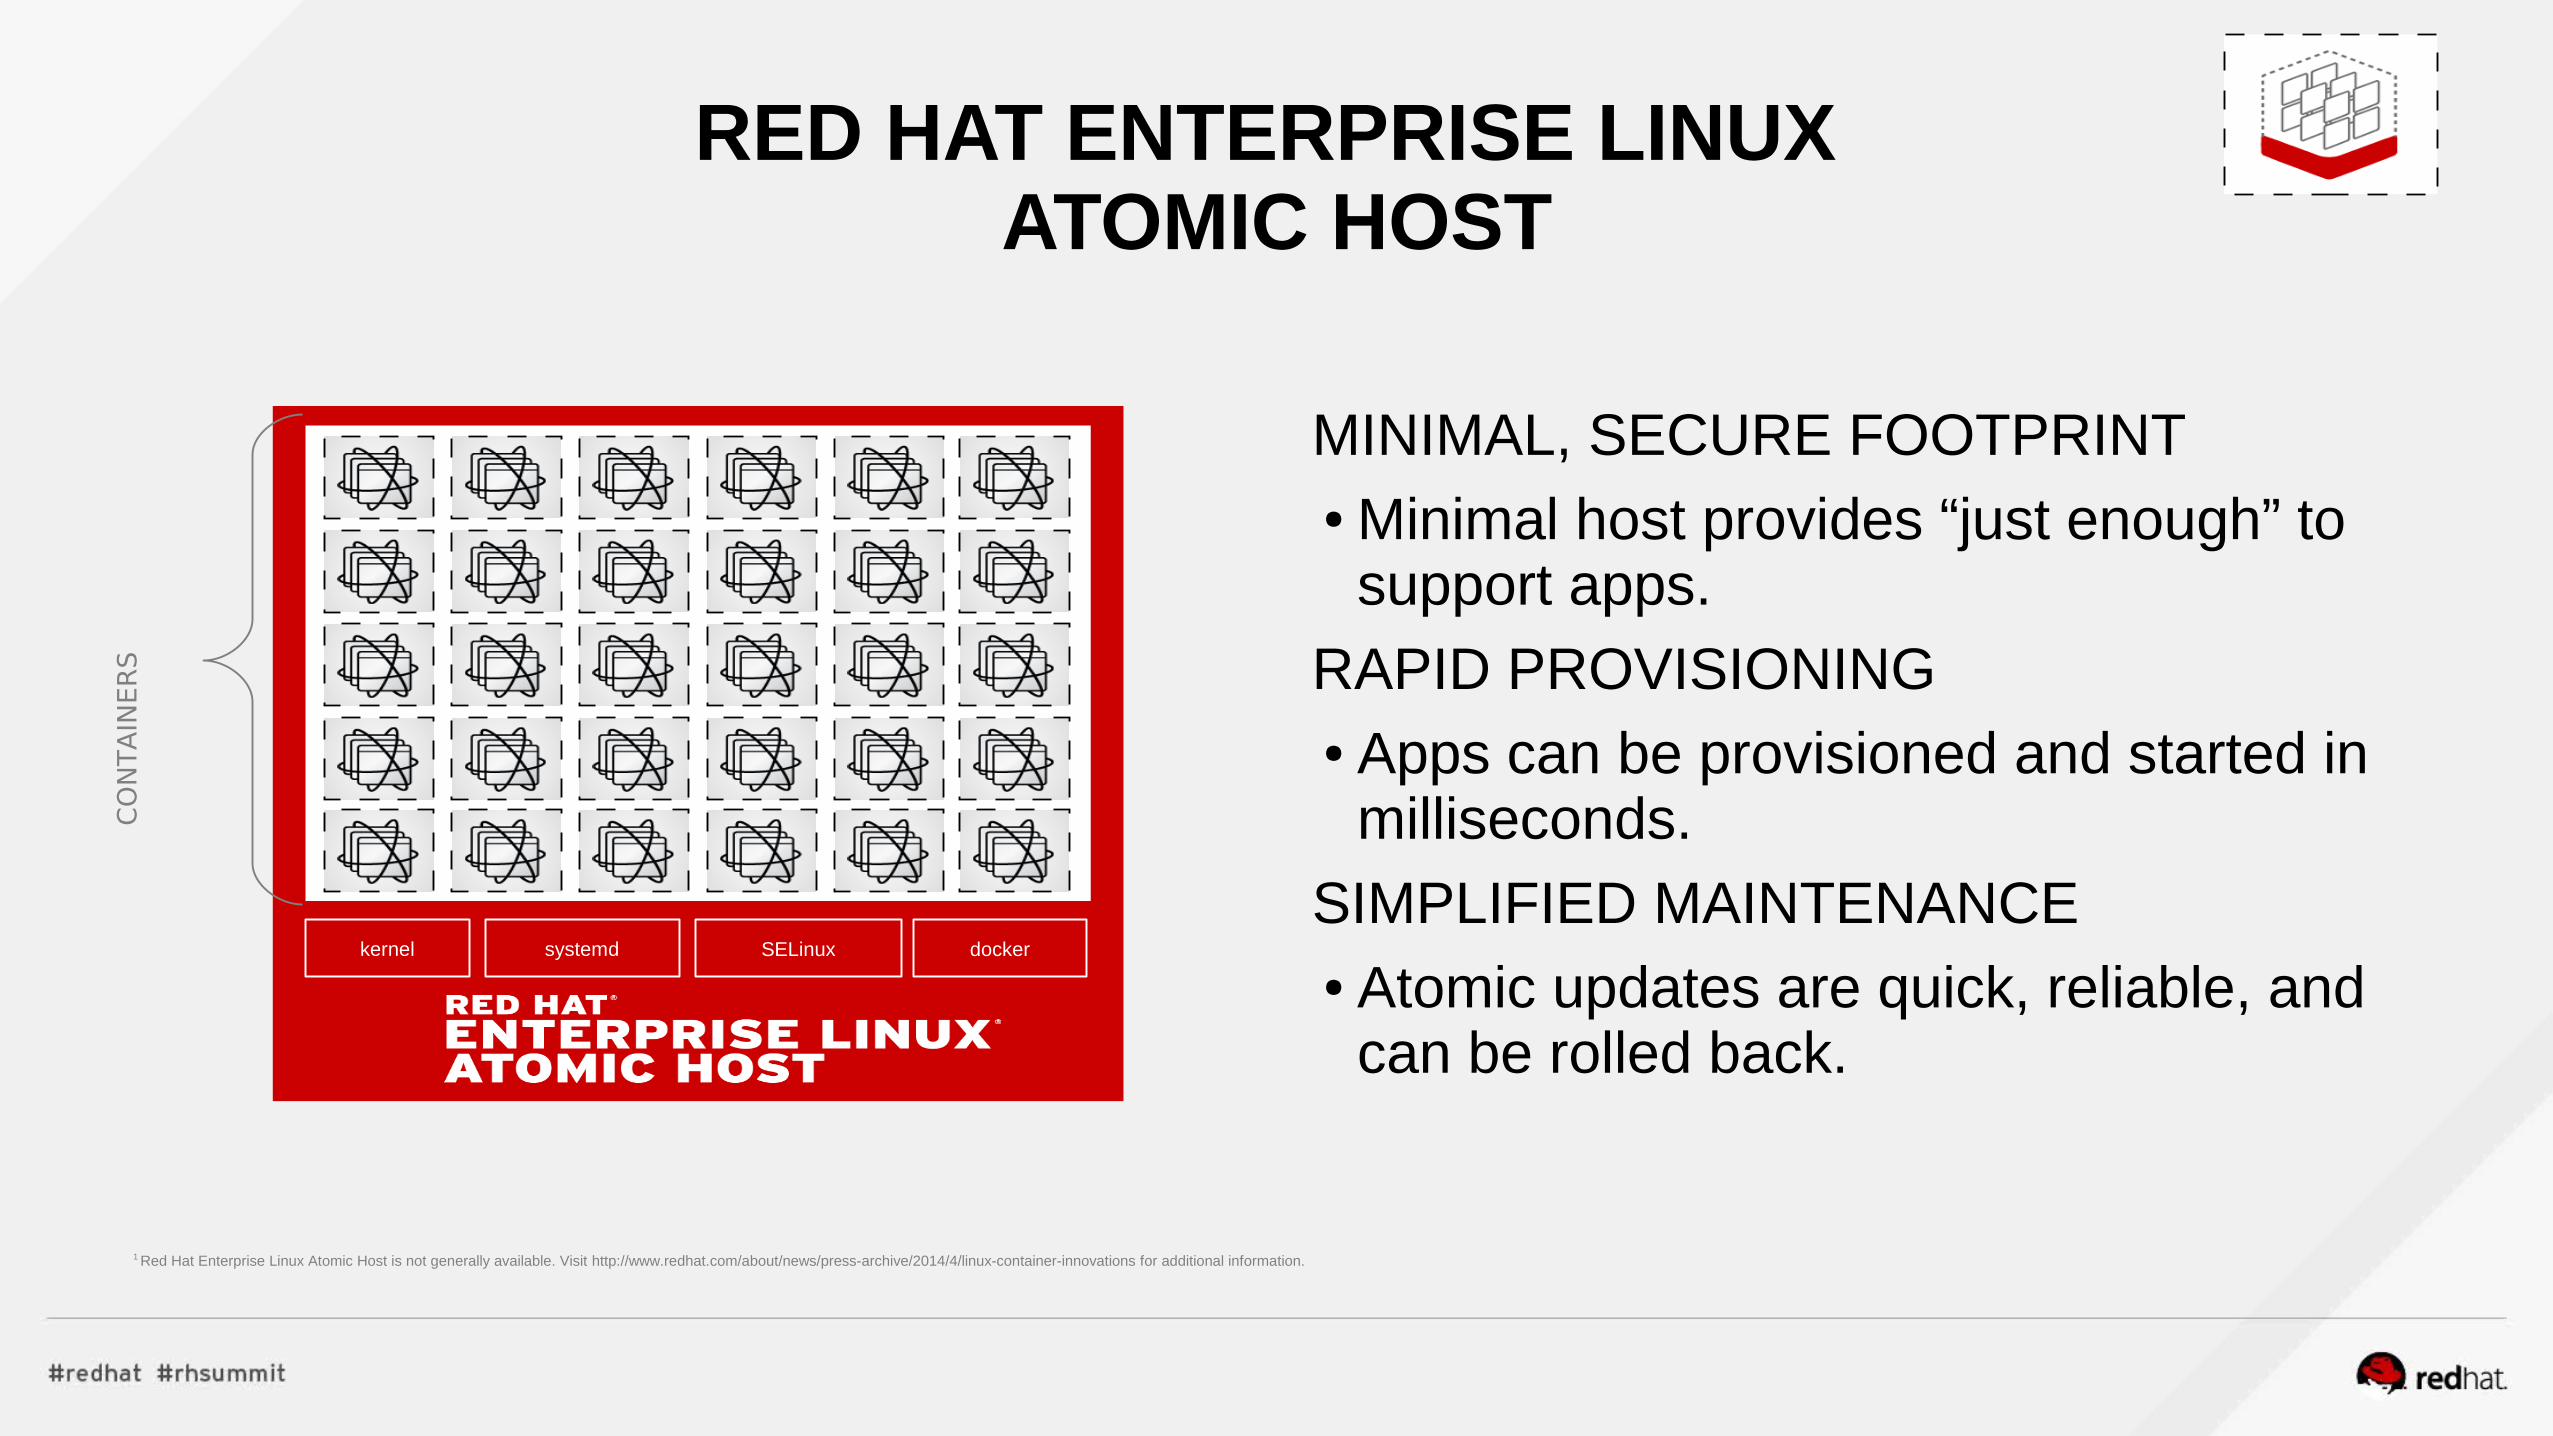
RED HAT ENTERPRISE LINUX ATOMIC HOST
MINIMAL, SECURE FOOTPRINT● Minimal host provides “just enough” to
support apps.
RAPID PROVISIONING● Apps can be provisioned and started in
milliseconds.
SIMPLIFIED MAINTENANCE● Atomic updates are quick, reliable, and
can be rolled back.
kernel systemd docker
CO
NTA
INE
RS
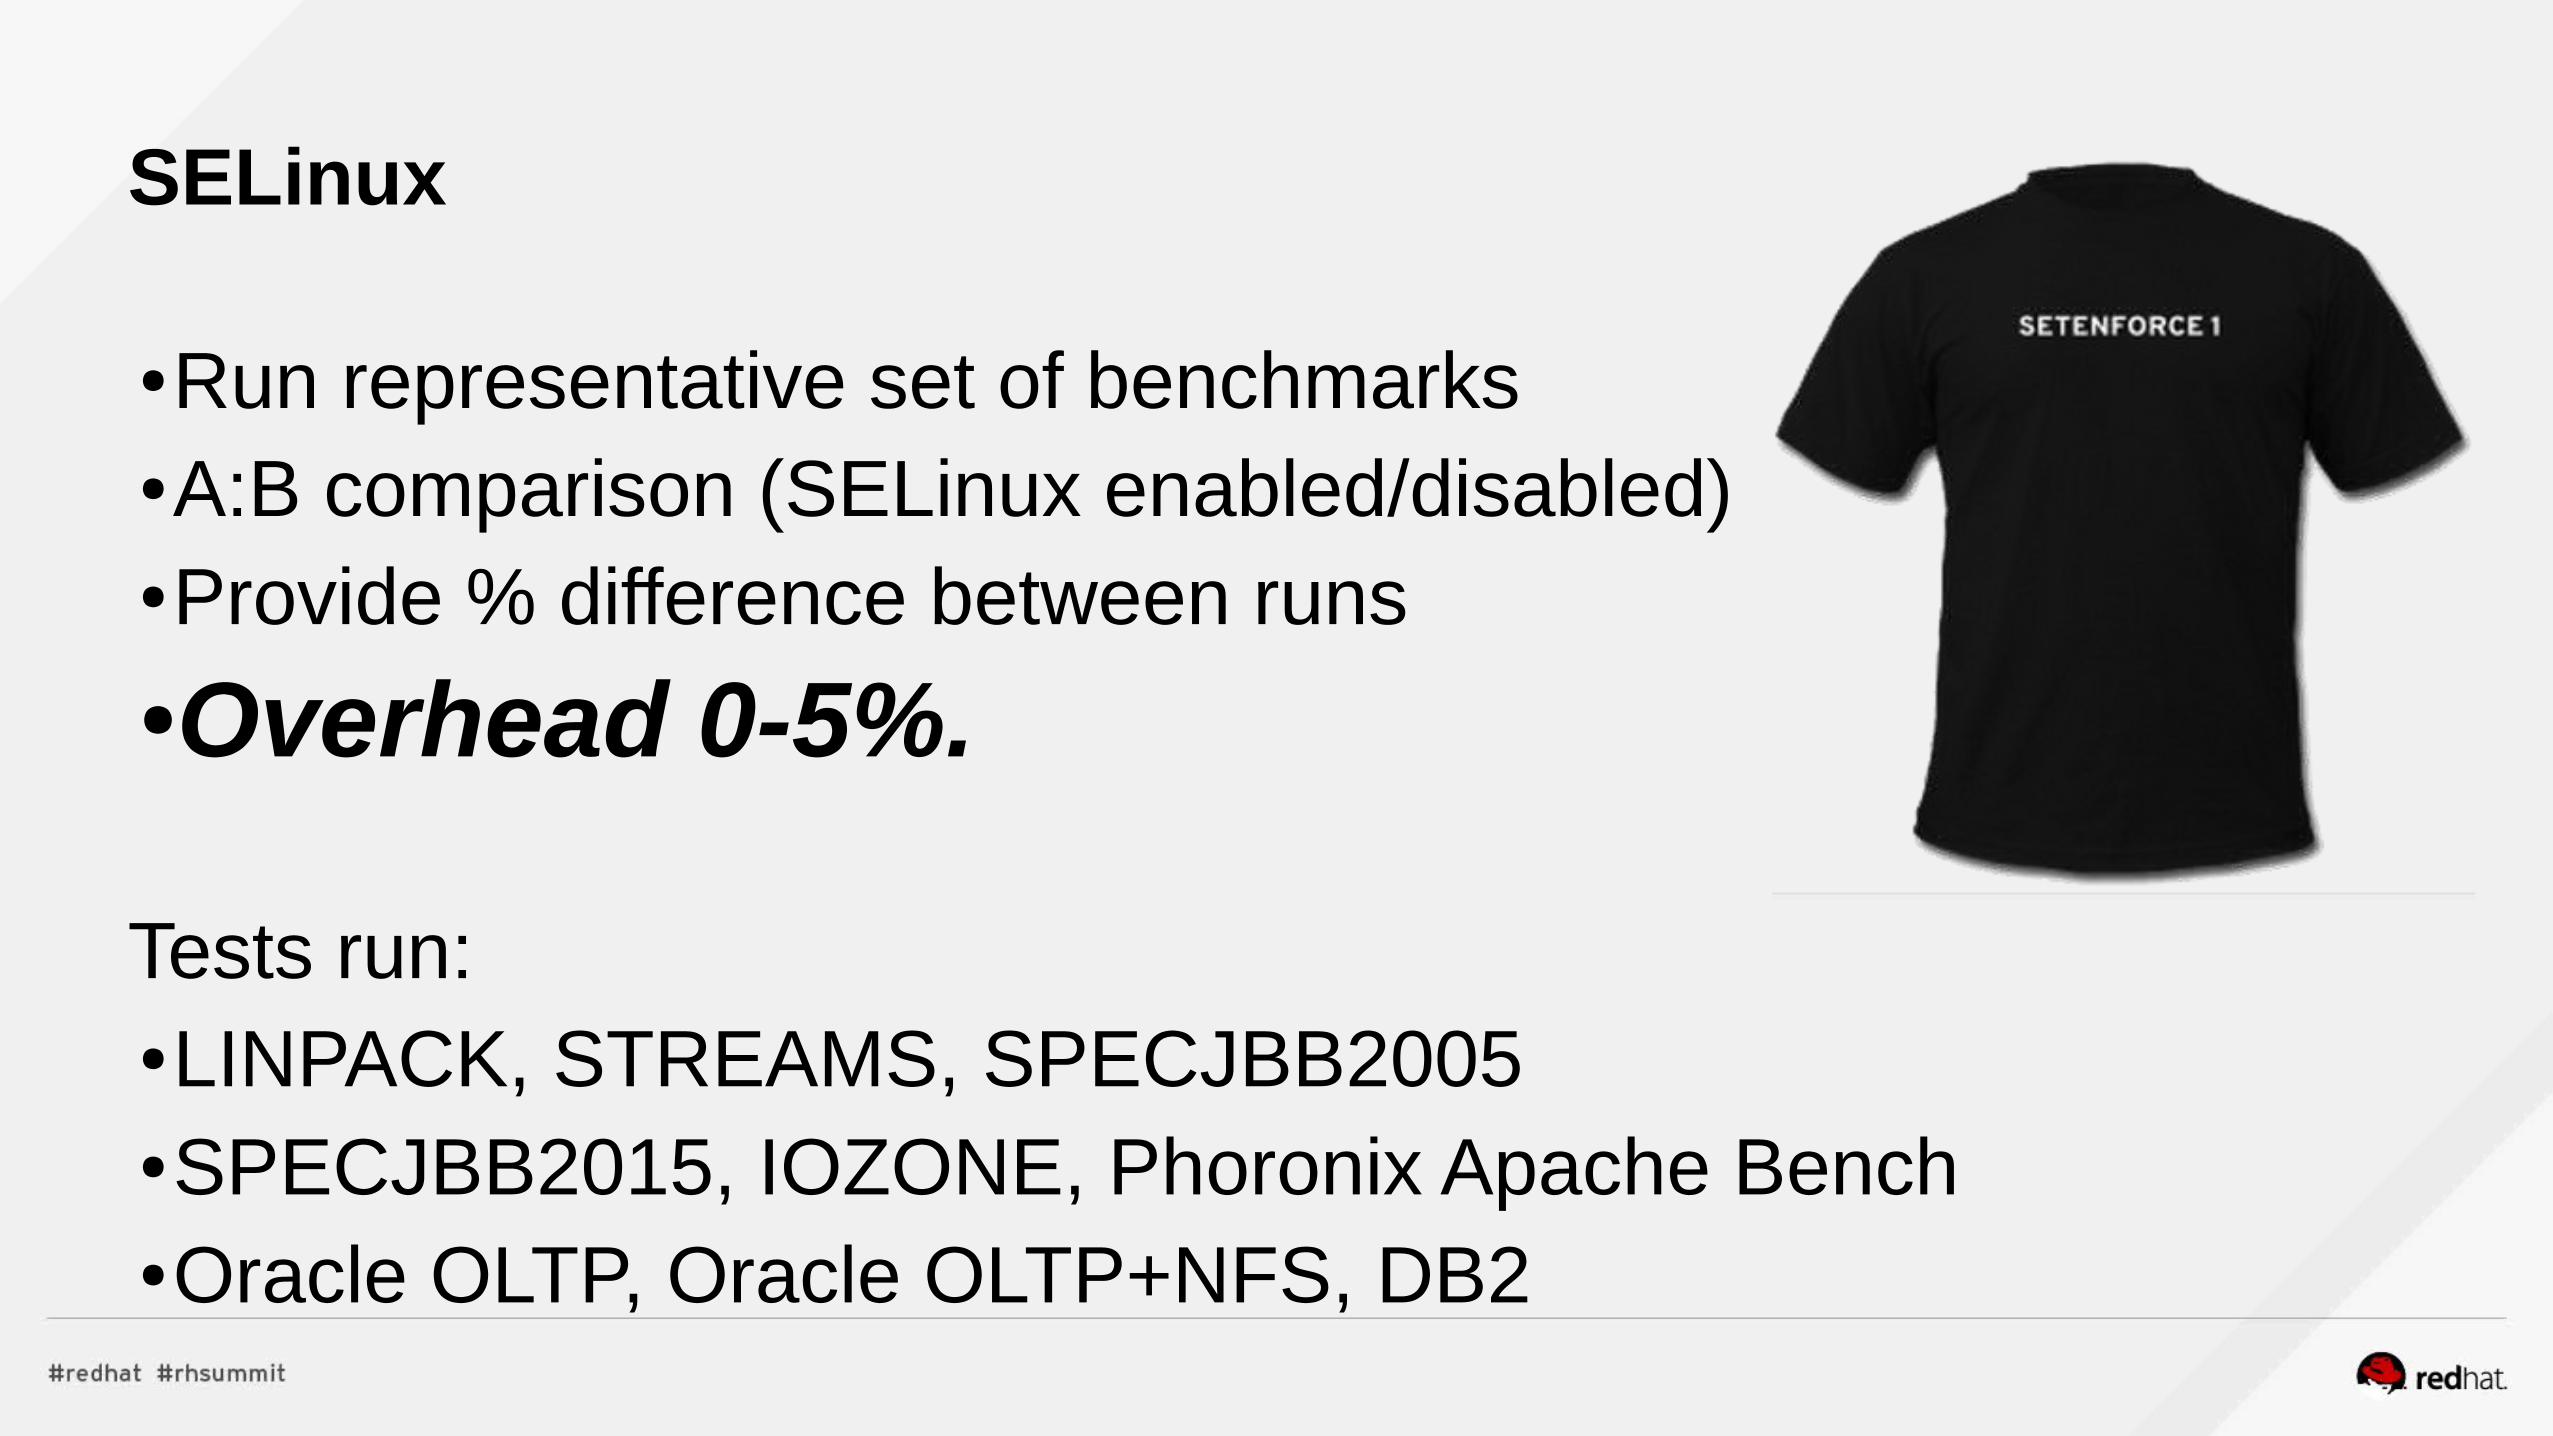
SELinux
1 Red Hat Enterprise Linux Atomic Host is not generally available. Visit http://www.redhat.com/about/news/press-archive/2014/4/linux-container-innovations for additional information.
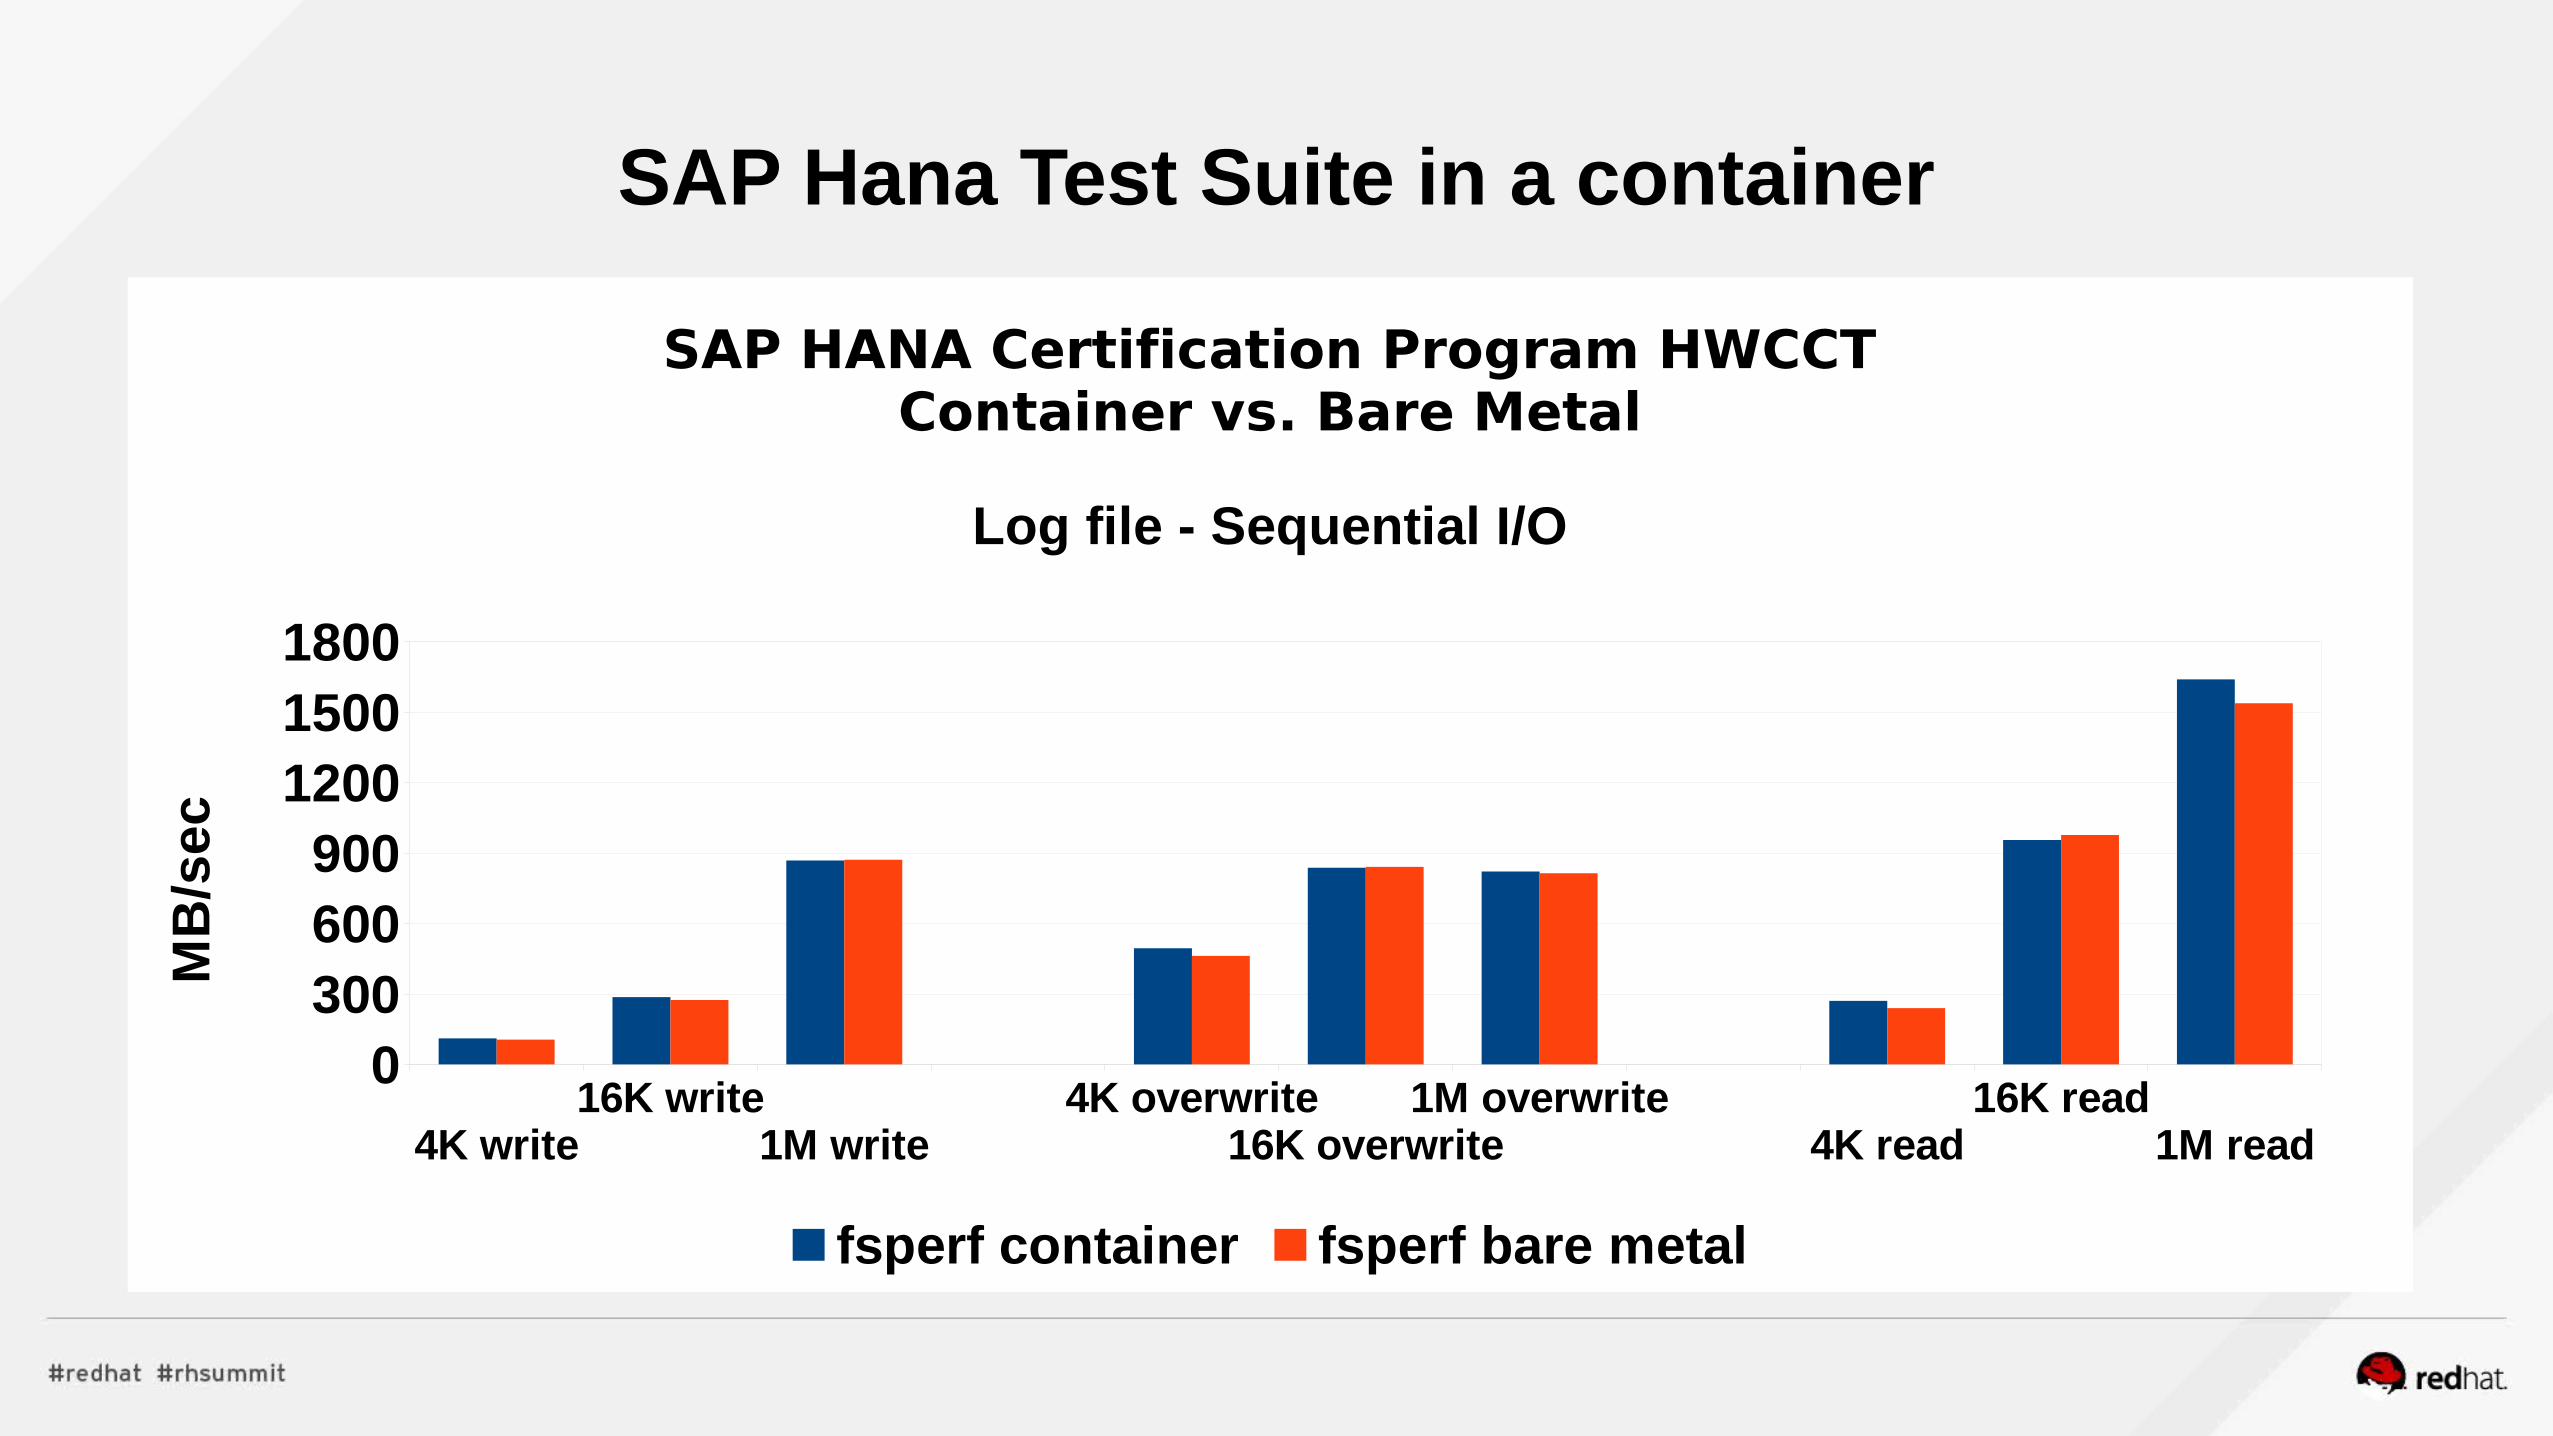
SAP HANA Certification Program HWCCTContainer vs. Bare Metal
Log file - Sequential I/O
fsperf container fsperf bare metal
MB
/sec
06/26/15 RED HAT INC. CONFIDENTIAL, NDA Required 78
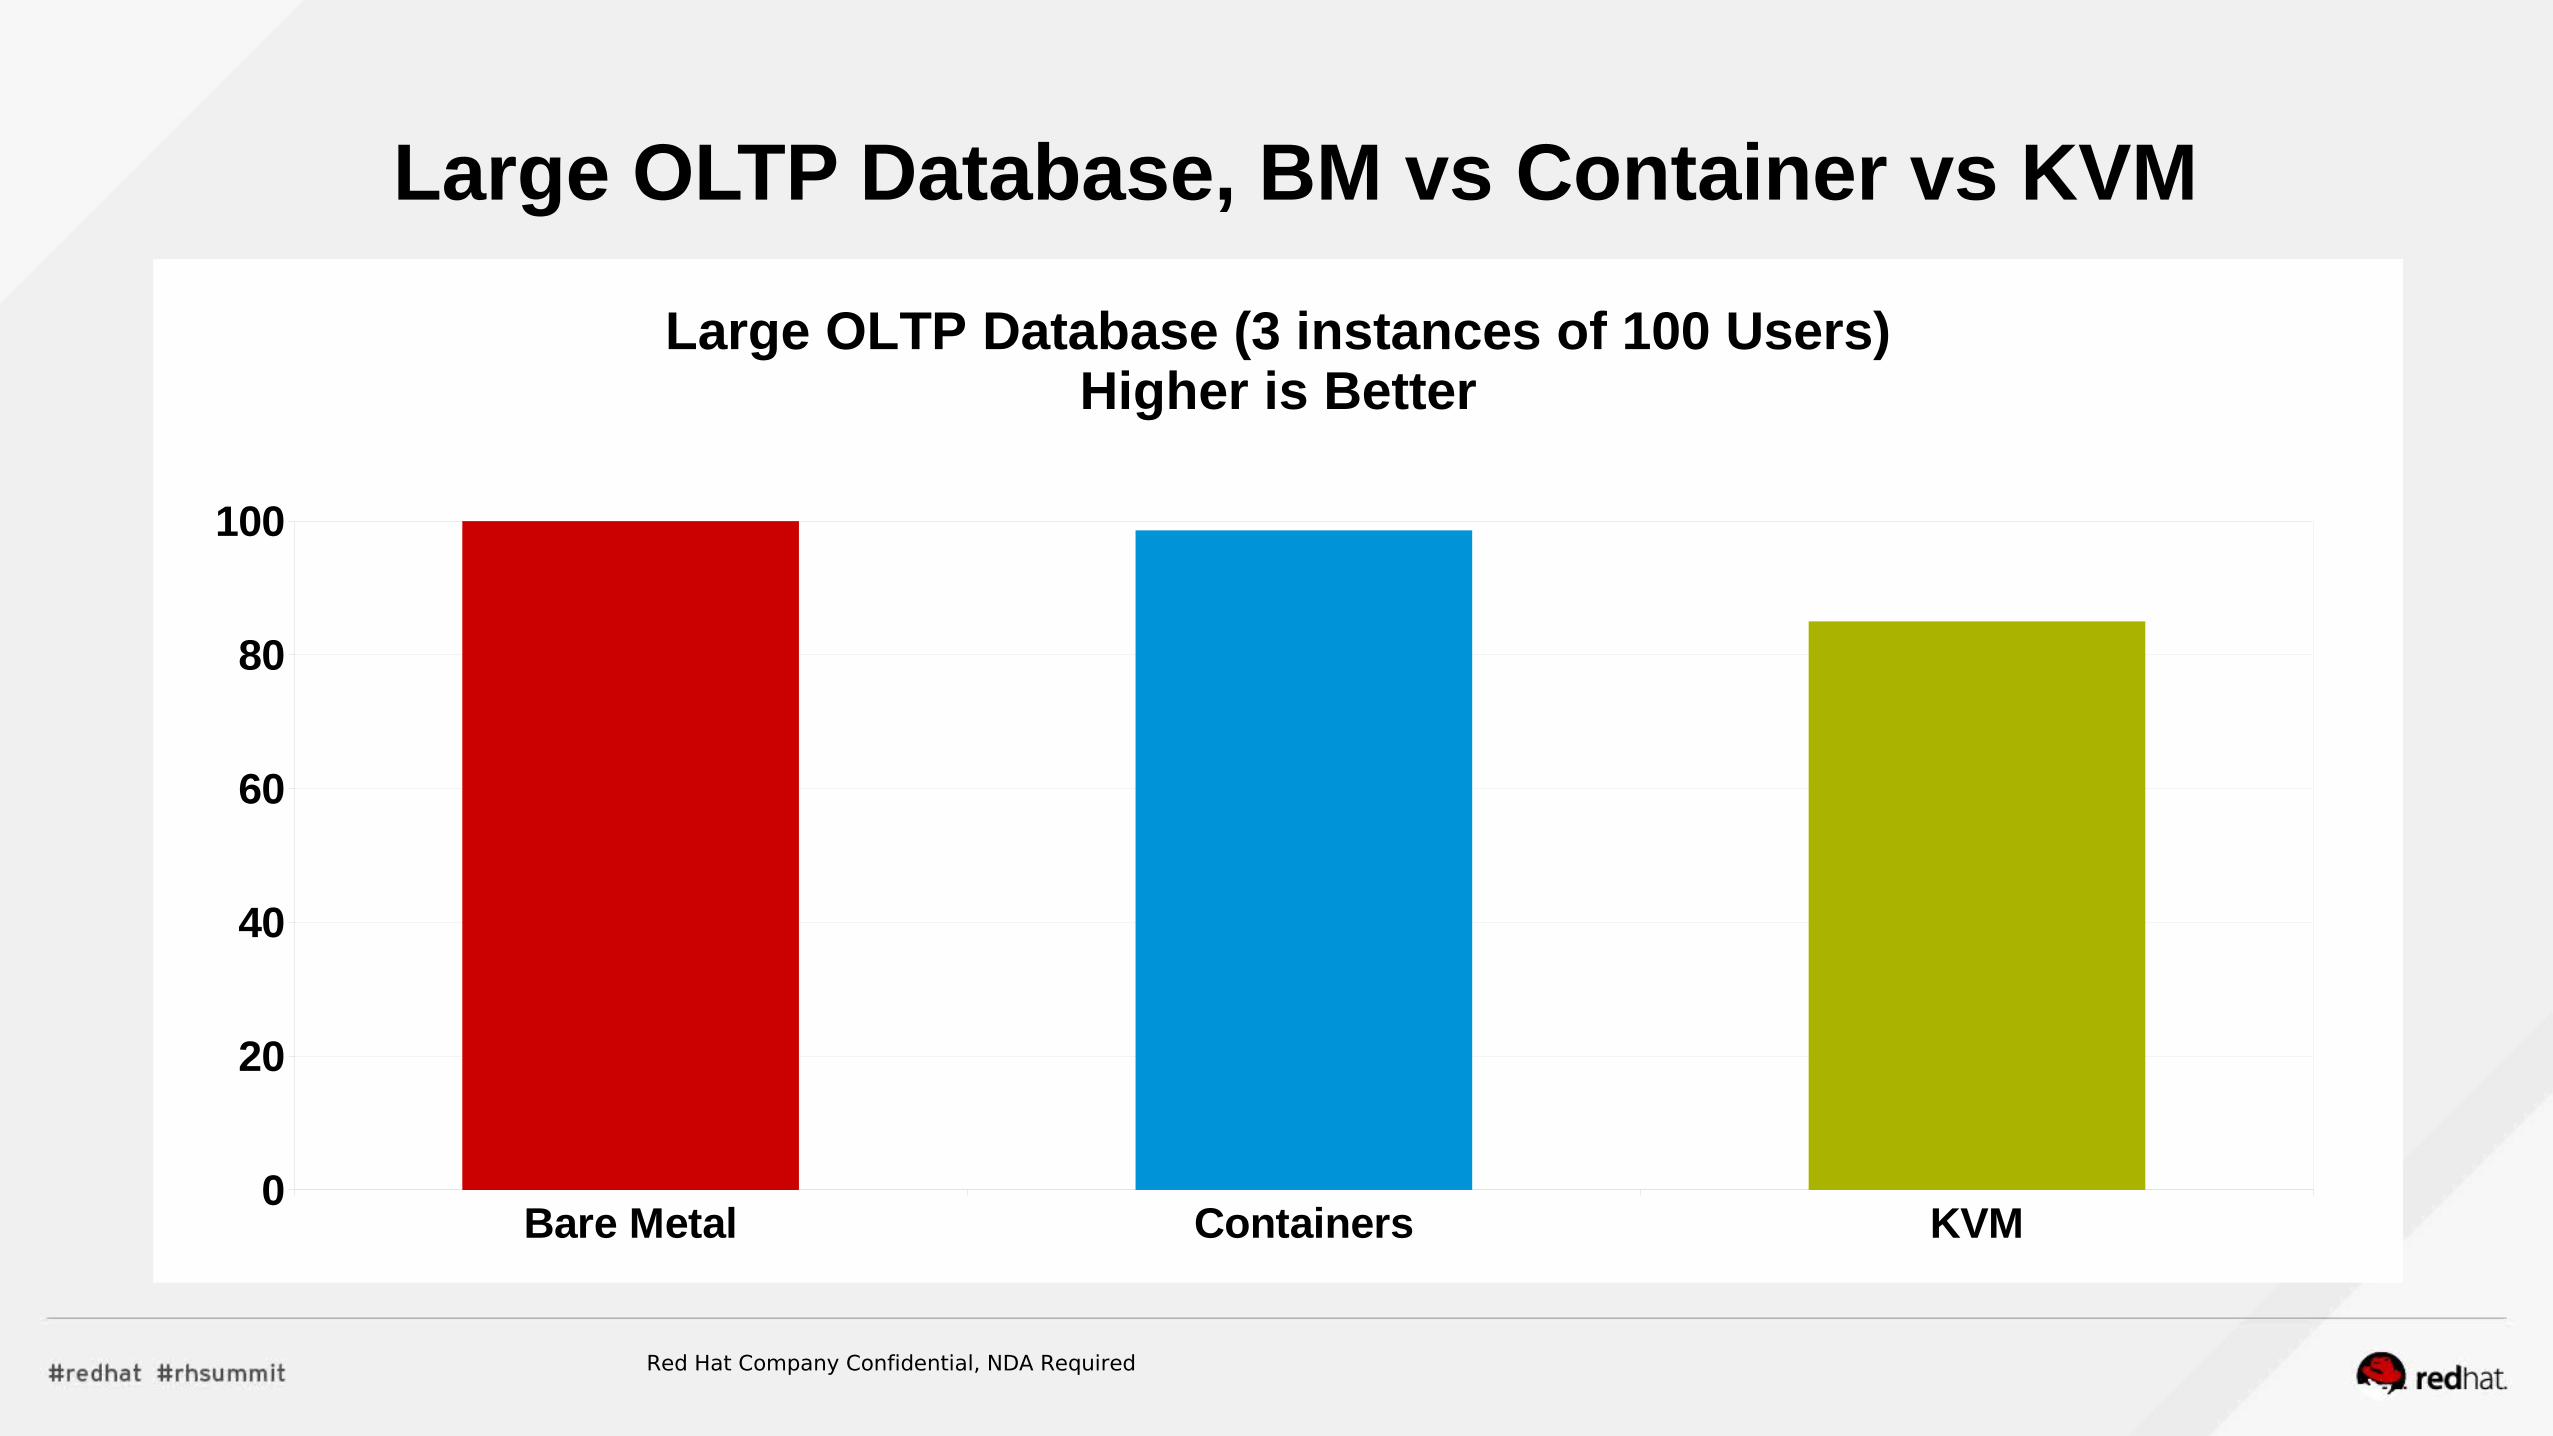
Large OLTP Database, BM vs Container vs KVM
Bare Metal Containers KVM0
20
40
60
80
100
Large OLTP Database (3 instances of 100 Users)Higher is Better
Red Hat Company Confidential, NDA Required
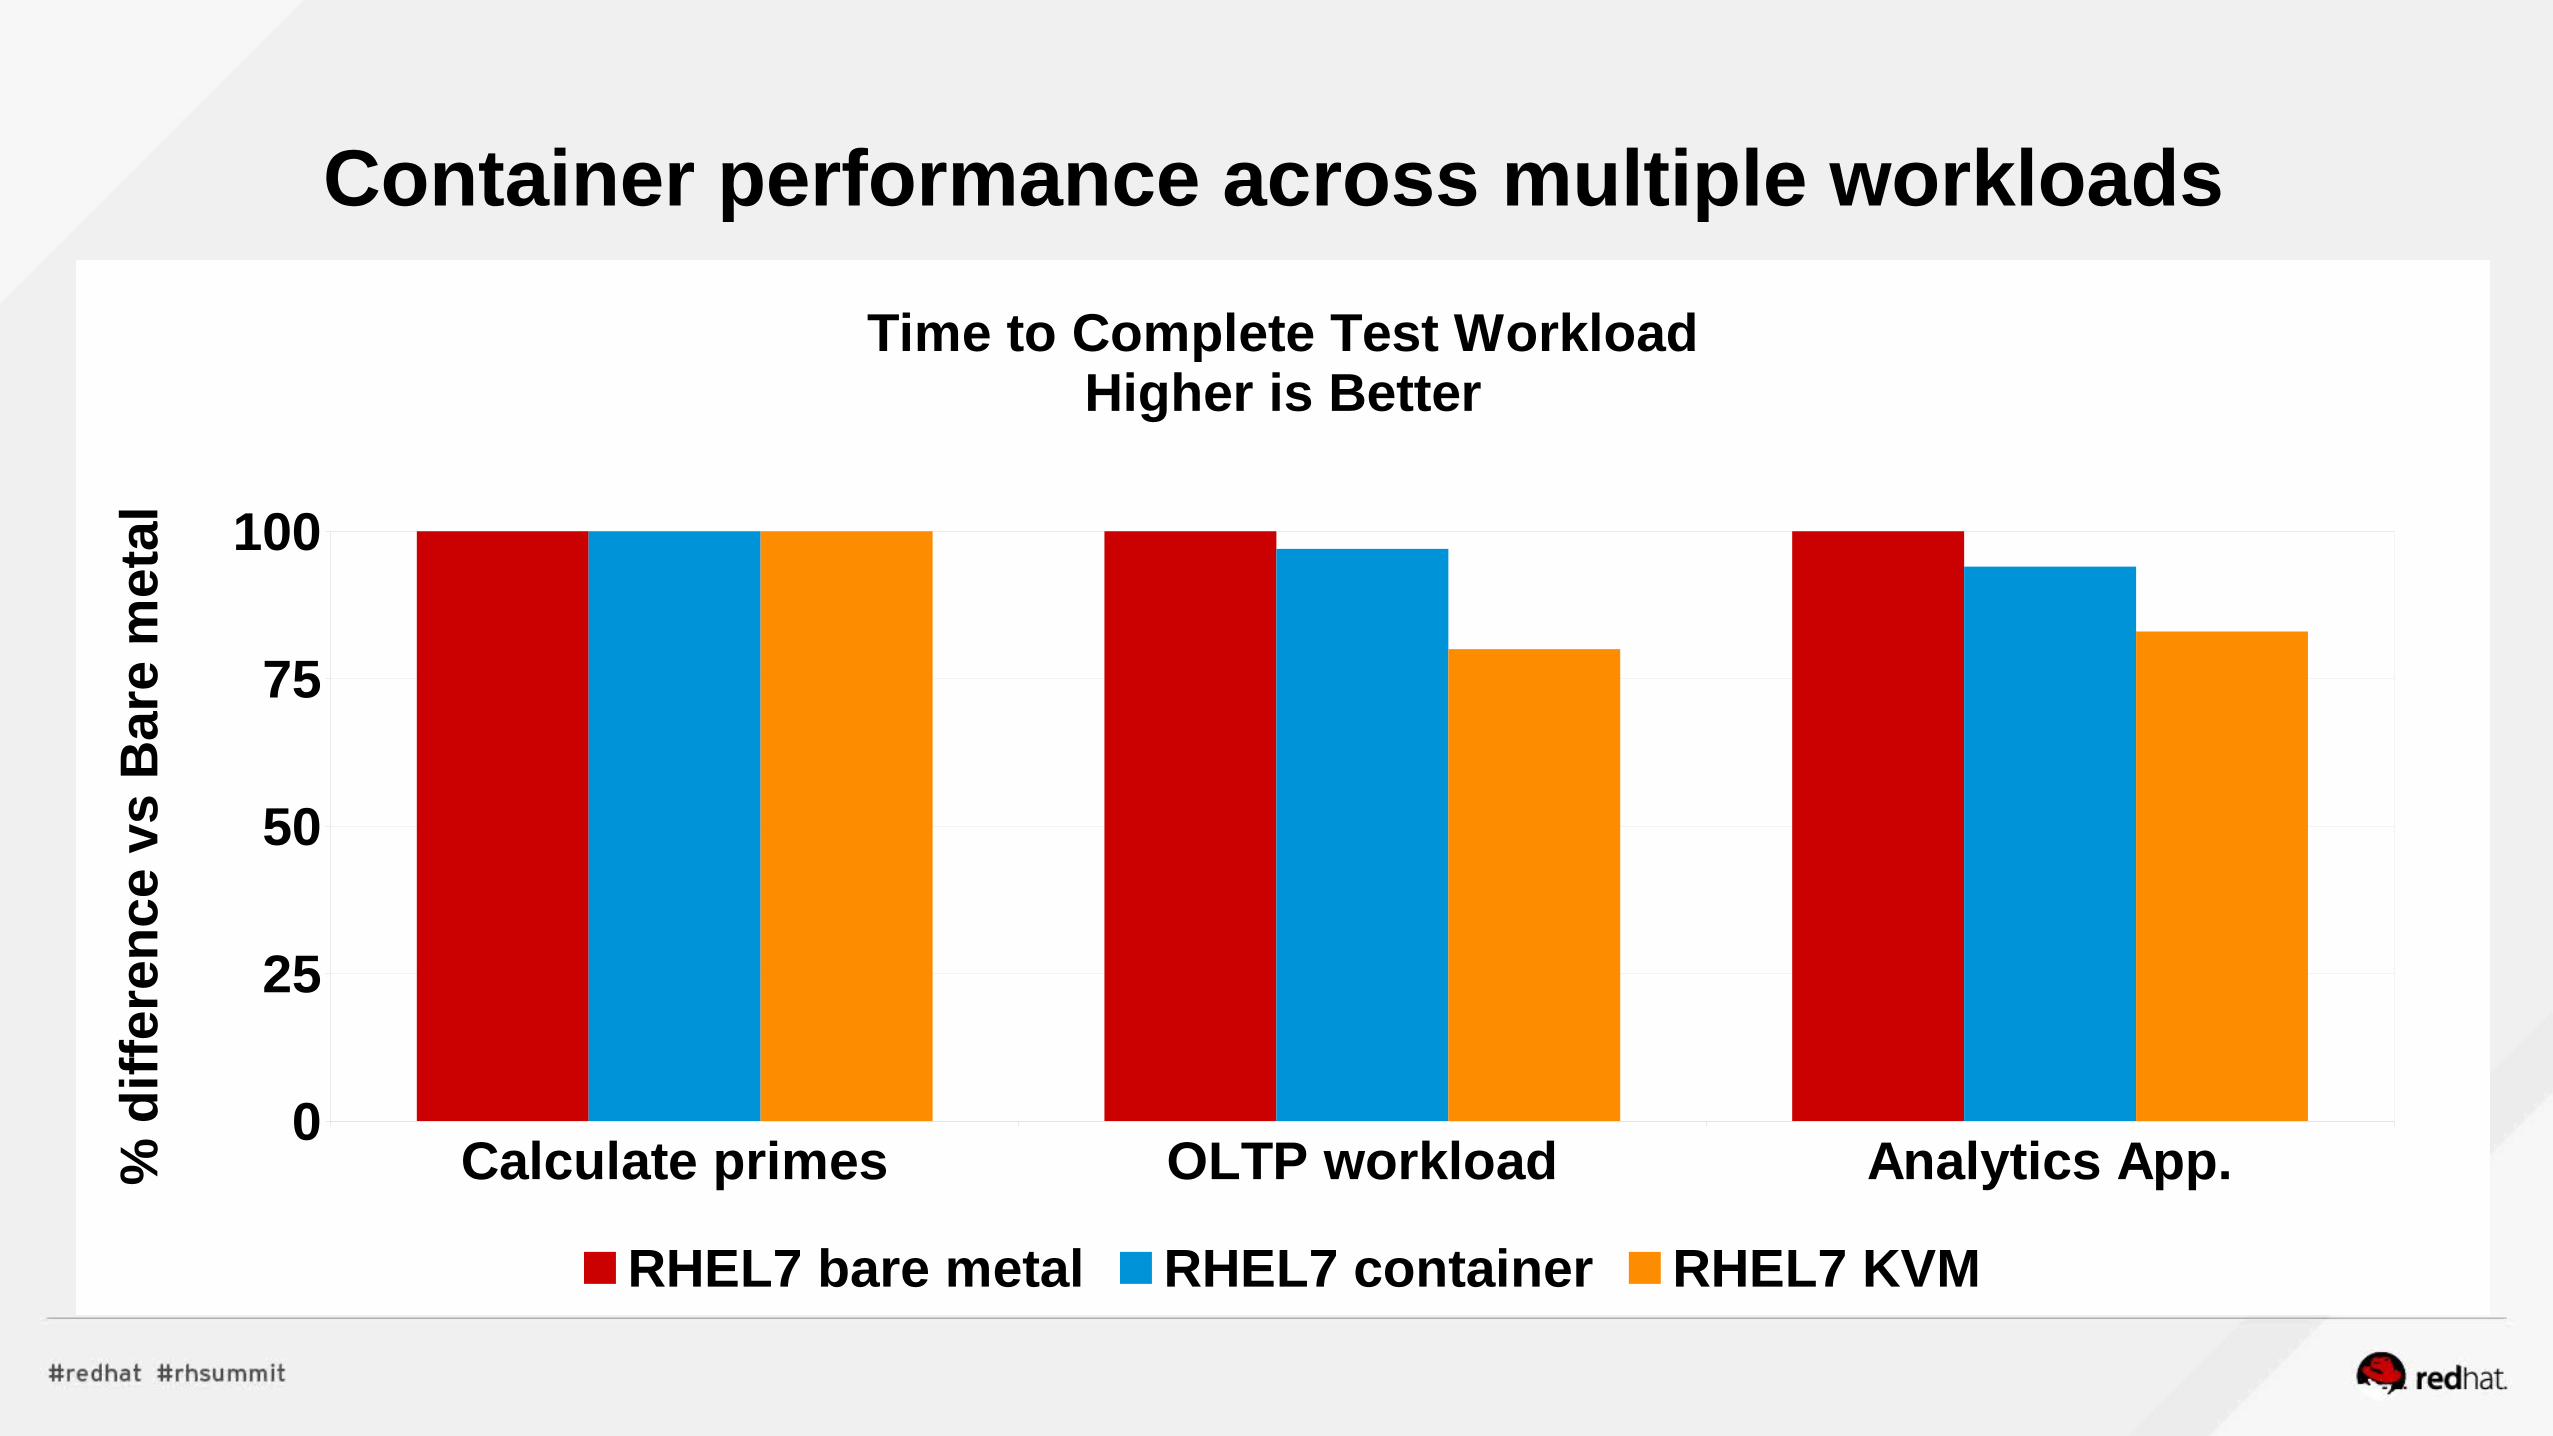
Container performance across multiple workloads
Calculate primes OLTP workload Analytics App.0
25
50
75
100
Time to Complete Test WorkloadHigher is Better
RHEL7 bare metal RHEL7 container RHEL7 KVM
% d
iffe
ren
ce v
s B
are
met
al
Network PerformanceNFV
Realtime
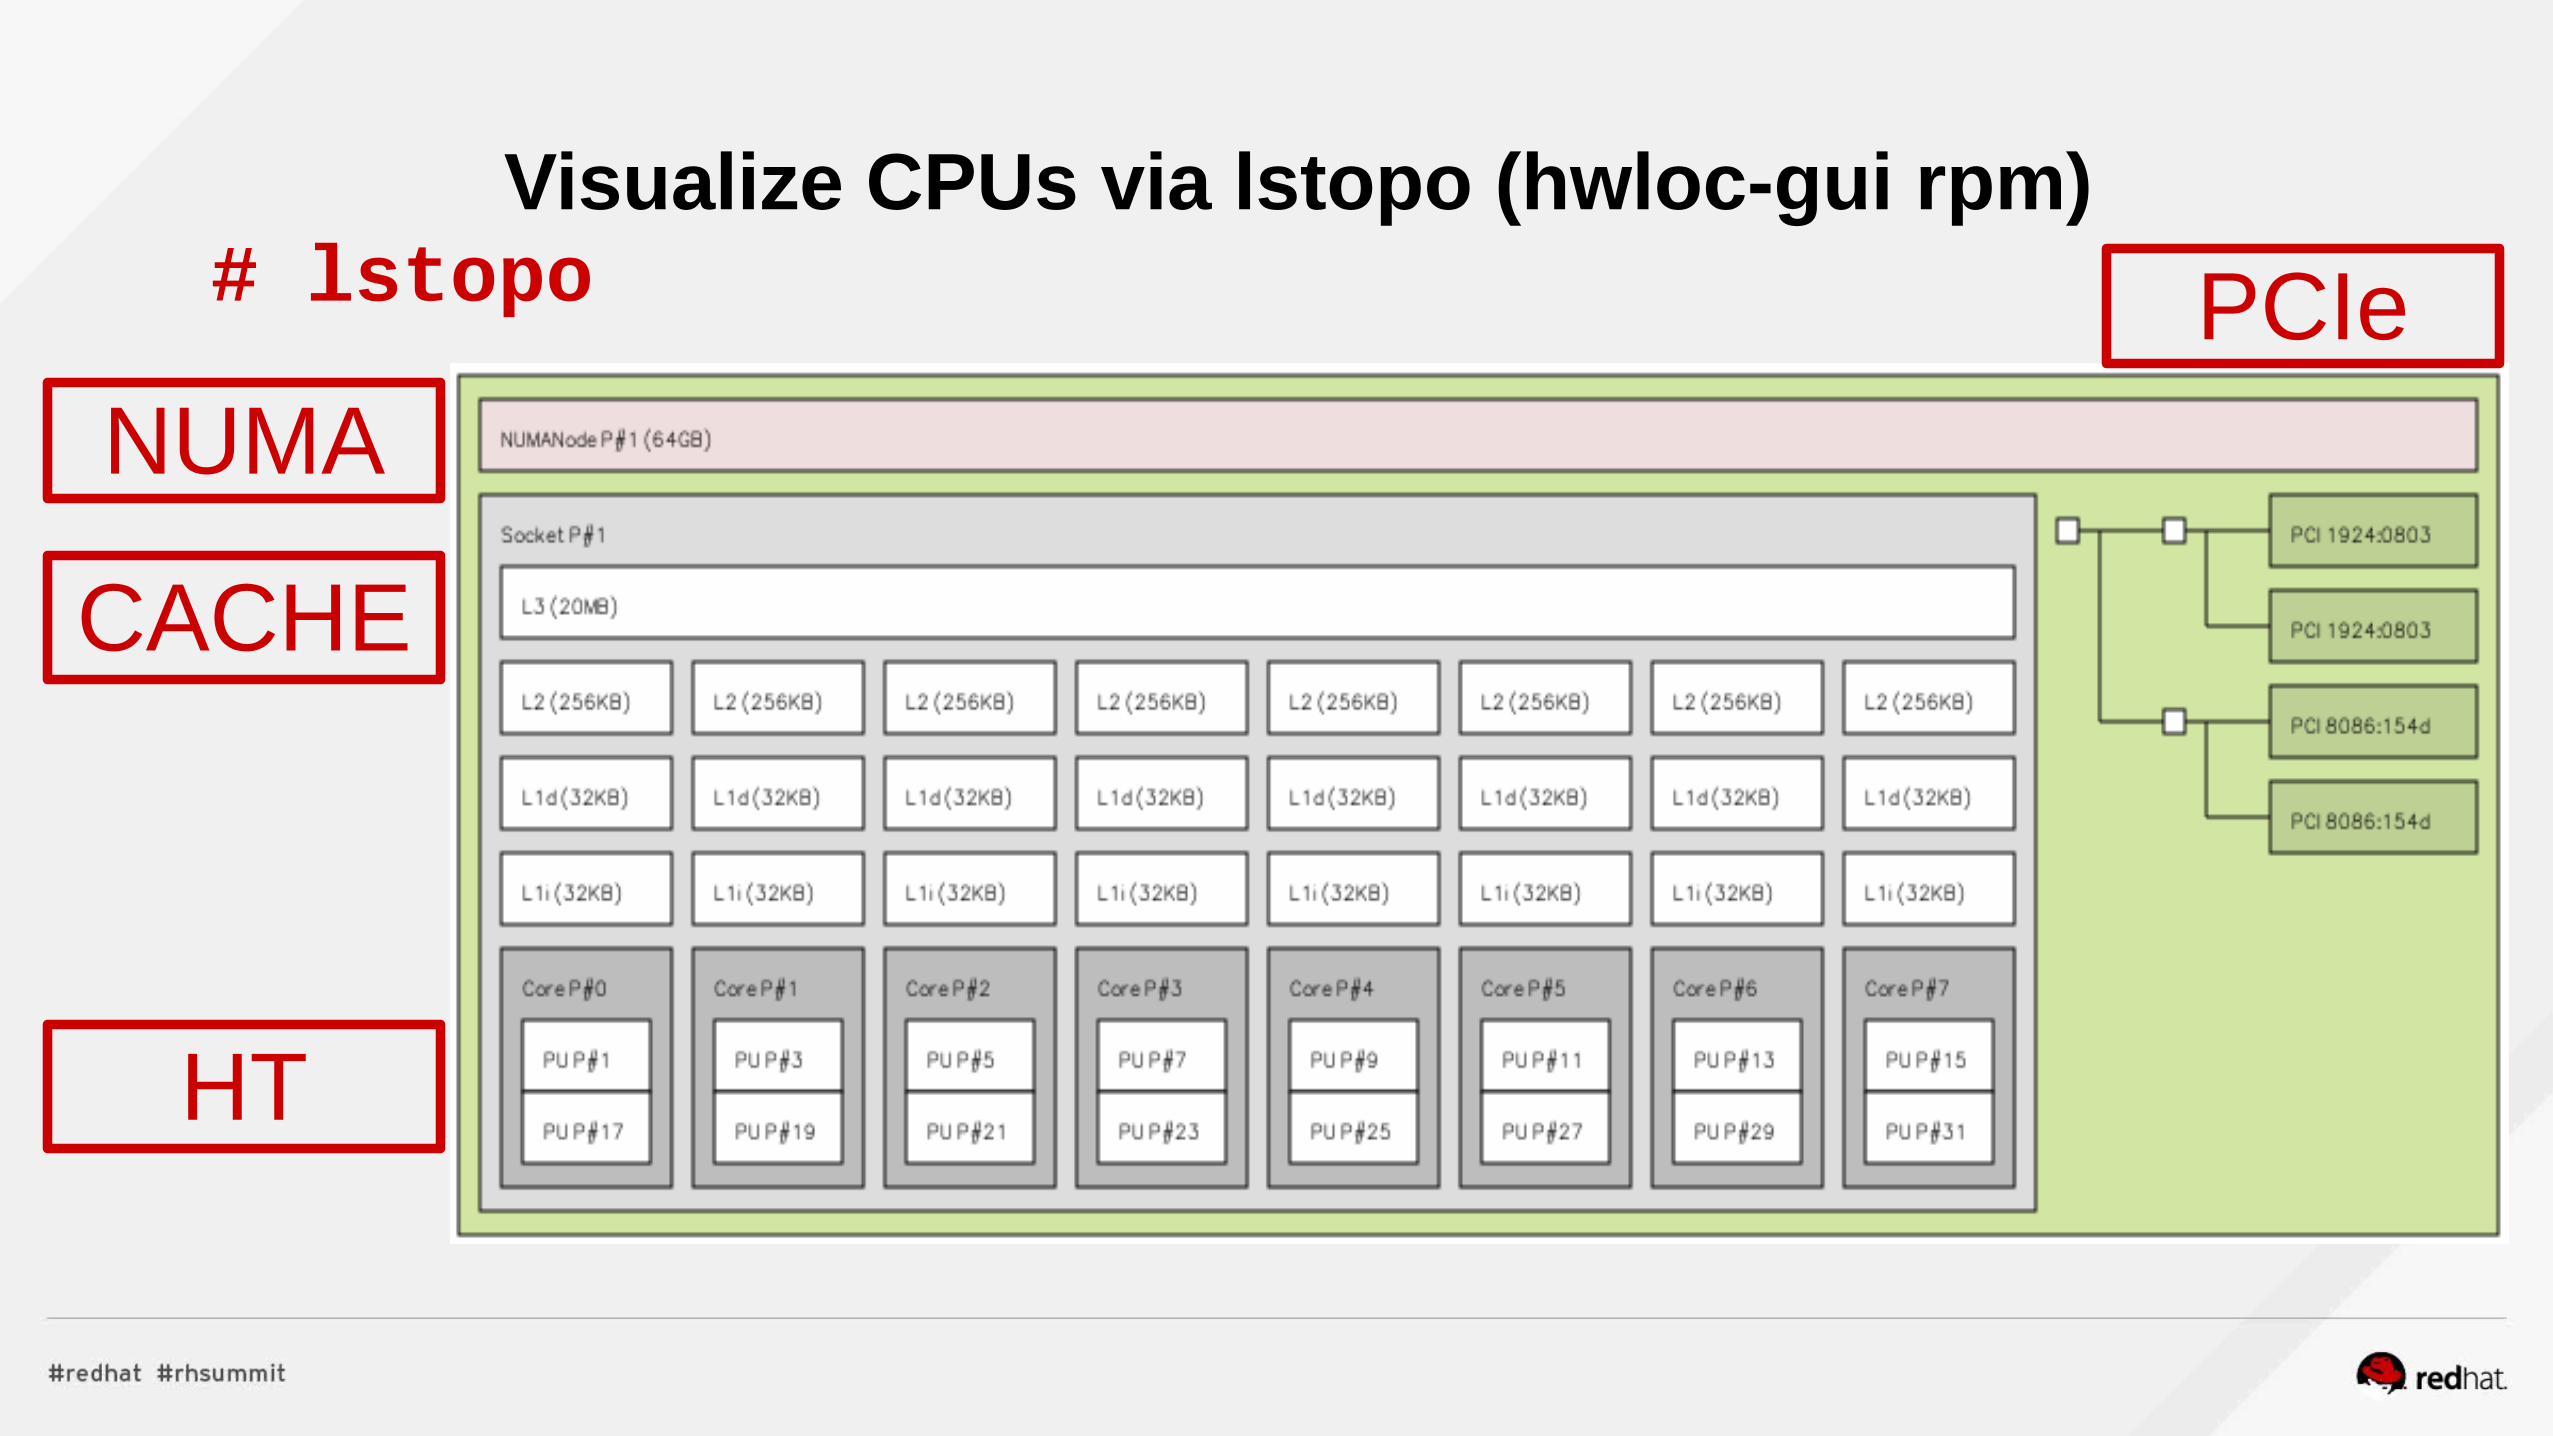
Visualize CPUs via lstopo (hwloc-gui rpm)# lstopo
NUMA
CACHE
PCIe
HT
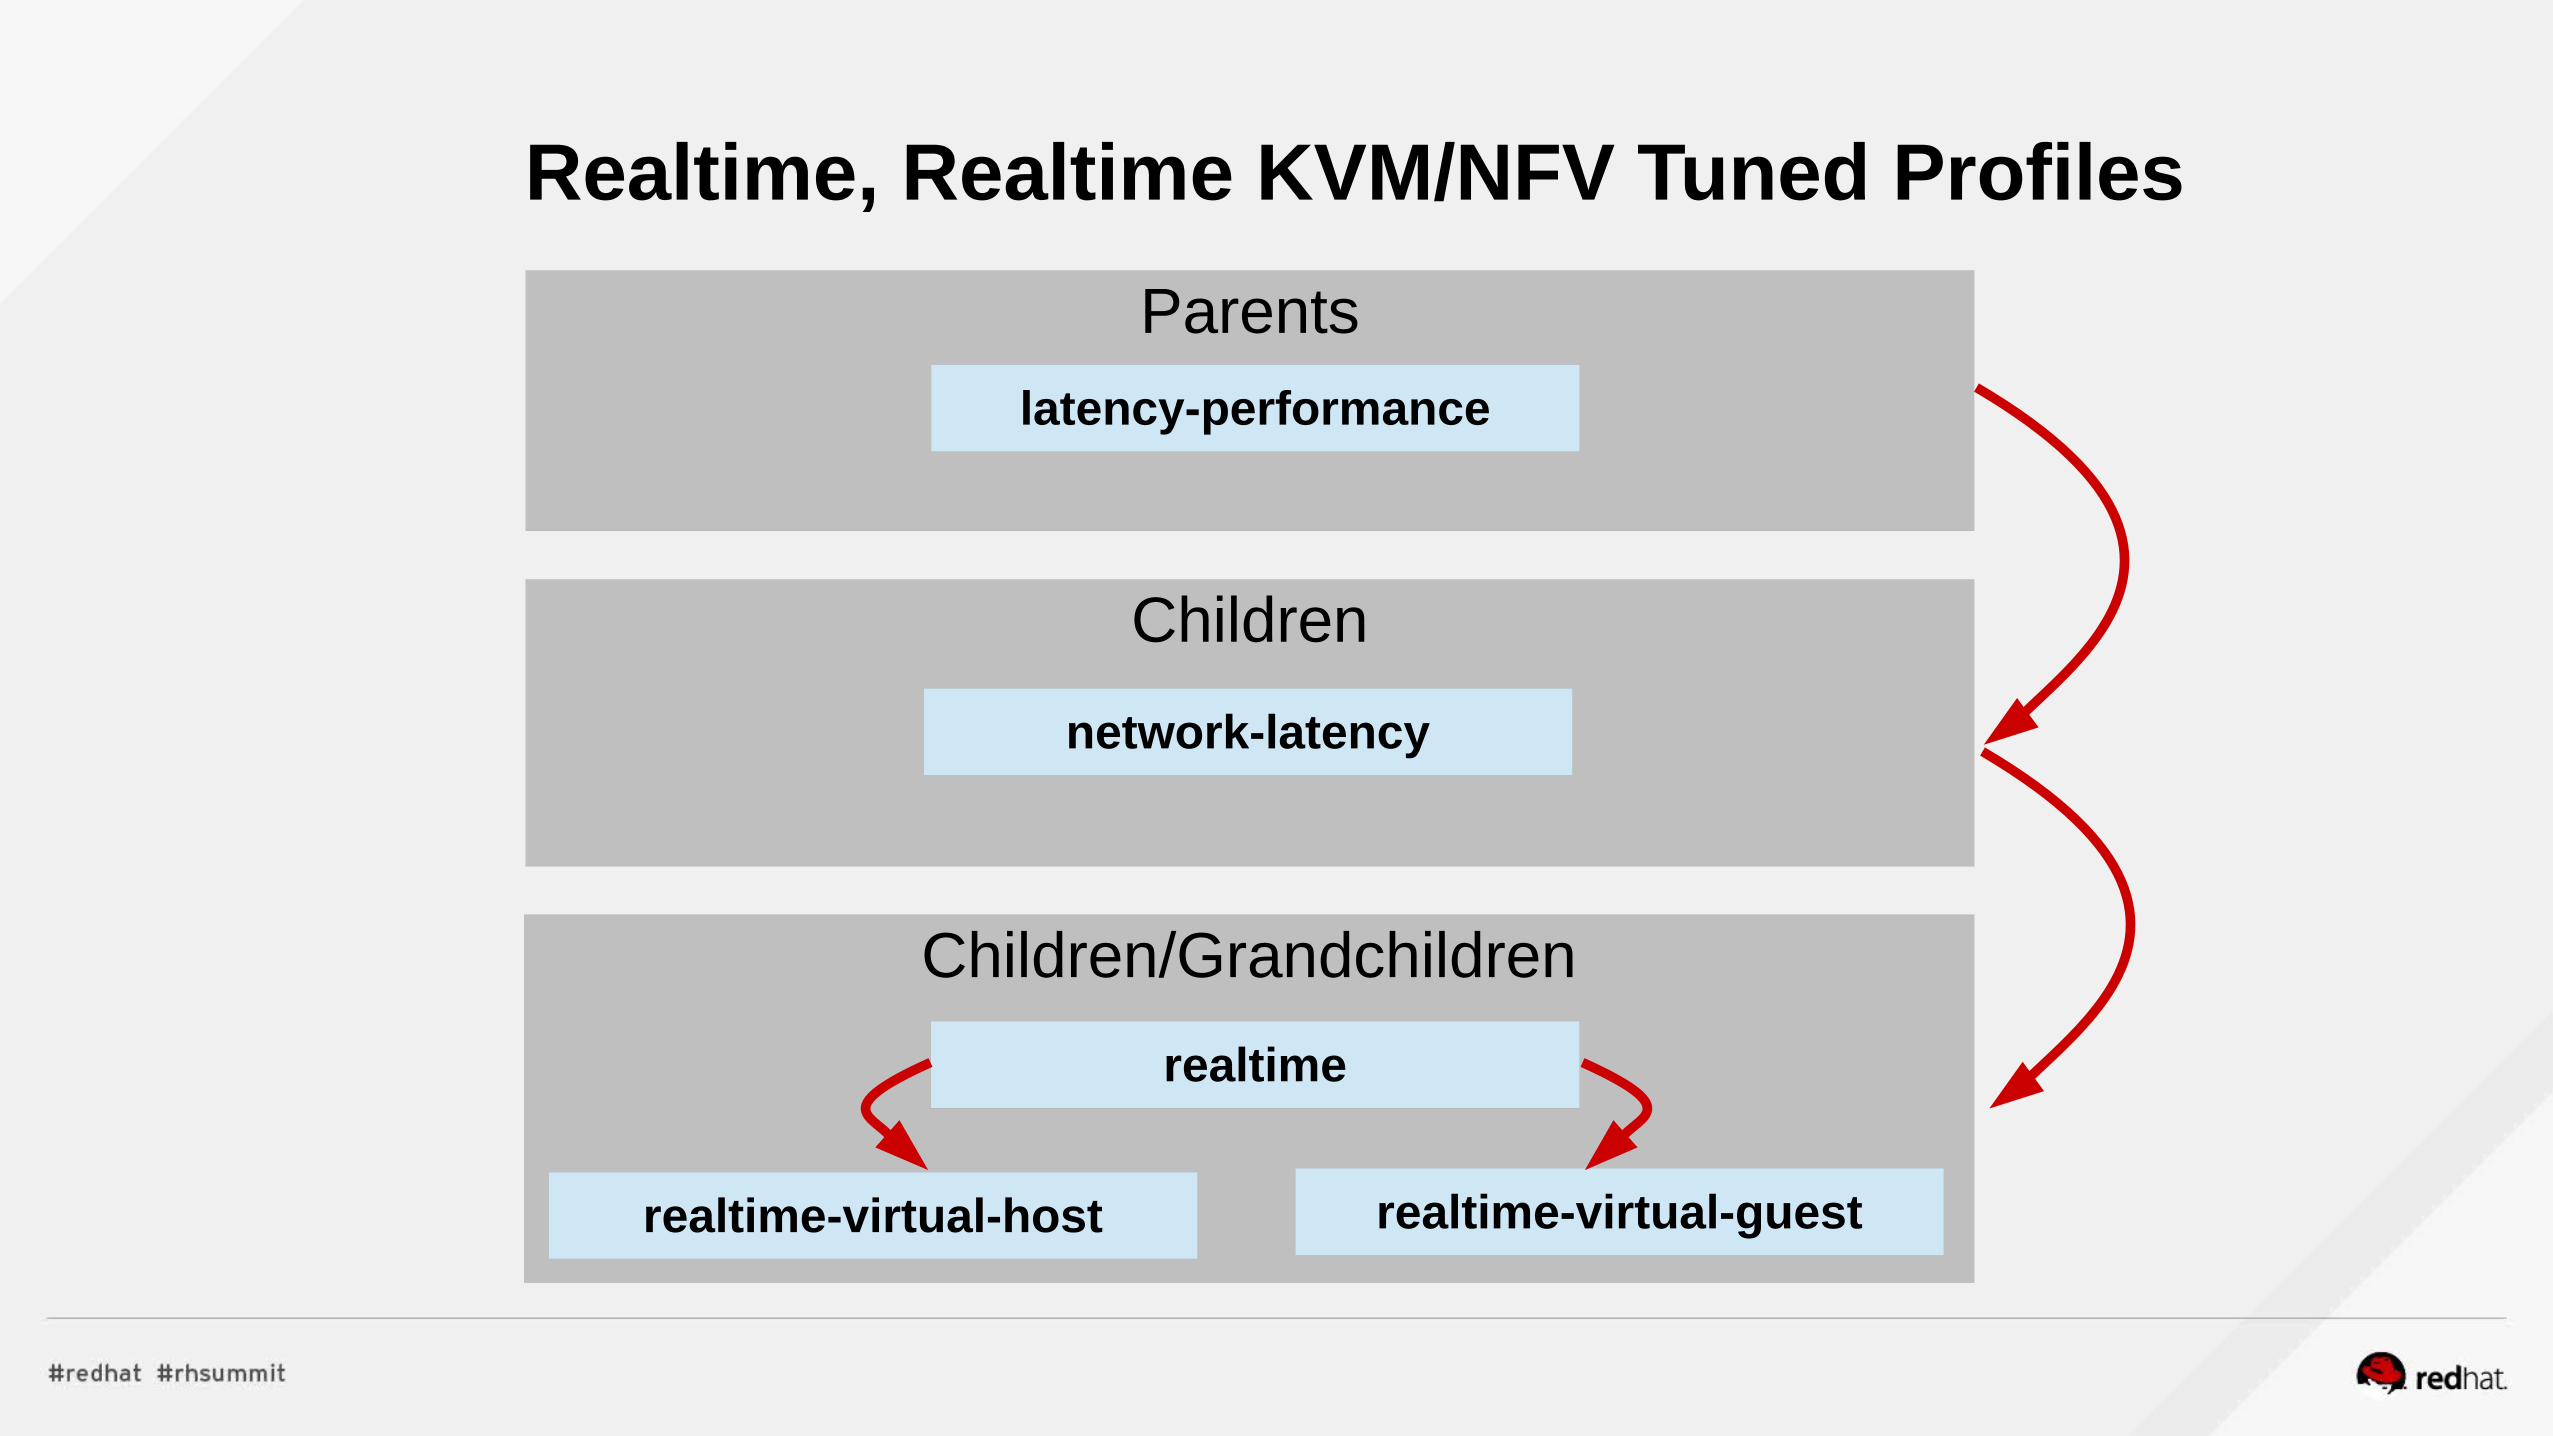
Children
Children/Grandchildren
Parents
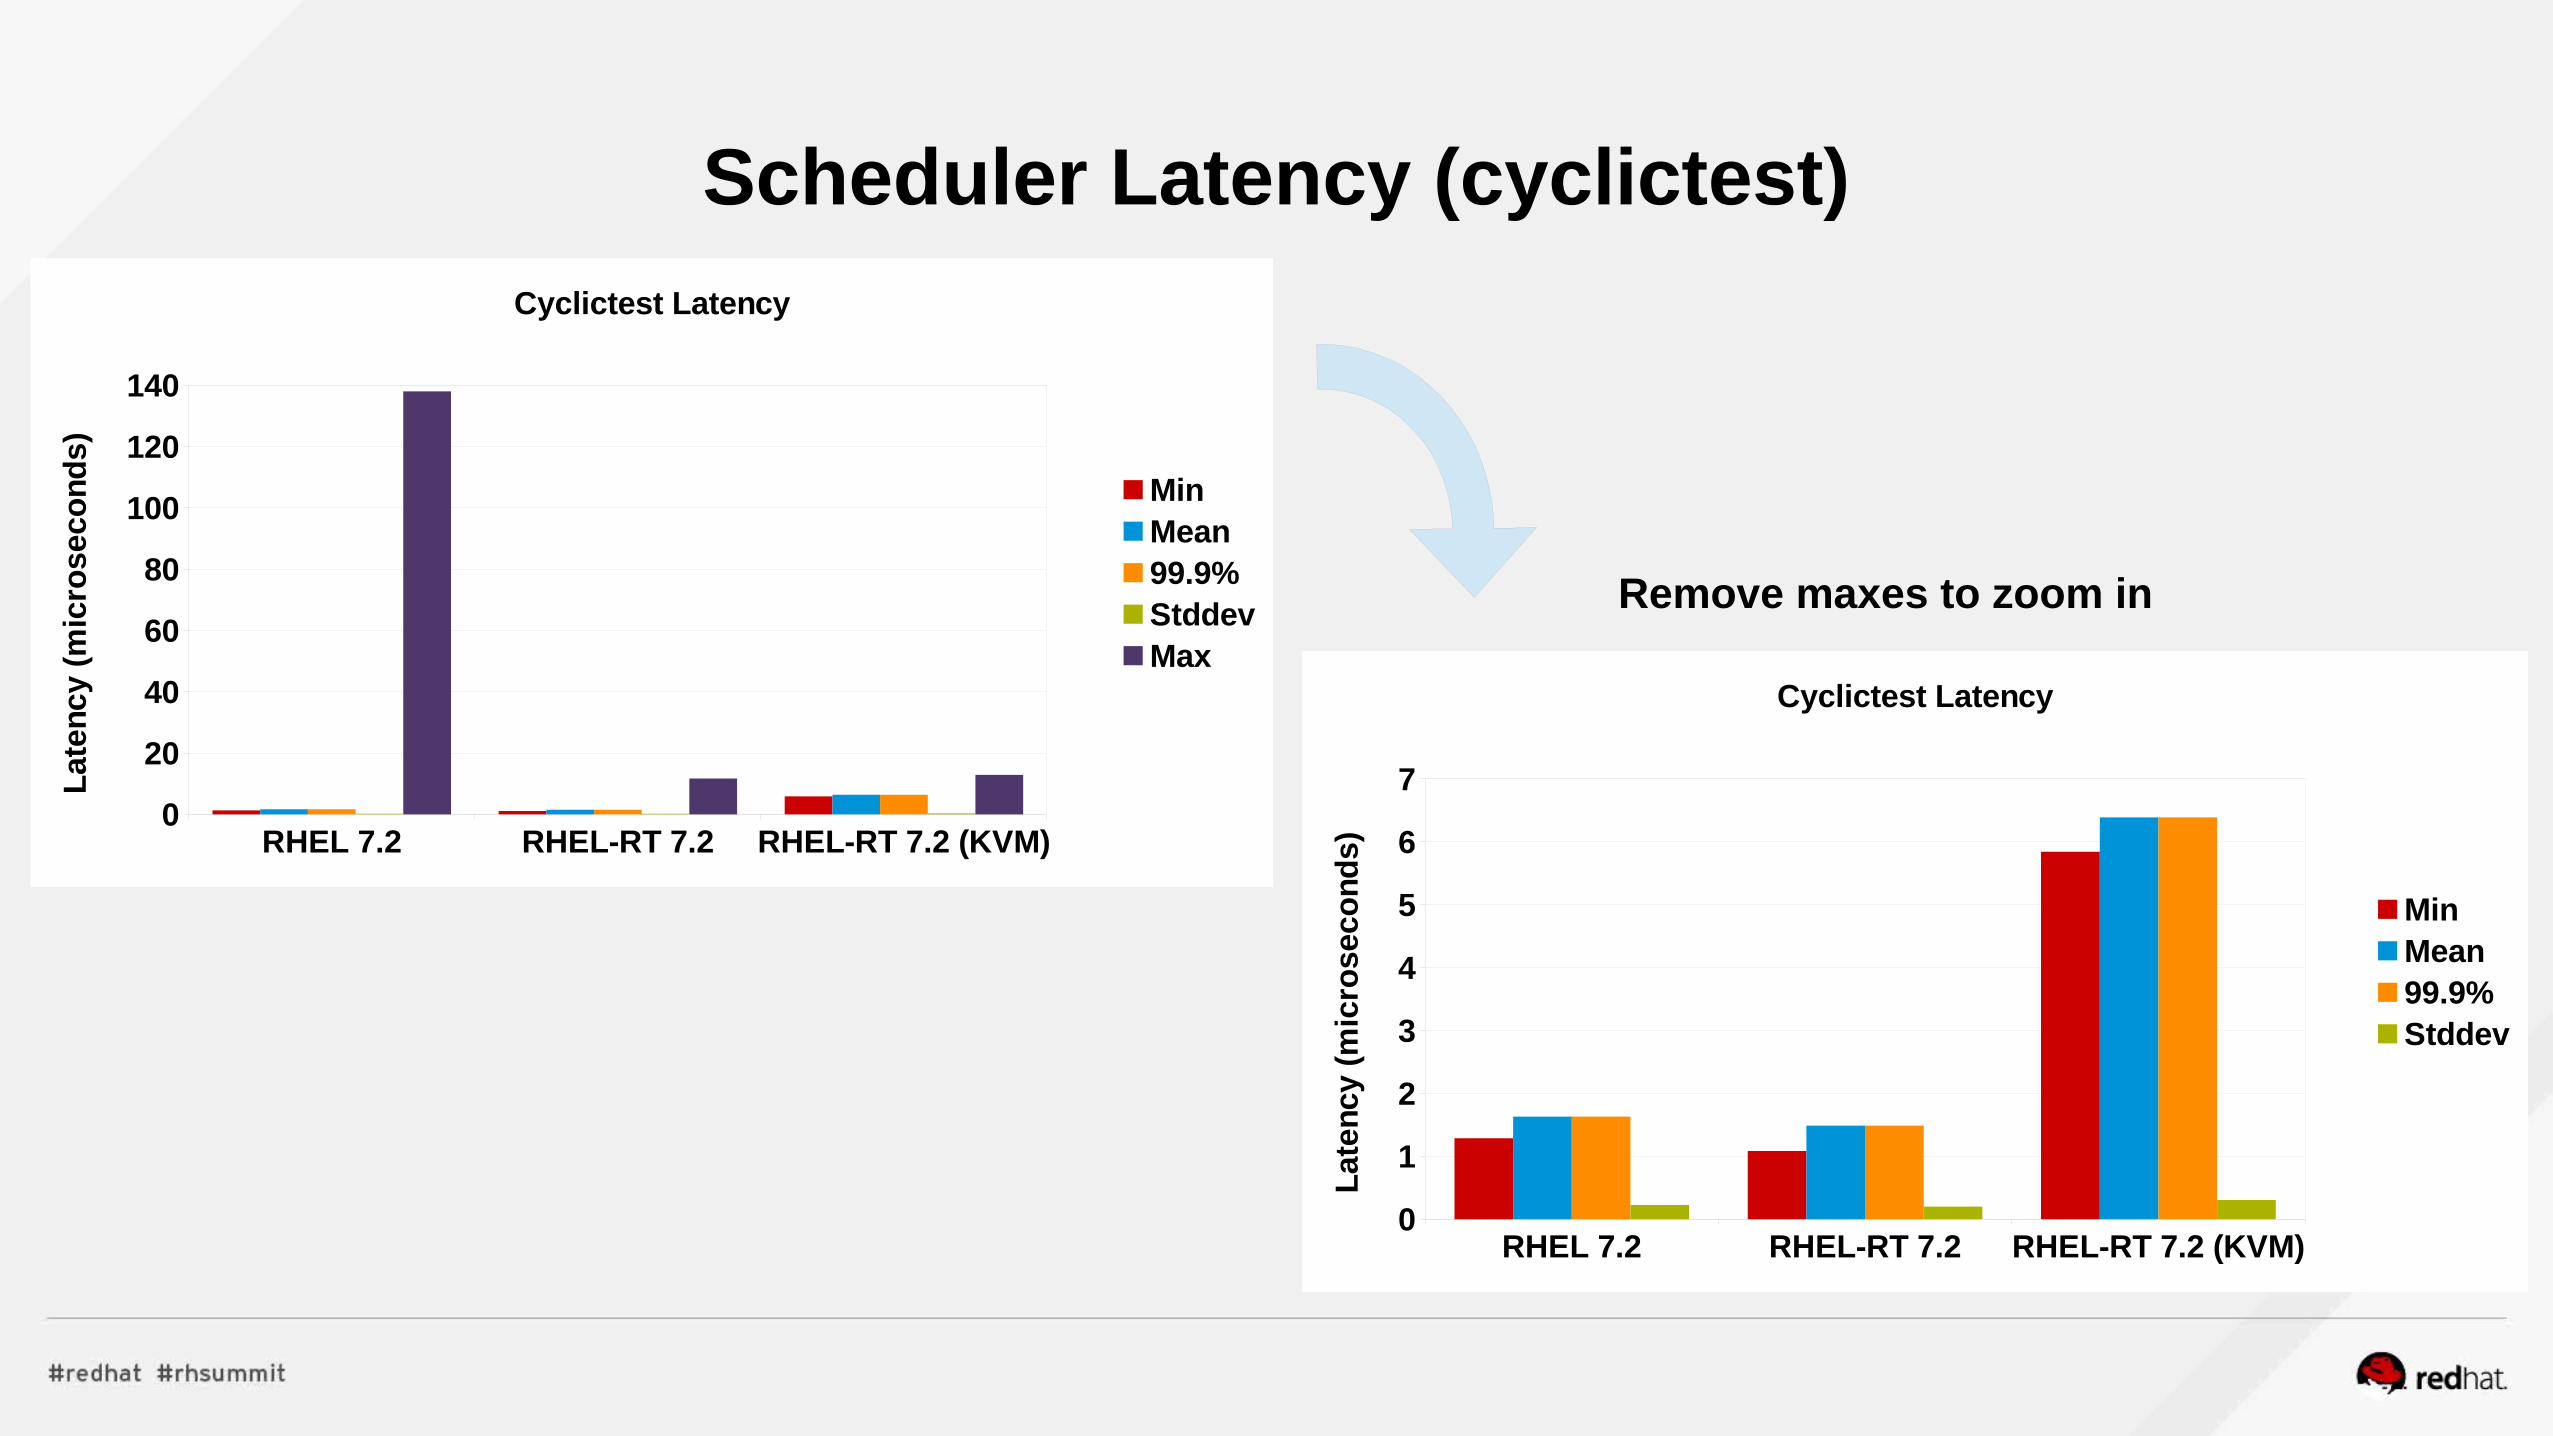
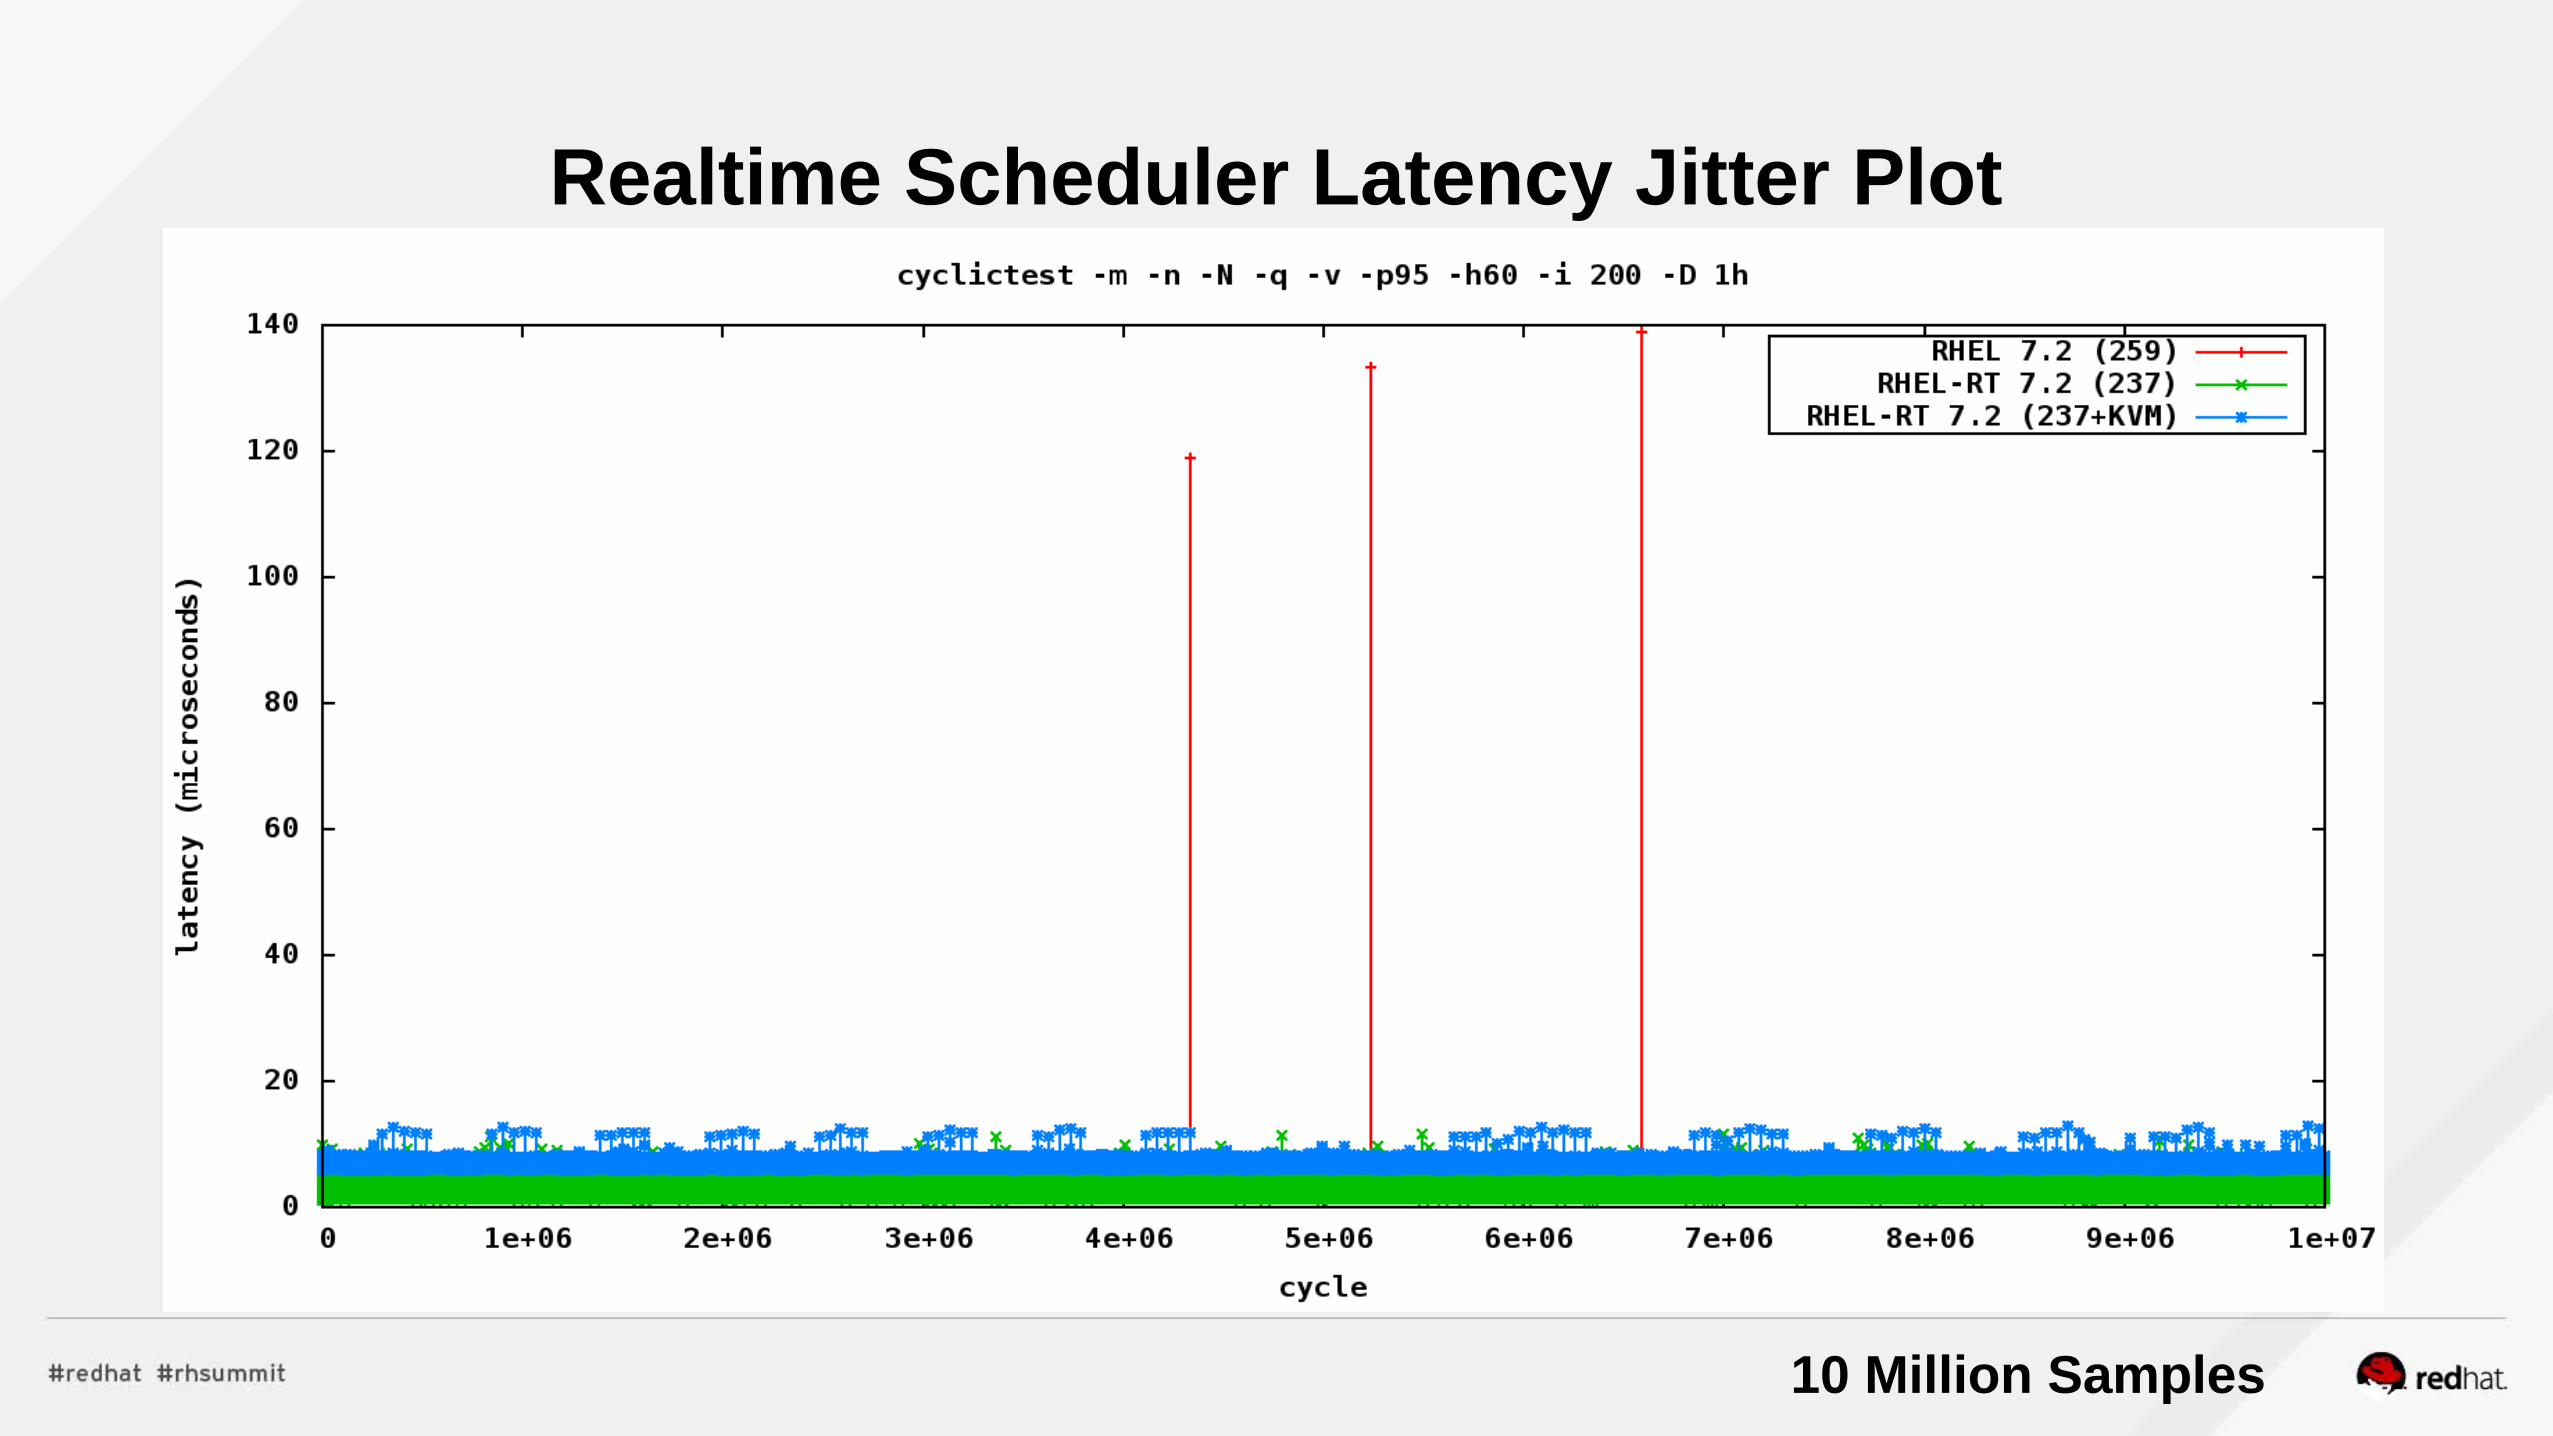
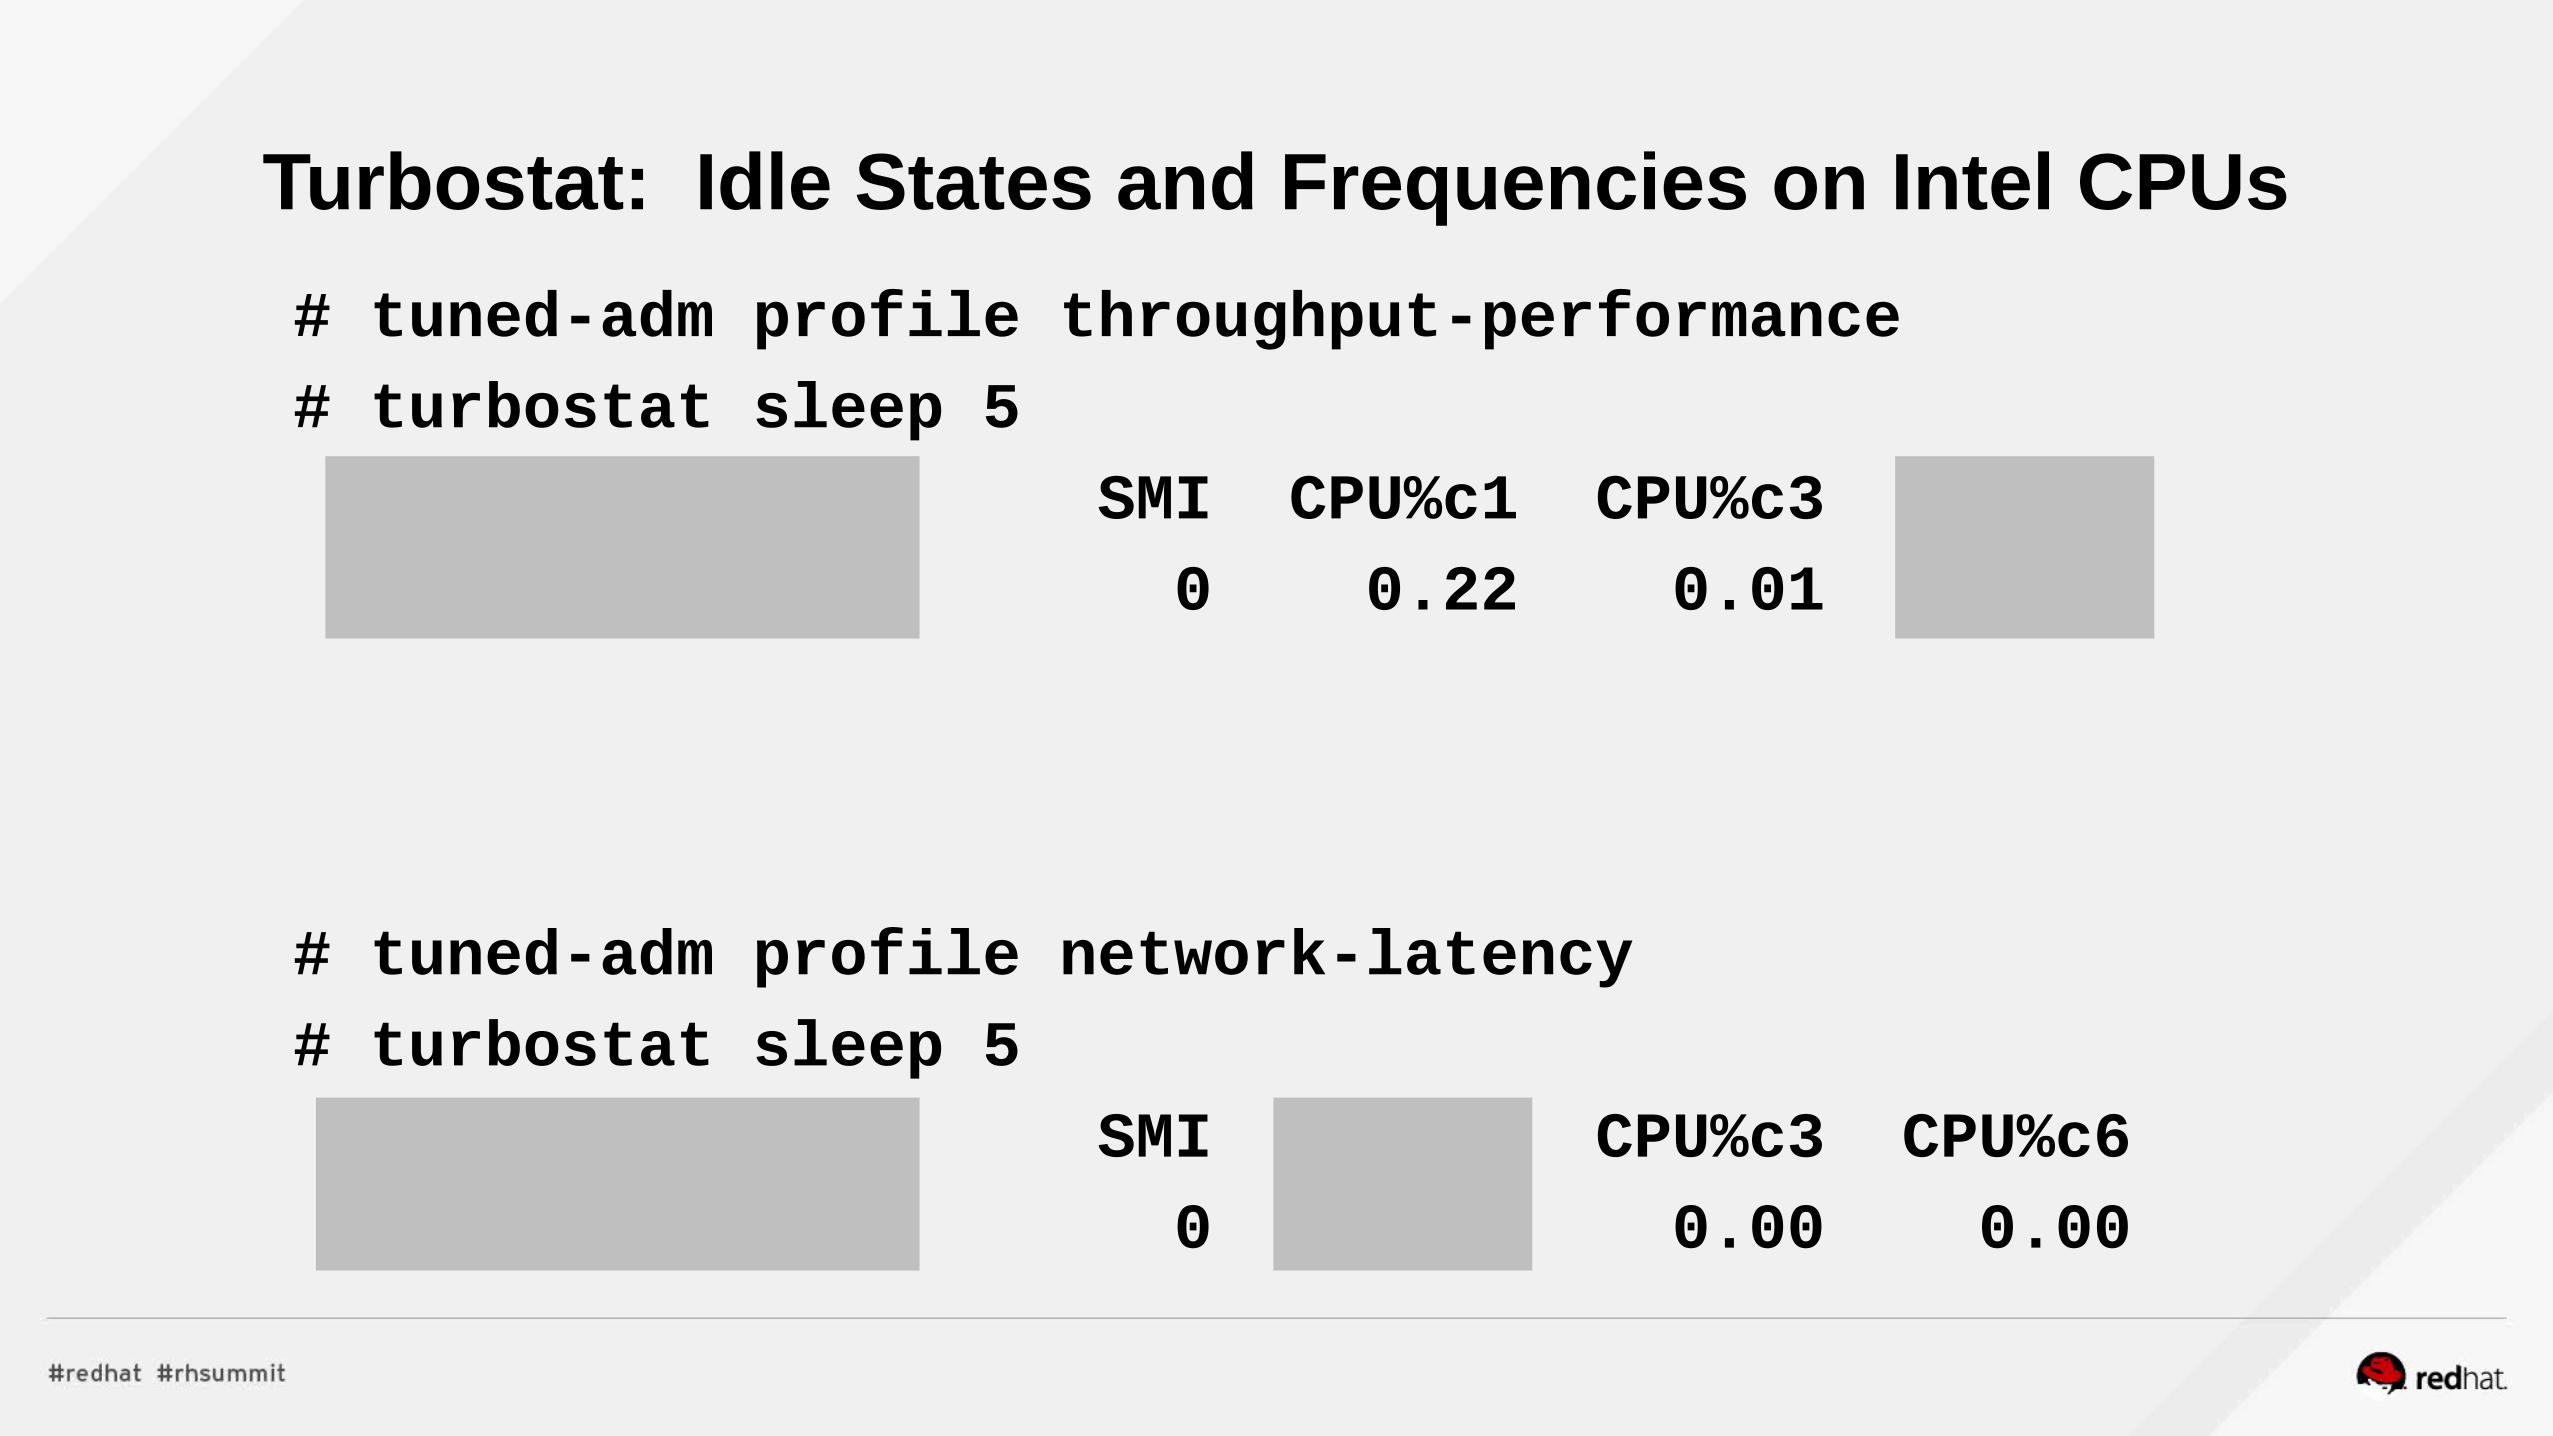
latency-performance
realtime
Realtime, Realtime KVM/NFV Tuned Profiles
realtime-virtual-host realtime-virtual-guest
network-latency
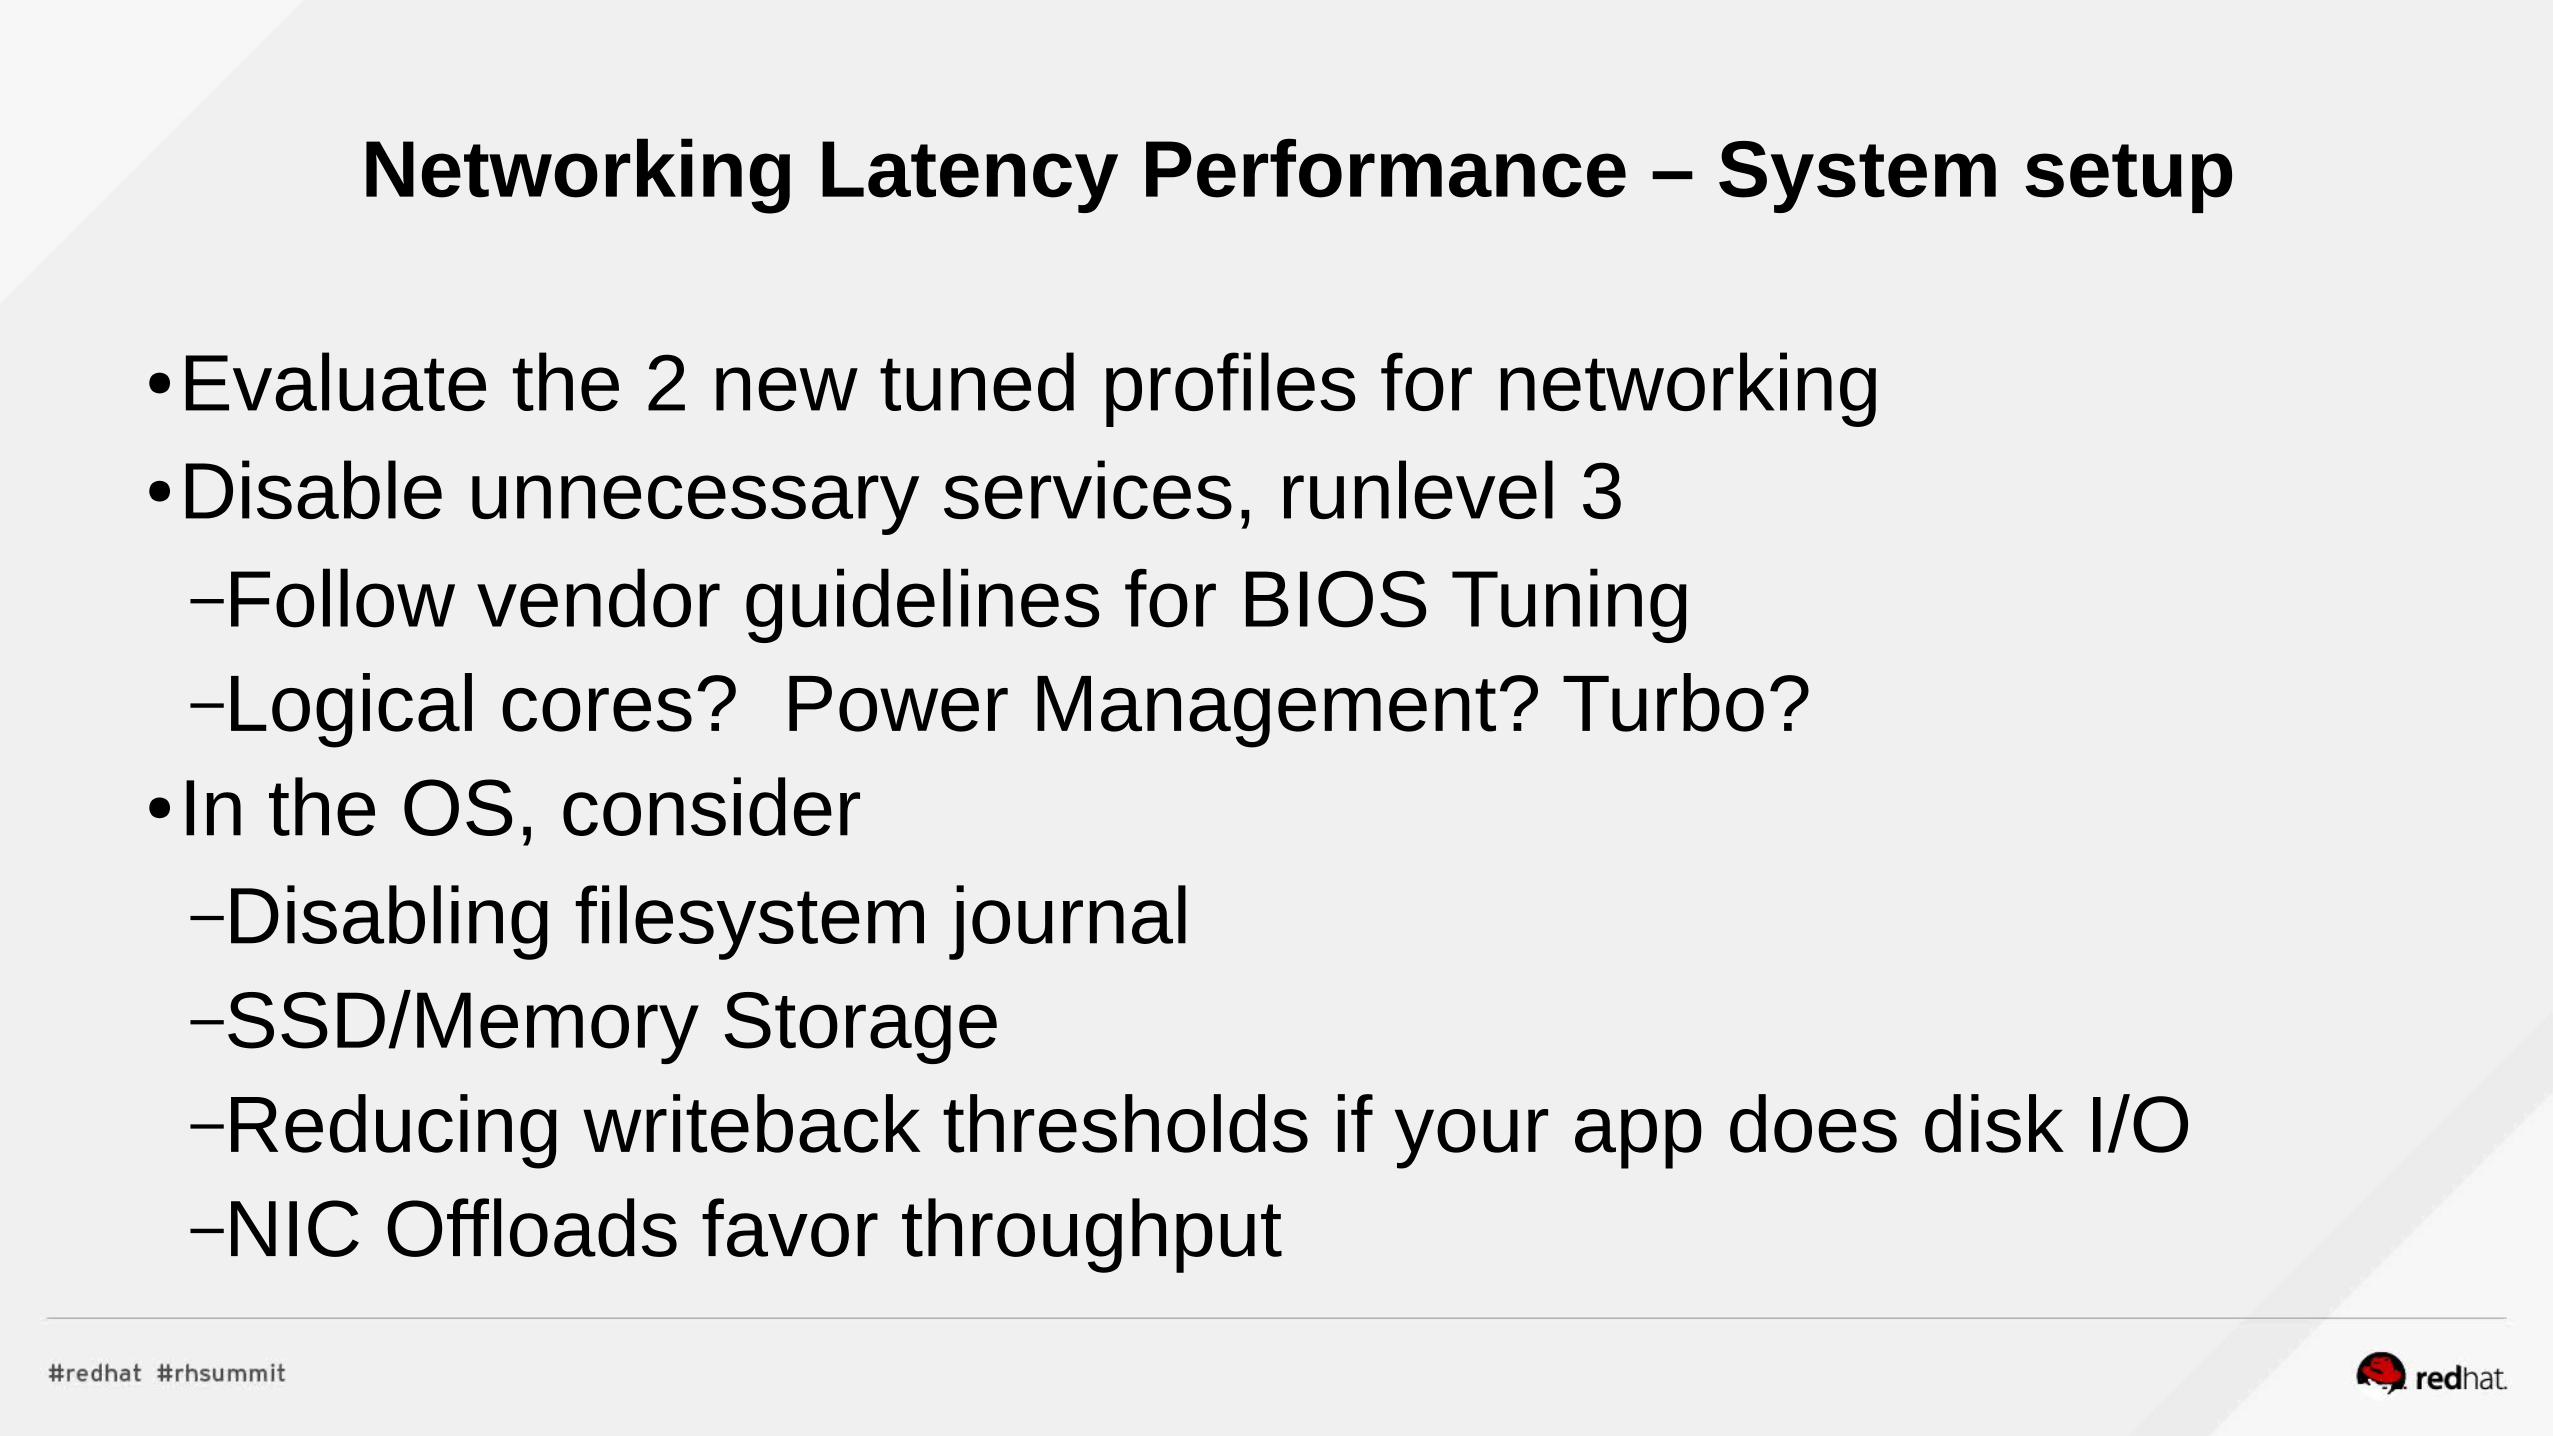
Networking Latency Performance – System setup
●Evaluate the 2 new tuned profiles for networking●Disable unnecessary services, runlevel 3–Follow vendor guidelines for BIOS Tuning–Logical cores? Power Management? Turbo?
●In the OS, consider–Disabling filesystem journal–SSD/Memory Storage–Reducing writeback thresholds if your app does disk I/O–NIC Offloads favor throughput
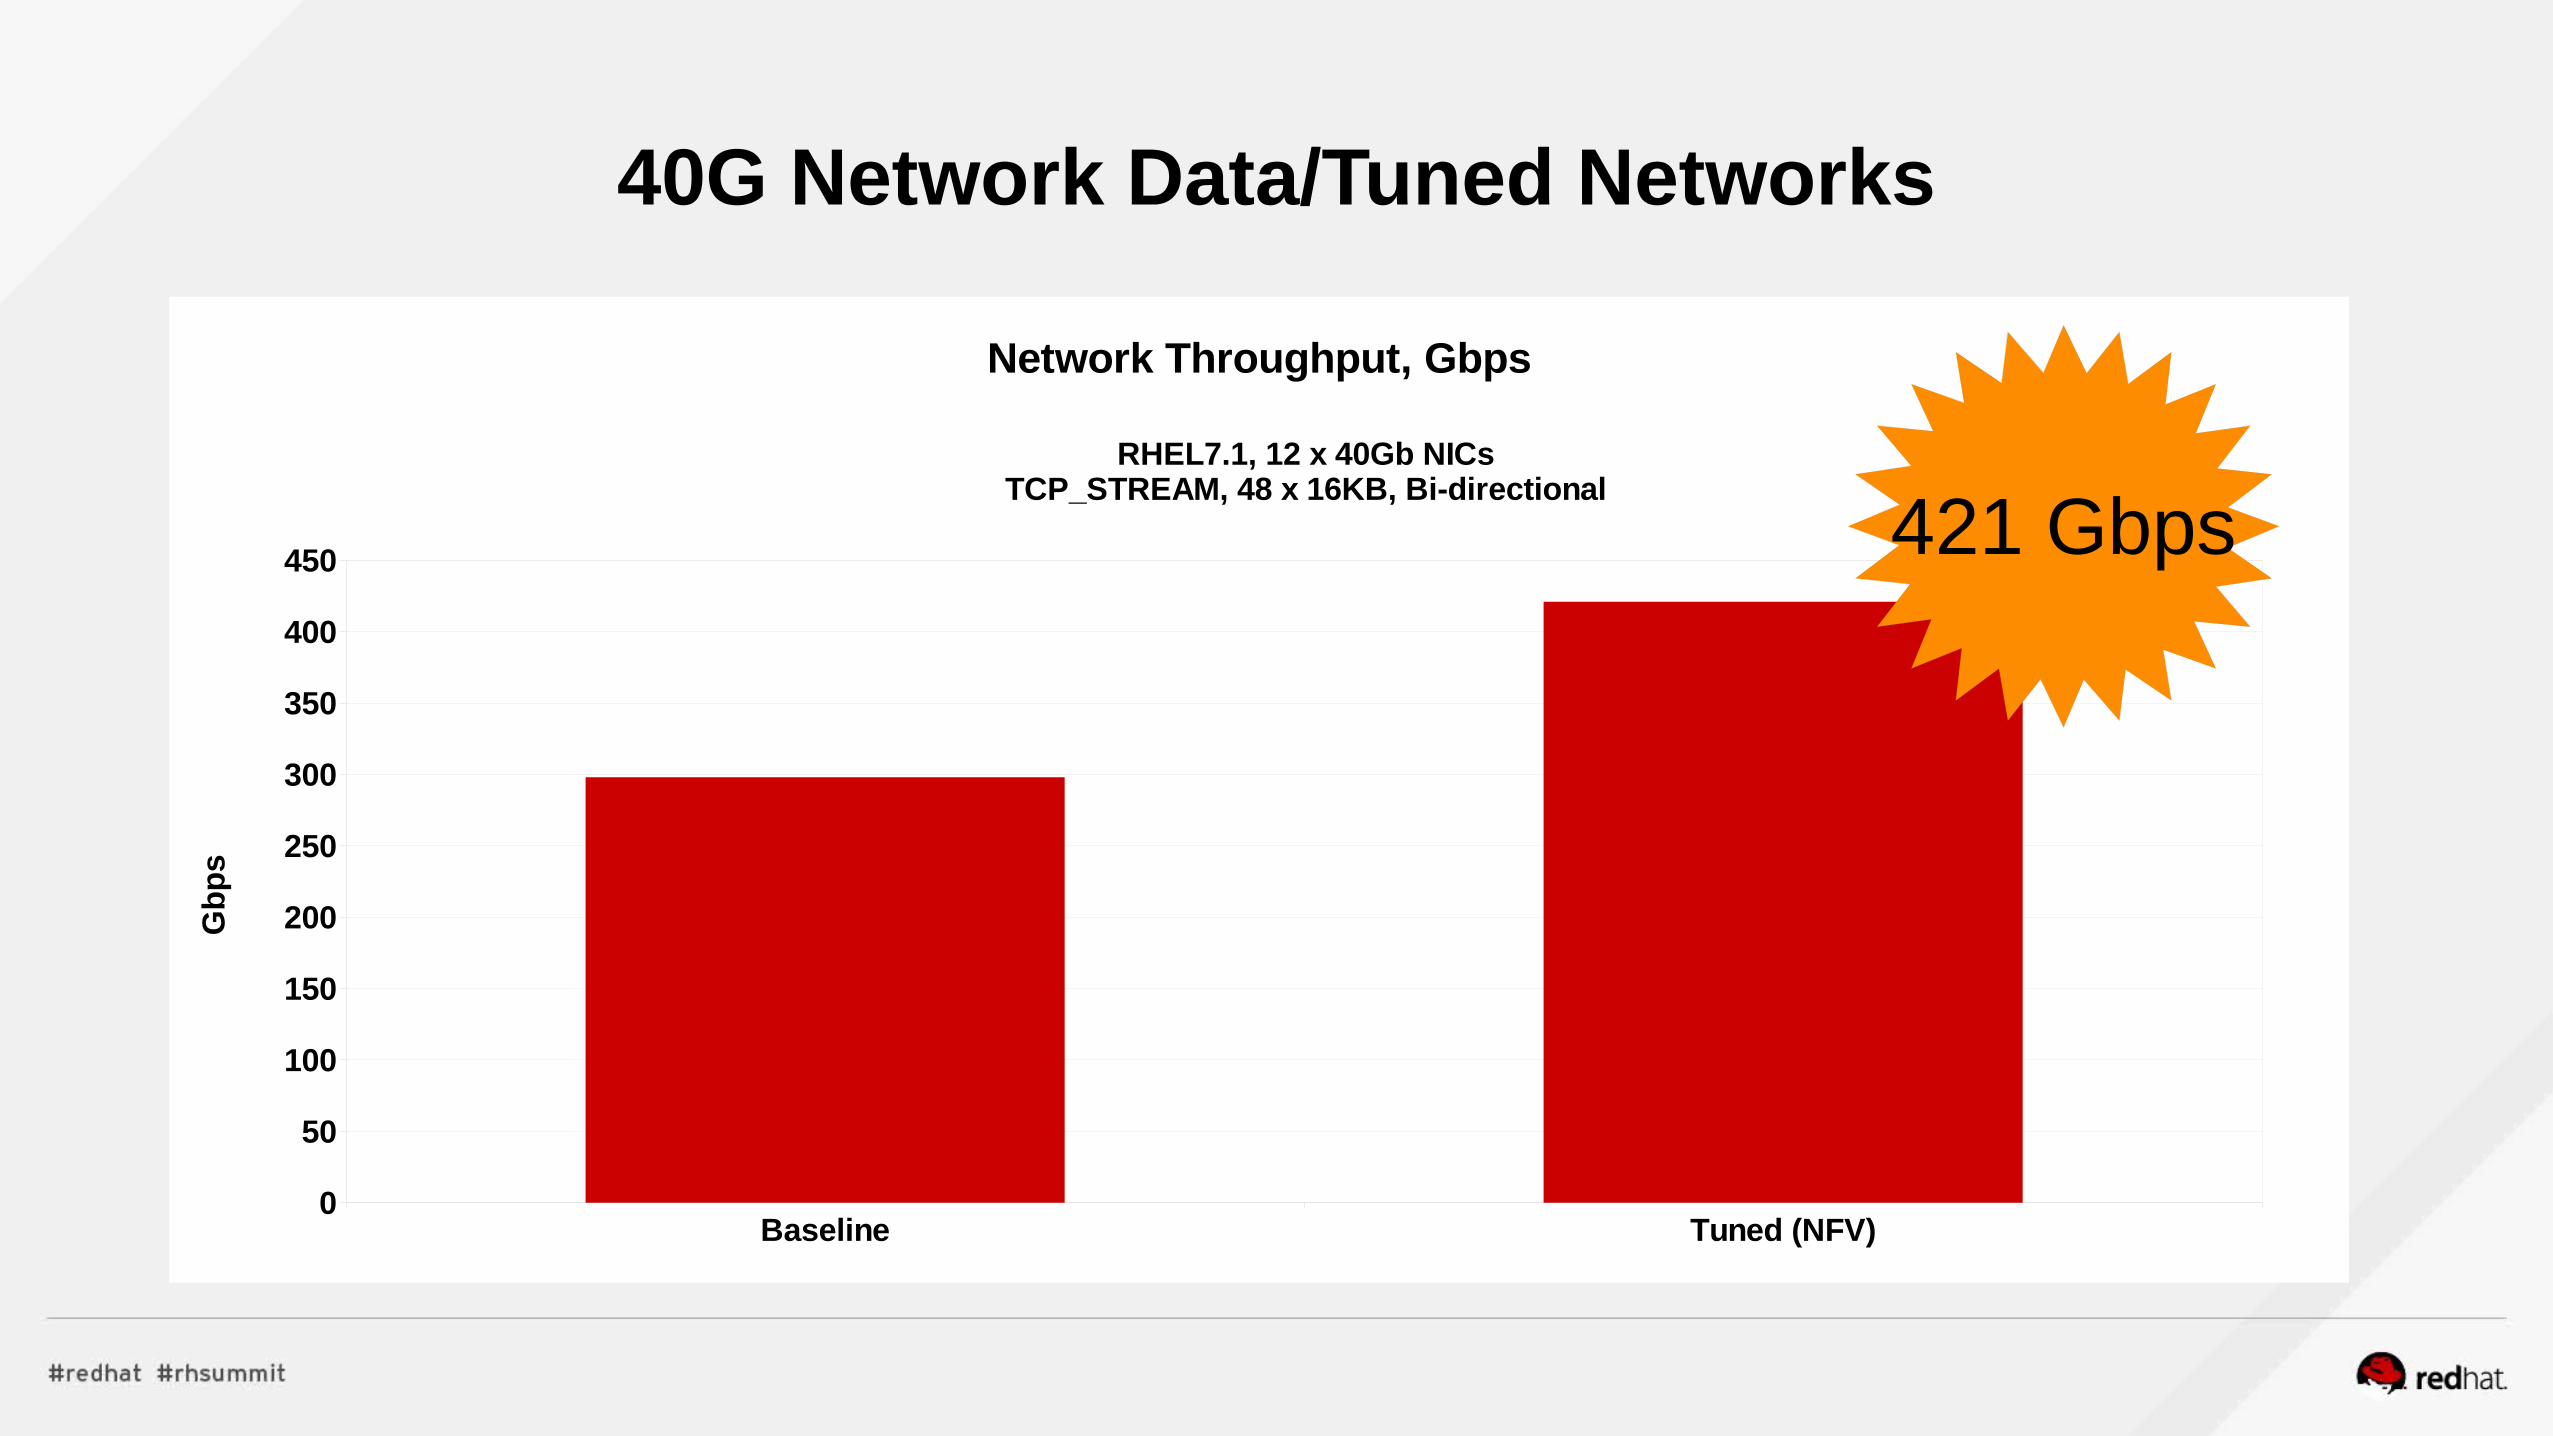
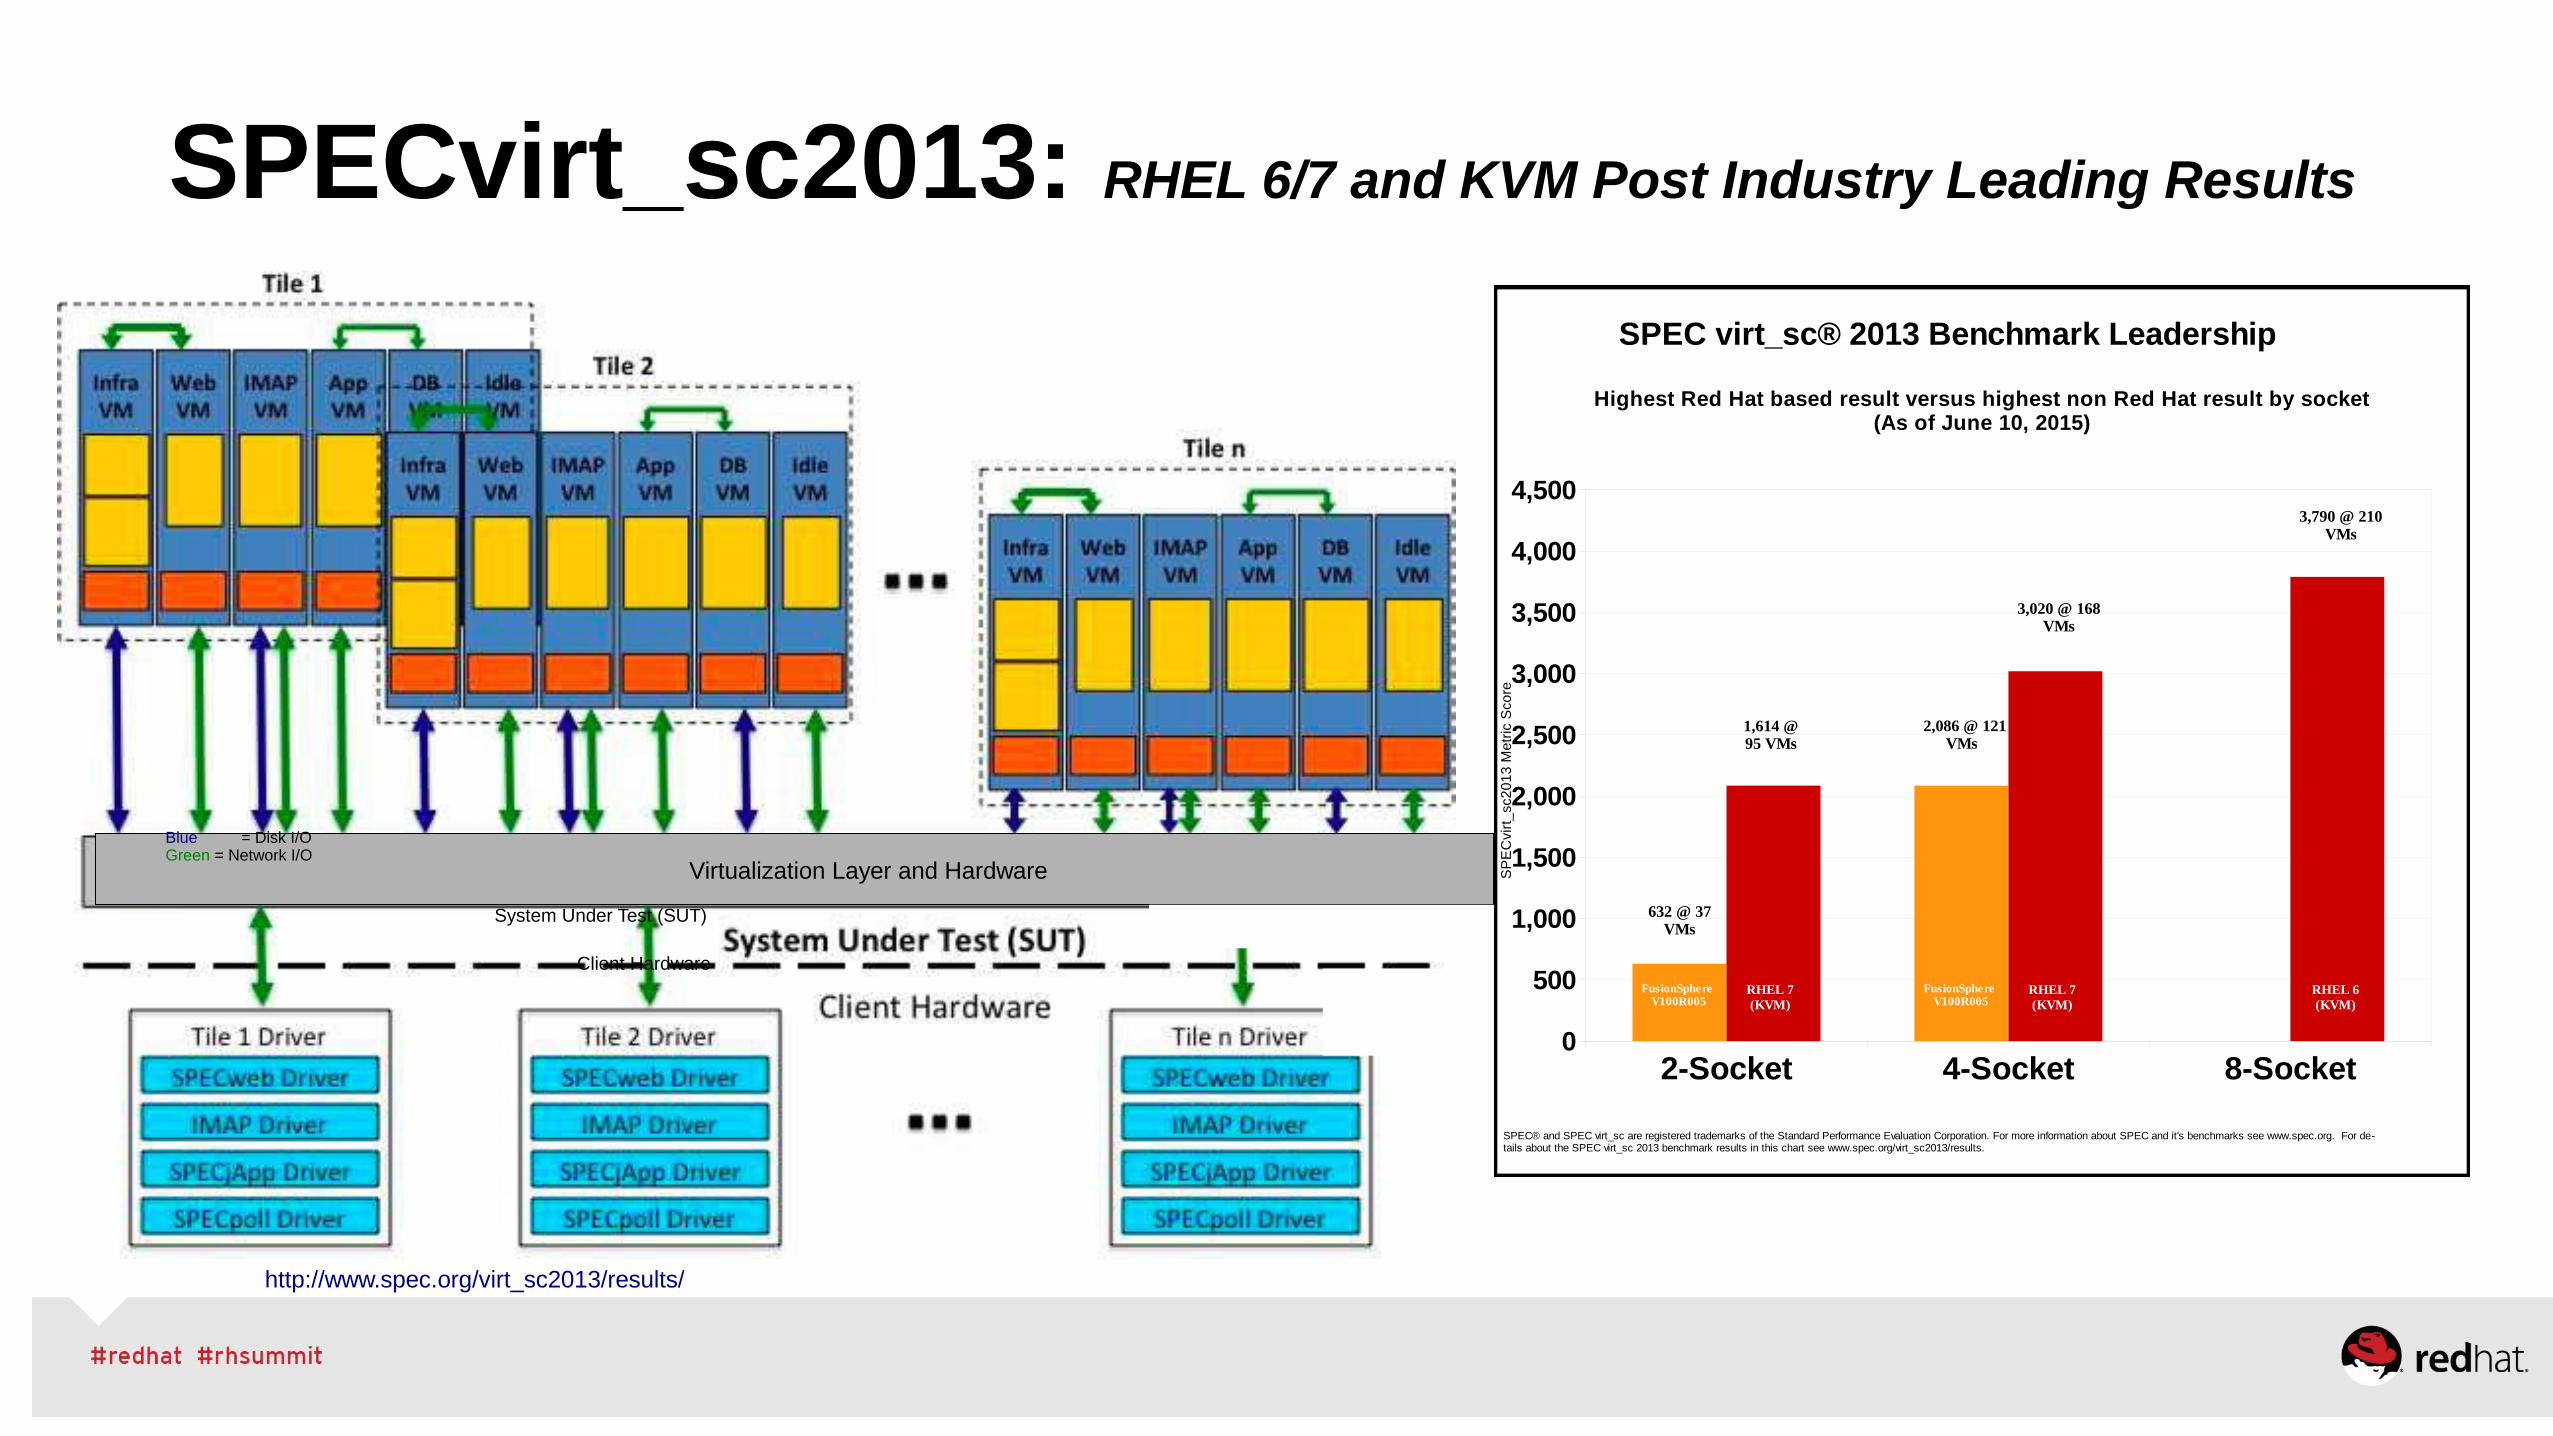
SPECvirt_sc2013: RHEL 6/7 and KVM Post Industry Leading Results
http://www.spec.org/virt_sc2013/results/
Virtualization Layer and Hardware
Blue = Disk I/OGreen = Network I/O
Client Hardware
System Under Test (SUT)
2-Socket 4-Socket 8-Socket0
500
1,000
1,500
2,000
2,500
3,000
3,500
4,000
4,500
SPEC virt_sc® 2013 Benchmark Leadership
Highest Red Hat based result versus highest non Red Hat result by socket(As of June 10, 2015)
SP
EC
virt
_sc
20
13
Me
tric
Sco
re
1,614 @ 95 VMs
2,086 @ 121 VMss
3,020 @ 168 VMs
3,790 @ 210 VMs
FusionSphere V100R005
FusionSphere V100R005
RHEL 7 (KVM)
RHEL 7 (KVM)
RHEL 6 (KVM)
SPEC® and SPEC virt_sc are registered trademarks of the Standard Performance Evaluation Corporation. For more information about SPEC and it's benchmarks see www.spec.org. For de-tails about the SPEC virt_sc 2013 benchmark results in this chart see www.spec.org/virt_sc2013/results.
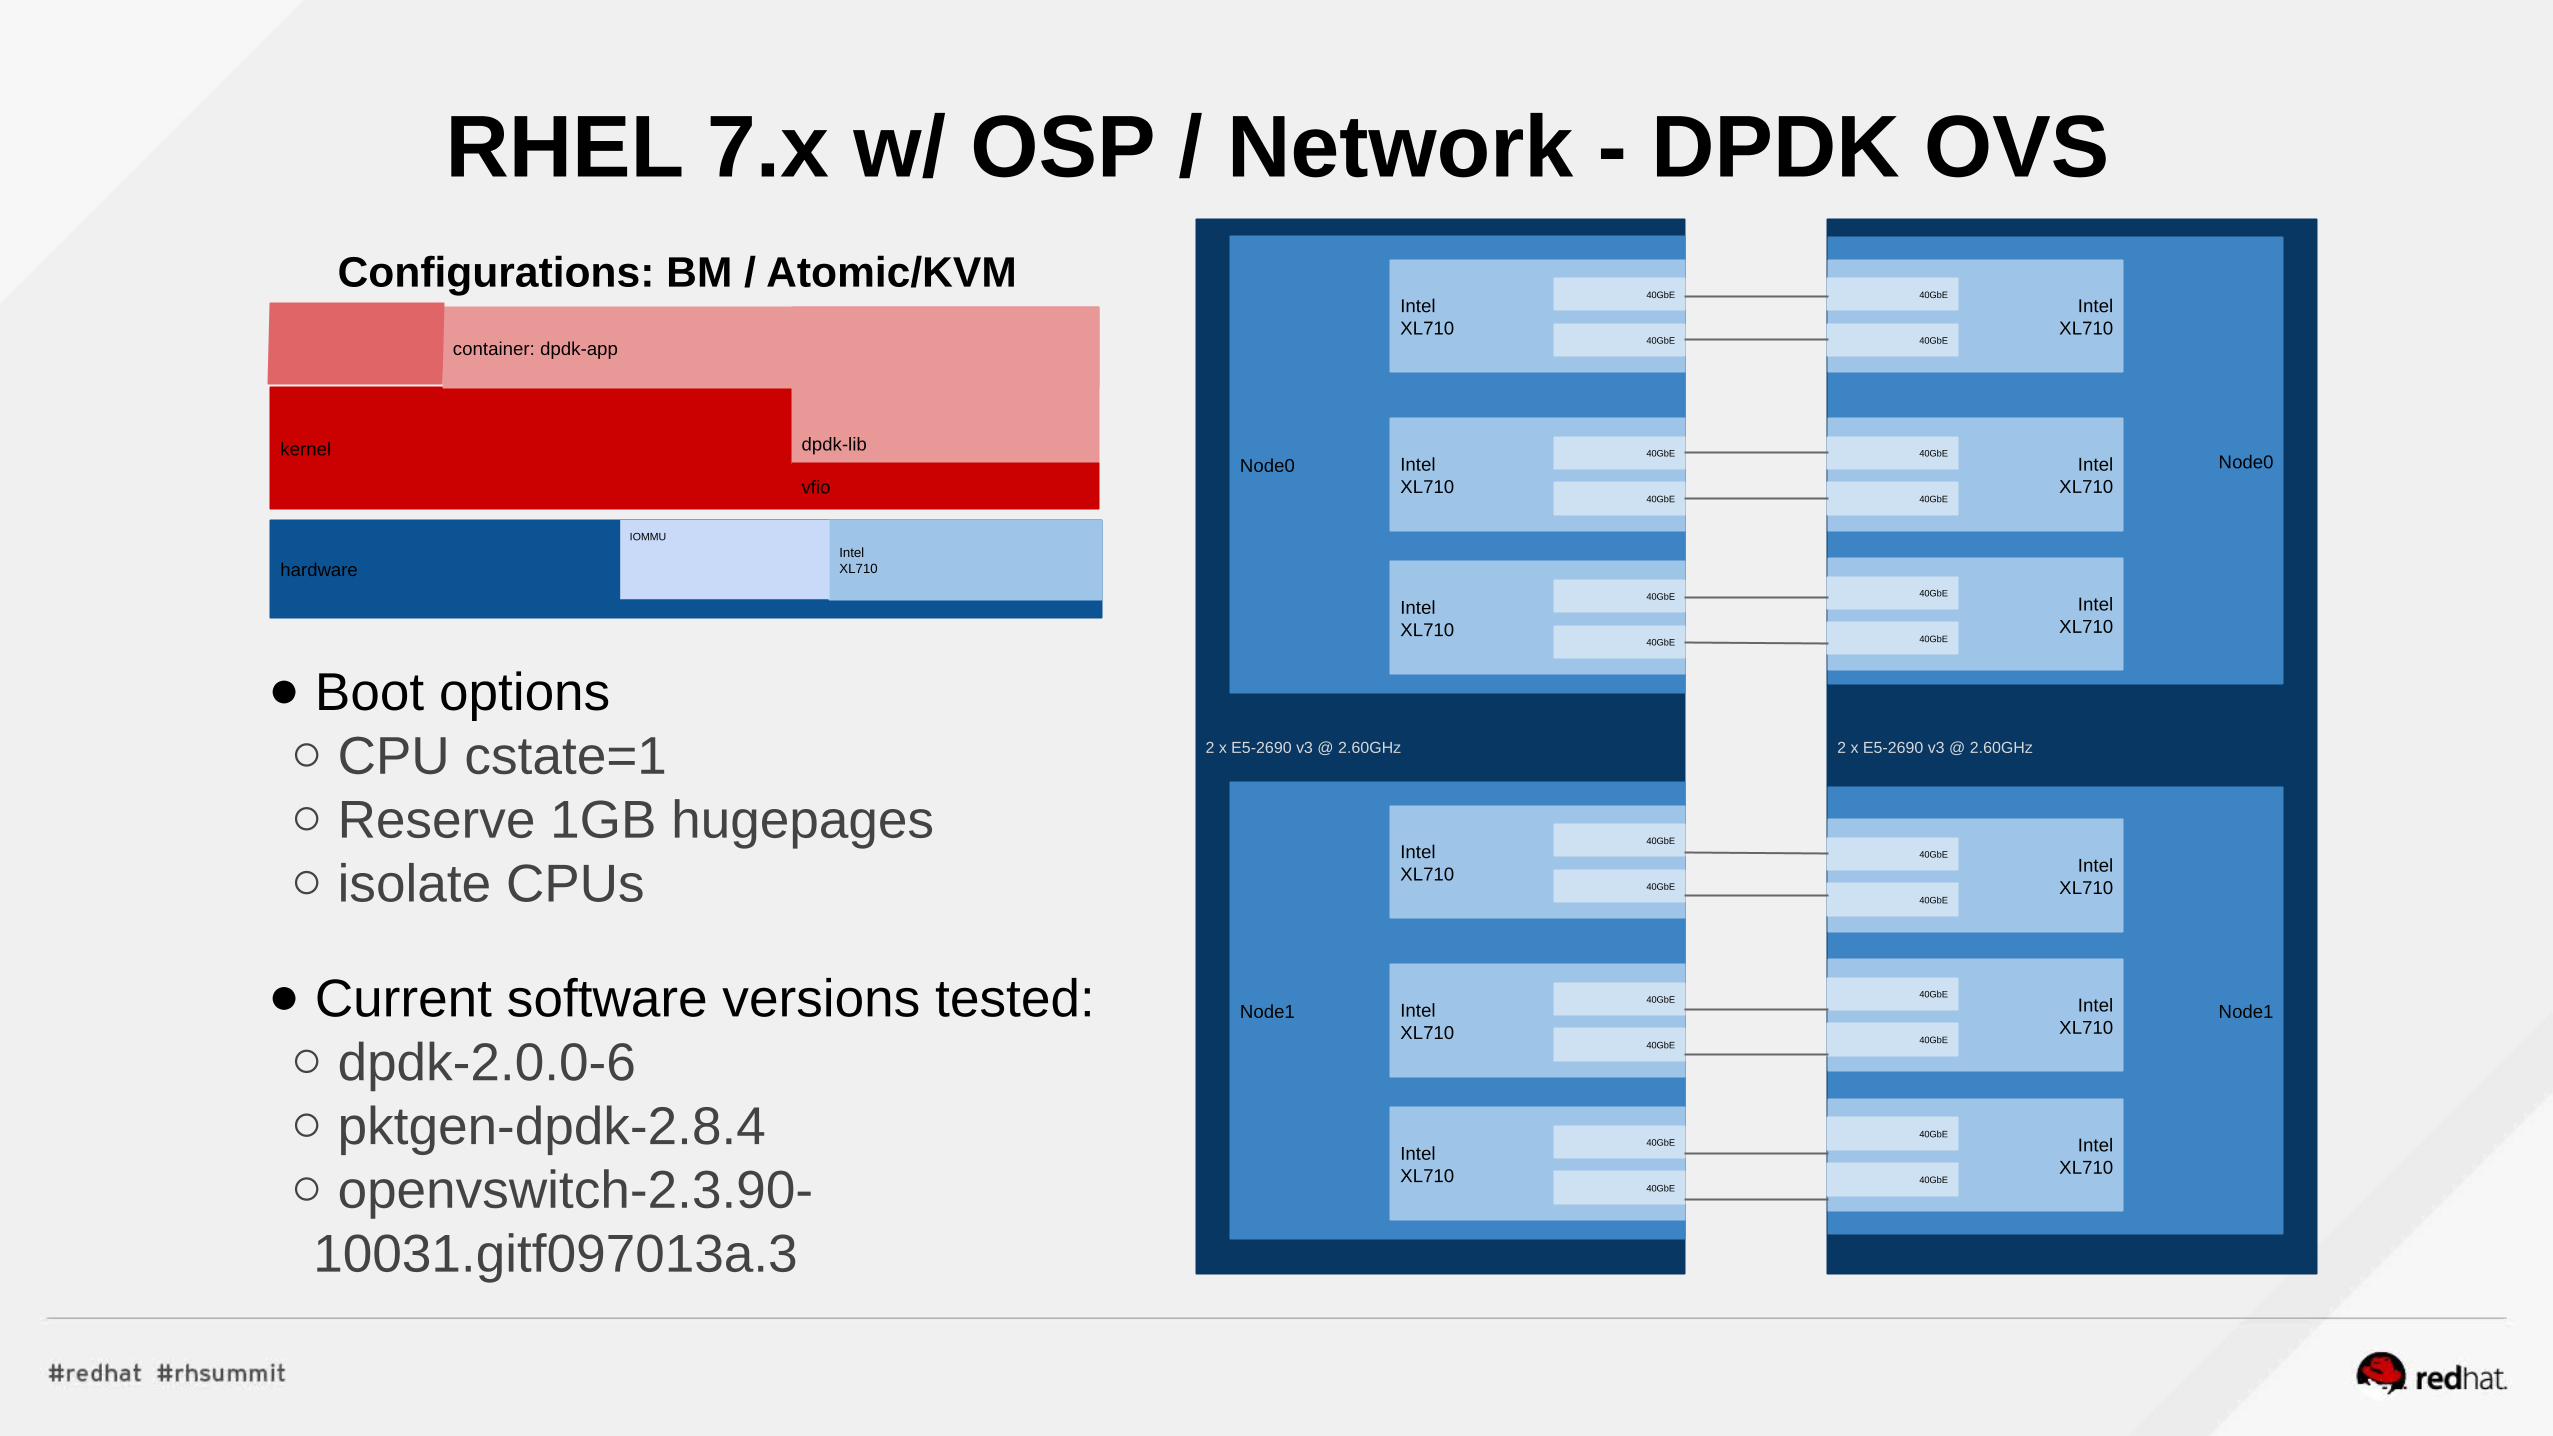
● Boot options○ CPU cstate=1○ Reserve 1GB hugepages○ isolate CPUs
● Current software versions tested:○ dpdk-2.0.0-6○ pktgen-dpdk-2.8.4○ openvswitch-2.3.90-10031.gitf097013a.3
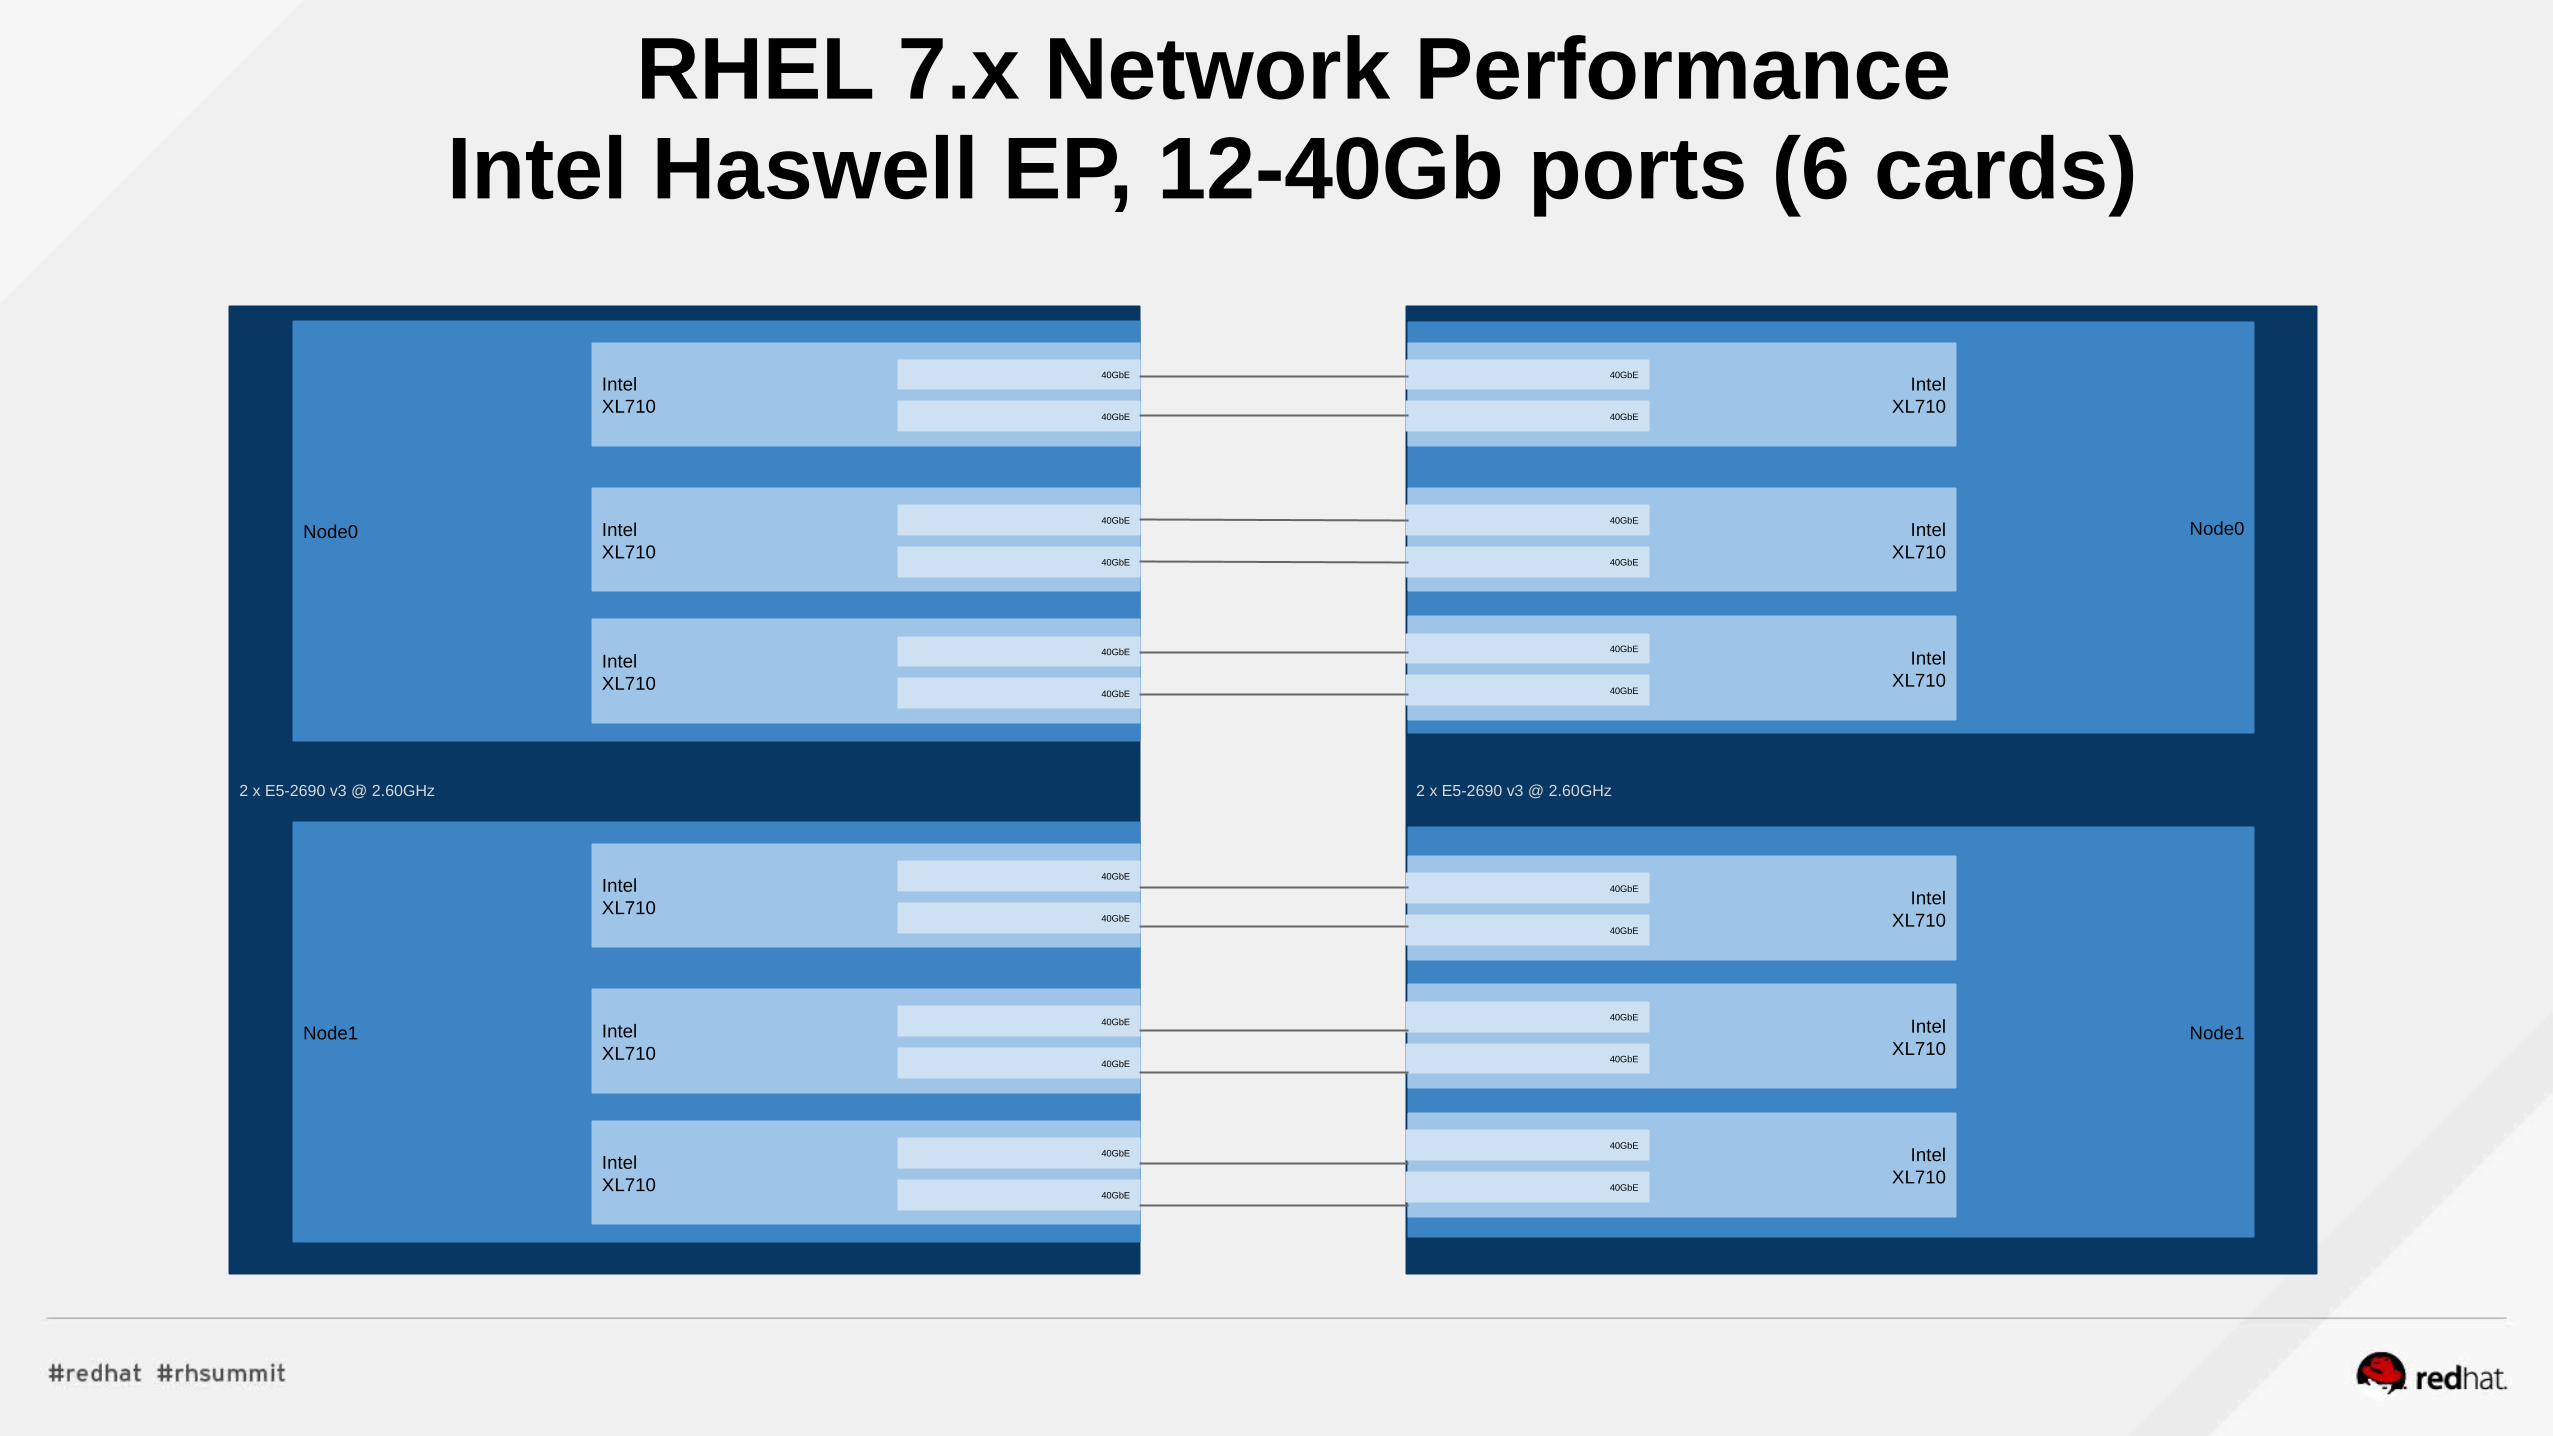
RHEL 7.x w/ OSP / Network - DPDK OVS
2 x E5-2690 v3 @ 2.60GHz
Node0 IntelXL710
40GbE
40GbE
2 x E5-2690 v3 @ 2.60GHz
Node0IntelXL710
40GbE
40GbE
IntelXL710
40GbE
40GbE
IntelXL710
40GbE
40GbE
Node1 IntelXL710
40GbE
40GbE
IntelXL710
40GbE
IntelXL710
40GbE
40GbE
40GbE
IntelXL710
40GbE
40GbE
IntelXL710
40GbE
40GbE
Node1IntelXL710
40GbE
40GbE
IntelXL710
40GbE
IntelXL710
40GbE
40GbE
40GbE
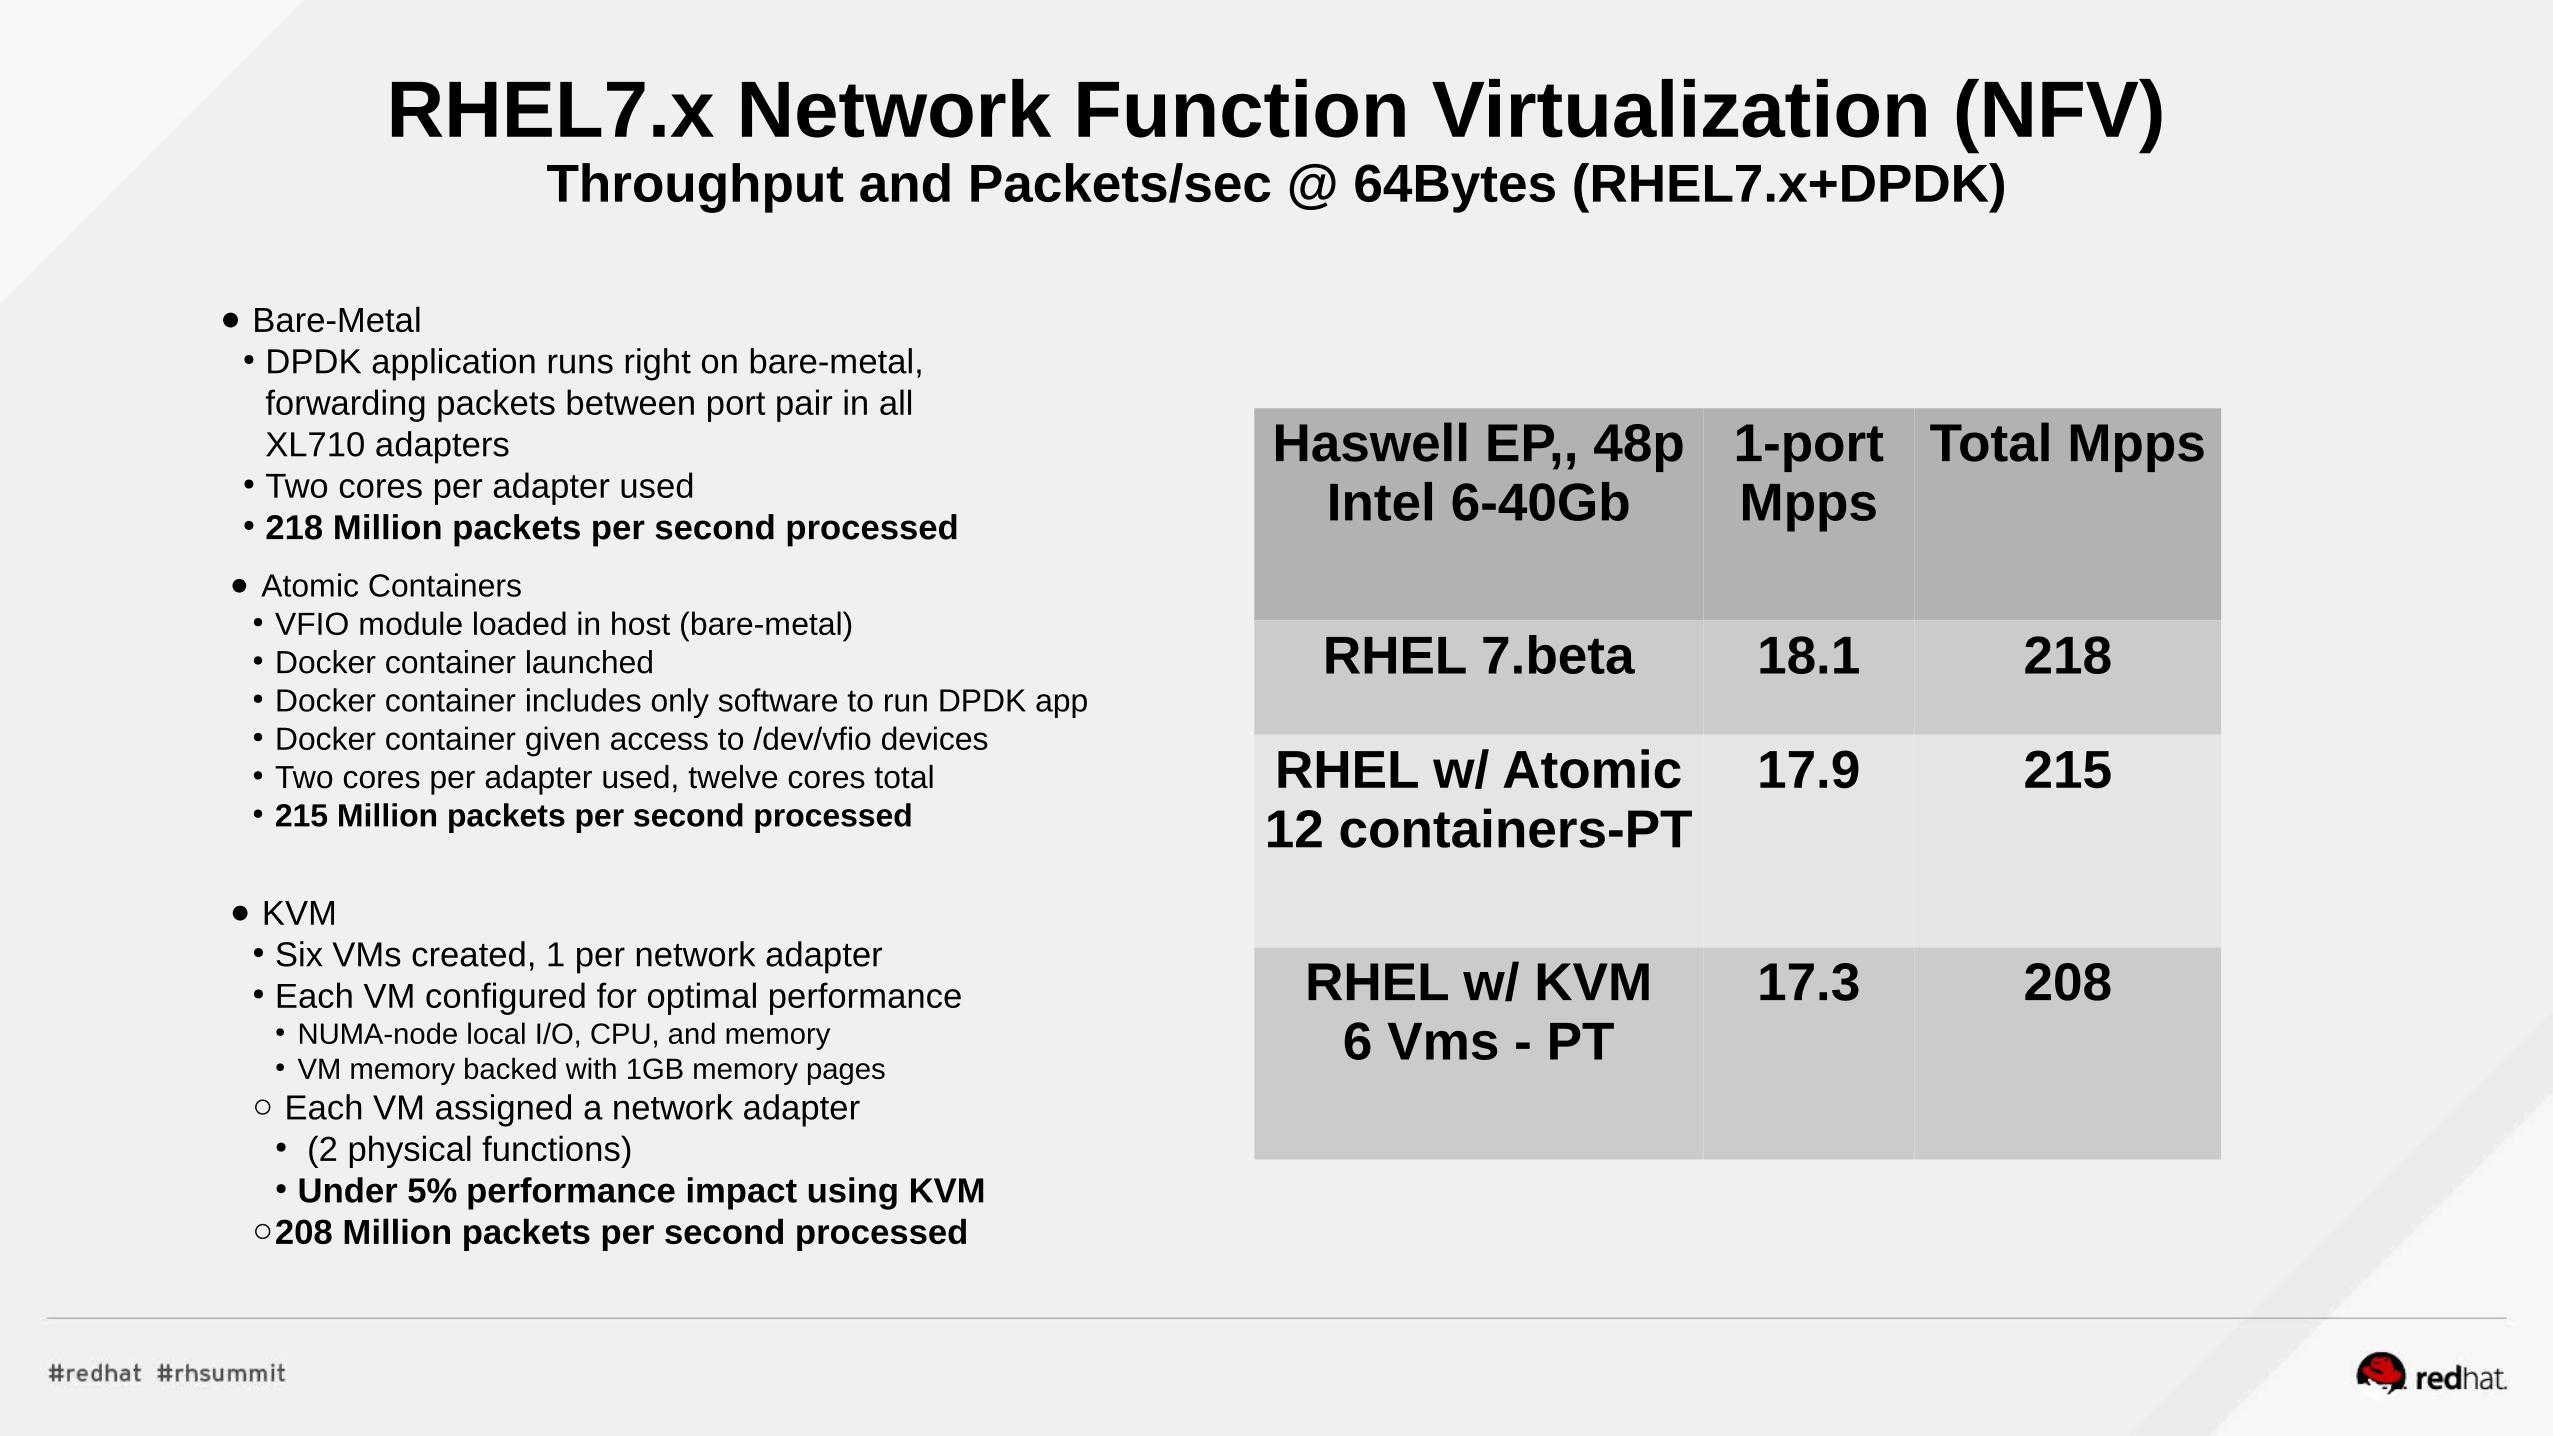
● KVM ● Six VMs created, 1 per network adapter● Each VM configured for optimal performance
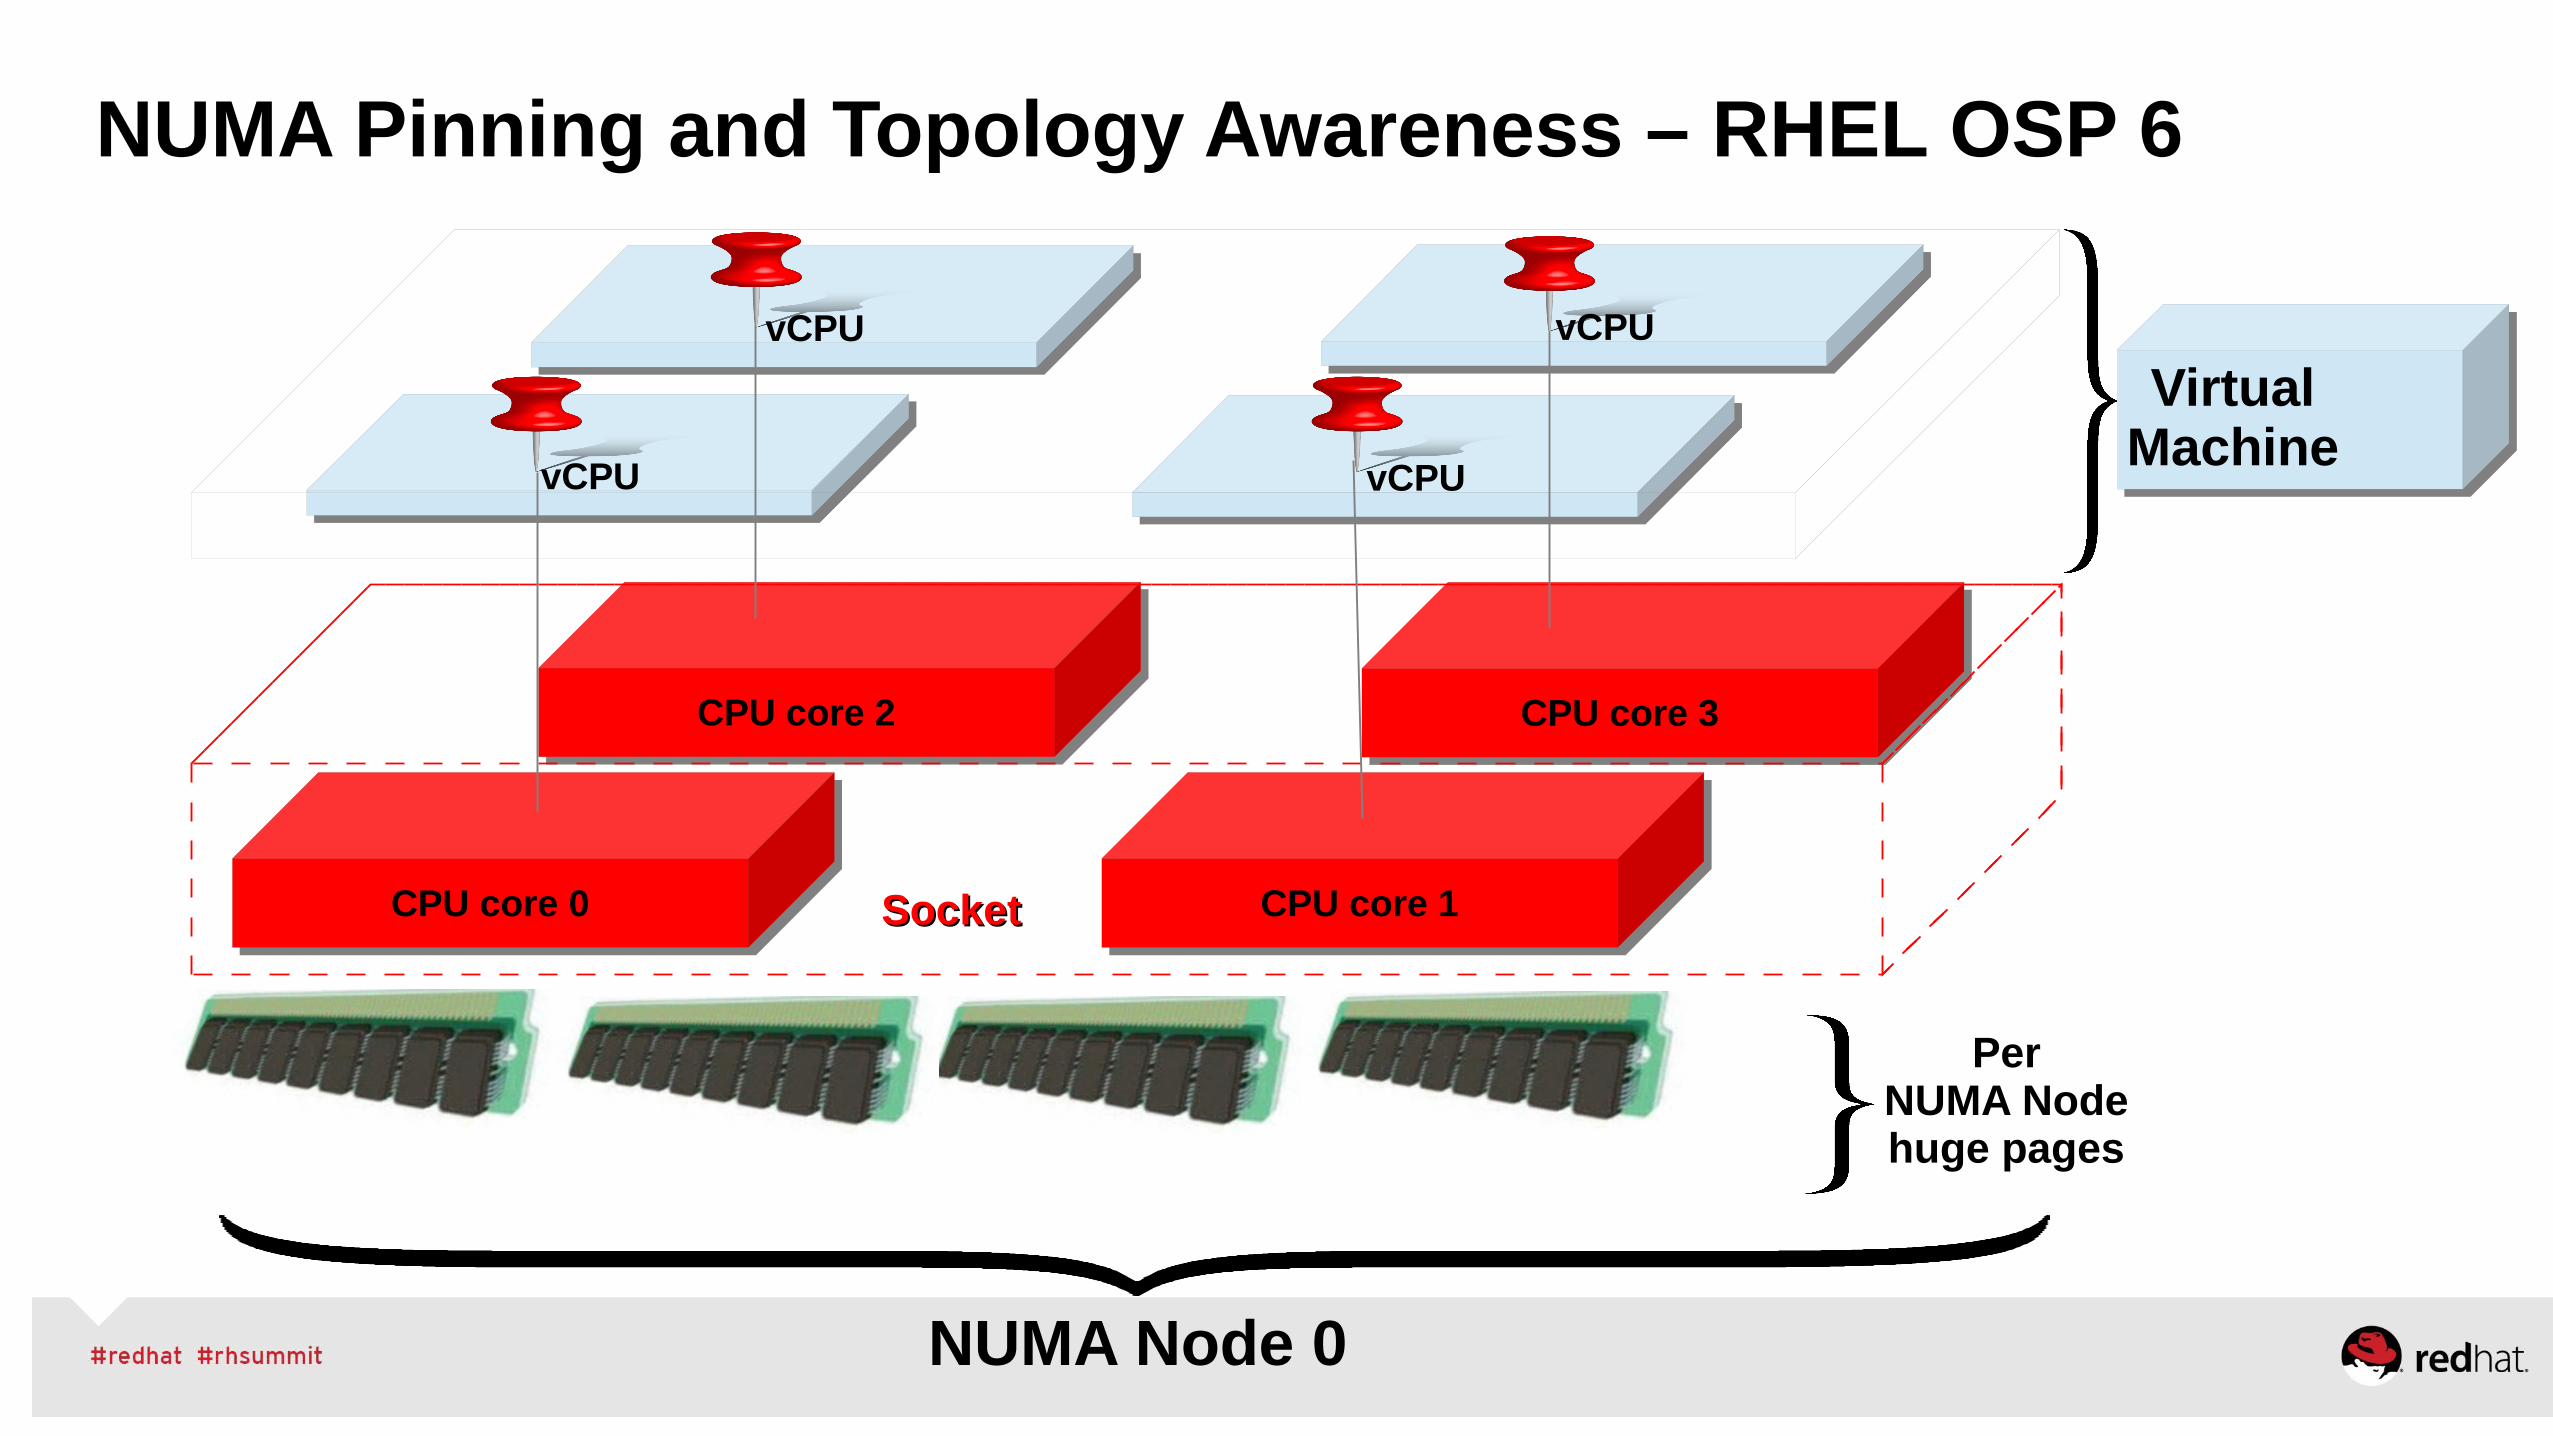
● NUMA-node local I/O, CPU, and memory● VM memory backed with 1GB memory pages
○ Each VM assigned a network adapter● (2 physical functions)● Under 5% performance impact using KVM
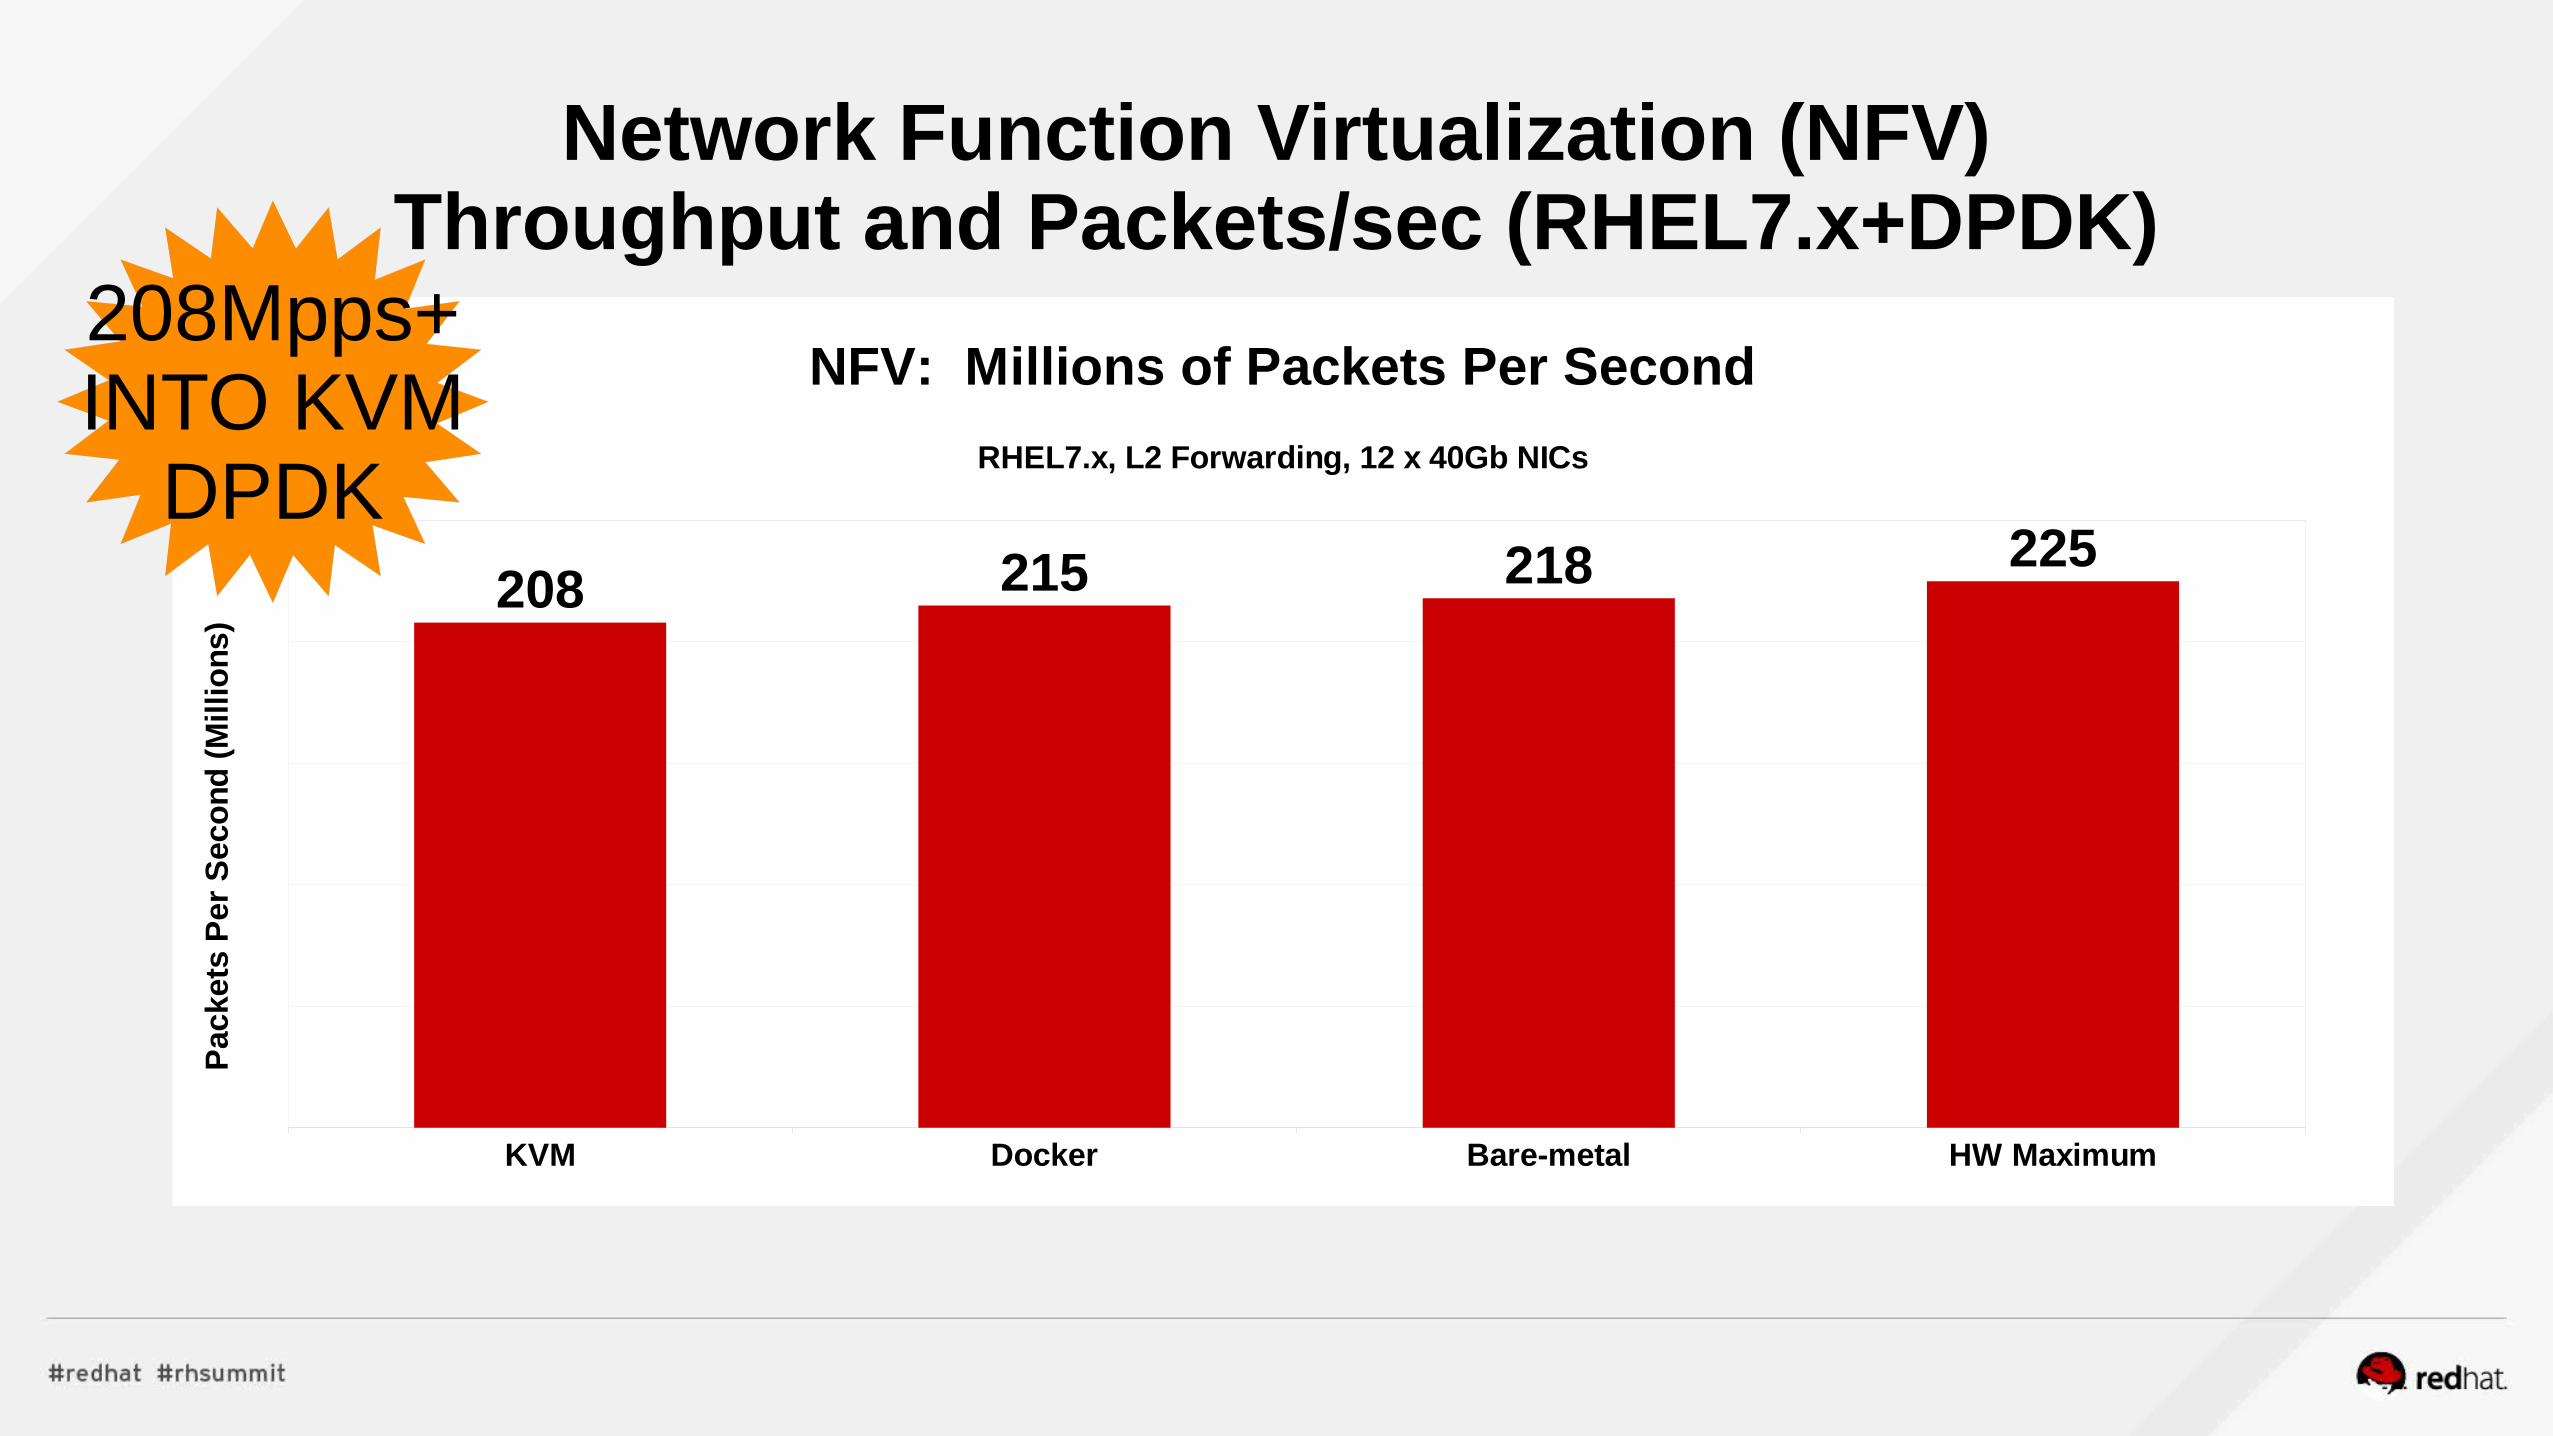
○208 Million packets per second processed
Haswell EP,, 48p Intel 6-40Gb
1-port Mpps
Total Mpps
RHEL 7.beta 18.1 218
RHEL w/ Atomic 12 containers-PT
17.9 215
RHEL w/ KVM6 Vms - PT
17.3 208
● Atomic Containers● VFIO module loaded in host (bare-metal)● Docker container launched● Docker container includes only software to run DPDK app● Docker container given access to /dev/vfio devices● Two cores per adapter used, twelve cores total● 215 Million packets per second processed
● Bare-Metal ● DPDK application runs right on bare-metal,
forwarding packets between port pair in all XL710 adapters
● Two cores per adapter used● 218 Million packets per second processed
RHEL7.x Network Function Virtualization (NFV)Throughput and Packets/sec @ 64Bytes (RHEL7.x+DPDK)
RHEL RHS Tuning w/ RHEV/RHEL OSP (tuned)
•Ceph and Gluster – (visit Summit talks)
•XFS mkfs -n size=8192, mount inode64, noatime
•RHS server: tuned-adm profile rhs-virtualization
• Increase in readahead, lower dirty ratio's
•KVM host: tuned-adm profile virtual-host
•Better response time shrink guest block device queue
•/sys/block/vda/queue/nr_request (16 or 8)
•Best sequential read throughput, raise VM read-ahead
•Manually Tune● NUMA – via numactl, monitor numastat -c pid● Huge Pages – static hugepages for pinned shared-memory● Managing VM, dirty ratio and swappiness tuning● Use cgroups for further resource management control
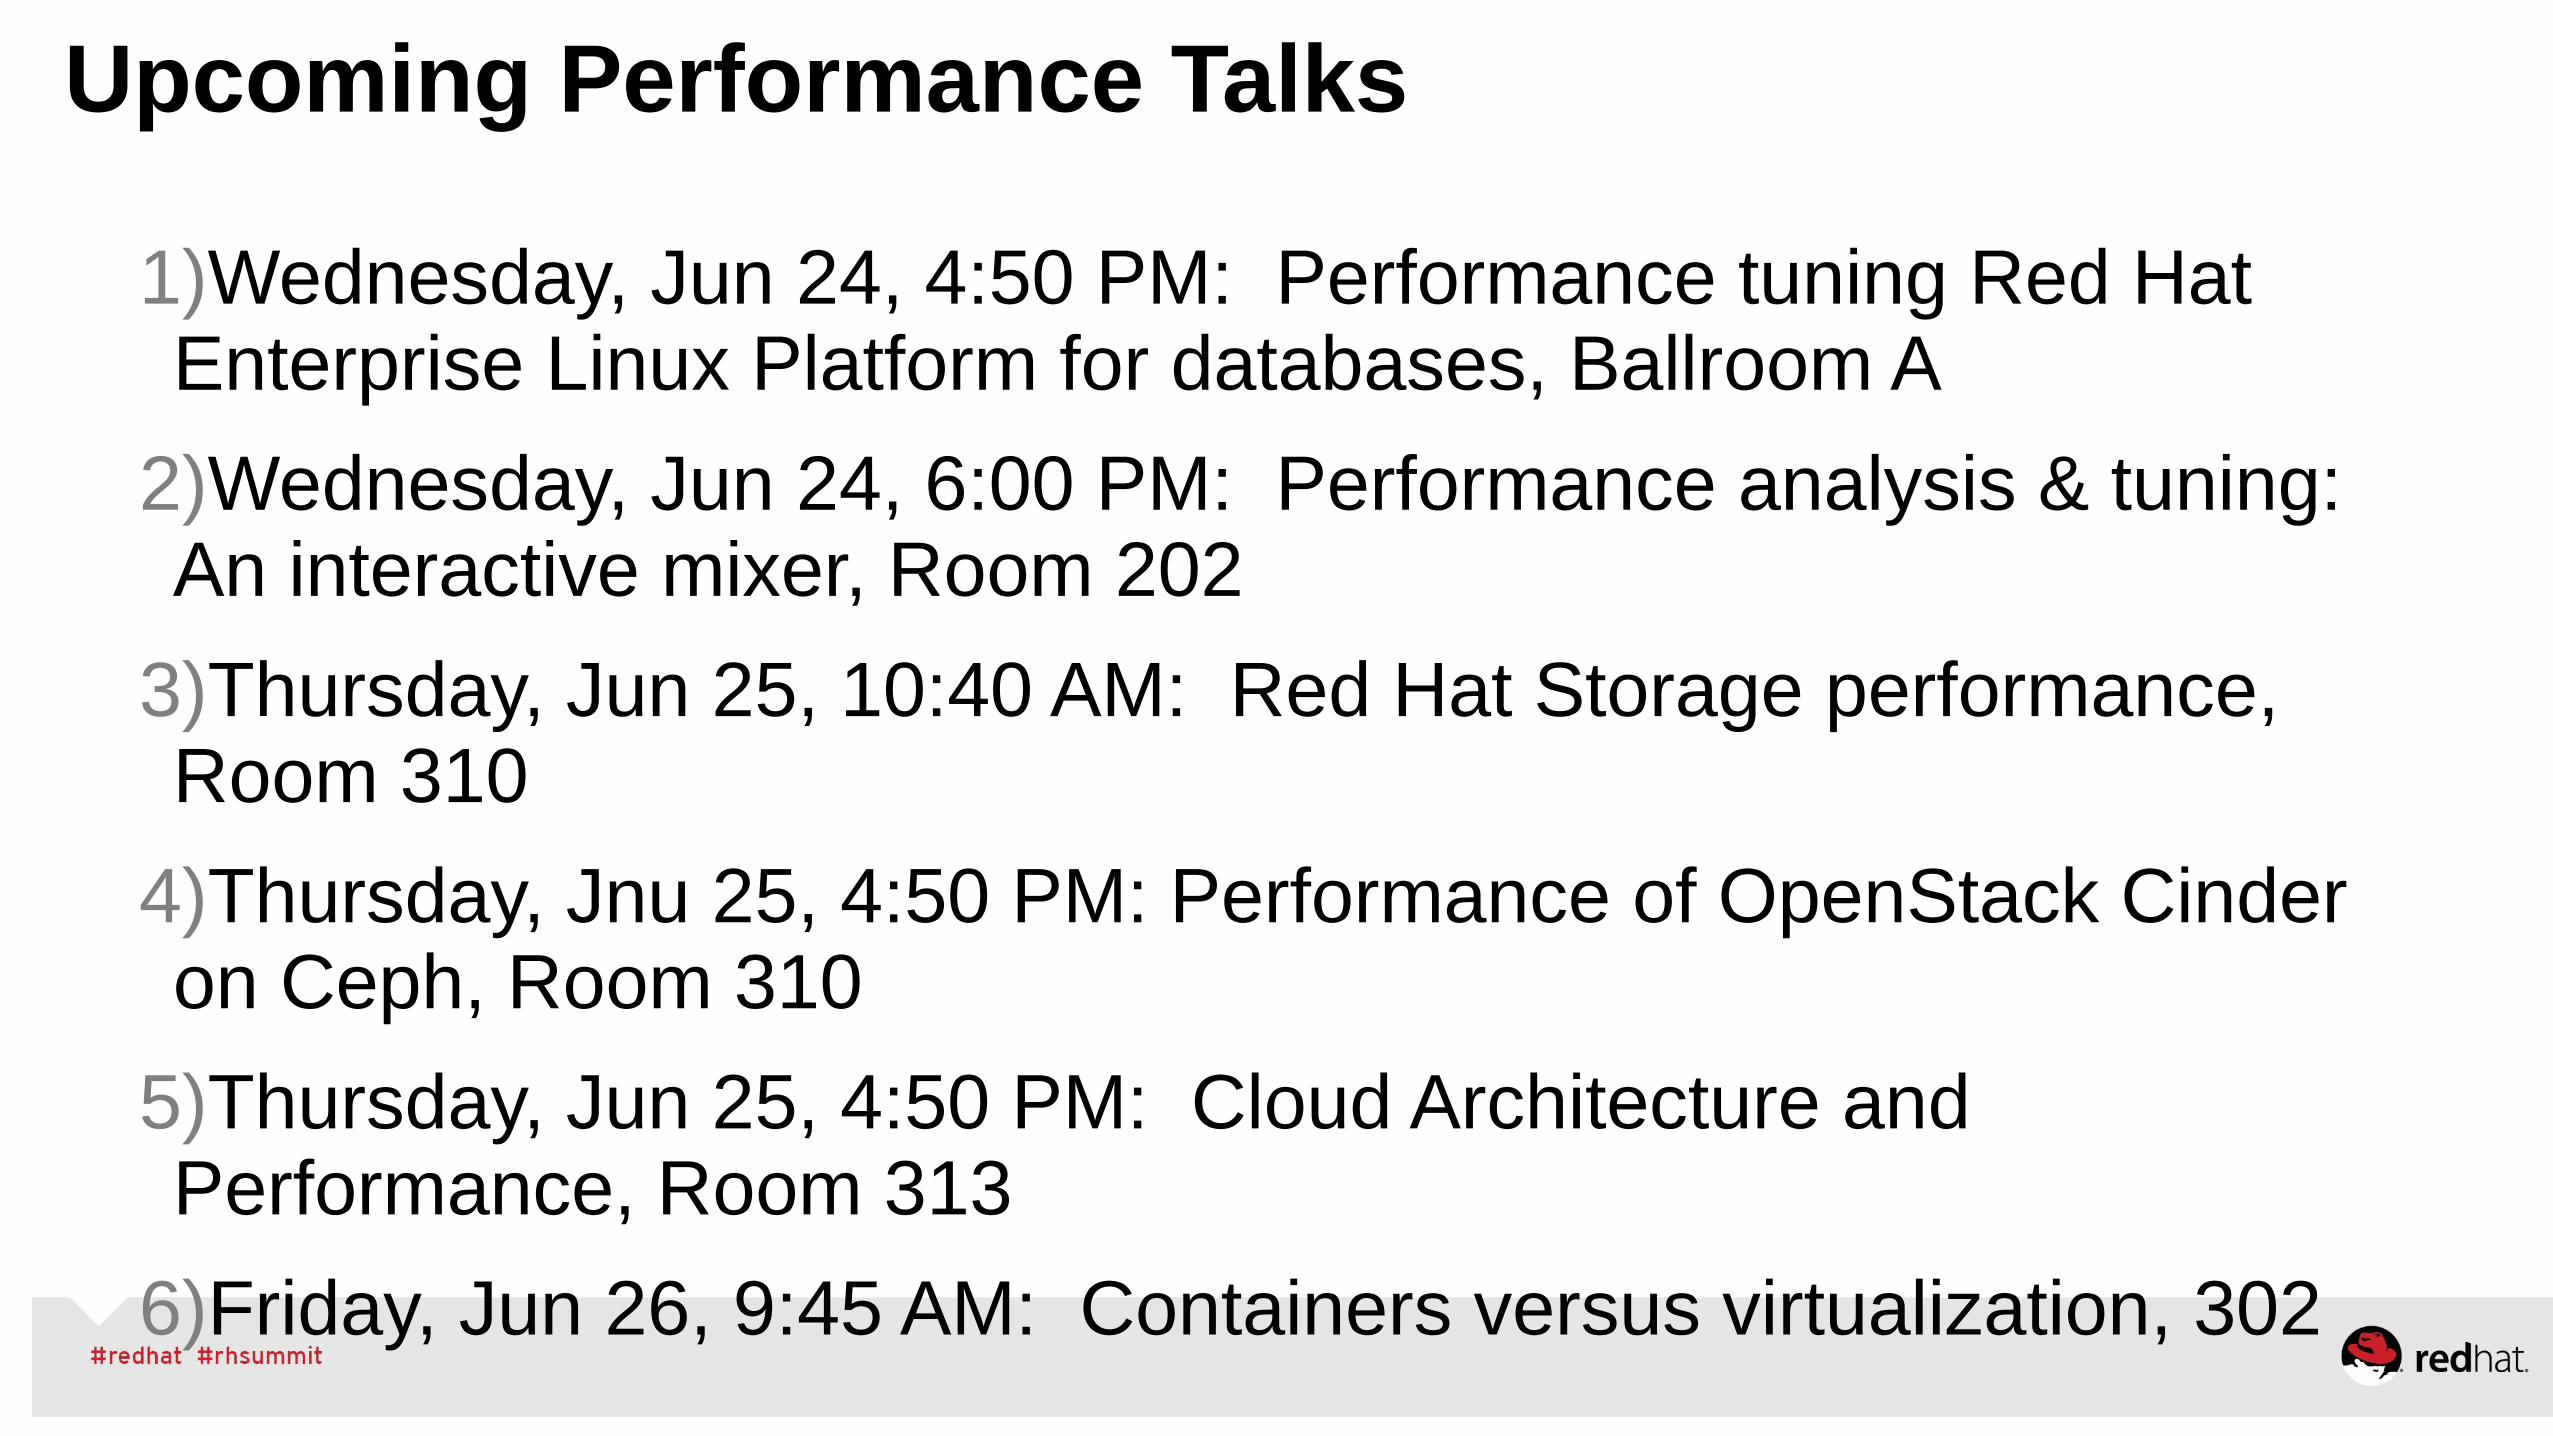
Upcoming Performance Talks
1)Wednesday, Jun 24, 4:50 PM: Performance tuning Red Hat Enterprise Linux Platform for databases, Ballroom A
2)Wednesday, Jun 24, 6:00 PM: Performance analysis & tuning: An interactive mixer, Room 202
3)Thursday, Jun 25, 10:40 AM: Red Hat Storage performance, Room 310
4)Thursday, Jnu 25, 4:50 PM: Performance of OpenStack Cinder on Ceph, Room 310
5)Thursday, Jun 25, 4:50 PM: Cloud Architecture and Performance, Room 313
6)Friday, Jun 26, 9:45 AM: Containers versus virtualization, 302