Keywords: Type your keywords here, separated by semicolons ;
1. Introduction
Emissions of CO2, CO, SO2 and NOx from fossil-fuel combustion are the main causes of atmospheric pollution in both urban and extra-urban fields [1, 2]. Furthermore, in the last century world energy consumption has been increasing considerably. In the present scenario, bio-fuels have emerged as alternative sources of energy [3]. They
494 Sebastian Brusca et al. / Energy Procedia 81 ( 2015 ) 493 – 504
can offer many benefits including sustainability, reduction of greenhouse gas emissions, rural development and security of supply.
The main aim of all biofuels is to replace fossil fuels reducing mainly the net amount of carbon dioxide emitted into the atmosphere. Most of gas turbines operate in high efficient combined cycle power plants and some of them use an integrated gasification section [4].
Gasification could be considered a serious alternative to produce synthetic fuels for gas turbines, replacing conventional fossil fuels. Burning these low LHV syngas allows using raw fuels that cannot be used in conventional gas turbines, due to technological considerations. Moreover it is possible to reduce greenhouse gas emissions thanks to an easier integration of pre-combustion carbon capture.
Syngas fuels are a mixture of gases with different fraction of hydrogen, methane, carbon monoxide, carbon dioxide, and hydrocarbons. Since the LHV of syngas is much lower than that of natural gas, which gas turbines are usually designed for, higher mass flows are required to reach similar rated power. That means fuel injectors and combustor in gas turbines need to be modified to make them suitable for the higher flows. All of the major OEM’s, including Siemens, General Electric, Mitsubishi Heavy Industries, Alstom [4, 5] have developed combustion system operating hydrogen rich fuels, such as syngas.
In the last decade the necessary to reduce greenhouse gas emission has led to an enormous growth of biodiesel production from vegetable oils. This process consists in a trans-esterification process using methanol, steam and electricity and some additional chemicals. A significant amount of glycerol is generated as waste co-product of biodiesel production in trans-esterification process.
Therefore the increase in biodiesel production by trans-esterification is leading to an excess of glycerol production as by-product. The glycerol is mostly used in medical, pharmaceutical and personal care applications. It also could be considered as matter for the synthesis gas (syngas) generation to feed many types of internal combustion engines (ICE) [6] or gas turbine [7]. The steam reforming is one of effective method to generate syngas from glycerol [8].
The present paper focuses on the analytical model development of an integrated gasification heavy-duty gas turbine burning different syngas fuels generated by a steam reforming process of glycerol. In particular, 48 different syngas compositions were considered to investigate the effect of syngas type on the operation and performance of the gas turbine as well as the overall efficiency of integrated system. The syngas composition types were produced using two steam to carbon ratio (S/C) values at different levels of reformer pressure and temperature. Moreover, the analysis examined the influences of water content in syngas on gas turbine performance.
Nomenclature
S/C Steam to Carbon Ratio GT Gas Turbine TIT Turbine Inlet Temperature RP Reformer Pressure RT Reformer Temperature ANGLE Inlet Guided Valve Angular Position VFC Mass flow rate correction factor VEC Efficiency correction factor CS Corrected speed Anozzle Minimum turbine nozzles’ area
2. Integrated Gasification Gas Turbine
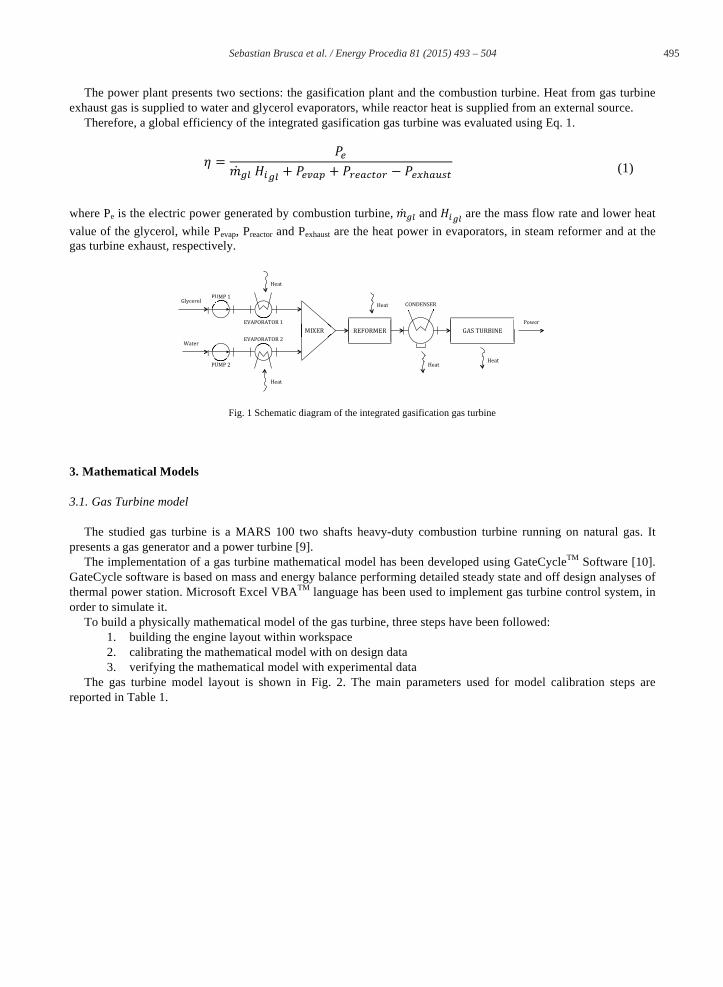
The power plant studied in the present paper is an integrated gasification gas turbine. A schematic diagram of the plant is shown in Fig. 1.
Sebastian Brusca et al. / Energy Procedia 81 ( 2015 ) 493 – 504 495
The power plant presents two sections: the gasification plant and the combustion turbine. Heat from gas turbine exhaust gas is supplied to water and glycerol evaporators, while reactor heat is supplied from an external source.
Therefore, a global efficiency of the integrated gasification gas turbine was evaluated using Eq. 1.
(1)
where Pe is the electric power generated by combustion turbine, and are the mass flow rate and lower heat value of the glycerol, while Pevap, Preactor and Pexhaust are the heat power in evaporators, in steam reformer and at the gas turbine exhaust, respectively.
Fig. 1 Schematic diagram of the integrated gasification gas turbine
3. Mathematical Models
3.1. Gas Turbine model
The studied gas turbine is a MARS 100 two shafts heavy-duty combustion turbine running on natural gas. It presents a gas generator and a power turbine [9].
The implementation of a gas turbine mathematical model has been developed using GateCycleTM Software [10]. GateCycle software is based on mass and energy balance performing detailed steady state and off design analyses of thermal power station. Microsoft Excel VBATM language has been used to implement gas turbine control system, in order to simulate it.
To build a physically mathematical model of the gas turbine, three steps have been followed: 1. building the engine layout within workspace 2. calibrating the mathematical model with on design data 3. verifying the mathematical model with experimental data
The gas turbine model layout is shown in Fig. 2. The main parameters used for model calibration steps are reported in Table 1.
496 Sebastian Brusca et al. / Energy Procedia 81 ( 2015 ) 493 – 504
Fig. 2 Gas Turbine model layout within GateCycle development environment
Off-design behavior of both compressor and turbine is described by some basic equations. Eq. 2 and 3 replace compressor map and represent air mass flow rate and efficiency of compressor as a function of actual ambient conditions, IGV angular position and on-design settings. Calibrating coefficients were determined in on-design simulation and fixed in off-design one. Some of these as mass flow rate and efficiency correction factor are used into Eq. 2 and 3.
(2)
(3)
where CS is the correct speed and could be evaluated by Eq. 4.
(4)
Table 1. Main Gas Turbine On-Design Characteristics.
Description Value Unit of Measurement
Power output 10.69 MW
Heat rate 11.09 kJ/kWh
Fuel input 32.93 MJ/s
Efficiency 32.46 %
Exhaust gas mass flow rate 41.78 kg/s
Fuel type Natural Gas -
Gas Generator speed 10942 r/min
Power turbine speed 8625 r/min
Compressor stages 15 -
Compressor pressure ratio 17 -
Gas generator turbine stage 2 -
Power turbine stages 2 -
MODEL:
CASE:
POWER:
HR:
EFF:
ETHAN
OFF3
9.99
11256.0
31.98
C1
CMB1
EX1
DUCT1
101.33
41.16
288.00
- 0.72
P T
W H
100.53
41.16
288.00
- 0.72
P T
W H
1743.4
41.16
770.98
504.58
P T
W H 1726.0
43.24
1330.9
1200.5
P T
W H
340.23
43.24
948.95
731.08
P T
W H
EX2
DUCT2
102.35
43.24
727.63
473.83
P T
W H
101.33
43.24
727.63
473.86
P T
W H
2533.1
2.07
298.15
20.42
P T
W H
S1
S2
S3 S4
S5
S6
S8
S7
Sebastian Brusca et al. / Energy Procedia 81 ( 2015 ) 493 – 504 497
Eq. 5 and 6 were used to evaluate compressed air pressure and temperature stage by stage.
(5)
(6)
Mass flow rate of burnt gas through the expander was determined using Eq. 7 and assuming a choked flow in gas
turbine nozzles.
(7)
In order to verify model accuracy, about 120 running conditions (case histories) were extracted from power plant data storage system for different power levels. In the same conditions, simulations running were performed and results compare with experimental data.
In the graphs reported in Fig. 3 model test results are shown. Experimental and simulated gas generator exhaust gas temperatures (Fig. 3 (a)) (S5 in Fig. 2) are reported as a function of case histories. As it is well evident, simulated temperature follows experimental one (the average relative error is about 4%). In the same manner, simulated power turbine exhaust gas temperature (Fig. 3 (b)) (S6 in Fig. 2) follows the experimental temperature (the average relative error is about 2.5 %). Thus, the model is validated.
(a)
(b)
Fig. 3 (a) Gas generator exhaust gas temperature versus case history; (b) Power turbine exhaust gas temperature versus case history
3.2. Steam reforming model
In order to produce syngas from glycerol, different approaches are possible, including aqueous phase reforming, bioconversion, auto-thermal reforming, thermal reforming and steam reforming. Among them, steam reforming of glycerol has attracted much more attention as it can produce up to 7 mol of hydrogen per mole feed glycerol
498 Sebastian Brusca et al. / Energy Procedia 81 ( 2015 ) 493 – 504
theoretically. For this reason steam reforming was chosen in this paper to study syngas composition under different glycerol steam reforming conditions.
Steam reforming of glycerol for syngas production involves different and complex reactions, because of the different chemical intermediates that are formed during the process. Steam reforming reactions are summarized in Table 2. The ideal complete steam reforming of glycerol (Eq. 1) may be considered as combination of the glycerol decomposition (Eq. 2) and water–gas-shift reaction (Eq. 3). Eq. 1 is an endothermic reaction causing an increase in the number of moles. Therefore, high temperatures, low pressures and high water/glycerol ratios in the feed favour H2 production. The reverse reaction in Eq. 3, which leads to CO formation, is favoured at high temperatures. The side reactions that lead to methane formation are represented by Eq. 4 and 5 [11]. Eq. 6 and 7 represent CO and CH4 decomposition, whereas Eq. 8 and 9 denote the CO and CO2 reactions with H2 [12]. Depending on process conditions (temperature, pressure and water/glycerol ratio), these last four reactions are moved more towards the products or towards the reactants leading to the carbon formation, condition that must be avoided.
To understand the effect of process conditions on syngas composition and coke formation a complete thermodynamic study was carried out using Aspen Plus simulator process.
3.2.1. Thermodynamic model: simulations and results The mathematical model of glycerol steam reformer process was made taking into account a real plant flow
sheet. The model is divided into two main parts. A first part in which two pumps ensure to supply the plant with water and glycerol and a second part composed of the mixing system and the section of heating and vaporization, consisting in reforming reactor. In the mathematical model, reactors can be solved in two ways [13]: (i) stoichiometric and (ii) non-stoichiometric thermodynamic approaches. In the stoichiometric approach the system is described by a set of stoichiometrically independent reactions, and they are typically chosen from a set of possible reactions arbitrarily [14]. On the other hand, in a non-stoichiometric approach the equilibrium composition is found by the direct minimization of the Gibbs free energy for a given set of species [15]. The advantages of non-stoichiometric approach over the stoichiometric one are as follows [16]: (a) a selection of the possible set of reactions is not necessary, (b) no divergence occurs during the computation, and (c) an accurate estimation of the initial equilibrium composition is not necessary.
Table 2 Main Reactions in Glycerol Steam Reforming
(9) Decomposition of Glycerol C3H8O3 3CO + 4H2 +251
(10) Water Gas Shift reaction CO + H2O CO2 + H2 –41
(11) Methanation CO + 3H2 CH4 + H2O -206
(12) Methanation CO2 + 4H2 CH4 + 2H2O –165
(13) Disproportionation 2CO CO2 + C -171.5
(14) Methane Decomposition CH4 2H2 + C +75
(15) Hydrogenation of CO CO + H2 H2O + C -131
(16) Hydrogenation of CO2 CO2 + 2H2 2H2O + C +90
The non-stoichiometric approach was applied using a Gibbs reactor to calculate the equilibrium concentration of
the reformed outlet stream. The primary components were C3H8O3, H2O, CO, CO2, H2, CH4, and C. The other intermediate compounds of glycerol steam reforming, such as ethane, propane, methanol and ethanol, were neglected. As the reaction proceeds, the total Gibbs free energy decreases; the equilibrium condition is reached when
Sebastian Brusca et al. / Energy Procedia 81 ( 2015 ) 493 – 504 499
the total Gibbs free energy (Gt) attains its minimum value. Therefore, the equilibrium composition can be determined by solving the minimization problem (Eq. 8).
minni
(Gt )T ,P = niGi = ni
i=1
C
∑i=1
C
∑ Gi0 + RT ln
fi
fi0
⎛
⎝⎜
⎞
⎠⎟+ nsGs
(8)
where Gi
0 is the Gibbs free energy of the species in standard conditions, C is the total number of components in the reaction system, ni is the amount of each gaseous component, ns is the number of carbon molecules involved in the carbon formation, and Gs is the Gibbs free energy of solid carbon. Based on the minimization problem of Gibbs free energy was solved to find the equilibrium composition of the reactive system. The input data adopted for model simulations were: (i) pure glycerol; (ii) reagents inlet flow; (iii) reagents inlet temperature; (iv) reagents inlet pressure; (v) reactor temperature; (vi) reactor pressure. To select the most appropriate operating conditions of the reformer, a preliminary analysis was carried out to evaluate carbon formation. Fig. 4 depicts molar carbon formation ranging temperature from 623 to 1273 K and steam to carbon ratio from 0 mol/mol to 4 mol/mol (S/C=molH2O-
in/molCarbon-in) at different pressures (1 bar, 5 bar, 15 bar and 25 bar). It is evident that, for all pressure conditions, in dry reforming (DR) condition (S/C=0) an amount of elemental carbon is potentially formed in a wide range of temperatures. On the contrary, increasing temperature and S/C ratio, the equilibrium composition drastically changes showing the disappearance of carbon formation.
(a)
(b)
(c)
(d)
Fig. 4 Effect of S/C ratio and reaction temperature on carbon formation: (a) 1 bar; (b) 5 bar; (c) 15 bar; (d) 25 bar
In particular glycerol steam reforming must be performed with a value of S/C ratio greater than 2, in order to
avoid thermodynamically carbon production at any temperature and pressure. Fig. 5, Fig. 6, Fig. 7 and Fig. 8 show the comparison of syngas composition on dry bases, in terms of CH4, CO, CO2 and H2, considering S/C=2 and S/C=3 at different levels of reaction temperature and pressure. Graphs show a common characteristic denoted by the influence of reaction pressure. In fact, for all gases taken in consideration, the increase of reaction pressure causes a
500 Sebastian Brusca et al. / Energy Procedia 81 ( 2015 ) 493 – 504
variation in concentration for each component at each temperature value. This variation increases with increasing temperature, reaching a maximum at about 850 K and then decreases to zero at temperatures above 1223 K.
(a)
(b)
Fig. 5 Mole fraction of methane versus temperature at different reactor pressure: (a) S/C = 2 mol/mol; (b) S/C = 3 mol/mol
Fig. 6 and 7 show volumetric fraction of carbon monoxide and carbon dioxide in syngas. At low temperature there is no CO presence in syngas while CO2 concentration is maximum with a value of 40 v% (for each pressure and S/C ratio considered). Increasing reaction temperature, syngas CO content increases up to values above 20 v%, while the percentage by volume of CO2 decreases to values lower than 20 v%. Summing CO and CO2 concentration for each pair of temperature and pressure, it is observed that in all cases the concentration of these compounds in the syngas remains almost constant (average value equal to 40 v%), That can be explained by the Eq. 10 and 13 in which CO2 is converted into CO when reaction temperature is increased.
(a)
(b)
Fig. 6 Mole fraction of carbon monoxide vs temperature at different reactor pressure: (a) S/C = 2 mol/mol; (b) S/C = 3 mol/mol
(a)
(b)
Fig. 7 Mole fraction of carbon dioxide vs temperature at different reactor pressure: (a) S/C = 2 mol/mol; (b) S/C = 3 mol/mol
Sebastian Brusca et al. / Energy Procedia 81 ( 2015 ) 493 – 504 501
(a)
(b)
Fig. 8 Mole fraction of hydrogen vs temperature at different reactor pressure: (a) S/C = 2 mol/mol; (b) S/C = 3 mol/mol
Hydrogen content trend is described in Fig. 8 varying reaction temperature, pressure and S/C ratio. The number of moles of hydrogen increases with the increasing of S/C ratio and reaction temperature and with decreasing of reaction pressure. At temperatures lower than 923 K the influence of pressure is extremely important, especially in the range 1-5 bar. Exceeded the value of 923 K the influence of pressure becomes less important until it disappears completely at 1223 K. Model validation, made in previously experiences using a mixture of pure glycerol and water, demonstrated that simulated data have a good correspondence with experimental test results [17]. However, it is noted a small difference only in terms of carbon formation. In fact, because of the irreversibility, a slight carbon formation was experimentally detected at temperatures below of 923 K at S/C higher than 2 mol/mol. Therefore, experimental investigation reveals that temperature higher than 923 K and S/C molar ratio higher than 2 mol/mol represent possible conditions for syngas production using as feedstock glycerol. Under these conditions coke formation, main problem to be avoided in the reactors used for syngas production, is minimized.
(a)
(b)
Fig. 9 Syngas Lower Heating Value vs temperature and reactor pressure at S/C = 2 mol/mol: (a) Dry Syngas; (b) Wet Syngas
In order to use syngas as fuel to feed a gas turbine, it was also evaluated the lower heating value (LHV) of the
synthesis gas at different reaction temperatures and pressures. Fig. 9 illustrates syngas LHV trend in the range of temperature and pressure examined for a value of S/C = 2 mol/mol, whereas the wet gas (Fig. 9 (a)), that also takes into account the steam content into the gas and the dry one (Fig. 9 (b)). Graph surface was divided into a white portion, which identifies reforming conditions in which there is carbon formation, and a colored one in which carbon formation is avoided. Analyzing the LHV of the wet syngas, shown in Fig. 9 (a), the lower heating value of the gas increases with increasing temperature and pressure. This can be explained because even if the content of methane decreases with increasing temperature, falling from 13 w% at 623 K to 0 w% at 1223 K, the content of CO and H2 increase from 0 w% at 623 K at about 26 w% and 5 w% respectively at 1273 K. Instead, considering to condense the
502 Sebastian Brusca et al. / Energy Procedia 81 ( 2015 ) 493 – 504
steam in the syngas, the LHV of the dry gas is shown in Fig. 9 (b). Obviously, in this case the LHV of the dry syngas results to be, in all conditions, higher than the wet one. The nonlinear LHV trend shown in Fig. 9 (b) depends on the variable content of water in the syngas. In fact, the amount of water that doesn’t take part in the reforming reaction varies with pressure and temperature conditions. At low temperature the lower heating value is given only by the contribution of methane content. Increasing temperature up to 873 K is observed a decrease in the LHV, due to the decreasing of methane while the carbon monoxide and hydrogen don’t reach the maximum value. By increasing the reaction temperature the amount of CO and H2 increase raising the lower heating value at about 15.8 MJ/kg at 25 bar.
4. Results and discussion
In the present paper, different reformer pressures (RP = 1, 5, 15 and 25 bar) and temperatures (RT = 923, 1073 and 1273 K), and different steam to carbon ratios (S/C = 2 and 3) were analyzed. The study was carried out maintaining the water content in the syngas (WET) and condensing it (DRY). Obtained synthesis gases were burnt into combustion turbine. Constant power analysis was carried out and gas turbine performances were evaluated. Plant global efficiency was evaluated using Eq. 1, for all gasification section thermodynamic parameters, S/C ratio values and wet / dry conditions. For each power level, maximum plant global efficiency condition was extracted and gas turbine performance evaluated. In Fig. 10, 11 (a) and (b) fuel mass flow rate, gas turbine efficiency and turbine inlet temperature as a function of power are reported for methane and dry/wet syngas. Each point in figures was obtained using the following procedure: varying reformer pressure (RP) and temperature (RT); considering both steam to carbon ratios (S/C = 2 and 3); examining wet and dry syngas. Overall plant efficiency cloud of points was calculated combining all parameters. For each gas turbine level, integrated plant efficiency maximum condition (syngas composition) was extracted and engine performance evaluated. Fig. 10 shows fuel mass flow rate versus gas turbine power. Using syngas (wet and dry) lead to an increase in fuel mass flow rate in comparison with feeding gas turbine with natural gas. Dry syngas mass flow rate increases linearly with power rising and at each power value the same syngas composition leads to maximum plant global efficiency (RP = 25 bar, RT = 1273 K, S/C = 2). Wet syngas mass flow rate increases with GT power, but maximum power cannot be reached because of the higher value of the TIT (see Fig. 11 (b)). Maximum registered power was 9.6 MW. A slightly reduction in mass flow rate was obtained due to the presence of water in the wet syngas. The difference in mass flow rates is probably related to the presence of water in the fuel. Gas turbine efficiency as function of power is reported in Fig. 11 (a). Gas turbine efficiency decreases at part load conditions. Using wet syngas allows an increase in GT efficiency respect to the dry ones due to the lower LHV and the marginal increase in fuel mass flow rate.
Fig. 10 Fuel mass flow rate versus gas turbine power (methane, syngas dry and wet)
Sebastian Brusca et al. / Energy Procedia 81 ( 2015 ) 493 – 504 503
(a)
(b)
Fig. 11 (a) GT efficiency versus gas turbine power (syngas dry/wet); (b) TIT versus gas turbine power (syngas dry / wet)
5. Conclusions
The present paper deals with the analytical model development of an integrated gasification heavy-duty gas turbine fed with different syngas fuels generated by a steam reforming process of glycerol. Different syngas compositions were considered to investigate the effect of syngas type on the operation and performance of the gas turbine, as well as the overall efficiency of integrated system.
The syngas composition types were produced using two values of steam to carbon ratios (S/C) and varying reformer pressure and temperature. Therefore, the influence of water content in syngas on gas turbine performance was analyzed. Gas turbine mathematical model was calibrated and validated using on-design and experimental running data, respectively. On the basis of the comparison the mathematical model is able to simulate correctly the engine behavior (error less than 5%). Thus, the model is validated. Using the integrated gasification gas turbine model, plant overall efficiency was evaluated and GT performance determined for maximum global efficiency at full and part load. The effects of syngas composition and water content in fuel were studied. The results highlighted that dry syngas allows higher overall efficiency, while wet syngas just leads to higher GT efficiency.
References
[1] Lanzafame R, Scandura P F, Famoso F, Monforte P, Oliveri C. Air quality data in Catania: Analysis and Investigation. Case study years 2010 – 2011. Energy Procedia, Elsevier; 2014. Vol. 45, p. 681-690
[2] Lanzafame R, Scandura P F, Famoso F, Monforte P. NO2 concentration analysis in urban area of Catania. Energy Procedia, Elsevier; 2014. Vol. 45, p. 671-680
[3] Hassan M H, Kalam M A. An Overview of Biofuel as a Renewable Energy Source: Development and Challenges. Procedia Engineering, Elsevier; 2013. Vol. 56, p. 39-53
[4] Kim Y S, Lee J J, Kim T S, Sohn L. Effects of syngas type on the operation and performance of a gas turbine in integrated gasification combine cycle. Energy Conversion and Management, Elsevier; 2011. Vol. 52, p. 2262-2271
[5] Chacartegui R, Torres M, Sánchez D, Jiménez F, Muñoz A, Sánchez T. Analysis of main gaseous emissions of heavy duty gas turbines burning several syngas fuels. Fuel Processing Technology, Elsevier; 2011. Vol. 92, p. 213-220
[6] Brusca S, Chiodo V, Galvagno A, Lanzafame R, Marino Cugno Garrano A. Analysis of reforming gas combustion in Internal Combustion Engine. Energy Procedia, Elsevier; 2014. Vol. 45, p. 899-908
[7] Brusca S, Lanzafame R. Syngas fed gas turbine performance increase by means of evaporative cooling. ASME Turbo Expo 2004. ASME; 2004. Vol. 5A, p. 1-8
[8] Urbani F, Freni S, Galvagno A, Chiodo V. MCFC integrated system in a biodiesel production process. Jpurnal of Power Source, Elsevier; 2011. Vol. 196, p. 2691-2698
[9] Solar Techologies. MARS 100 Gas Turbine user manual. 2011 [10] General Electric. GateCycle user manual. 1998 [11] Fatsikostas AN, Kondarides DI, Verykios XE. Production of hydrogen for fuel cells by reformation of biomass-derived ethanol. Catal.
Today 2002; Vol. 75, p. 145–155
504 Sebastian Brusca et al. / Energy Procedia 81 ( 2015 ) 493 – 504
[12] Palmeri N, Chiodo V, Freni S, Frusteri F, Bart JCJ, Cavallaro S. Hydrogen from oxygenated solvents by steam reforming on Ni/Al2O3 catalyst. Int. J. Hydrogen Energy 2008; Vol. 33, p. 6627–6634
[13] Smith WR, Missen RW. Chemical reaction equilibrium analysis: theory and algorithms. New York: Wiley; 1982 [14] Fishtik I, Alexander A, Datta R, Geana D. A thermodynamic analysis of hydrogen production by steam reforming of ethanol via response
reactions. Int J Hydrogen Energy 2000; Vol. 25, p. 31–45 [15] Lwin Y, Daud WRW, Mohamad AB, Yaakob Z. Hydrogen production from steam–methanol reforming: thermodynamic analysis. Int J
Hydrogen Energy 2000; Vol. 25, p. 47–53 [16] S. Adhikaria, S. Fernandoa, S. R. Gwaltneyb, S.D. F. Toa, R. M. Brickac, P. H. Steeled, A. Haryantoa Athermodynamic analysis of
hydrogen production by steam reforming of glycerol. Int J Hydrogen Energy 2007; Vol. 32, p. 2875-2880 [17] Chiodo V, Freni S, Galvagno A, Mondello N, Frusteri F. Catalytic features of Rh and Ni supported catalysts in the steam reforming of
glycerol to produce hydrogen. Applied Catalysis A: General 2010; Vol. 381, p. 1–7