Page 1
PERFORMANCE ANALYSIS OF LINK ADAPTIVE 802.11 WLANS WITH MULTIUSER DETECTION CAPABLE RECEIVERS
by
Mir Hamza Mahmood
BSc (Hons.) Computer Engineering, Lahore University of Management Sciences, Pakistan, 2007
Submitted to the Graduate Faculty of
Swanson School of Engineering in partial fulfillment
of the requirements for the degree of
Master of Science
University of Pittsburgh
2008
Page 2
ii
UNIVERSITY OF PITTSBURGH
SWANSON SCHOOL OF ENGINEERING
This Thesis was presented
by
Mir Hamza Mahmood
It was defended on
October 31, 2008
and approved by
Dr. Zhi-Hong Mao, Assistant Professor, Department of Electrical and Computer Engineering
Dr. Marlin Mickle, Professor, Department of Electrical and Computer Engineering
Thesis Advisor: Dr. Heung-No Lee, Assistant Professor, Department of Electrical and
Computer Engineering
Page 3
iii
Copyright © by Mir Hamza Mahmood
2008
Page 4
iv
Conventional IEEE 802.11 Medium Access Control (MAC) protocol does not allow
simultaneous transmissions from stations at any moment, to avoid collisions. Namely, it employs
measures such as carrier sense multiple access, collision avoidance, and distributed coordination
function which are designed to discourage simultaneous transmissions. With the advent of
sophisticated physical layer technologies, multi-user detection capable receivers become
available. In this paper, therefore, we aim to investigate if the popular 802.11 MAC can be
modified to exploit this innovation in the physical layer. We accomplish this by deriving a new
throughput expression. Modern WLANs support multiple data rate transmissions via link
adaptation for higher spectral efficiency. Thus, we include multi rate link adaptation in the
analysis. We find that 802.11 can be modified slightly to support simultaneous transmissions and
to obtain significant benefit from multi-user detection capable receivers.
Keywords – Multiuser Detection, 802.11, Carrier sense multiple access, collision avoidance,
throughput optimization.
PERFORMANCE ANALYSIS OF LINK ADAPTIVE 802.11 WLANS WITH
MULTIUSER DETECTION CAPABLE RECEIVERS
Mir Hamza Mahmood, M.S.
University of Pittsburgh, 2008
Page 5
v
TABLE OF CONTENTS
PREFACE .................................................................................................................................... IX
1.0 INTRODUCTION ........................................................................................................ 1
1.1 MOTIVATION AND PROBLEM CONTEXT................................................. 1
1.2 RELATED WORK .............................................................................................. 3
1.3 CONTRIBUTION AND THESIS STRUCTURE ............................................. 5
2.0 CONVENTIONAL 802.11 WIRELESS LOCAL AREA NETWORKS ................. 6
2.1 INTRODUCTION ............................................................................................... 6
2.2 802.11 MAC PROTOCOL .................................................................................. 7
2.2.1 Frame Reception Acknowledgement ............................................................. 7
2.2.2 The Hidden Terminal Problem and RTS/CTS handshake .......................... 8
2.3 MODELING THE BACK-OFF MECHANISM IN DCF .............................. 12
2.3.1 The Distributed Coordination Function (DCF) .......................................... 12
2.3.2 Transition Probabilities ................................................................................ 15
2.3.3 Steady State Distribution and Transmission Probabilities ........................ 16
3.0 ANALYSIS OF MULTI RATE WLAN WITH MUD CAPABILITY .................. 18
3.1 SYSTEM AND PROBABILITY MODELING FOR 802.11-M MUD ......... 19
3.1.1 System Model ................................................................................................. 19
3.1.2 Busy and Collision Probabilities .................................................................. 20
Page 6
vi
3.2 THROUGHPUT DERIVATION ..................................................................... 22
3.2.1 Throughput definition ................................................................................... 22
3.2.2 Idle Period ...................................................................................................... 24
3.2.3 Busy Period .................................................................................................... 24
3.2.4 Successful Effective Data Transmission ...................................................... 27
3.2.5 Network Throughput .................................................................................... 28
3.2.6 Discussion ....................................................................................................... 29
4.0 NUMERICAL RESULTS AND DISCUSSION ON 802.11-M WLAN ................. 30
4.1 INFLUENCE OF INITIAL CONTENTION WINDOW SIZE..................... 31
4.2 THROUGHPUT OPTIMIZATION VS. FAIRNESS ..................................... 38
4.3 MODIFICATOINS TO EXPLOIT FULLY THE MUD CAPABILITY ..... 41
4.3.1 Physical Layer Modifications ....................................................................... 41
4.3.2 MAC Layer Modifications ............................................................................ 42
5.0 CONCLUSION ........................................................................................................... 44
APPENDIX A .............................................................................................................................. 45
BIBLIOGRAPHY ....................................................................................................................... 47
Page 7
vii
LIST OF TABLES
Table 4.1: System parameters used in numerical analysis….………………………………………..30
Page 8
viii
LIST OF FIGURES
Figure 2.1: Packet exchange between transmitter and the receiver in the basic access scheme. .... 8
Figure 2.2: Hidden Terminal problem example. ............................................................................. 9
Figure 2.3: Packet Exchange between the transmitter and the receiver in the RTS/CTS scheme. 10
Figure 2.4: RTS/CTS mechanism mitigating the hidden terminal problem. ................................ 11
Figure 2.5: Markov chain (of an ith group station) is constructed. ............................................... 14
Figure 3.1: The Basic Service Set system. .................................................................................... 19
Figure 3.2: The renewal period of multi rate 802.11 MUD MAC protocol ................................ 23
Figure 4.1: Initial contention window sizes of group 3 and 4 are varied against throughput.. ..... 32
Figure 4.2: Network Throughput vs. CW3,0 and CW4,0. ............................................................... 33
Figure 4.3: Network Throughput vs. M, the total number of stations. Only M4 is increased…… 34
Figure 4.4: Network Throughput vs. M, total number of stations and CW4,0. ............................. 36
Figure 4.5: Network Throughput vs. Average length of frame. .................................................. 37
Figure 4.6: Network Throughput vs. p1. ...................................................................................... 39
Figure 4.7: Throughput vs p1 and p2. The plot is for 802.11-2 with only two groups. ................ 40
Page 9
ix
PREFACE
All praise to Almighty Allah who gave me courage, wisdom and ability to write this thesis. He
always guided me in the difficult times and it is only due to Him what I am today.
I cannot thank much Professor Heung-No Lee under whose supervision, I have worked
throughout my Masters Degree. He is an excellent human being who taught me how to
investigate problems. It is he who taught me the essence of logic and the importance of
communicating well what one is investigating to other people through effective writing.
Professor Zhi-Hong Mao is another extraordinary human from whom I am honoured to learn
during my stay at University of Pittsburgh. I am thankful for his contributions in the problem I
investigated for my thesis.
I also thank Dr Marlin Mickle for serving on my defense committee and for giving me
valuable inputs on the thesis write-up.
Cheng-Chun Chang, with whom I shared office ever since I joined University of
Pittsburgh, is an excellent friend, guide and co-researcher. I had an opportunity of learning a lot
from him both about research and about life in general. Other friends I made during from the
University of Pittsburgh are Xaioyu, Sushaant, Hariram, Bobby, Ashish, Vikram and Mircea.
I thank my parents who not only supported my goals of getting graduate education, but
also encouraged me to go for it. It is not only because of my interest but also due to tremendous
Page 10
x
enthusiasm of my father that I will continue my journey of graduate education beyond MS. I
thank Almighty Allah for making them my parents and thank them for the sacrifices that they
have made to realize my educational dreams. I am in debt to my brother, sister, extended family
and friends who have always given me support and much needed encouragement. May Allah
bless all of them.
Mir Hamza Mahmood
October 2008
Page 11
1
1.0 INTRODUCTION
1.1 MOTIVATION AND PROBLEM CONTEXT
The single packet reception constraint at the access node in conventional wireless multiple
access networks can be relaxed using Multi User Detection (MUD) techniques which can decode
information transmitted from multiple stations simultaneously. In the past, a MUD receiver [9]
was viewed as an exclusive technique, perhaps deemed suitable only for high performance base
stations in cellular networks, as high complexity operations were usually required for it. Recent
advances in graph codes theory such as low-density parity-check codes and interleaved
convolutional codes have made the MUD algorithms less computationally intensive via the use
of turbo-iterative MUD algorithms, see [20][21][24][25]. This user differentiation via channel
code alone has been proven to be more spectrum efficient than what the conventional approach
of separated spreading and channel coding can provide [10].
The downside of such a MUD receiver is that the receiver complexity still increases, at
least linearly to the number of users. Therefore, for an access node in a typical Wireless Local
Area Network (WLAN) application, the number of users, say m, that a MUD receiver can detect
simultaneously will highly likely be limited up to several signals at maximum. Let’s call such an
access network m-MUD enabled.
Page 12
2
We are interested in examining the throughput behavior of a WLAN when the access
node is m-MUD enabled. With employment of an m-MUD enabled access node, lesser collisions
and an increased amount of effective information transmission are expected as more than one
stations can communicate with the access node simultaneously [7]. With the employment of a
centrally controlled MAC protocol, such as the Point Coordination Function in 802.11, polling of
stations can be used and exactly m stations can be scheduled to access the channel
simultaneously. This case is not of interests in this work.
We are rather concerned in analyzing the throughput behavior of a MAC when it is in
distributive control mode, such as the Distributed Coordination Function (DCF) [3] in 802.11. In
distributive control mode, it is not entirely clear how to encourage simultaneous transmission,
and how the throughput would behave under m-MUD enabled access node because current MAC
mechanisms are designed to discourage simultaneous transmissions. The fundamental access
mechanism used in 802.11 MAC protocol, for example, is Carrier Sense Multiple Access with
Collision Avoidance (CSMA/CA). Stations are not allowed to send frames whenever they sense
signaling activity in the channel. On top of CSMA/CA, stations follow the Distributed
Coordination Function (DCF) [3] with which they share the medium via randomized
transmissions. Simultaneous transmissions from multiple stations to the access node is
considered as collision and hence discouraged.
The discussion so far leads to the following questions which we intend to answer in this
paper: Can the wide spread distributive MAC protocols like DCF in 802.11 be used to exploit the
m-MUD capability? Would it be possible with simple modification? What are these
modifications required? How does the throughput scale as m increases? Namely, how should
the DCF be modified so that a right amount of simultaneous transmissions can be encouraged?
Page 13
3
On the other aspect, modern 802.11 WLANs allow stations to use multiple data rates.
Stations choose a data rate depending on underlying channel condition, a process called link
adaptation [22][23]. As the Signal to Noise Ratio (SNR) available to a station increases, it uses
higher data rates to transmit its frame, hence reaching closer to channel capacity. Link
adaptation in WLAN changes the throughput behavior significantly [1][18]. Thus, it is
meaningful to include link adaptation in our throughput analysis and see its impact on the
throughput.
1.2 RELATED WORK
Significant amount of work exists in the literature, which attempts to analyze the network
throughput of IEEE 802.11 using Markov chains. Bianchi in [10] and [3] modeled 802.11 DCF
using Markov chains and evaluated the performance of WLANs using single transmission rate.
Improvements were then presented by several researchers which attempt to include all the details
of 802.11 DCF in the Markov chain model for performance analysis. It should be pointed out
that while substantial research is conducted on throughput analysis assuming single data rate, not
comparable attention is given to the scenario where stations are allowed to use different data
transmission rates, a typical case in modern 802.11 WLANs.
More recently conducted research carried out in [1], [4], [5] and [17] accommodate multi
rate transmission assumption. Yang et al. [1], assume exponential backoff procedure, as outlined
in the IEEE 802.11 DCF. The model, based on improved versions of the one presented in [3],
accommodates multi rate transmission. With employment of multi rate transmissions,
“performance anomaly” problem was observed: low rate users hold the channel longer in time
Page 14
4
and thus network throughput suffers. The authors have tried to address this problem by
controlling access parameters of stations such as initial contention window size, the frame size,
and maximum backoff stage. All these parameters are well defined in the IEEE 802.11 standard.
This problem of performance anomaly was also observed in [17]. In [5], the authors analyze
multi rate 802.11 WLANs, where they assume two Markov models for stations and channels.
However, the remedial solution for the performance anomaly was not addressed.
The authors in [2] attempted to apply a MUD capable access node in IEEE 802.11
WLANs and proposed a modified MAC. They assumed a simple scenario that all nodes have the
same SNR and use geometrically distributed random backoff interval as compared to the
exponential backoff in DCF. In [6] [7], the authors attempted to implement Multiple Packet
Reception (MPR) in 802.11 WLANs using DCF. CSMA was modified for MPR scenario in [18]
and a modified cross layer CSMA for MPR, named XL-CSMA was proposed. Although
decentralized, it did not assume DCF mechanism for backoff. We point out that all these prior
works with 802.11 and MUD mentioned here assume single transmission rate for throughput
analysis.
All the works compared so far start with the assumption of the classic CSMA/CA
framework where simultaneous transmissions are discouraged. Among the pioneering works on
Multi Packet Reception (MPR) in random access networks, the authors of the paper [12] studied
Slotted ALOHA (SA) systems under infinite number of users and single buffer assumption.
Stations under SA transmit at the start of each frame whenever they have a frame to send. Thus,
simultaneous transmission is easier than CSMA/CA to be encouraged via manipulating the
transmission probabilities. However, there are downsides as well which make SA less attractive
than 802.11. The throughput of SA is poor. For example, the throughput is only 1e− (for single
Page 15
5
user detection receivers); the throughput vanishes as the offered load increases. SA is known to
have instability problem as the offered load increases requiring a separate remedial treatment
[12]. Furthermore, most of the existing MPR MAC protocols [12],[13], assume the existence of
a central coordinator that schedules transmissions from stations. Hence, these prior works are
not applicable to our 802.11-based distributed approach here.
1.3 CONTRIBUTION AND THESIS STRUCTURE
The contributions of this work are as follows: First, we derive the throughput expression for the
multi rate 802.11 MAC protocol with the support of MUD capable access node. To the best of
our knowledge, this is novel (see our comparative literature survey in the next section.). Second,
we show how this analytic throughput expression can be used in optimal control of 802.11 DCF.
The rest of the thesis is organized as follows. In chapter 2, we provide an introduction to
MAC layer protocol of conventional 802.11 WLAN. The hidden terminal problem and its
remedy is discussed. The Distributed Coordination Function (DCF) is discussed and
mathematically modeled. In chapter 3, the proposed system with MUD support is discussed in
detail and its performance is analyzed. Numerical results are presented in chapter 4 including
discussion of tuning the current MAC protocols to maximally exploit the MUD capability and
enhance system throughput, following which we conclude in chapter 5.
Page 16
6
2.0 CONVENTIONAL 802.11 WIRELESS LOCAL AREA NETWORKS
In this chapter, we provide an introduction to the MAC layer protocols used in conventional
802.11 WLAN. We start with describing the transmission modes used in the protocol and
collision avoidance mechanisms as provided in a typical system. The Distributed Coordination
Function (DCF), which is used to manage the backoff process of the stations is described in
detail and modeled as a Markov Chain in the last section of this chapter.
2.1 INTRODUCTION
The basic building block of a 802.11 WLAN is called Basic Service Set (BSS). It contains
stations (one or more) who are contending for network resources in order to transmit their
frames, and an Access Point (AP), through which the wireless stations connect and communicate
with the larger network or the internet. This kind of configuration is called infrastructure WLAN.
When wireless stations group together in the absence of an AP and no central control, an ad hoc
network is said to be formed.
Page 17
7
2.2 802.11 MAC PROTOCOL
In this section, we will briefly review the key features of Medium Access Control (MAC)
Protocol that is deployed in 802.11 WLANs. As mentioned earlier, a station when associates
itself to an AP, becomes part of the corresponding BSS. Then that station can communicate with
other stations in the network through that AP. Since more than one station may attempt to
communicate with the AP at the same time, we need a protocol to effectively manage these
communications. Carrier Sense Multiple Access with Collision Avoidance (CSMA/CA) is the
protocol used in WLANs under discussion to manage transmissions between the access point
(AP) and stations. This protocol requires all stations to sense the channel before start transmitting
their frames. The stations should avoid transmission if the channel is sensed busy. The collision
avoidance part comes from the fact that before starting transmission, each station chooses to wait
a random amount of time before it makes an attempt to transmit its frame. This random wait time
is chosen using a number of ways. As stated earlier, this work concentrates on WLANs where
such backoff process is DCF, as used in 802.11. This backoff process is implemented using
Distributed Coordination Function (DCF), which is detailed in section 2.3. Next we discuss how
the MAC protocol ensures that the frame is correctly received by the receiver.
2.2.1 Frame Reception Acknowledgement
When a station has a frame to transmit, it waits a random amount of time by going through the
backoff process and then transmits its frame to the receiver, which is AP in our case. The
receiver, upon successful reception of the frame, sends an ACKnowledgment (ACK) packet back
to the source station if as shown in Figure 2.1. ACK is sent after waiting for a fixed period of
Page 18
8
time, known as Short Interframe space (SIFS). The transmission of ACK by the receiver
completes what we call one renewal period. Each station in the network who is contending for
network resources will then wait for a fixed period of time, called DIFS, before making an
attempt to transmit their data again.
Figure 2.1: Packet exchange between transmitter and the receiver in the basic access scheme.
ACK packet is an indication to the source station that its data has been successfully
transmitted. It will enter the backoff process again to retransmit the frame if it does not receive
the ACK from the receiver.
2.2.2 The Hidden Terminal Problem and RTS/CTS handshake
The MAC protocol provides a mechanism to mitigate the negative effects of the classic hidden
terminal problem. In this subsection, we will first describe the hidden terminal problem and then
the mechanism that 802.11 MAC protocol proposes to minimize its effects, using RTS/CTS
handshake, will be elaborated. Figure 2.3 shows a hidden terminal example.
Page 19
9
A AP C
Figure 2.2: Hidden Terminal problem example.
As shown in Figure 2.3, suppose station A starts to transmit its frame to the AP to which
another station, station C, is also associated. Since CSMA/CA is used, if C has a frame to
transmit, it will sense the channel to see if any other station is talking to AP. We note that C is
far from A and does not fall in its coverage area, it will not be able to sense A’s transmission.
Hence C will attempt to send its frame to the AP assuming no other station is talking to AP at
this point in time and a collision will occur at the AP. We say that both A and C are hidden to
each other.
802.11 use two modes for data transmission, Basic Access and RC mode. Basic access
mode is depicted in Figure 2.1 and discussed in section 2.2.1 where a DATA frame is followed
by and ACK. In such scheme, a situation as shown in Figure 2.2 and described in the preceding
paragraph results in a collision. The RC mode, on the other hand, is described in Figure 2.3. In
this scheme, two additional control packets, Request To Send (RTS) and Clear to Send (CTS) are
used.
Page 20
10
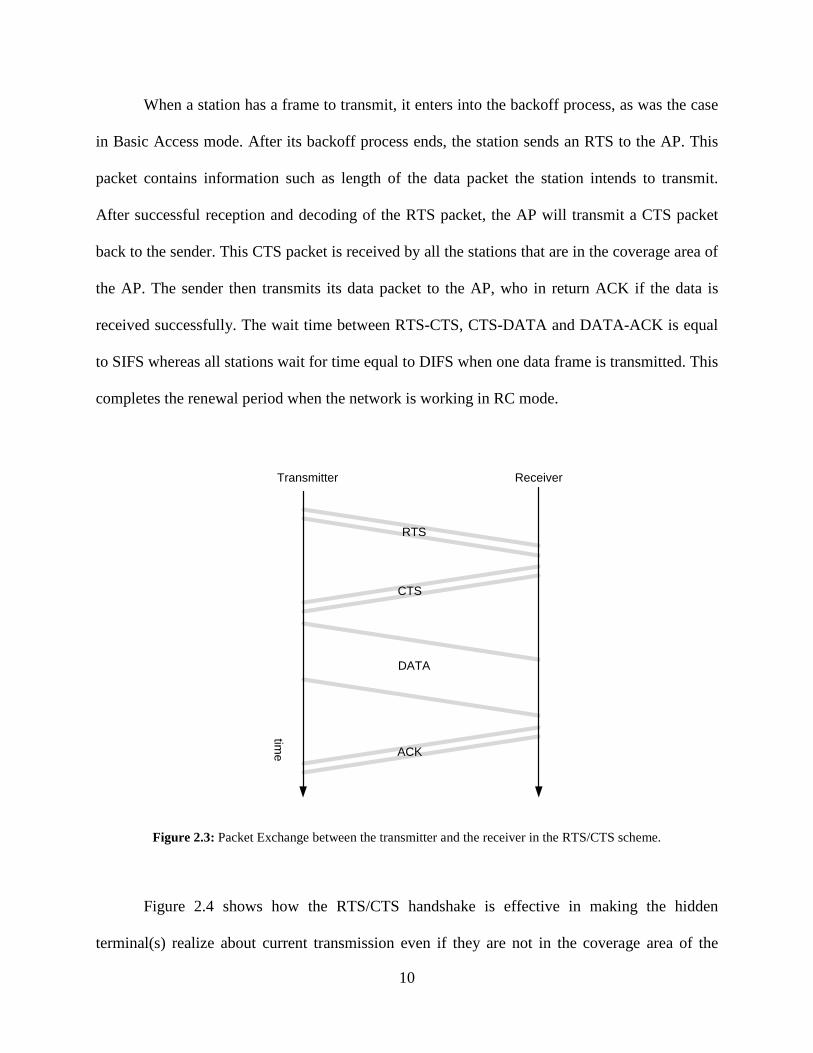
When a station has a frame to transmit, it enters into the backoff process, as was the case
in Basic Access mode. After its backoff process ends, the station sends an RTS to the AP. This
packet contains information such as length of the data packet the station intends to transmit.
After successful reception and decoding of the RTS packet, the AP will transmit a CTS packet
back to the sender. This CTS packet is received by all the stations that are in the coverage area of
the AP. The sender then transmits its data packet to the AP, who in return ACK if the data is
received successfully. The wait time between RTS-CTS, CTS-DATA and DATA-ACK is equal
to SIFS whereas all stations wait for time equal to DIFS when one data frame is transmitted. This
completes the renewal period when the network is working in RC mode.
Transmitter Receiver
time
DATA
ACK
RTS
CTS
Figure 2.3: Packet Exchange between the transmitter and the receiver in the RTS/CTS scheme.
Figure 2.4 shows how the RTS/CTS handshake is effective in making the hidden
terminal(s) realize about current transmission even if they are not in the coverage area of the
Page 21
11
source station. Here C is hidden to A, but when AP transmits the CTS packet, it is also received
by C since it falls in its coverage area (shown by dotted circle). The length of the data frame to
be sent by A is contained in CTS packet. When the packet is decoded by C, it will refrain from
starting its transmission for the time that will be taken by the data packet of A and the
corresponding ACK.
A AP C
Figure 2.4: RTS/CTS mechanism mitigating the hidden terminal problem.
Although there is still a chance of collision at the level of RTS, considering a situation
that both A and C transmit their RTS packets simultaneously, we note that the RTS packets are
much smaller in length than Data packets and hence the time wasted due to collision will be
much smaller in length. So RTS/CTS mechanism mitigates the hidden terminal effect to a large
extend.
Page 22
12
2.3 MODELING THE BACK-OFF MECHANISM IN DCF
In this section, we use a discrete-time Markov chain model to describe the exponential back-off
process defined in the Distributed Coordination Function (DCF) mode of operation of IEEE
802.11. Yang et al in [1], an extended work of [3] with the inclusion of link rate adaptation in
the analysis, also used a discrete-time Markov chain. Pictorial view of DCF as Markov Chain is
shown in Figure 2.5.
We start by describing the DCF in detail as outlined in the 802.11 standard. The details
are used to construct a Markov chain which is used to derive its steady state probability
distribution. Steady state distribution is then used to describe transmission probabilities which
are employed in subsequent throughput analysis carried out in the next chapter.
2.3.1 The Distributed Coordination Function (DCF)
Under the DCF, a station senses channel before transmitting. If it is idle, it just starts
transmission (after waiting an inter frame space (IFS) and finding the channel idle again). If it is
sensed busy, the station defers its transmission for a time equal to DCF Inter frame space (DIFS).
After the DIFS, the station chooses a random back-off counter and takes an additional deferral
period before transmitting.
The value of the backoff counter is chosen randomly from a uniform distribution over the
interval [0, CWi,0 -1], where CWi,k is defined as the size of the contention window (CW) of a
station in the ith group in the kth stage. The stage index starts at zero and is incremented by 1
each time collision occurs. Hence CWi,0 is the size of initial contention window. Whenever a
Page 23
13
timeslot is sensed idle, the backoff counter is decremented. If the slot is sensed busy at anytime,
the process is suspended, and starts again when an idle slot is encountered. When the counter
reaches zero, the frame is transmitted.
When collision occurs, those stations involved in the collision enter into their own back-
off process. For an example of the 1st collision, the stage index is incremented by one, i.e., k = 1.
In addition, the size of the contention window is increased by
max,
,0 max,,
,0 max, ,
2 0 1
2 i
ki i
i k ki i retry i
CW k kCW
CW k k k
< ≤ −= ≤ ≤
. (2.1)
With each collision, the size of CW is increased until it reaches up to its maximum, i.e.,
max,max, ,02 ik
i iCW CW= after which it remains the same. The frame is dropped after ,retry ik
attempts.
Page 24
14
1,0, 0, −iCWi
,1,1, 1ii CW −
0,0,i 1,0,i
0,1,i 1,1,i
,, , 1i ki k CW −0,,ki 1,,ki
,, ,, , 1retry iretry i i ki k CW −0,, ,iretryki 1,, ,iretryki
0,
1
iCW
,
,0
1 c i
i
pCW−
,
,1
c i
i
pCW
,
,2
c i
i
pCW
,
,
c i
i k
pCW
,
,
, retry i
c i
i k
pCW
,1 b ip−
,b ip
,1 b ip−
,1 b ip−,1 b ip−,1 b ip−
,1 b ip−,1 b ip−
,1 b ip−
,1 b ip−,1 b ip−
,1 b ip−
,b ip
,b ip
,b ip
,b ip
,b ip
,b ip ,b ip
Figure 2.5: Markov chain (of an ith group station) is constructed according to the IEEE Distributed Coordination
Function for the multi rate 802.11 MUD MAC protocol.
Now, we define { }( , ) ( , ), ( , )X i t K i t L i t= as a discrete-time Markov Chain. We use the
same assumptions made in [1] that the conditional busy probability pb,i,, that the channel is
sensed busy by an ith group station, and the conditional collision probability pc,i, that the
transmitted frame of ith group station collides with any other station, are assumed independent of
the backoff mechanism. Here, ( , )K i t and ( , )L i t are random processes representing the backoff
stage of a station in the ith group and the size of the backoff counter of a station in the ith group
Page 25
15
respectively. We define ( , , )i k l as a state in the Markov chain which represents the ith group, kth
stage and the value of random backoff counter l. Therefore, the ranges of these indexes are
given by , ,1 , 0 , 0 1retry i i ki N k k l CW≤ ≤ ≤ ≤ ≤ ≤ − .
2.3.2 Transition Probabilities
For the description of the transition probabilities of the Markov chain, it is useful to see Figure
2.5 again. The state transition probability of the Markov chain ( , )X i t defined by
1 1 0 0 1 1 0 0{ , , | , , }: { ( , ) , ( , ) | ( , ) , ( , ) }P i k l i k l P K i t k L i t l K i t k L i t l= = = = = , (2.2)
can be obtained from the busy and collision probabilities , in the following way:
,{ , , 1| , , } 1 b iP i k l i k l p− = − for ,1 1i kl CW≤ ≤ − (2.3)
,{ , , | , , } b iP i k l i k l p= for ,1 i kl CW≤ ≤ (2.4)
,, , 1
, 1
{ , 1, | , ,0} for 0 , 0 1c iretry i i k
i k
pP i k l i k k k l CW
CW ++
+ = ≤ ≤ ≤ ≤ − (2.5)
,, ,0
,0
1{ ,0, | , ,0} for 0 , 0c i
retry i ii
pP i l i k k k l CW
CW−
= ≤ ≤ ≤ ≤ (2.6)
, ,0,0
1{ ,0, | , ,0} for 0retry i ii
P i l i k l CWCW
= ≤ ≤ (2.7)
Eq. (2.3) shows that the back-off counter is reduced by 1 each time the channel is sensed
idle, whose probability is ,1 b ip− . Eq. (2.4) shows that the chain halts reducing the back-off
counter when the channel is sensed busy (happens with the busy probability ,b ip ). Eq. (2.5)
shows that the stage index k of the chain is incremented by 1 when collision occurs. The size of
contention window determines the range of the counter value. Since uniformly distributed, each
Page 26
16
counter value l in the range , 10 1i kl CW +≤ ≤ − is equally probable. Eq. (2.6) shows that the chain
jumps downward from kth stage to 0-th stage with a successful transmission. Again a uniform
randomly selected counter value from the range ,00 il CW≤ ≤ will determine the next counter
state l. Eq. (2.7) is for the event of frame drop. These equations are constructed to model the
back-off process of 802.11.
2.3.3 Steady State Distribution and Transmission Probabilities
Let us now define a steady state distribution, , ,i k ls , of the Markov chain where
{ }, , lim ( , ) , ( , )i k l ts P K i t k L i t l→∞= = = . Using the definition of probability, we have
, , 1
, ,0 0
1retry i i kk CW
i k lk l
s−
= =
=∑ ∑ (2.8)
Using the balance equations on the Markov chain, we obtain
, ,0 , ,0,0k
i k c i is p s= (2.9)
and
,, , , ,0 , ,
, ,
1 for 0 , 0 11
i ki k l i k retry i i k
i k b i
CW ls s k k l CW
CW p−
= ≤ ≤ ≤ ≤ −−
. (2.10)
Since a station transmits its frame when its backoff counter reaches zero, the probability
ip that a station in the ith group transmits its frame can then be calculated as the sum of the
probabilities of such events, i.e.,
,, ,
,, ,0 , ,0,0 ,0,0
0 0 ,
11
retry iretry i retry i kk kc ik
i i k c i i ik k c i
pp s p s s
p= =
−= = =
−∑ ∑ . (2.11)
Using (2.8), (2.10), and (2.9) in the respective order, we can find ,0,0is
Page 27
17
, ,
,
11,
,0,0 ,0 0 , ,
1
, ,
0 ,
11
11 .
(1 ) 2
retry i i k
retry i
k CWi k k
i c ik l i k b i
kkc i i k
k b i
CW ls p
CW p
p CWp
−−
= =
−
=
−=
−
− = + −
∑ ∑
∑ (2.12)
Using (2.11) and (2.12), pi can be obtained, i.e.
, ,
1
, , ,
0, ,
1 11
1 (1 ) 2
retry i retry ik kkc i c i i k
ikc i b i
p p CWp
p p
−
=
− − = + − −
∑ for 1, 2, ,i N= . (2.13)
The transmission probabilities ip prove to be the key statistics for further analysis. Since
they dictates how much access any station from the ith group will have on the network resources,
it directly influences the system throughput.
Page 28
18
3.0 ANALYSIS OF MULTI RATE WLAN WITH MUD CAPABILITY
In the last chapter, the DCF as used in the conventional 802.11 WLAN was analyzed and
modeled as Markov chain. The conventional WLAN discourages simultaneous transmissions
from multiple stations at the same time. In this chapter, we perform throughput analysis of our
proposed system, which allows more than one stations to transmit their data simultaneously to
the Access Point (AP). We use the DCF of the conventional system with slight modifications
which is then able to accommodate our MUD assumption. In chapter 4, comparisons are made
with the performance of conventional WLANs and modifications are discussed which can be
employed to maximally exploit the MUD capability to enhance system throughput.
We use throughput of a network as a performance metric. In this chapter, the system
model of the proposed WLAN is presented and a sample renewal period of such network is
described. Using that renewal period and the result of last chapter, equation (2.13), which
describes the transmission probability of a station belonging to the ith group, the throughput
expression is derived.
Page 29
19
3.1 SYSTEM AND PROBABILITY MODELING FOR 802.11-M MUD
3.1.1 System Model
Figure 3.1 depicts a Basic Service Set (BSS) system in consideration. All the stations in the BSS
are divided into N groups; those belonging to each group transmit their frames at the data rate of
ri, for i = 1, 2, …, N. It is further assumed that there are a total of M stations in the network,
each group having Mi number of stations having their frames ready to be transmitted, i.e.
1
Nii
M M=
=∑ .
Group 1
Group 2
Group 3
Group 4
Black Dots: Stations transmitting at this
moment
White Dots: Stations in backoff process and NOT
transmitting
Figure 3.1: The Basic Service Set system: There are four groups N = 4. There are total of 10 stations, M = 10. The
number of stations in each group is M1 = 3, M2 = 2, M3 = 3, and M4 = 2. There are total five stations transmitting at
the moment, n = 5. Among them two are in group 1, n1 = 2, one in group 2, n1 = 1, three in group 3 n3 = 1, and one
in group 4, n4 = 1.
Page 30
20
Since we are assuming MUD, there are ni stations from the ith group which start their
transmission simultaneously at the start of the same timeslot. Hence, overall, there are n number
of stations starting transmission simultaneously, where 1
Nii
n n=
=∑ .
3.1.2 Busy and Collision Probabilities
As it was argued before, the Distributed Coordination Function (DCF), as used in the
conventional system can be utilized even with our proposed physical layer modification, with
minor changes. These changes are related with the way the collision and busy probabilities are
defined. Hence we are going to rely on the analysis of DCF as done for conventional 802.11 and
redefine the probabilities in order to accommodate the modifications.
Now we define nP the probability that n number of stations start transmitting their frames
simultaneously. Recall that 1
Nii
n n=
=∑ where ni is the random variable denoting the number of
stations from the ith group making simultaneous transmissions in a time slot. Note that all ni are
mutually independent with each other.
To obtain nP , we first determine the probability mass function (pmf) of the random
variable ni. We note that with pi known, the pmf under discussion can be obtained as the
binomial distribution:
{ } (1 )i i ii k M ki i i i
i
MP n k p p
k−
= = −
. (3.1)
Since all ni are independent of each other, the joint pmf can be written as:
1 11
{ , , } (1 )i i i
Ni k M k
N N i ii i
MP n k n k p p
k−
=
= = = −
∏ (3.2)
Page 31
21
Using (3.2), Pn can be found to be
1
1 1{ , , }, n N NS
P P n x n x= = =∑ (3.3)
where 1 11
( , , ) : ,0 .N
N i i ii
S x x x n x M=
= ≤ ≤
∑
Given Pn, we can obtain the probabilities ,b ip and ,c ip . We note that an ith group station
will sense the channel whether it is busy or not. Reserving one station from the ith group as the
station sensing the channel, therefore, the conditional busy probability ,b ip is calculated. In the
similar fashion, conditioning upon the event that an ith group station transmits its frame, the
conditional collision probability ,c ip is calculated. Namely, assuming an m-MUD, a collision
occurs if m or more other stations are also transmitting their frames in that time slot. For
equations (3.4) and (3.5) where we define ,b ip and ,c ip , therefore, we will use ( )1n iP M − to imply
the probability Pn in (3.3) obtained from excluding exactly one station from ith group; and then
we have
( )1
,1
1M
b i n in
p P M−
=
= −∑ , for 1, 2, , ,i N= (3.4)
and
( )1
, 1M
c i n in m
p P M−
=
= −∑ , for 1, 2, , .i N= (3.5)
Similarly, we can calculate the probability that a channel is busy, bp and the probability that a
channel is idle, idlep .
1
M
b nn
p P=
=∑ (3.6)
Page 32
22
1idle bp p= − . (3.7)
Given the set of network parameters, such as contention windows ,{ }i kCW , number of stations in
each group{ }iM , and the backoff stage limits { }max, ,,i retry ik k , we notice that the transmission
probabilities { }ip , the busy probabilities and the collision probabilities are fixed. Thus, they are
obtained from numerical evaluation of equations (2.13), (3.3), (3.4), and(3.5).
3.2 THROUGHPUT DERIVATION
3.2.1 Throughput definition
Given the transmission probabilities obtained in the previous section, we may carry our analysis
with the renewal theorem. The Markov chain renews itself every time a successful transmission
is made. Then, the average throughput can be obtained by analyzing a single renewal period as
shown in Figure 3.2
Page 33
23
ACKT
slotT
DIFST
0 1 n
Idle Period
Busy Periodtime
Figure 3.2: The renewal period considered for the throughput analysis of multi rate 802.11 MUD MAC protocol
As described earlier, each station enters the exponential back-off process upon sensing
the channel busy or experiencing a collision. There may be more than one stations that finish
their backoff process earlier than others and hence start transmitting their frames simultaneously.
Therefore the shared communication medium is idle at the start of each renewal period until the
time a back-off process of any station(s) comes to an end. Those stations whose back-off counter
reaches zero then start transmitting their frames simultaneously. Since CSMA/CA protocol
requires any station to sense the medium before transmitting its frame, no station can start
communication as long as the channel is occupied. It is clear from Figure 3.2 that once a busy
period starts, the medium remains occupied until the transmission of the maximum time
consuming frame finishes. The data transmitted in one busy period is taken to be the sum of
effective data transmitted by all the stations. We further explain each of them, idle period, busy
period, and equivalent successful data transmission in the subsequent pages.
We can now define the network throughput as follows:
Page 34
24
UThroughputI B
=+
(3.8)
where U denotes the average amount of successful data transmission, I the average idle period,
and B the average busy period.
3.2.2 Idle Period
The average idle period is defined as the time before any of the stations start their frame
transmission. We obtained the probability when no station is transmitting its frame in a slot, pidle
in the last section. The average idle period (number of slots in fact) is calculated as the average
of the geometric distribution, i.e.,
0
(1 )1
n idleidle idle
n idle
pI n p pp
∞
=
= − =−∑ [slots]. (3.9)
3.2.3 Busy Period
The busy period (in the unit of slots) is defined as the duration of the maximum time-consuming
frame transmitted. Note that the frame may be generated from any station in any group. The
frame length of any stations regardless of membership to a group is identically distributed, and it
is geometrically distributed with parameter q. The probability that the packet length is l is given
by
1{ } (1 )lP L l q q −= = − for l = 1,2,…. (3.10)
The distribution function is then given by
{ } 1 (1 )lP L l q≤ = − − for l = 1,2,…. (3.11)
Page 35
25
Note that average frame length is 1/q [bits].
We now move on to model the length of the maximum frame in the ith group, which is
transmitted at the rate ri bit-per-second [bps]. Note that with multi-rate link adaptation, the rate
is different for each group 1,2, ,i N= . After that, the maximum time consuming frame is
modeled. Note that the maximum time consuming frame may be transmitted by any station from
any group. Let’s define the unit for frame lengths as the number of bits.
We define max,iL as the maximum size of a frame generated by a station in ith group,
where ,j iL is defined as the frame length by jth station in the ith group. Since it is assumed that
that there are ni stations transmitting their frames simultaneously from the ith group, the
maximum length given ni can be written as
( )max, 1, 2, 3, ,: max{ , , ,..., }ii i i i i n iL n L L L L= . (3.12)
Then, we can find the distribution function for this random variable max,iL , given that there
are ni number of stations from the ith group which are transmitting their data. It is given by
( )max, 1, 2, ,
,1
{ } { , ,..., ,}
{ }
[1 (1 ) ]
i
i
i
i i i i n i
n
j ij
nl
P L n l P L l L l L l
P L l
q=
≤ = ≤ ≤ ≤
= ≤
= − −
∏ (3.13)
The second line in (3.13) is due to the fact that the frame lengths of all the stations are
mutually independent with each other, and the third line is from (3.11).
Let’s measure time in the unit of the number of slots again. Without loss of generality,
take the slot duration is equal to 1sec. We use (3.12) to get the distribution function of max,it , the
maximum time consumed by a frame transmitted by an ith group station, where max, max,i i iL rt=
[bits]:
Page 36
26
( ) ( ){ }max, max,{ }
1 (1 ) ii
i i i i i
nr
P t n P L n r
q τ
τ τ≤ = ≤
= − − (3.14)
Similarly, since the lengths of frames of all the stations are independent of each other,
max,it are also independent of each other for all groups. Therefore, the maximum time taken by a
frame transmitted by a station belonging to any group, maxt , can be defined, given that there are a
total of ni stations belonging to the ith group transmitting their frames and the total number of
stations transmitting is 1
N
ii
n n=
=∑ . The time maxt can be defined as
( ) ( ) ( ) ( )max max,1 1 max,2 1 max,max{ , ,..., }N Nt t n t n t n=n (3.15)
where ( )1 2: Nn n n=n . Now the distribution of maxt can be found, i.e.,
( ) ( ) ( ) ( )max max,1 1 max,2 1 max,
1
{ } { , , ... , }
1 (1 ) ii
N N
N nr
i
P t P t n t n t n
q τ
τ τ τ τ
=
≤ = ≤ ≤ ≤
= − − ∏
n (3.16)
With the above distribution function, we can calculate the expected value of maxt , i.e.,
( ) ( )
( )
( )1
1
max max0
10
010
010
1
1 1
( ) { }
1 1 (1 )
1 (1 )
(1 ) , for 0
ii
ii
i
i
ii
i
i
N nr
i
nN xi r
xi i
nN xi ri
xi i
n
x
E t P t d
q d
nq d
x
nq d x
x
nx
τ
ττ
ττ
τ
ττ
τ
ττ
τ
τ τ
τ
τ
τ
=∞
=
=∞
==
=∞
===
=∞
===
=
= >
= − − −
= − − −
= − − − ∀ ≠
= −
∫
∏∫
∑∏∫
∑∏∫
∑
n n
( ) 1 1( )
10
1 , for 0N
N N
N
nr x r xN
ix N
nq d x
x
ττ
τ
τ=∞
+
==
− ∀ ≠
∑∫
(3.17)
Page 37
27
where the third line is due to the use of binomial expansion. Note that when 1 0Nx x= = = ,
the first term of binomial expansion is equal to 1. Excluding such a case, the last two steps are
obtained. We note that (3.17) can be evaluated by the following
( )( )
1
1
1max
1
1{ }
ln(1 )
N
N
Ni
nni i
Nx x
i ii
nx
E tx r q
α
τ=
=
−
= −
∏∑ ∑
∑n (3.18)
where 1
Nii
xα=∑ .
Averaging the expected value (31) over all possible vectors n will give us the average
busy period :
( ){ }1 1 max 1 2{ , , } , , ,B
N N NS
B P n k n k E t k k kτ= = =∑ [slots] (3.19)
where ( ){ }1 , , :0B N i iS k k k M≤ ≤ . The protocol overheads such as TACK and DIFST in
terms of number of slots can be added to the busy period.
3.2.4 Successful Effective Data Transmission
The effective data transmitted in one renewal period is defined as the averaged data being
successfully served by the access node within a single renewal period.
For m-MUD, the access node is capable of detecting up to m frames simultaneously; a
collision occurs if more than m stations simultaneously attempt to transmit their frames. Hence
the effective data transmitted is zero. We define a random variable U to represent the good data
successfully served. Recall that ni is the total number of stations transmitting their frames
Page 38
28
simultaneously from the ith group. The random variable is defined as a function of the vector
( )1 2: Nn n n=n , i.e.,
,
1 1 1
1
for
0 for
inN N
x i ii x i
N
ii
L n n mU
n n m
= = =
=
= ≤
= >
∑∑ ∑
∑ (3.20)
Then the average effective data being transmitted, U , can be found by averaging over
vector n as was done for the case for the average busy period analysis, as well as over the frame
length. It is then given by
1 11
{ , , }U
N
N N iS i
U P n k n k n L=
= = =∑ ∑ [bits] (3.21)
where 1/L q= is the average frame length [bits] and the set US is defined
as ( ){ }1 1, , : and 0 N
U N i i iiS k k k m k M
=≤ ≤ ≤∑ .
3.2.5 Network Throughput
Finally, by substituting (3.21), (3.19), and (3.9) into (3.8), we obtain
( )
( ) ( ) ( ){ }
1
max
1
( )1
U
B U
Nii
S
idleACK DIFS
S Sidle
P nq
Throughputp P E t P T T
p
=
=+ + +
−
∑ ∑
∑ ∑
n
n n n [bits/slot] (3.22)
where ( ){ }1 1, , : and 0 N
U N i i iiS k k k m k M
=≤ ≤ ≤∑ and ( ){ }1 , , :0B N i iS k k k M≤ ≤ .
The protocol overhead should be given in the unit of the number of slots.
Page 39
29
3.2.6 Discussion
Looking closely at equation (3.22), we observe that it is dependent on the average frame length,
number of stations in each group and transmission probability of each group. We already know
from equation (2.13) that transmission probabilities are determined by two parameters, initial
contention window sizes and maximum retry limits of each group. Hence we see that throughput
is dependent on some key transmission parameters which gives us a chance to tune them in order
to study its behaviour.
In the next chapter, the numerical results based on the analytical model presented in this
chapter will be discussed. The key parameters will be identified which largely dominate the
network throughput and then its variations against those parameters will be studied.
Identification of such parameters is important as it will lead us towards system performance
optimization. The issue of fairness will also be briefly discussed when performance optimization
is performed.
Page 40
30
4.0 NUMERICAL RESULTS AND DISCUSSION ON 802.11-M WLAN
In previous chapter, we have obtained the throughput expression for the multi-rate 802.11 m-
MUD. Let’s call 802.11-m from now on. In this chapter, we use these expressions to evaluate
and compare the performance of 802.11-m ( 2m ≥ ) system with the conventional one, i.e.,
802.11-1 (m = 1). Our results prove that our analysis of 802.11-m is generic enough to cater the
conventional system as well. Throughput optimization is then discussed and it is shown that the
performance of 802.11-m network increases significantly with increasing m.
We assume that the stations are divided into four groups; each group uses a different data
rate. Group 1 uses the highest available data rate while Group 4 employs the lowest. They are 11,
5.5, 3 and 1 Mbps respectively. The other parameters used for the generation of numerical
results are listed in Table 1.
Table 4.1: System parameters used in numerical analysis
Parameters Value Slot Duration 10 sµ DIFS Duration 20 sµ SIFS Duration 5 sµ ACK 14 bytes Average frame length 1000 bits
Page 41
31
4.1 INFLUENCE OF INITIAL CONTENTION WINDOW SIZE
In this subsection, we study the effect of initial contention window ,0iCW on network throughput
of our 802.11-m system. The effect of maximum backoff stage, max,ik is negligible, a fact that is
verified by our numerical computations as shown in Figure 4.1. This view is also shared by
Yang et al [1] who have reported minimal impact of max,ik on network throughput of
conventional 802.11.
Figure 4.2 aims to show how throughput varies as the sizes of initial contention windows
of stations belonging to group 3 and group 4 are increased. The number of stations in each group
we have used are 1 2 33, 2, 3M M M= = = and 4 2M = respectively. These values are also used
for all other graphs except when they are varied in Figure 6 and 7. Initial contention window
sizes of the faster rate groups are fixed at 32. Since these stations are using the lowest data rates,
as the size of their initial CW increases, their chances to transmit frames-- ip the transmission
probability of stations belong to group i--decrease. We note that the throughput - the sum of all
throughputs of individual groups is largely dominated by faster rate group stations. Hence the
throughput is expected to increase.
A considerable increase in throughput, about 32%, is shown for 802.11-2 in Figure 4.2, as
compared to the conventional system; while that for 802.11-3 is only about 3.0%. Note that the
throughput increase for m = 3 is very small in this setting. We will talk about the issue of
throughput maximization as m changes in the next subsection.
Page 42
32
0 200 400 600 800 1000 12002
2.2
2.4
2.6
2.8
3
3.2
3.4x 10
6
CW3=CW4. Size of initial contention window for groups 3 and 4
Net
wor
k th
roug
hput
(bps
)
retry limits 5,4,2,1retry limits 5,5,5,5retry limits 1,1,1,1
Figure 4.1: Initial contention window sizes of group 3 and 4 are varied against throughput. Graphs are obtained for
different retry limits.
Page 43
33
0 200 400 600 800 1000 12001.4
1.6
1.8
2
2.2
2.4
2.6
2.8
3
3.2
3.4x 10
6
CW, Contention Window of Group3 and Group4 Stations
Net
wor
k Th
roug
hput
(bps
)
802.11 - 1802.11 - 2802.11 - 3
Figure 4.2: Network Throughput vs. CW3,0 and CW4,0 plotted for 802.11-1, 802.11-2 and 802.11-3 MAC.
Page 44
34
9 10 11 12 13 14 15 16 17 180.8
1
1.2
1.4
1.6
1.8
2
2.2
2.4
2.6
2.8x 10
6
Number of Stations: M1 = 3, M2 = 2, M3 = 3, M4 = 1 - 10
Net
wpr
k Th
roug
hput
(bps
)
802.11 - 1802.11 - 2802.11 - 3
Figure 4.3: Network Throughput vs. M, the total number of stations. Only M4 is increased here. Graphs are plotted
for 802.11-1, 802.11-2 and 802.11-3 MAC.
Page 45
35
Next we analyze what happens when the number of stations of the lowest rate group 4M
increases, from 1 to 10. As shown in Figure 4.3, the throughput now decreases for a fixed initial
contention window size, set at 32 for all groups. This can be explained as follows: with the
increase in 4M , the number of stations contending for network resources belonging to group 4
increases. Hence more and more stations using the lowest data rate get a chance to grab the
channel and hold the channel longer. This will obviously reduce the throughput. Another factor
which reduces the throughput is that as the total number of stations increase, the chance to
collisions increase as well. Hence the effective amount of data successfully transferred will
reduce.
However, by increasing the initial contention window size of group-4 stations, their
probability of transmission, 4p can be made smaller. Hence the effect of increasing 4M can be
mitigated. Figure 4.4 indicates this situation. As the contention window size is increased from
32 to 1024, we notice that, the throughput can hold out well.
The frame size is another important parameter which influences the throughput heavily.
In the earlier section, we have modeled the frame size of each station as a geometric distribution
with parameter q. We now show in Figure 4.5 how throughput varies as the average frame
length, or 1/q is increased. The protocol overheads, shown in Table I, will play bigger role when
smaller average frame lengths are used. The throughput will thus increase as the average frame
length is increased. Average frame length also needs to be carefully chosen as the trend shows
saturation behavior after 6000 bits. Using a larger average frame length will cause larger busy
period and hence stations need to wait longer for their turn to transmit, so the quality of service
suffers.
Page 46
36
9 10 11 12 13 14 15 16 17 181.4
1.6
1.8
2
2.2
2.4
2.6
2.8
3
3.2
3.4x 10
6
Number of Stations. M1 = 3, M2 = 2, M3 = 3, M4 = 1 - 10
Net
wor
k Th
roug
hput
(bps
)
CW4 = 32CW4 = 128CW4 = 512CW4 = 1024
Figure 4.4: Network Throughput vs. M, total number of stations. Only M4 is increased here. Graphs are plotted for
four values of initial contention window of the fourth group, which are 32, 128, 512 and 1024.
Page 47
37
0 1000 2000 3000 4000 5000 6000 7000 8000 9000 100000
0.5
1
1.5
2
2.5
3x 10
6
Average frame length (bits)
Net
wor
k Th
roug
hput
(bps
)
802.11 - 1802.11 - 2802.11 - 3
Figure 4.5: Network Throughput vs. Average length of frame. Graphs are plotted for 802.11-1, 802.11-2 and
802.11-3 MAC.
Page 48
38
4.2 THROUGHPUT OPTIMIZATION VS. FAIRNESS
Now we study how throughput can be optimized for the multi rate 802.11-m system. As we
learned from earlier examples in this paper, the initial contention window size determines the
transmission probability pi and hence the throughput. One trivial optimization solution with
maximum throughput can be obtained when casting all of the network resources to the fastest
rate group stations. However, then the other lower rate group stations will not be able to
transmit any frames. This can be observed in Figure 4.7. We consider a BSS consisting of only
two groups and throughput is plotted as function of the transmission probabilities, 1p being the
probability for the faster rate group. Note that the optimum point occurs when the transmission
probability of the slower rate group set to zero, i.e., 2 0p = .
Therefore, the throughput maximization must be investigated with some form of fairness.
Different criteria can be used for fairness. In this paper, we consider proportional fairness and
see if non trivial optimal points are available. Under the proportional fairness criteria, the
transmission probabilities of different groups are varied together in proportion. As we have done
so far, let’s divide the stations into 4 groups, and make pi for each group equal to each other, i.e.,
1 2 3 4p p p p= = = . Every group has equal chance of transmitting frames. We observe from
Figure 4.6 that there exists optimal 1p for each m and substantial throughput enhancement can
be made as m increases.
Page 49
39
0 0.1 0.2 0.3 0.4 0.5 0.6 0.7 0.8 0.9 10
0.5
1
1.5
2
2.5
3
3.5
4
4.5x 10
6
Transmission Probability of stations of each group, p1=p2=p3=p4
Net
wor
k Th
roug
hput
(bps
)
802.11 - 1802.11 - 2802.11 - 3802.11 - 4802.11 - 5802.11 - 6802.11 - 7
Figure 4.6: Network Throughput vs. p1--the probability that station of group 1 transmits. Graphs are plotted for
802.11-1, 802.11-2, …, 802.11-7 MAC.
Page 50
40
00.2
0.40.6
0.81 0
0.20.4
0.60.8
10
2
4
6
8
10
x 106
p1p2
Net
wor
k Th
roug
hput
(bps
)
Figure 4.7: Throughput vs. p1 and p2. The plot is for 802.11-2 with only two groups.
Page 51
41
Another point of interest that can be studied from Figure 4.6 is that as m increases, the
optimal transmission probabilities also increase, hence giving the stations more chance to
transmit their frames. This makes sense. Hence as m increases, simultaneous transmissions are
encouraged by increasing their transmission probabilities (by decreasing initial contention
window sizes).
4.3 MODIFICATOINS TO EXPLOIT FULLY THE MUD CAPABILITY
Having established that the 802.11-m system as discussed in this paper do provide significant
throughput enhancement even in distributed MAC, we now discuss enabling system components
by which this enhancement can be realized.
4.3.1 Physical Layer Modifications
At the physical layer, we want to use non spreading based techniques to perform MUD to
improve on spectrum spectral efficiency. It has been shown that Low Density Parity Check
(LDPC) codes can be used to identify and decode information from several sources transmitted
simultaneously [19] [20] using massage passing iterative decoders. As for the multi rate scenario,
all the stations transmit their physical layer header using 1 Mbps. The signal field of header
contains information about the rate at which the station is going to transmit [1]. After extracting
the data rate information, the access node can start decoding at that data rate.
Page 52
42
4.3.2 MAC Layer Modifications
At the MAC layer, all stations will use DCF with CSMA/CA to acquire network resources. It is
possible that more than one stations finish their backoff process simultaneously. They will hence
start transmission. A collision will occur in multi rate 802.11-m system when more than m
station finish their backoff process at the same time and start transmission. We are assuming no
hidden terminals in this paper and all the stations start frame transmission at the start of a time
slot. Thus, we are using basic access DCF without Request-to-Send and Clear-to-Send
(RTS/CTS) procedure. The use of RTS/CTS will be useful for solving the hidden terminal
problem. We plan to extend the current work to this situation in our future contribution.
Our work presented here show that the throughput can be optimized for a given network
setting. For example, each station can get the estimate of number of stations contending for
network resources, it can tune its initial contention window size to achieve the optimal
throughput point as in Figure 4.6. After the optimal probabilities are obtained, the initial
contention window sizes can be back calculated using (13). These optimum probabilities and
initial contention window sizes can be pre-calculated for different network loads M and a loop-
up table can be used. For example, considering 802.11-2 system, the optimal probabilities from
Figure 4.6 can be observed as 0.07. This will result in initial contention window sizes of 13 if
we set maximum backoff stage of all groups equal to 5. Similar exercise can be performed for
other values of m to populate a look up table.
Therefore, our answers to the questions stated in the introduction of the paper have been
clearly answered so far. Namely, the DCF in 802.11 can indeed be used to exploit the m-MUD
capability. The required modification is very simple: use optimal initial set of contention
windows obtained from the optimal transmission probabilities via a look-up table. The
Page 53
43
throughput scales reasonably well as we have seen from Figure 4.6 worth a further study on this
problem.
Page 54
44
5.0 CONCLUSION
In this work, we have analyzed a proposed multi rate 802.11-m MAC system where up to m
stations can transmit their frames simultaneously using different data rates. We have obtained
new analytic expression for the network throughput. The analysis result is general enough to
subsume previous throughput expressions for 802.11 protocol. While the use of a MUD capable
receiver at the physical layer has the potential to significantly improving performance, it is
shown that controlling MAC parameters is very important to be able to actually achieve the
benefit. The only goal should not be throughput maximization which will inadvertently ignore
low rate group stations. We have shown that the proposed framework can tell us how the
throughput can be maximized under the proportional fairness setting.
In the current work, we have assumed that every station can hear every other station, i.e.
no hidden terminals. Possible research directions include conducting analysis with hidden
terminals and then studying their effect on the performance. The RTS/CTS mechanism can then
be included to investigate its effectiveness in combating hidden terminal interference in our
proposed 802.11-m system.
Page 55
45
APPENDIX A
LIST OF KEY VARIABLES
N : the total number of groups
iM : the number of ith group stations, 1, 2, ,i N=
M : the total number of stations, i.e., 1
Nii
M M=
=∑
in : the random variable representing the number of stations from ith group starting transmission
simultaneously
n : a random variable representing the total number of stations starting transmission, i.e., 1
Nii
n n=
=∑
,0iCW : the size of the initial contention window of a station in ith group
,retry ik : the maximum number of retransmission attempts allowed for a station in ith group
max,ik : the number of retransmission attempts after which the size of contention windows will seize to
increase
,i kCW : the size of the contention window of a station in ith group at the kth stage
,b ip : the probability that channel is sensed busy by an ith group station
,c ip : the probability that frame of an ith group station collides with frame of a station belonging to any
other group
Page 56
46
I : the average length of idle period (in slots)
B : the average length of busy period (in slots)
U : average successful effective data being transmitted (in bits)
Page 57
47
BIBLIOGRAPHY
[1]. Duck-Yong Yang, Tae-Jin Lee, Kyunghun Jang, Jin-Bong Chang and Sunghyun Choi, “Performance Enhancement of Multi Rate IEEE 802.11 WLANs with Geographically Scattered Stations”, IEEE Transaction on Mobile Computing, vol. 5, no. 7, pp. 906-919, July 2006. [2]. J. Zhang and Heung-No Lee, “Throughput enhancement with a modified 802.11 MAC protocol with multi-user detection support,” International Journal of Electronics and Communications, vol. 62, issue 5, pp. 365-373, May, 2008. [3]. G. Bianchi, “Performance Analysis of the IEEE 802.11 Distributed Coordinated Function,” IEEE Journal on Selected Areas of Communications (JSAC), vol. 18, no. 3, pp. 535–547, Mar. 2000. [4]. Hyungu Park and Chong-kwon Kim, “Performance Analysis of Multi Rate IEEE 802.11 WLANs with Channel Error,” Proc. of the 9th International Conference on Advanced Communication Technology, Vol.3, pp. 1479-1481, Feb. 2007. [5]. Osama Abu-Sharkh and Ahmed H. Tewfik, “Performance Analysis of Multi-Rate 802.11 WLANs Under Finite Load and Saturation Conditions”, IEEE Vehicular Technology Conference 2005, vol. 4, pp 2652 – 2657. [6]. Peng Xuan Zheng, Ying Jun Zhang, Soung Chang Liew, “Analysis of Exponential Backoff with Multipacket Reception in Wireless Networks”, Proceedings of 31st IEEE Conference on Local Computer Networks, pp 855 – 862, 2006. [7]. P. X. Zheng, Y. J. Zhang and S. C. Liew, "Multipacket reception in wireless local area networks," Proc. IEEE ICC'06, Istanbul, Turkey, June, 2006. [8]. L. Kleinrock and F. A. Tobagi, “Packet switching in radio channels: part i – carrier sense multiple access modes and their throughput delay characteristics,” IEEE Trans. on Communications, vol. 23, no. 12, pp. 1400–16, Dec. 1975. [9]. S. Verdu. Multiuser Detection. Cambridge Univ. Press, New York, 1998.
Page 58
48
[10]. A. J. Viterbi, “Very low rate convolutional codes for maximum theoretical performance of spread spectrum multiple-access channels,” IEEE Journal on Selected Areas of Communications, vol. 8, pp. 641–649, Aug. 1990. [11]. G. Bianchi, “IEEE 802.11 – Saturation Throughput Analysis”, IEEE Communications Letters, vol. 2, no. 12, pp. 318-320, Dec 1998. [12]. S. Ghez, S. Verdu, and S.C. Schwartz, “Stability properties of slotted aloha with multipacket reception capability,” IEEE Trans. Automatic Control, vol. 33, no. 7, pp. 640–8, Jul. 1988. [13]. L. Tong, Q. Zhao, and G. Mergen, “Multipacket reception in random access wireless networks: From signal processing to optimal medium access control,” IEEE Communications Mag., vol. 39, no. 11, pp. 108-112, Nov.2001. [14]. Q. Zhao and L. Tong, "A dynamic queue protocol for multi-access wireless networks with multipacket reception," IEEE Trans. on Wireless Comm. , vol. 3, no. 6, pp. 2221-2231, Nov. 2004. [15]. IEEE 802.11, Wireless LAN Medium Access Control (MAC) and Physical Layer (PHY) Specifications, Aug. 1999. [16]. B. J. Kwak; N. O. Song, and L. E. Miller, "Performance analysis of exponential backoff," IEEE/ACM Trans. Networking, vol. 13, no. 2, pp. 343-355, Apr. 2005. [17]. F. Cali and E. Gregori, “Dynamic Tuning of the IEEE 802.11 Protocol to Limit,” IEEE/ACM Trans. Networking, vol.8, no.6, pp. 785-99, Dec. 2000. [18]. M. Heusse, F. Rousseau, G. Berger-Sabbatel, and A. Duda, Performance Anomaly of 802.1 lb, in Proceedings of IEEE INFOCOM 2003. [19]. D. S. Chan and T. Berger, “Performance and Cross-Layer Design of CSMA for Wireless Networks with Multipacket reception,” Proc. of Asilomar Conf. on Signals, Systems and Computers, vol. 2, pp. 1917-1921, Nov. 2004. [20]. J. Wu and H.-N. Lee, “Performance analysis for LDPC space-time coded modulation in MIMO multi-access channels,” IEEE Trans. on Communications, vol. 55, no. 7, pp.1417-1426, July, 2007. [21]. A. Sanderovich, M. Peleg, and S. Shamai, “LDPC coded MIMO multiple access with iterative joint decoding,” IEEE Trans. on Information Theory, vol. 51, no.4, pp. 1437- 50, April 2005. [22]. A. Goldsmith, "Variable-Rate Variable-Power MQAM for Fading Channels," in Proc. IEEE Vehicular Technology Conference, Atlanta, GA, Apr. 1996, pp. 815--819.
Page 59
49
[23]. S. Ci and H. Sharif, “An link adaptation scheme for improving throughput in the IEEE 802.11 wireless LAN,” Local Computer Networks, 2002. Proceedings. LCN 2002. 27th Annual IEEE Conference on, 6-8, Pages:205 – 208, Nov. 2002. [24]. Li Ping, Qinghua Guo, and Jun Tong, “The OFDM-IDMA approach to wireless communication systems,” IEEE Wireless Communications Mag., pp. 18-24, June 2007. [25]. Li Ping, Lihai Liu, Keying Wu, and W. K. Leung, "Interleave Division Multiple-Access," IEEE Trans. Wireless Communications, vol. 5, no. 4, pp. 938-947, Apr. 2006. [26]. A. Sanderovich, M. Peleg, S. Shamai, “LDPC coded MIMO multiple access with iterative joint decoding,” IEEE Transactions on Information Theory, 51(4): pp. 1437-1450, 2005.


![Modeling Multi-Cell IEEE 802.11 WLANs with …arXiv:0903.0096v2 [cs.NI] 14 Mar 2009 Modeling Multi-Cell IEEE 802.11 WLANs with Application to Channel Assignment Manoj K. Panda and](https://static.documents.pub/doc/80x56/5fa7f74365a6a336a10e51d8/modeling-multi-cell-ieee-80211-wlans-with-arxiv09030096v2-csni-14-mar-2009.jpg)

