PERFORMANCE ANALYSIS OF MULTI-SERVICE DS-CDMA CELLULAR NETWORKS WITH SOFT HANDOFF King Yung Hor B.A.Sc. The University of British Columbia, 2001 A THESIS SUBMllTED IN PARTIAL FULFILLMENT OF THE REQUIREMENTS FOR THE DEGREE OF MASTER OF APPLIED SCIENCE In the School of Engineering Science O King Yung Hor 2004 SIMON FRASER UNIVERSITY Fa11 2004 All rights reserved. This work may not be reproduced in whole or in part, by photocopy or other means, without permission of the author.
Transcript
PERFORMANCE ANALYSIS OF MULTI-SERVICE DS-CDMA CELLULAR NETWORKS WITH
SOFT HANDOFF
King Yung Hor B.A.Sc. The University of British Columbia, 2001
A THESIS SUBMllTED IN PARTIAL FULFILLMENT OF THE REQUIREMENTS FOR THE DEGREE OF
MASTER OF APPLIED SCIENCE
In the School of
Engineering Science
O King Yung Hor 2004
SIMON FRASER UNIVERSITY
Fa11 2004
All rights reserved. This work may not be reproduced in whole or in part, by photocopy
or other means, without permission of the author.
APPROVAL
Name: King Yung Hor
Degree: Master of Applied Science
Title of Thesis: Performance Analysis of Multi-Service DS- CDMA Cellular Networks with Soft Handoff
Examining Committee:
Chair: Dr. Rodney Vaughan Professor, Engineering Science, SFU Chairman
Dr. Steve Hardy Professor, Engineering Science, SFU Senior Supervisor
Dr. Tejinder Randhawa Adjunct Professor, Engineering Science, SFU Supervisor
Dr. Paul Ho Professor, Engineering Science, SFU Examiner
Date Approved: &d~; Am&
SIMON FRASER UNIVERSITY
Partial Copyright Licence
The author, whose copyright is declared on the title page of this work, has granted to
Simon Fraser University the right to lend this thesis, project or extended essay to users of
the Simon Fraser University Library, and to make partial or single copies only for such
users or in response to a request from the library of any other university, or other
educational institution, on its own behalf or for one of its users.
The author has further granted permission to Simon Fraser University to keep or make a
digital copy for circulation via the Library's website.
The author has further agreed that permission for multiple copying of this work for
scholarly purposes may be granted by either the author or the Dean of Graduate Studies.
It is understood that copying or publication of this work for financial gain shall not be
allowed without the author's written permission.
Permission for public performance, or limited permission for private scholarly use, of any
multimedia materials forming part of this work, may have been granted by the author.
This information may be found on the separately catalogued multimedia material.
The original Partial Copyright Licence attesting to these terms, and signed by this author,
may be found in the original bound copy of this work, retained in the Simon Fraser
University Archive.
Bennett Library Simon Fraser University
Burnaby, BC, Canada
DS-CDMA networks are fast evolving from voice only networks to multi-service
networks. A key requirement for next generation networks is the ability to support a
heterogeneous mix of services with varying traffic characteristics. Many papers
assumed fixed capacities in their analysis which is applicable to FDMA and TDMA. Only
recently have papers in the literature begun to analyze the effect of soft capacity and soft
handoff on network performance. To the author's best knowledge, there is none that
analyzes the impact of soft handoff on multi-service DS-CDMA cellular networks.
This thesis delineates the impact of soft handoff and user mobility on QoS parameters of
multi-service DS-CDMA networks. The main contribution of this thesis is analytical
model that includes soft handoff while supporting voice and video with user mobility
taken into account. System performance parameters such as call blocking probability
and call dropping probability are analytically determined using Markov Chain Analysis.
ACKNOWLEDGEMENTS
The author would like to thank his senior supervisor and supervisor, Dr. Steve Hardy and
Dr. Tejinder Randhawa for their helpful suggestions, guidance and support throughout
the course of the research. Their advice and assistance in the preparation of this thesis
in gratefully acknowledged.
Finally, the author would like to thank his parents for their support and encouragement
during the past two years.
TABLE OF CONTENTS
................................................................................................................ Approval ii ... ............................................................................................................... Abstract 1 1 1
.............................................................................................. Acknowledgements iv
.................................................................................................. Table of Contents v
....................................................................................................... List of Figures vi ...
List of Tables ...................................................................................................... VIII
................................................................................ Abbreviations and Acronyms ix
Chapter 1 1.1
1.1.1 1.1.2
1.2 1.3
Chapter 2 2.1 2.2 2.3 2.4
Chapter 3 3.1 3.2 3.3
3.3.1 3.3.2
3.4 3.5
3.5.1 3.5.2
3.6
Chapter 4
Chapter 5
..................................................................................... Introduction 1 Related work ...................................................................................... 3
.................................................................. CDMA cellular networks 4 ............................................................................. Call level control 5
..................................................... Network Performance analysis 27 System analysis ............................................................................... 28
.............................................................................. Channel analysis 33 ..................................................................... Reverse Link Capacity 34
Propagation Model ........................................................................ 35 ........................................................................ Interference Model 37 ...................................................................... Call admission control 45 .................................................................... Call blocking probability 49
CDMA network coverage specifying the handoff and normal regions ............................................................................................ 3
............................................ Current cellular access technologies 11
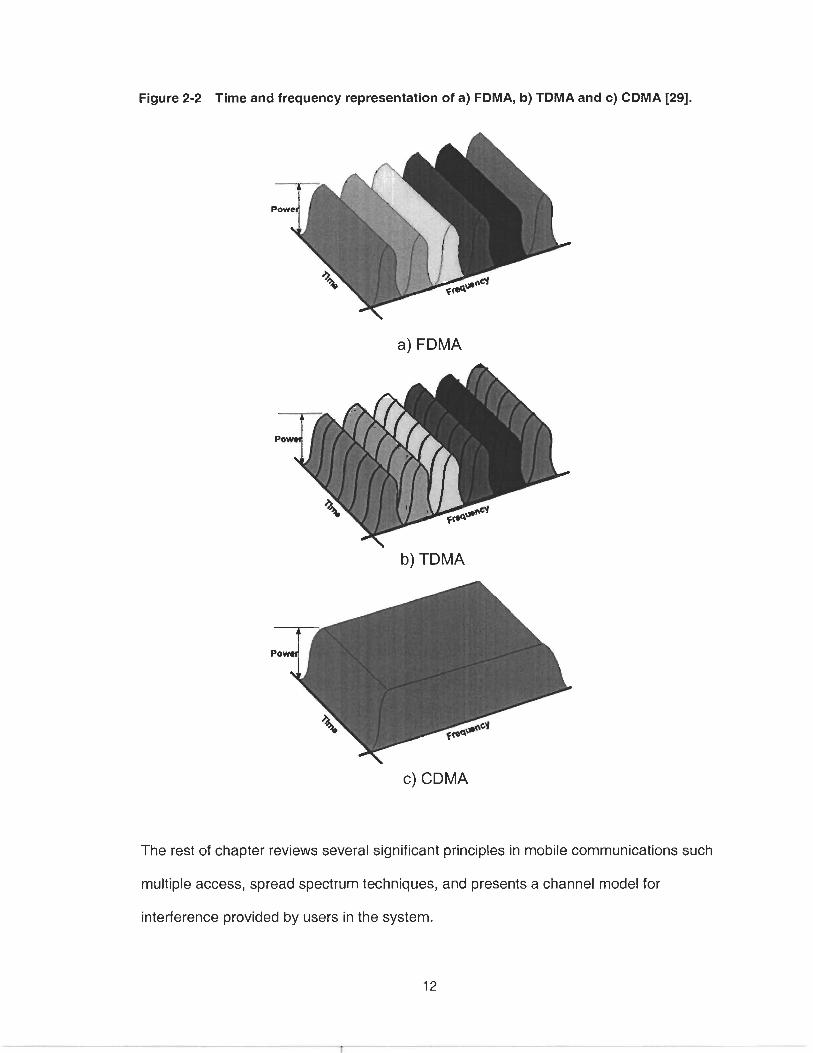
Time and frequency representation of a) FDMA. b) TDMA and c) CDMA [29] ......................................................................... 12
.......................................... Orthogonal signals in the time domain 15
Autocorrelation function ................................................................ 17
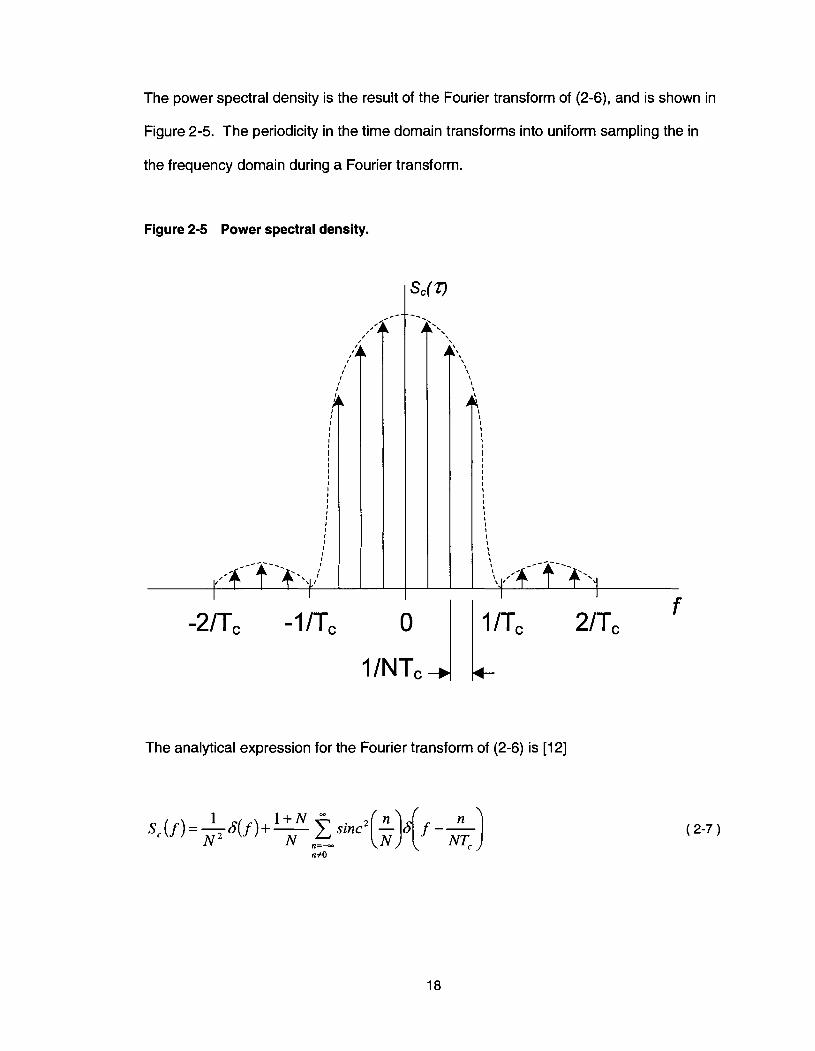
Power spectral density .................................................................. 18
Handoff process ............................................................................ 30
................. Cell level traffic from handoffs and regional transitions 32
Edl, histogram and log-normal approximation in a power control scheme [20] ....................................................................... 36
A MS in a soft connection with two base stations ml and m2 ........ 44
...................................................................... Markov chain model 47
Call blocking probability of voice with CS ...................................... 60
.................................... Call blocking probability for video with CS 61
............ Call blocking probability of new and handoff calls with CS 62
Call blocking probability for voice with PS ..................................... 63
Call blocking probability for video with PS ..................................... 64
.......... Call blocking probability for new and handoff calls with PS 65
Call dropping probability in the normal region with CS and PS ................................................................................................. 66
Figure 4-8 Call dropping probability in the handoff region with PS ................. 67
Figure 4-9 New call blocking probability when G=128 with CS ...................... 68
Figure 4-1 0 Call blocking probability for new calls with PS .............................. 69
............................. Figure 4-1 1 New call blocking probability as a function of a 70
vii
LIST OF TABLES
Table 2-1 Truth table for phase modulation 8(t), radians [I 21 ........................ 21
As mentioned earlier, to protect against jamming, the data signal purposely occupies
more bandwidth than required. One method of widening the bandwidth of the data
signal involves modulation. The binary data sequence is denoted bk is encoded using a
polar nonreturn-to-zero level encoder and generates the corresponding data signal
denoted b(t). The PN code generator generates the PN sequence c(t) and the desired
modulation is achieved by multiplying the data sequence with the PN sequence. From
Figure 2-6, the product result of the baseband modulation is m(t).
A commonly used passband technique called coherent binary phase-shift keying (BPSK)
can be incorporated into the transmitter and receiver. As shown in Figure 2-7, a BPSK
modulator takes the signal m(t) and produces the DS-BPSK transmitted signal. The
phase modulation B(t) of x(t) has values 0 and n; depending on the polarities of the
message signal b(t) and the PN signal c(t) in accordance with the truth table [12].
Table 2-1 Truth table for phase modulation qt), radians [12].
I
Additional channel noise j(t) is added into the transmitted signal. The received signal y(t)
goes through two stages of demodulation as shown in Figure 2-7c). The received signal
y(t) and a locally generated carrier and low-pass filter (LPF) whose bandwidth is equal to
the original message signal m(t). The local generate PN code sequence is used to
Polarity of Data Sequence b(t) at t. I
Polarity of PN Sequence c(t) at t.
demodulate the spectrum dispreading by multiplying the LPF output with replica of the
PN sequence c(t). The next stage integrates the output of the multiplier over a bit
interval 05KTb, followed by decision making device.
+ -
0
7C
7~
0
Figure 2-7 DS-BPSK a) transmitter b) channel model c) receiver.
(a) DS-BPSK transmitter
Binary Data Sequence bk
(b) Channel model
1 I 1- Say 1 if v
Polar NRZ level b(t) m(t) Encoder
Local Carrier
d t ) 4
Local PN mde Generator 1
BPSK Modulator
-
PN Code Generator
(c) DS-BPSK receiver
~ ( 0 ,
Carrier
2.3 Fading channel
In the real environment, a MS is surrounded by objects such as buildings, mountains
and trees that reflect and scatter transmitted radio waves. For a single transmitted radio
wave, the receiver will receive the original directed wave and many reflected waves at
from different directions and arrival times. In addition, due to different arrival angles and
times, the received radio waves will have different phases. The path lengths of various
reflected waves at the receiver are different resulting in different propagation times or
time dispersion. Time dispersion causes inter-symbol interference (ISI). The aggregate
of all the received waves will either be constructive or destructive.
Figure 2-8 Multipath signals arriving at the mobile station.
The three distinguishing features of a radio channel is path loss, shadowing and short-
term fading. Signals in a mobile environment undergo a path loss [23]. Obstacles and
terrain variations introduce reflections resulting in a path loss of approximately between
30 to 40 db [23]. Shadowing is a long-term fading phenomenon. The mean of the
received signal can be modelled with a log-normal distribution. Physical obstacles such
as hills, building and trees cause diffraction and scattering of the transmitted signal. The
probability density function of the signal power S is [I 31.
-
where <, is the mean and ais the standard deviation. The power is expressed in
decibels and is given by
<, = lologlo S .
The random variable Scan be expressed as
where is a Gaussian random variable. The received signal power at a base station
decreases with distance according to the power law.
Short-term fading is a result of a large number of reflectors which move randomly
relative to each other. The magnitude of the complex representation of the short-term
fading gain is modelled by a Rayleigh fading process [I 31.
2.4 Rake receiver
Fading due to multiple propagation paths in the communication channel is one of the
most significant sources of potential degradation. As mentioned earlier, multipath
propagation is common in urban areas and many indoor environments. One of the
major benefits of DS-CDMA is the ability of the direct-sequence spread spectrum to
mitigate the effects of multipath fading. Direct sequence spread spectrum allows for
individual components to be separated from the multipath signal [25] and enables a
correlation receiver to reject components of the multipath signal while permitting the
combination of these components. The Rake receiver allows for this and enhances
performance [26].
The ability of the receiver to resolve multipath components is determined largely by the
channel characteristics. The chip rate, defined as the number of chips per channel
symbol, and the number of taps in the rake receiver influence the ability of the receiver
to resolve multipath components.
CDMA spreading codes are designed to have very low crosscorrelation between
successive chips. Multipath components delayed by more than one chip period Tc are
uncorrelated and appear as resolvable paths. Often CDMA systems are engineered to
have several resolvable paths within the multipath delay spread. Unilaterally, the delay
spread is chosen less than the bit duration Tb. A delay greater than Tb, will result in a
data rate higher than the coherence bandwidth. This in turn results in ISI. IS1 can be
avoided if the data rate is maintained below the coherence bandwidth. When the delay
spread is lower than Tb, there will be several versions of the transmitted code sequence.
At the matched filter receiver, each of the delayed signals appears as another
uncorrelated user and is ignored.
Essentially, the Rake receiver is a diversity receiver based on the fact that multipath
components in a CDMA system are uncorrelated if the relative delays are larger than the
chip period T,. Multipaths separated by more than one Tcperiod from the main path
appear as copies of the received signal that can be constructively aggregated to
increase the performance of the receiver. For example, if one of the multipath
components is attenuated by fading, there is high probability other signals are unaffected
by fading. The signals unaffected by fading can be used at the receiver. The attractive
feature of a CDMA receiver over other receivers is its ability to take advantage of the
multipath phenomenon.
Multipath processing uses parallel correlators for the incoming PN sequence. Each
correlator, shown in Figure 2-9, is used to separately detect one of the L strongest
multipath components. The outputs from the correlators are weighed and aggregated to
estimate the transmitted signal.
Figure 2-9 The Rake receiver with L branches.
Correlator c Decision Device
Local Carrier
CHAPTER 3 NETWORK PERFORMANCE ANALYSIS
A unique feature of the CDMA scheme is that all users transmit simultaneously and at
the same frequency. The transmitted signals occupy the entire system bandwidth. As
mentioned earlier, code sequences are used to separate one user from another. CDMA
systems can reuse the same entire spectrum for all cells resulting in the frequency reuse
factor as equal to 1.
The capacity of a real CDMA system is interference limited. Hence, the key issue in
CDMA cellular network performance and design is the minimization of interference. As a
result, power control becomes an important issue in multiple access interference. In
CDMA, there is no distinct limit on the number of users as in FDMA and TDMA. Instead,
system performance degrades as the number of active users increase. In voice only
networks, increasing the number of users pass a certain threshold will cause
unintelligible speech and eventual outage. During video or data transmission, channel
integrity will be comprised resulting in bit errors at the receiver.
Another difference between CDMA and other multiple access technologies is soft
handoff. In CDMA, different cells use the same frequency bandwidth and differ only in
code sequences. Thus, it is not necessary to hard handoff from one frequency to
another. The impact of soft handoff is considered in the analysis. This chapter
discusses the main factors affecting the capacity of CDMA cellular networks and
provides expressions for reverse link capacity, interference and user mobility.
3.1 System analysis
For analytical purposes, the thesis divides the cell into three circular regions: the normal
region A,, soft handoff region Ah and the adjacent cell region A, (area outside the cell of
interest). As shown in Error! Reference source not found. the perimeter of the normal
and handoff region are denoted Lo and Lh respectively. We assume handoff calls from
adjacent cells arrive only in the handoff region. A new call arrival into the cell is
modelled as an independent Poisson process with arrival rate AN,j where the subscript i
represents the service Si. The thesis denotes k1 and k2 as voice and video service
respectively. It is widely accepted that voice call arrivals can be modelled with a Poisson
distribution. However, video calls are rarely modelled with Poisson distribution. For
simplicity, this thesis assumes that video calls arrivals are Poisson distributed. The
system assumes that the call origination rate is uniformly distributed over the entire
mobile service area. New call arrival rates in the normal and handoff region are
expressed as
where a is the ratio of the handoff area to the cell area [3]. The traffic model assumes
that soft handoff arrivals occur only in the handoff region and is Poisson distributed with
call arrival rateAL,i. The process of soft handoff is now discussed.
Figure 3-1 Cell topology.
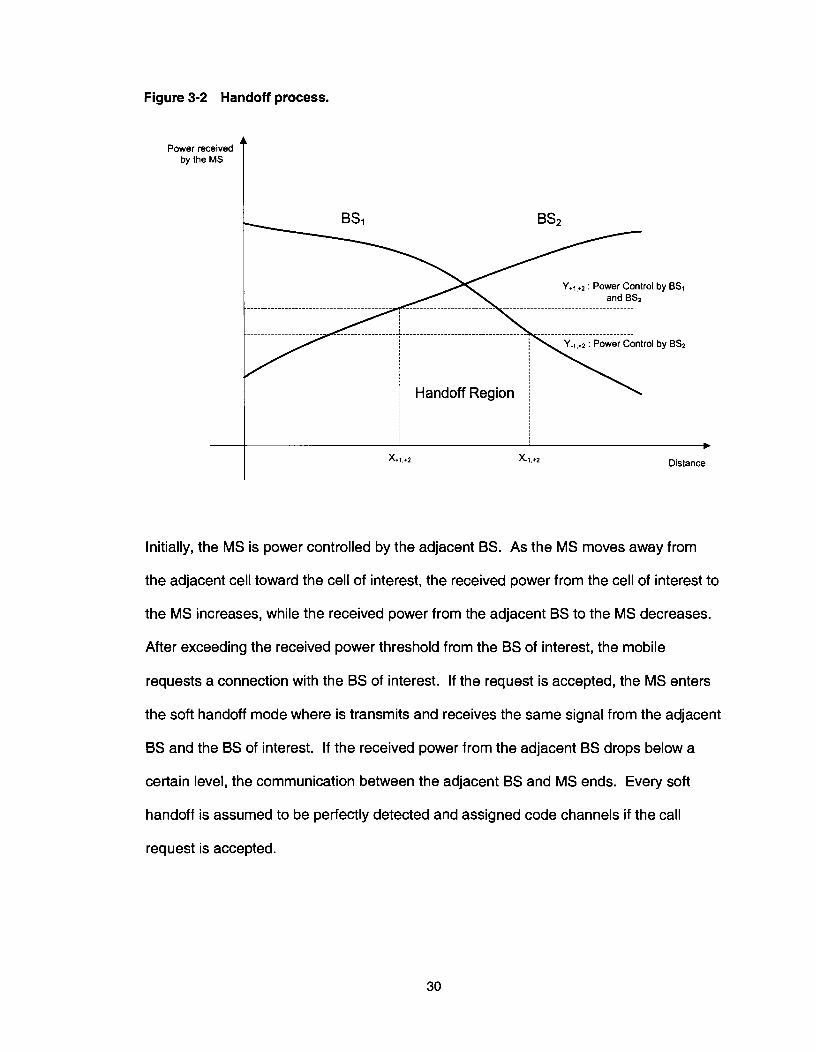
Figure 3-2 Handoff process.
Power received by the MS
Y+l,+2 : Power Control and BS2
v
Distance
Initially, the MS is power controlled by the adjacent BS. As the MS moves away from
the adjacent cell toward the cell of interest, the received power from the cell of interest to
the MS increases, while the received power from the adjacent BS to the MS decreases.
After exceeding the received power threshold from the BS of interest, the mobile
requests a connection with the BS of interest. If the request is accepted, the MS enters
the soft handoff mode where is transmits and receives the same signal from the adjacent
BS and the BS of interest. If the received power from the adjacent BS drops below a
certain level, the communication between the adjacent BS and MS ends. Every soft
handoff is assumed to be perfectly detected and assigned code channels if the call
request is accepted.
A regional transition occurs when a MS traverses between the handoff region and the
normal region. Like Su et a/. [3], the call holding times in the normal and handoff region
have periods of l/p0,i and l/ph,j respectively. From Xie and Kuek [ I 01, a random
movement traffic model is assumed in which a MS moves with random speed vi,
uniformly distributed between [0, VJ. The mean rate of incoming mobiles in the cell of
interest is equal to the mean rate outgoing mobiles. From the conditions of mobility
equilibrium and uniformity among cells, handoffs arrive with the following rate
where E[nhti] is the mean number of users in the handoff region. The unencumbered
channel holding time is exponentially distributed with mean l/pM,j given that no handoff
fails. The regional transition rate is approximated as a ratio of the mean number of MS's
leaving the cell per second and the mean number of terminals in the cell of interest.
Similar to [ I 01, the regional transition rates in the normal and handoff region are
The thesis further defines rates of transition between the cell regions. A MS moving
from handoff region to an adjacent cell has a rate pha,i; and, a MS moving from the
handoff region into the normal region has rate pho,i. From [3] the average probability that
a MS in the handoff region moves into the normal region is given by bk. The value of bk
is determined by the areas of the normal and handoff regions. From [4], the rates of
transition out of the handoff region are
The total arrival rates in the normal and handoff region are
Incoming handoffs from adjacent cells enter only the handoff region as shown in Figure
3-3 a). Mobile users that traverse between the normal and handoff region within the cell
are called a regional transition as shown in Figure 3-3b). New call arrivals can occur in
both normal and handoff region
Figure 3-3 Cell level traffic from handoffs and regional transitions.
3.2 Channel analysis
The communication channel by which a MS communicates with a BS is complicated to
model with a definitive mathematical expression. Due to the complexity of the
communication channel, the thesis assumes the communication channel is modelled as
a Gaussian distribution. The random processes that occur from physical phenomena
are often modelled by a Gaussian model. Results from experiments usually confirm the
appropriateness and accuracy of the Gaussian model when describing a physical
phenomenon. From the ease with which a Gaussian process is mathematically applied
makes the Gaussian process important in the study of communications.
Without loss of generality, let Y be a random variable. The random variable Y has a
Gaussian distribution if its probability density function (PDF) has the form
where ,uy is the mean and 02 is the variance of the random variable Y. The random
variable Y is normalized when ,uy is equal to zero and 02 is equal to one or
The central limit theorem provides the mathematical rationalization for the use of the
Gaussian model for a large number of different physical phenomena in which the
observed random variable, at a particular instant of time, is the result of a large number
of individual random events. For illustration purposes, let Xi, i = 1, 2, . . . N be a set of
random variables satisfying the following requirements [ I 21:
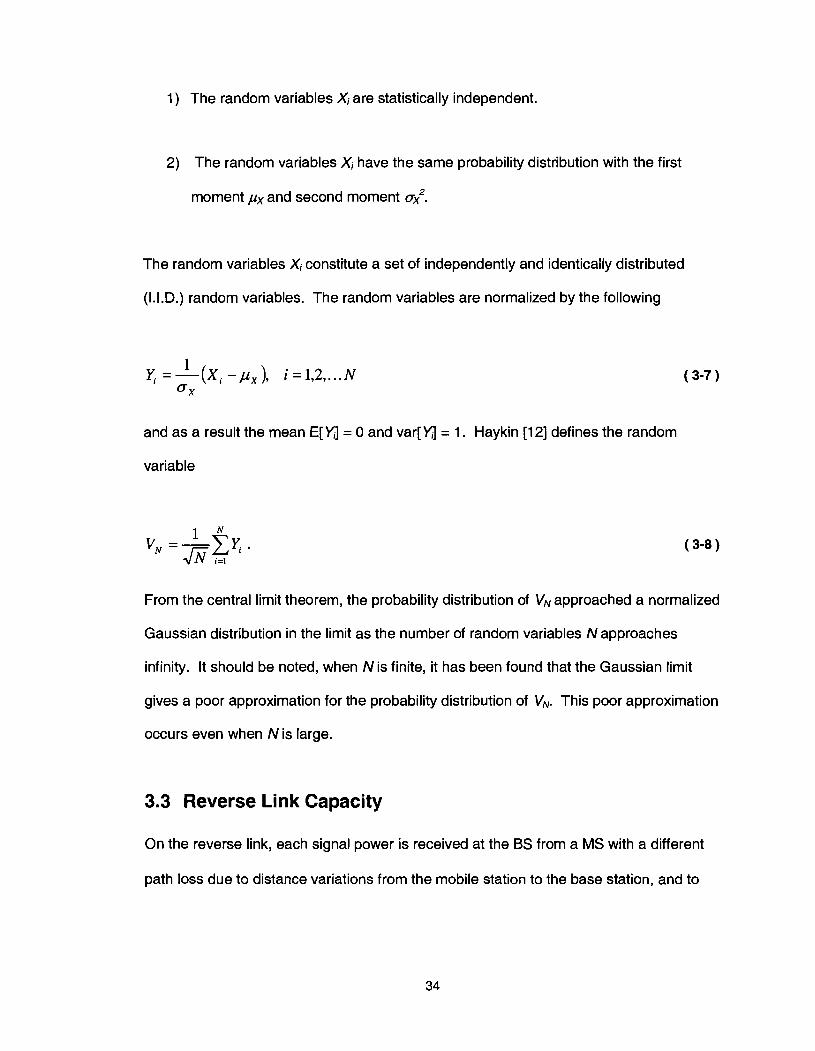
1) The random variables are statistically independent.
2) The random variables Xi have the same probability distribution with the first
moment px and second moment ax2.
The random variables Xi constitute a set of independently and identically distributed
(I.I.D.) random variables. The random variables are normalized by the following
and as a result the mean E[&] = 0 and var[fl = 1. Haykin [I 21 defines the random
variable
From the central limit theorem, the probability distribution of VN approached a normalized
Gaussian distribution in the limit as the number of random variables N approaches
infinity. It should be noted, when N is finite, it has been found that the Gaussian limit
gives a poor approximation for the probability distribution of VN. This poor approximation
occurs even when N is large.
3.3 Reverse Link Capacity
On the reverse link, each signal power is received at the BS from a MS with a different
path loss due to distance variations from the mobile station to the base station, and to
variations in the signal path propagation. As a result, power control becomes a major
issue.
3.3.1 Propagation Model
If the received power is strong, it will introduce interference to other users in the cell and
degrade their performance. However, if a received signal at the BS is too weak, it will be
veiled by stronger signals. The capacity of a CDMA system is maximized if each mobile
station is power controlled such that the received signals at the base station are of equal
power. In ideal situations, perfect power control can eliminate the near-far effect
resulting in less interference affecting the system performance. However, in real
systems, power control is not ideal. As shown in [20], the received signal power at the
base station is approximately log-normally distributed. The standard deviation of the
received signal-to-noise ration is typically between 1 db and 2 db.
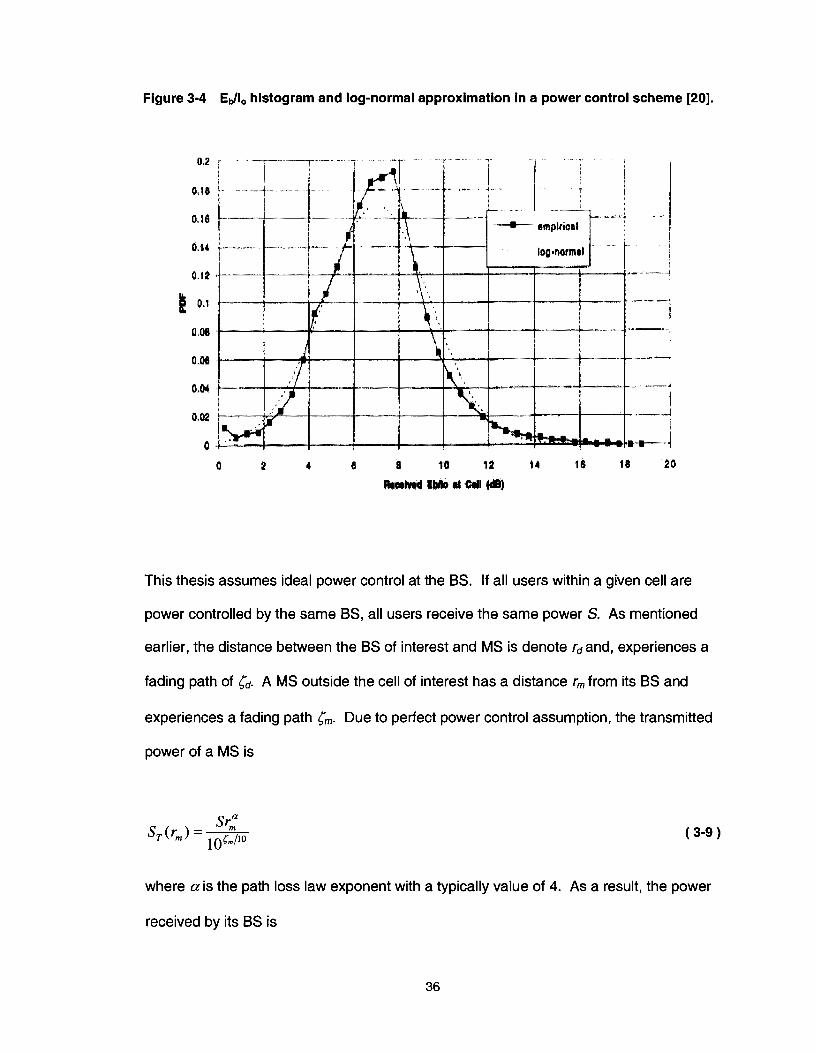
Figure 3-4 Edl, histogram and log-normal approximation in a power control scheme [20].
This thesis assumes ideal power control at the BS. If all users within a given cell are
power controlled by the same BS, all users receive the same power S. As mentioned
earlier, the distance between the BS of interest and MS is denote rd and, experiences a
fading path of Jd. A MS outside the cell of interest has a distance rm from its BS and
experiences a fading path 6,. Due to perfect power control assumption, the transmitted
power of a MS is
where a is the path loss law exponent with a typically value of 4. As a result, the power
received by its BS is
The interference power from a MS in an adjacent cell at a distance rd from the given BS
depends on the propagation loss from the mobile to the given BS and propagation loss
from interfering mobile to its own BS. The interference power is written as
Both Jd and J, are both zero-mean Gaussian random variables with standard deviation
a[6] . Fast fading due to multipath is assumed not to affect the average power level.
This propagation model is based on distance-based path loss and lognormal shadowing.
Based on this propagation model, the next section provides analytical expressions for
interference generated by voice and video users in the cell site.
3.3.2 Interference Model
lntracell interference is defined as the interference received at the BS of interest from
users in the same cell with either a hard or soft connection. Intercell interference is
defined as the interference received at the BS of interest from users outside the cell with
no connection to the BS of interest. The network considered in this thesis supports
video and voice users. For a multi-service DS-CDMA network, blocking is defined to
occur when the interference provided by voice users, video users, and thermal noise
exceed a threshold I, Wor
Video Interference + Voice Interference + WNe> WIe ( 3-1 2)
where W, Ne, and Ie is the spread spectrum bandwidth, thermal noise density, and
maximum acceptable interference density respectively. The thesis assumes MS's in the
normal region have a hard connection with the BS of interest while MS's in the handoff
region have a soft connection with the BS of interest.
Narrainen and Takawira [4] denote the interference generated by MS's in the normal
region as I,. In addition, they define the intracell interference generated by soft MS's as
Ih+ and the intercell interference generated by soft MS's as Ii. lnterference generated by
MS's located in the normal region outside the cell of interested with a hard connection to
one BS is denoted la,, and the interference generated by MS's in the handoff area
outside the cell of interest with connections to two BS's is denoted lab (excluding BS of
interest). The total interference can be expressed as
where nOsl is the number of voice users in the normal region, nO,~ is the number of video
users in the normal region, nhrl is the number of voice users in the handoff region, and
nh, is the number of video users in the handoff region. Equation (3.1 3) should satisfy
the following
where G=W/R is the processing gain and q=N& is nominally 0.1. Similar to [4], the
interference is assumed to be Gaussian distributed and has the following mean and
variance
where E[nJ and E[nJ are the mean number of users in the normal and handoff region
respectively. The mean interference per user generated by MS's in the normal region is
Cmp The intracell interference generated by MS's in the handoff region as CmPh+ and the
intercell interference generated by MS's in the handoff region as Cm,i. The mean
interference generated by MS's located in the normal region of an adjacent cell with one
connection to a BS is denoted Cm,,, and the mean interference generated by MS's in the
handoff area with connections to two BS1s is denoted CmPah (excluding the BS of interest).
The variance of the interference per user generated by MS's in the normal region is Cv,,.
The variance of the intracell interference generated by MSs in the handoff region as Cv,h+
and the intercell interference generated by MS1s in the handoff region as Cv,;. The
variance of the interference generated by MS's located in the normal region of an
adjacent cell with one connection to a BS is denoted C,,, and the variance of the
interference generated by MS's in the handoff area with connections to two BS's is
denoted Cv,,h (excluding BS of interest). The probability of accepting a new call depends
on the interference conditions given in equations (3-12) and (3-14). Therefore, the
probability of accepting a user is [4]
In addition, the thesis assume uniform density p of users or MS's in the cell of interest
such that
The next section presents provides the various interference equations used in this
thesis.
a) lntracell Interference I,
As mentioned earlier, the intracell interference is generated by MS's within the normal
region that has a hard connection with the BS of interest. From the central limit theorem,
I, can be approximated by the Gaussian distribution. The mean and the variance of the
intracell interference are [4]
where
where yis the channel activity factor. Channel activity detection is employed such that
each MS has a ON probability of yand a OFF probability of 1 -y.
b) lntracell lnterference Ihi
The intracell interference Ih+ is caused by MS that have a soft connection but is power
controlled by the BS of interest. From the central limit theorem, the thesis assumes the
intracell interference Ihf is Gaussian distributed. The expectation and the variance of the
intracell interference Ihfare
where
and Q(.) is the famous normalized Gaussian function. The intracell interference I( can
be evaluated by integrating over handoff area.
c) Intercell Interference I;
In intercell interference, the MS is not power controlled by the BS of interest. Instead,
the MS is power controlled by the mth BS. The moment statistics such as the
expectation and the variance of the intercell interference /;are [6]
where
and
To compute Ii, the double integral over the handoff area Ah is evaluated numerically.
d) lntercell Interference Iao
lntercell interference la, is generated from users with a single hard connection with
another BS and outside the BS of interest. Iao is similar to Ii except the over the
adjacent cell area Aaas shown in Error! Reference source not found.. The double
intergration is over Aaand the mean of the total intercell interference is expressed as [6]
The variance of the intercell interference lab can be expressed as
Both functions f ( r m / r d ) and g- ( r , / rd ) are derived in (3-24). However, in the case of
intercell interference Iahthe MS has a hard connection with a BS. Therefore, both (3-26)
and (3.28) both use 0, instead of ah
e) lntercell Interference lob
lntercell interference lOh is generated by a MS having connections with two BS m, and
mn. The distance from the MS to ml is denoted rml, and the distance from the MS to mn
is denoted rm2. Figure 3-5 depicts the interference provided by the MS to the BS of
interest, located a distance rd.
Figure 3-5 A MS in a soft connection with two base stations m, and m2.
The first moment of can be express as the following upper bounded equality [6]
where
cm,ah = ~m[(?) ' Ah fol [") l m 2 - ('1 fo2 (")Idrd 'm2 drml drm2
and
and
The second moment or var[lah] of /ah is bounded by the following expression [6]
The derivation of var[.] in equation (3-34) can be found in [6]. The variance var[.] in (3-
34) is given by
3.4 Call admission control
Quality of service is measured in terms of call blocking probability and call dropping
probability. In older multiple access schemes such as TDMA and FDMA, users are
allocated channels based on current availability. The call is blocked if there are no
available channels. The blocking probability can be obtained from the analysis of a
M/M/S/S queue. In general, the first M indicates call arrivals are modelled as Poison
process with arrival rates of ;1 callls, the second M refers to exponential service time with
mean I/p slcall, the first n refers to the number of channels, and finally, the second n
refers to maximum number of acceptable users before blocking occurs. The famous
Erlang-B equation [21] under the conditions of a M/M/S/S is
where U p is offered traffic measured in Erlangs. In this thesis, the Markov chain
describing call level transitions is complicated. The state in the process is defined as q =
(no,,, no.2, nh,,, nhr2). The steady-state probability P(n,,, no.2, nh,,, nhV2) can be found by
numerically solving the Markov process shown in Figure 3-6 with the following condition:
In theory, an infinite number of video and voice users in the normal and handoff region
can be accepted as long as they meet the conditions set in (3-12) and (3-14). During the
numerical analysis, we will approximate the infinite summation to some reasonable but
large value.
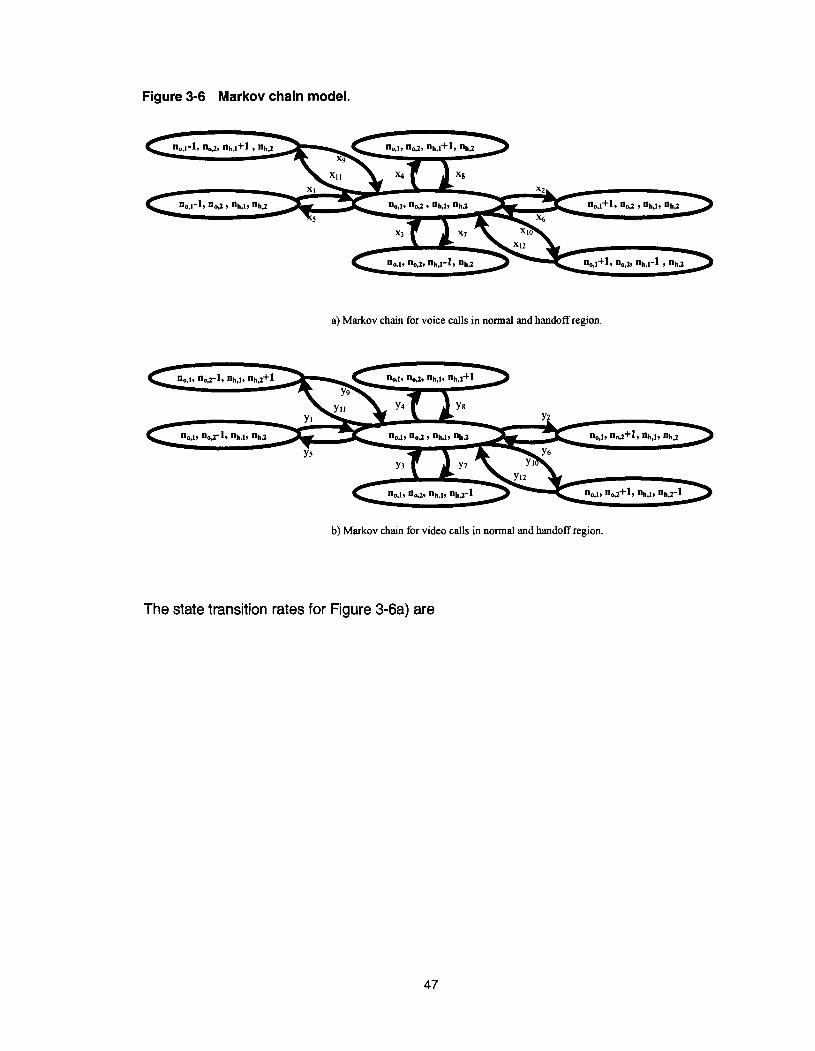
Figure 3-6 Markov chain model.
a) Markov chain for voice calls in normal and handoff region.
b) Markov chain for video calls in normal and handoff region.
The state transition rates for Figure 3-6a) are
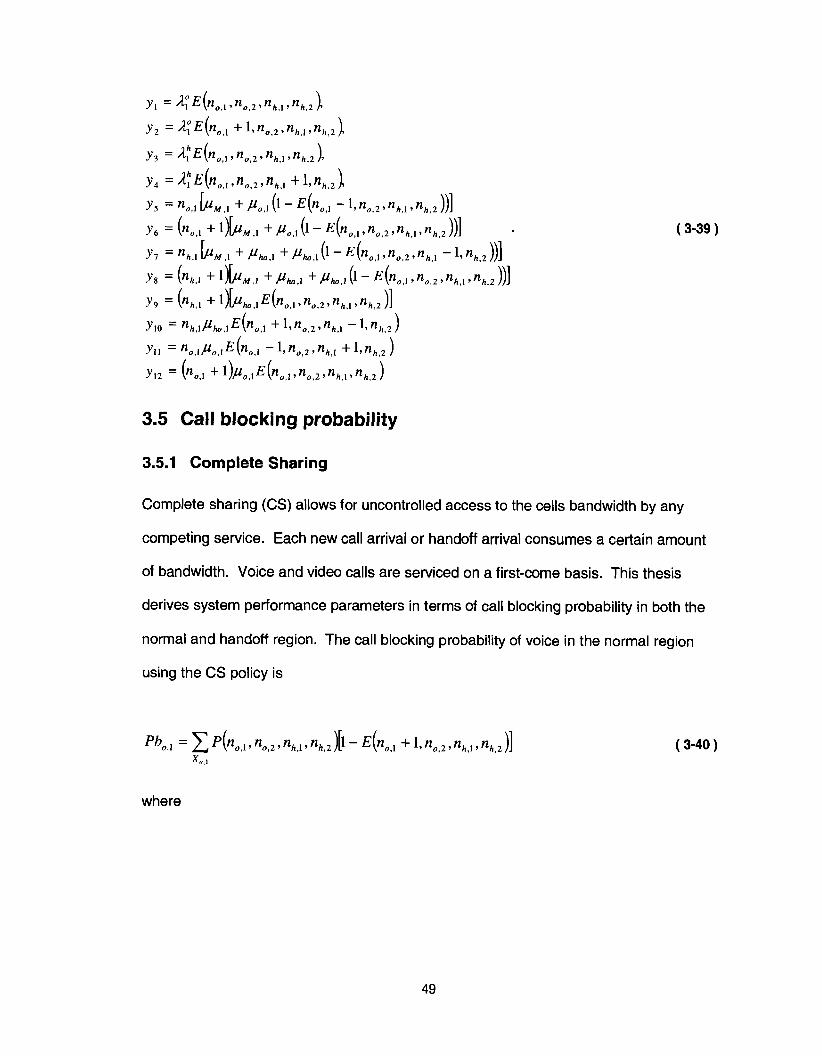
The state transition rates for Figure 3-6b) are similar to the rates listed in (3-38), but
instead with video parameters
3.5 Call blocking probability
3.5.1 Complete Sharing
Complete sharing (CS) allows for uncontrolled access to the cells bandwidth by any
competing service. Each new call arrival or handoff arrival consumes a certain amount
of bandwidth. Voice and video calls are serviced on a first-come basis. This thesis
derives system performance parameters in terms of call blocking probability in both the
normal and handoff region. The call blocking probability of voice in the normal region
using the CS policy is
where
The blocking probability of video in the normal region is
where
x0.2 =
The call blocking probability of voice in the handoff region is
where
The call blocking probability of video in the handoff region is expressed as
where
X h , 2 =
The parameters vo,l and v0,2 are the bandwidth requirements for a voice and video call in
the normal region respectively. Similarly, the parameters vh,l and Vh.2 are the bandwidth
requirements for a voice and video call in the handoff region respectively. Cis the soft
capacity which we will set to a large but realistic number during computation.
3.5.2 Partial sharing
Partial sharing (PS) is another call admission control policy that this thesis will study.
The PS policy, allocates a certain percentage of bandwidth C0,1, Coa ChPll and ChP2 for a
specific service sll s~~ s~~ and s4. The remaining bandwidth is shared amongst the
competing services. The shared portion of bandwidth C, is accessed on a first-come-
first-serve basis. The total capacity of the cell can be expressed as
Co,1+Co,2+Ch,1+Ch,2+Cs=C. The call blocking probability for voice user in the normal
under the PS policy is
where
The call blocking probability for video users in the normal region under the PS policy is
y0.2
where
The call blocking probability for voice users in the handoff region is
where
The call blocking probability for video users in the handoff region is
where
The call blocking probability for video users in the handoff region is
The section will illustrate the analysis of call blocking probability.
3.6 Call dropping probability
Other than call blocking probability, this thesis assumes A, to be much larger than the
area of the cell of interest. Thus, the probability that a MS moves out of network area is
negligible. A dropped call occurs when a call is blocked. Let the Thrj be the time spent
by a mobile in the handoff region, To,] be the time spent in the by a mobile in the normal
region, and TM,j be the total call duration. The periods Thi, To,j, and TM,j are exponential
random variables with parameters phj, p,,,, and pMMj respectively. The probability that a
MS transition out of Ah into either A, or A, is hih, and the probability that a MS transitions
out of A, into Ah is h;. Prior to call completion, the transitional probabilities can be
approximated with the following
Let { Ro, R,, R2, ... Rj} be the sequence of cells that a mobile may traverse during its /th
transitions, with round trips allowed. The dropping probability in the normal and handoff
region is then [9]
This thesis assumes a uniform traffic distribution. The probability that a call does not
complete and is dropped before the Ih transition is given by
where kl,2,3 ...=. Pbo,i and PbhPi is call blocking probability in the normal and handoff
region respectively as discussed in the previous section. The dropping probability for
calls in both the normal and handoff region is then
w h10 Pb,,, P d , , = C [h; (1 - Pb, , 11'-' h; Pb , , =
j = I I-PP(1-]
w
j-1 h hlh Pb,,, Pd,,, = C [ h : ( l - P b , , , ) ] h, P b , , = j=l '-1 .
The next section presents the results and simulations. The results from the computation
of the call blocking probability and call dropping probability are discussed.
CHAPTER 4 RESULTS AND SIMULATIONS
A two dimensional CDMA cell grid with uniform traffic distribution is considered to
evaluate two competing call admission control policies (CS and PS). The QoS is
compared between the two call admission control policies. For simplicity and clarity,
only voice and video services are considered. Call blocking probability and call dropping
probability for each service in the normal and handoff region is computed. The impact of
increasing traffic load on QoS parameters in the presence of the aforementioned call
admission control policies is studied.
The previous section derived analytical expressions for call blocking probability and call
dropping probability in the normal and handoff region. The blocking of new calls in the
normal and handoff region is
Pb, = % ~ P b o , , + %,2pb0,2 + a k , l p b h , l + ' k , 2 ~ ~ h , 2
%,I + G . 2 + 4 , 1 + % , 2
where Pb,,,, PbOr2, Pbh,, and PbhP2 are defined in (3-40) to (3-55). As mentioned earlier,
the thesis assumes handoffs from adjacent cells only occur in the handoff region. Calls
arriving from adjacent cells into the handoff region undergo call blocking equivalent to
the blocking in the handoff region or
Pb, = 4 , J p b h . l + ' ; . 2 ~ ~ h . 2
&,I +R-hH,2
Solving multi-dimensional Markov chains using numerical methods is computationally
intensive. By using a large cell area and small velocities in our analysis, the cell dwell
rates po,j and ph, j become small. As a result, the state probabilities of the 4-dimensional
Markov Chain shown in Figure 3-6 can be approximated with a product-form solution. In
general, the state probabilities can be computed by the following
where = G , ~ / P ~ , ~ , pOT2 = & , 2 / ~ M , 2 ~ h , l = k , l + ~ k . 1 ) / P M , ~ , and
phS2 = (A: ,2 + A ; , ~ ) / ~ ~ , ~ . Computer simulations were conducted to compare various
bandwidth access control policies. The DS-CDMA cellular network with competing
services: voice and video were simulated.
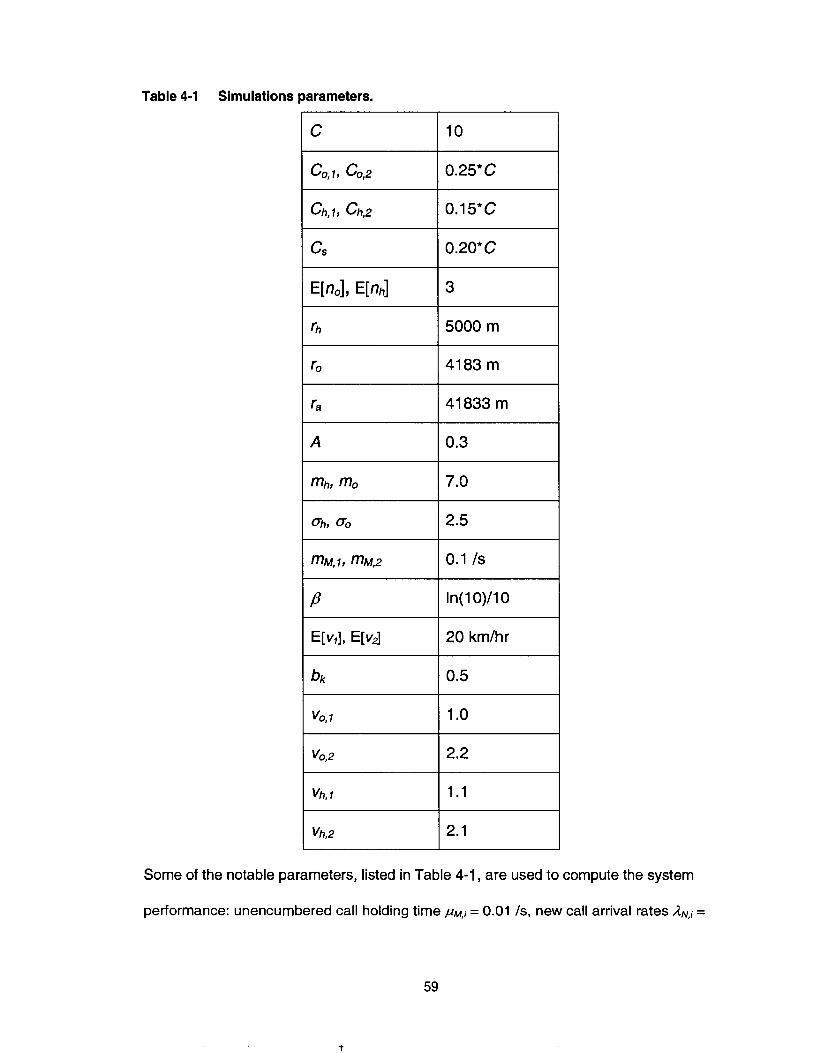
Table 4-1 Simulations parameters.
Some of the notable parameters, listed in Table 4-1, are used to compute the system
performance: unencumbered call holding time p ~ , i = 0.01 IS, new call arrival rates =
0.3 to 0.7 calls/s, bandwidth requirements vOpl = 1, vOv2 = 2, v ~ , ~ = 1.1 and Vh,2 = 2.1,
average speed of a MS E[K] = 20 kdhr, probability of transition from the handoff to
normal region bk = 0.5, and ratio of handoff area to total area a = 0.3.
Figure 4-1 Call blocking probability of voice with CS.
0.2 0.3 0.4 0.5 0.6 0.7 0.8
New call arrivals (callds)
Figure 4-1 gives the call blocking probability as a function of new call arrivals for voice in
the normal region (Pbo,l) and in the handoff region (Pbh,l). In the CS policy, the total
capacity C is shared amongst the competing traffic types. Since the bandwidth
requirements for voice is similar in both the normal and handoff region, the capacity
allocated for the voice in the two regions will also be similar. As a result, the call
blocking probability of voice is comparable in both the normal and handoff region.
Figure 4-2 Call blocking probability for video with CS.
New call arrivals(callds)
In Figure 4-2, the call blocking probability for video in the normal (Pb,,2) and handoff
region (Pbh,2) is computed. Unlike the results for voice in Figure 4-1, the blocking
probability for video is not similar in the two regions. Since the bandwidth requirement
for video is higher than voice, there is an expected corresponding increase in the overall
call blocking probability. The difference in call blocking probability between the normal
and handoff region amplifies with increasing new call arrivals. The difference is due to
uneven distribution of bandwidth in the normal and handoff region resulting in
asymmetrical call blocking between the two regions. As expected, due to asymmetrical
traffic load and heterogeneous characteristics in the two regions, the CS policy exhibits
unfairness. This effect is more pronounced with increasing traffic.
Figure 4-3 Call blocking probability of new and handoff calls with CS.
0.25 1 I I I I I
0.2 0.3 0.4 0.5 0.6 0.7 0.8
New call arrivals(calls/s)
Figure 4-3 illustrates the probability of blocking new and handoff calls. Our results are
similar to the results presented in [4]. Handoff calls are subject to only blocking in the
handoff region while new calls are subject to blocking from both the normal and handoff
region. As a result, the call blocking probabilities for new calls are higher than the call
blocking probabilities for handoff calls.
Figure 4-4 Call blocking probability for voice with PS.
0.1 I 0.2 0.3 0.4 0.5 0.6 0.7 0.8
New call arrivals (calls/s)
Call blocking probabilities for voice in the normal and handoff region are computed using
the PS policy. Figure 4-4 gives the call blocking probability versus an increase in the
offered load. The soft connection calls in the handoff region generally transmit at a
lower power than the hard connection calls in the normal region. As a result, calls in the
normal region introduce more interference than calls in the handoff region and therefore,
subject to a higher average call blocking probability. As compared to the call blocking
probability for voice using the CS policy, there is a greater difference between the
blocking probabilities between the normal and handoff region. As expected, this
difference is due the different amount of bandwidth allocated to voice users in the normal
and handoff region.
Figure 4-5 Call blocking probability for video with PS.
0.2 0.3 0.4 0.5 0.6 0.7 0.8
New call arrivals (callsk)
From Figure 4-5, the call blocking probabilities using the PS policy in the normal and
handoff region are symmetrical compared to the call blocking probabilities using the CS
policy in Figure 4-2. The PS policy can be used to optimize the call blocking probability
and throughput characteristics, by tuning the pre-allocated and shared bandwidth. In the
case of Figure 4-5, the shared bandwidth C, was set to twenty percent of the total
bandwidth.
Figure 4-6 Call blocking probability for new and handoff calls with PS.
0.2 1 , I ! I I I
0.2 0.3 0.4 0.5 0.6 0.7 0.8
New call arrivals (callsls)
Video calls require more bandwidth resulting in a large consumption of available
capacity per user. In contrast, voice calls require less bandwidth and consume less
capacity per user. As a result, call blocking probabilities for video calls are higher than
voice calls. Again, new calls are subject to blocking in both the normal and handoff
regions while handoff calls are subject to only blocking in the handoff region. Thus, new
and handoff calls are subject to different call blocking probabilities. Comparing Figure
4-6 to Figure 4-3, the thesis finds increase symmetry between the blocking probabilities
in the normal and handoff region under the PS policy as compared with the CS policy.
Again, this is due to the ability to fine tune bandwidth allocation using the PS policy.
Figure 4-7 Call dropping probability in the normal region with CS and PS.
New call arrivals (callds)
Figure 4-7 gives the call dropping probabilities for voice and video in normal region
under the CS and PS policy. Overall the dropping probability under the CS policy is
lower than the PS policy. The result is expected since due to bandwidth allocation
scheme. Users in the normal region provide greater interference
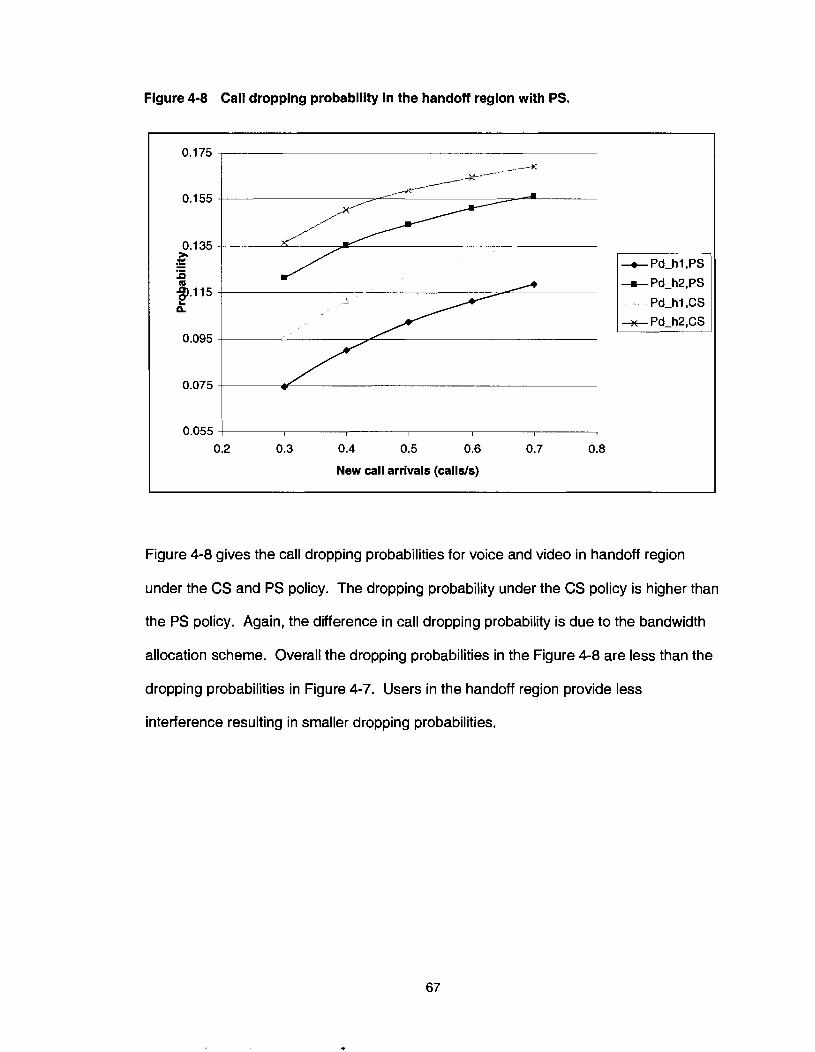
Figure 4-8 Call dropping probability in the handoff region with PS.
0.055 1 I I I I
0.2 0.3 0.4 0.5 0.6 0.7 0.8
New call arrivals (callsls)
Figure 4-8 gives the call dropping probabilities for voice and video in handoff region
under the CS and PS policy. The dropping probability under the CS policy is higher than
the PS policy. Again, the difference in call dropping probability is due to the bandwidth
allocation scheme. Overall the dropping probabilities in the Figure 4-8 are less than the
dropping probabilities in Figure 4-7. Users in the handoff region provide less
interference resulting in smaller dropping probabilities.
Figure 4-9 New call blocking probability when G=128 with CS.
0.04 0.05 0.06 0.07 0.08 0.09 0.1
New call arrivals (callds)
Realistic call blocking values are below ten percent. In order to generate call blocking
values in the aforementioned, the processing gain G is increased from 7 to 128. The call
blocking probabilities are computed using the CS scheme and the results are shown in
Figure 4-9. By increasing the capacity from capacity C from 10 to 15, there is an
improvement in call blocking. As expected the call blocking probabilities decrease with
increasing capacity for a given call arrival rate. It is obvious a larger capacity will support
more calls.
Figure 4-10 Call blocking probability for new calls with PS
0.04 0.06 0.08 0.1 0.12
New call arrivals (callsls)
The PS scheme improves the call blocking probability compared to the CS scheme by
better partitioning the available bandwidth. Comparing the Figure 4-9 to Figure 4-1 0, the
uniformity between the call blocking probabilities is preserved with increasing capacity
using PS. The asymmetrical results in Figure 4-9 are due to poor distribution of capacity
with increasing capacity. However, the increase of capacity improves and decreases the
call blocking probability since there are abundant amounts of bandwidth.
Figure 4-1 1 New call blocking probability as a function of a.
Figure 4-1 1 shows the new call blocking probability as a function of a. As mentioned
earlier, a is defined as the ratio of handoff area to cell area. From Figure 4-1 1, the
handoff blocking probability decreases with increasing a. From before, MS's in the
handoff region undergo only soft blocking while MS's in the normal region undergo both
soft and hard blocking. As the handoff area increases or the normal area decreases, the
number of new call arrivals in the handoff area increases relative to new call arrivals in
the normal region. Thus, the overall new call blocking probability decreases with
increasing a.
0.06
0.05 0.05
3 0.04 1 .- - 0.04
0.01 I I I I I
0.3 0.4 0.5 0.6 0.7 0.8 0.9
Area Ratio, a
CHAPTER 5 CONCLUSION
Due to the limited amount of available spectrum and the increase in the demand of
varying traffic types, it is imperative for wireless service providers to optimize their
networks. Thus, network performance analysis becomes very important. Only a few
papers have conducted performance analysis on multi-service DS-CDMA cellular
networks. However, to the authors' best knowledge, none have analyzed the impact of
soft handoff and user mobility on multi-service cellular networks. This thesis provides an
exact traffic model to effectively analyze teletraffic behaviour CDMA cellular networks.
The system uses a 4-dimensional birth-death model to account for voice and video users
in the normal and handoff region. The model has potential application in network
planning and bandwidth tuning of cellular networks.
The thesis applies the traffic model to a complete sharing and partial sharing call
admission control scheme that can be very effectively used in resource management.
Precise formulations to compute call level QoS parameters such as call blocking
probability and call dropping probability have been derived. Our results show close
agreement with existing models. In addition, our result were recently published in the
conference titled the World Wireless Congress [31].
[ I ] C. Simmonds and M. Beach, "Network planning aspects of DS-CDMA with particular emphasis on soft handoff," in Eighth lnternational Conference on Antennas and Propagation, vol. 2, 1 993, pp. 1007-1 01 0.
[2] A. Viterbi, A. Viterbi, K. Gilhousen, and E. Zehavi, "Soft handoff extends CDMA cell coverage and increases reverse link capacity," in Journal on Selected Areas in Communications, vol. 12, Oct. 1 994, pp. 1281 -1 288.
[3] S. Su, J. Chen and J. Huang, "Performance analysis of soft handoff in CDMA cellular networks," in IEEE Journal on Selected Areas in Communications, vol. 14, Dec. 1996, pp. 1762-1 769.
[4] R. Narrainen and F. Takawira, "Performance analysis of soft handoff in CDMA cellular networks," in IEEE Transactions on Vehicular Technology, vol. 50, NOV. 2001, pp. 1 507-1 51 7.
[51 - - - - - - - - - - , "A traffic model for CDMA cellular systems with soft capacity taken into account ," in IEEE Sixth lnternational Spread Spectrum Techniques and Applications, vol. 1 , Sept. 2000, pp. 325-329.
[6] K. Gilhousen, I. Jacobs, R. Padovani, A. Virterbi, L. Weaver Jr., and C. Wheatley Ill, "On the capacity of a cellular CDMA system," in IEEE Transactions on Vehicular Technology, vol. 40, May 1 991 , pp. 303-31 2.
[7] T. Randhawa and R. Hardy, "Traffic prediction based access control in wireless CDMA networks supporting integrated services," in IEEE Wireless Communications and Networking Conference, vol . 3, Mar. 2003, pp 79-87.
[8] - - - - - - - - - - , "Performance evaluation of priority-based call admission control in multi-service DS-CDMA cellular networks supporting VBR video traffic," in IEEE lnternational Conference on Communication, vol. 5, Apr. 2002, pp. 3096-31 05.
[ 9 1 - - - - - - - - - - , "Performance analysis of multi-service cellular networks with mobile users ," in IEEE Wireless Communications and Networking Conference, vol. 3, Sept. 2000, pp23-28.
[ lo ] H. Xie and S. Kuek, "Priority handoff analysis," in IEEE Vehicular Technology Conference, May 1 993, pp 855-858.
[ I 11 D. Hong and T. S. Rappaport, "Traffic model and performance analysis for cellular mobile radio telephone systems with prioritized and nonprioritized handoff procedures," in I€€€ Transactions on Vehicular Technology, vol. 35, Aug. 1986, pp. 77-92.
[12] S. Haykin, "Communication systems," Third Edition, John Wiley & Sons, 1 994.
[ I 31 S. Glisic and B. Vucetic, "Spread spectrum CDMA systems for wireless communications," Artech House, 1997.
[14] K.Y. Hor, T.S. Randhawa and R.H.S. Hardy, "Performance analysis of multi- service DS-CDMA cellular networks with soft handoff," in World Wireless Congress, vol. 3, May 2004, pp. 100-1 06.
[15] A. Hassan, J. Hershey and G. Saulnier, "Perspectives in spread spectrum," Kluwer Academic Publishers, 1998.
[16] P. Castoldi, "Multiuser detection in CDMA mobile Terminals," Artech House, 2002.
[ I 71 A. Sampath, N. Mandayam and J. Holtzman, "Erlang capacity of a power controlled intergrated voice and data CDMA system," in I€€€ Vehicular Technology Conference, vol. 3, May 1997, pp. 1557 - 1561.
[I 81 T. K. Lai, "Capacity of wireless CDMA networks supporting integrated voice/video services," in I€€€ lnternational Conference on Universal Personal Communications, vol. 1 , Oct. 1996, pp. 184 - 188.
[I91 A. Dabak and K. Kiasaleh, "Integrated voice and video network using variable rate CDMA," in I€€€ lnternational Conference on Converging Technologies for Tomorrow's Applications, vol. 3, Jun. 1 996, pp. 1 839 - 1843.
[20] A. M. Viterbi and A. J. Viterbi, "Erlang capacity of a power controlled CDMA system ," in I€€€ Journal on Selected Areas in Communications, vol. 1 1 , A u ~ . 1993, pp. 892 - 900.
[21] D. Bertsekas and R. Gallager, "Data networks," Englewood Cliffs, NJ: Prentice-Hall, 1987.
[22] J. G. Proakis, "Digital Communications," McGraw-Hill, 1989.
[23] R. Steele, "Mobile Radio Communications," Pentech Press & iEEE Press, 1992.
[24] A. J. Viterbi, "CDMA Principles of Spread Spectrum Communication," Reading, MA: Addison-Wesley, Apr. 1995.
[25] G. L. Turin, "Introduction to spread-spectrum antimultipath techniques and their application to urban digital radio," Proc. IEEE, vol. 68, pp. 328-353, March 1980.
[26] R. Price and P. E. Green, "A communication technique for multpath channels," Proc. IRE, vol. 46, Mar. 1958, pp. 555-570.
[27] X. H. Chen, "Adaptive traffic-load shedding and its capacity gain CDMA cellular systems," Inst. Electr. Eng. Proc. Commun., vol. 1 42, pp. 1 86-1 92, June 1995.
[28] J. Yang and M. Rajan. "Microcell performance evaluation in IS-95 based CDMA networks,": in Proc. IEEE Int. Conf. Universal Personal Communications (ICUPC'98), Florence, Italy, pp.. 899-903, Oct. 1998.
[29] Wireless Application Corp, "FDMA vs. TDMA vs. CDMA, Bellevue, Washington,<http://www.wirelessapplications.com/wireless/services/lostFo und/images/FD-TD-CDMA-Final.pdf>
[30] D. Gerakoulis and E. Gerniotis, "CDMA: Access and Switching," John Wiley & Sons, 2001 .
[31] K.Y. Hor, T. Randhawa and R. Hardy, "Performance Analysis of Multi- Service DS-CDMA Cellular Networks with Soft Handoff ," World Wireless Congress, San Francisco, June 2004.