81 Performance Analysis of Power Boiler Drum Water Level Control Systems Author Mariusz Pawlak Keywords control system, steam boiler, power unit, level control, drum, drum model Abstract Described in the paper are the structures of water level controls in power boiler drums. A boiler drum’s function is very important for the power unit process, because this is where water sepa- rates from steam, which is then superheated and supplied to the turbine. A boiler drum’s dynamic properties as an object of regulation have been listed. The model has been identified on the basis of measurement data from a real object. In the described system the control and measure- ment devices’ working conditions are difficult due to high temperature and pressure. Incorrect operation of the control system could lead to a major accident. A performance analysis has been presented of three controller level structures, to ensure the system’s stable operation. DOI: 10.12736/issn.2300-3022.2016407 1. Introduction From the viewpoint of automatic control, power boilers are very complicated control objects. There are dozens of control algo- rithms in a power unit, including a feed water control system. These systems are interrelated and incorrect operation of one of them affects the reliability of the entire power unit [7, 8]. The feed water control system aims to maintain the balance between the stream of water flowing into the boiler and the stream of steam consumed by the turbine. A measure of this condition is the water level in the drum [10, 12]. In this case, the feed water control system can be called an automatic control system of water level in the drum [1, 2, 3]. The topic of water level control in power boiler is discussed in the publications of many research centres in the world. Issues related to this control system have been known for many years and presented in books on power unit control systems [6, 10, 12]. In a drum there is a specific medium, i.e. a mixture of steam and water, with characteristics strongly dependent on the thermody- namic conditions [4, 10, 12]. Here extensive control deviation can lead to emergency outage of the entire power unit [1, 2, 11] and large economic losses, as well as threats to human safety. Therefore, the optimal struc- ture of the system and controller settings affects the reliability of the entire power unit. Such systems’ performance is analysed worldwide [1, 2, 3, 6, 11, 15]. Study [11] presents the reasons for testing this control system: damage to boiler due to low water in the drum is one of the biggest boiler operation problems, appropriate control system can minimize downtime and repair costs, water level control is the key to trouble-free and safe boiler operation. Featured in [2, 11] are very elaborate measurement and protection systems. This paper reports a study of a cascade control system in comparison to conventional 1-pulse and 3-pulse controllers. Cascade systems are also shown in studies [2, 4, 6, 11], but in a slightly different perspective than what is shown in Fig. 5a. The solution presented here stabilises performance, increases safety and reliability of the power boiler, without expanding the measurement system. 2. Properties of drum water level control object Drum is a pressure tank, where in the steam generation process steam separates from water in power boiler. The necessary condi- tion for safe boiler operation is to ensure a sufficient flow of the steam and water mixture through the evaporator pipes. This flow can be driven by natural movement of service under difference in the densities of water and water-steam mixture, so called natural circulation (Fig. 1a), or powered by additional circulating pumps (assisted circulation, Fig. 1b). Balance must be maintained in power boilers between the amount of feed water supplied to the boiler and the amount of steam produced by the boiler. Steam demand follows the turbo- generator’s electrical load. Too low water in the drum may lead to disruptions in the boil- er’s water-steam circuit and damage to poorly cooled heating surfaces, excessive water level increase may lead to penetration of droplets of water from the drum to superheater [2, 11, 12]. Due to much higher heat absorption of water than steam, this rapidly cools down the superheater tubes and activates thermal shocks which can cause a malfunction. M. Pawlak | Acta Energetica 4/29 (2016) | 81–89
Transcript
81
Performance Analysis of Power Boiler Drum Water Level Control Systems
AuthorMariusz Pawlak
Keywordscontrol system, steam boiler, power unit, level control, drum, drum model
AbstractDescribed in the paper are the structures of water level controls in power boiler drums. A boiler drum’s function is very important for the power unit process, because this is where water sepa-rates from steam, which is then superheated and supplied to the turbine. A boiler drum’s dynamic properties as an object of regulation have been listed. The model has been identified on the basis of measurement data from a real object. In the described system the control and measure-ment devices’ working conditions are difficult due to high temperature and pressure. Incorrect operation of the control system could lead to a major accident. A performance analysis has been presented of three controller level structures, to ensure the system’s stable operation.
DOI: 10.12736/issn.2300-3022.2016407
1. IntroductionFrom the viewpoint of automatic control, power boilers are very complicated control objects. There are dozens of control algo-rithms in a power unit, including a feed water control system. These systems are interrelated and incorrect operation of one of them affects the reliability of the entire power unit [7, 8].The feed water control system aims to maintain the balance between the stream of water flowing into the boiler and the stream of steam consumed by the turbine. A measure of this condition is the water level in the drum [10, 12]. In this case, the feed water control system can be called an automatic control system of water level in the drum [1, 2, 3].The topic of water level control in power boiler is discussed in the publications of many research centres in the world. Issues related to this control system have been known for many years and presented in books on power unit control systems [6, 10, 12]. In a drum there is a specific medium, i.e. a mixture of steam and water, with characteristics strongly dependent on the thermody-namic conditions [4, 10, 12].Here extensive control deviation can lead to emergency outage of the entire power unit [1, 2, 11] and large economic losses, as well as threats to human safety. Therefore, the optimal struc-ture of the system and controller settings affects the reliability of the entire power unit. Such systems’ performance is analysed worldwide [1, 2, 3, 6, 11, 15]. Study [11] presents the reasons for testing this control system: damage to boiler due to low water in the drum is one of the biggest boiler operation problems, appropriate control system can minimize downtime and repair costs, water level control is the key to trouble-free and safe boiler operation. Featured in [2, 11] are very elaborate measurement
and protection systems. This paper reports a study of a cascade control system in comparison to conventional 1-pulse and 3-pulse controllers. Cascade systems are also shown in studies [2, 4, 6, 11], but in a slightly different perspective than what is shown in Fig. 5a. The solution presented here stabilises performance, increases safety and reliability of the power boiler, without expanding the measurement system.
2. Properties of drum water level control objectDrum is a pressure tank, where in the steam generation process steam separates from water in power boiler. The necessary condi-tion for safe boiler operation is to ensure a sufficient flow of the steam and water mixture through the evaporator pipes. This flow can be driven by natural movement of service under difference in the densities of water and water-steam mixture, so called natural circulation (Fig. 1a), or powered by additional circulating pumps (assisted circulation, Fig. 1b).Balance must be maintained in power boilers between the amount of feed water supplied to the boiler and the amount of steam produced by the boiler. Steam demand follows the turbo-generator’s electrical load.Too low water in the drum may lead to disruptions in the boil-er’s water-steam circuit and damage to poorly cooled heating surfaces, excessive water level increase may lead to penetration of droplets of water from the drum to superheater [2, 11, 12]. Due to much higher heat absorption of water than steam, this rapidly cools down the superheater tubes and activates thermal shocks which can cause a malfunction.
M. Pawlak | Acta Energetica 4/29 (2016) | 81–89
82
Drum water level fluctuations resulting from imbalance between water feed water and steam production may be due to many reasons:• changes in steam pressure caused by quantity or quality of
supplied fuel• demand for steam of turbine powering a unit involved in the
power system regulation• superheated steam temperature control may also affect spray
water intake.The amount of water flowing into the drum can be regarded as system input. It can be changed by adjusting the feed pump rotation, or by opening and closing the valve at the inlet to the boiler. Water level adjustment by means of a throttle valve is used only during the start-up of large power units, or in small indus-trial plants with low efficiency grate boilers. A much more effec-tive way of regulation is the feed pump speed control. There is then no pressure loss on the valve. This solution is much more expensive due to the need to install a pump with variable rotor speed, but economically justified because of higher efficiency.Drum, as a level control object with the input of feed water inflow, can be described as a high-order inertial object with integration after formula (1). Object parameters (time constant, degree of inertia) depend on the drum design [12].
(1)
where: Δh – change in steam and water mixture level in the drum, ΔFW – change in feed water mass flow, T1 – inertia constant, n1 – order of inertia, k – gain.At steep increase in feed water to the boiler notable is a consid-erable delay due to feed water’s low temperature. Even if more water flows in the tank, the level is maintained, and in extreme cases it may even fall. The reason for this behaviour is the conden-sation of a portion of the steam bubbles under temperature drop.Dynamic model of drum level variation has a second input, the steam intake to turbine. This input can be treated as a distur-bance because its depends on the power unit’s current load.
When the drum is thermodynamically balanced and the steam and water mixture level is constant, increase in the turbine’s demand for steam will raise the level. This is due to decrease in steam pressure, followed by intensified production of steam bubbles, and increase in the level. This is despite the fact that the mass of water in the tank decreases. The level rise ceases after some time and the level begins to fall continuously. Temporary level increase at an increase in steam intake can cause malfunc-tion of the controller.The dynamics of the level of steam and water mixture in the transmittance form for disturbance, i.e. change in the turbine’s steam intake, are described by transmittance (2) [12]:
(2)
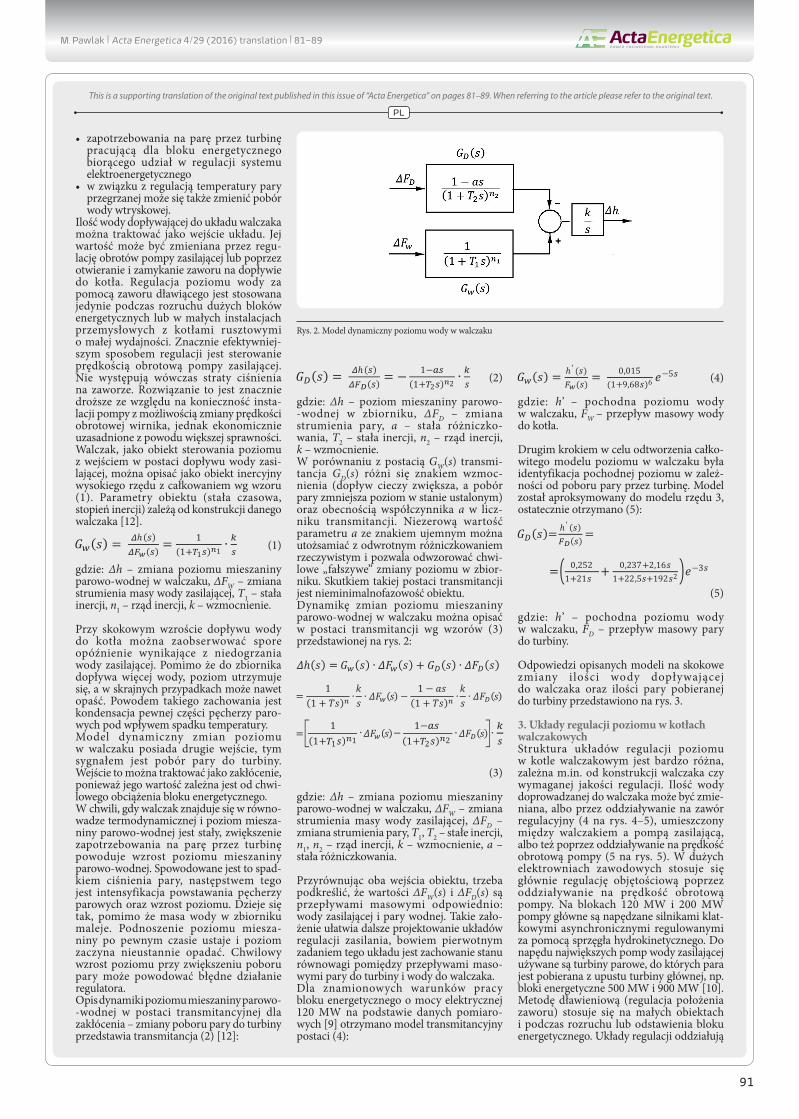
where: Δh – level of steam and water mixture in the tank, ΔFD – change in steam flow, a – derivative time, T2 – inertia constant, n2 – order of inertia, k – gain.Compared with the GW(s) format, GD(s) transmittance has different gain sign (liquid inflow increases, and steam intake reduces, the steady state level), and has a factor in the numerator. The non-zero value and negative sign of a can be identified with reverse real derivation and can reproduce momentary “false” level changes in the tank. The effect of this transmittance format is that the object is non-minimum phase.The dynamics of changes in the steam and water mixture level in the drum can be described as transmittance by formulas (3) shown in Fig. 2:
(3)
where: Δh – change in steam and water mixture level in the drum, ΔFW – change in feed water mass flow, ΔFD – change in steam flow, T1, T2 – inertia constants, n1, n2 – order of inertia, k – gain, a – derivative time.Comparing the object’s two inputs, it must be emphasized that ΔFW(s) and ΔFD(s) are the mass flows of, respectively, feed water
Fig. 1. Water circuits in drum boilers: a) boiler with natural circulation, b) boiler with assisted circulation (In – drum, PP – steam superheater, PW – water heater, PR – evaporator, PZ – feed water pump, PC – circula-tion support pump)
Fig. 2. Dynamic model of drum water level
M. Pawlak | Acta Energetica 4/29 (2016) | 81–89
83
and steam. Such an assumption facilitates further designing of the feed water control system, because its primary task is to preserve the balance between mass flow of steam to the turbine and of water to the drum.For the nominal operating conditions of a power unit with elec-tric power of 120 MW on the basis of measurement data [9] a transmittance model was obtained in the following form (4):
(4)
where: h’ – derivative of drum water level, FW – mass flow of water to boiler.
The second step in order to reproduce the entire model of drum water level was to identify the derivative of drum water level, depending on the turbine steam intake. The model was approxi-mated to order of 3, and finally (5):
(5)
where: h’ – derivative of drum water level, FD – mass flow of steam to boiler.
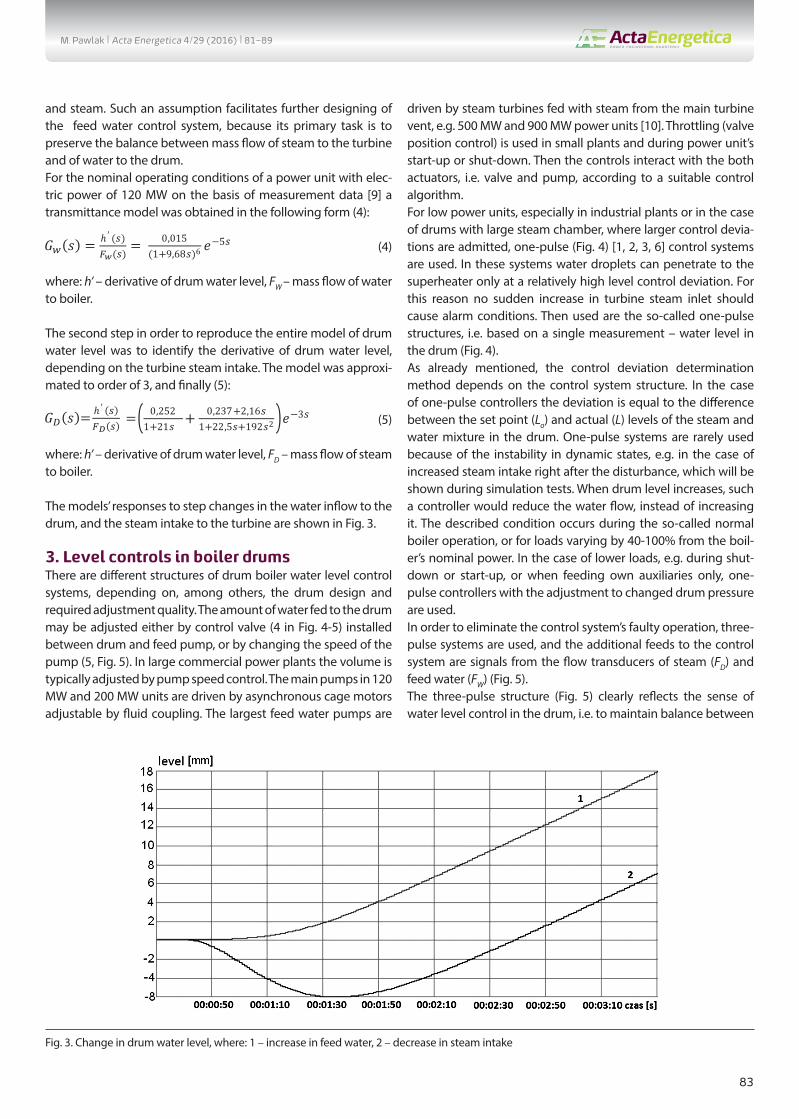
The models’ responses to step changes in the water inflow to the drum, and the steam intake to the turbine are shown in Fig. 3.
3. Level controls in boiler drumsThere are different structures of drum boiler water level control systems, depending on, among others, the drum design and required adjustment quality. The amount of water fed to the drum may be adjusted either by control valve (4 in Fig. 4-5) installed between drum and feed pump, or by changing the speed of the pump (5, Fig. 5). In large commercial power plants the volume is typically adjusted by pump speed control. The main pumps in 120 MW and 200 MW units are driven by asynchronous cage motors adjustable by fluid coupling. The largest feed water pumps are
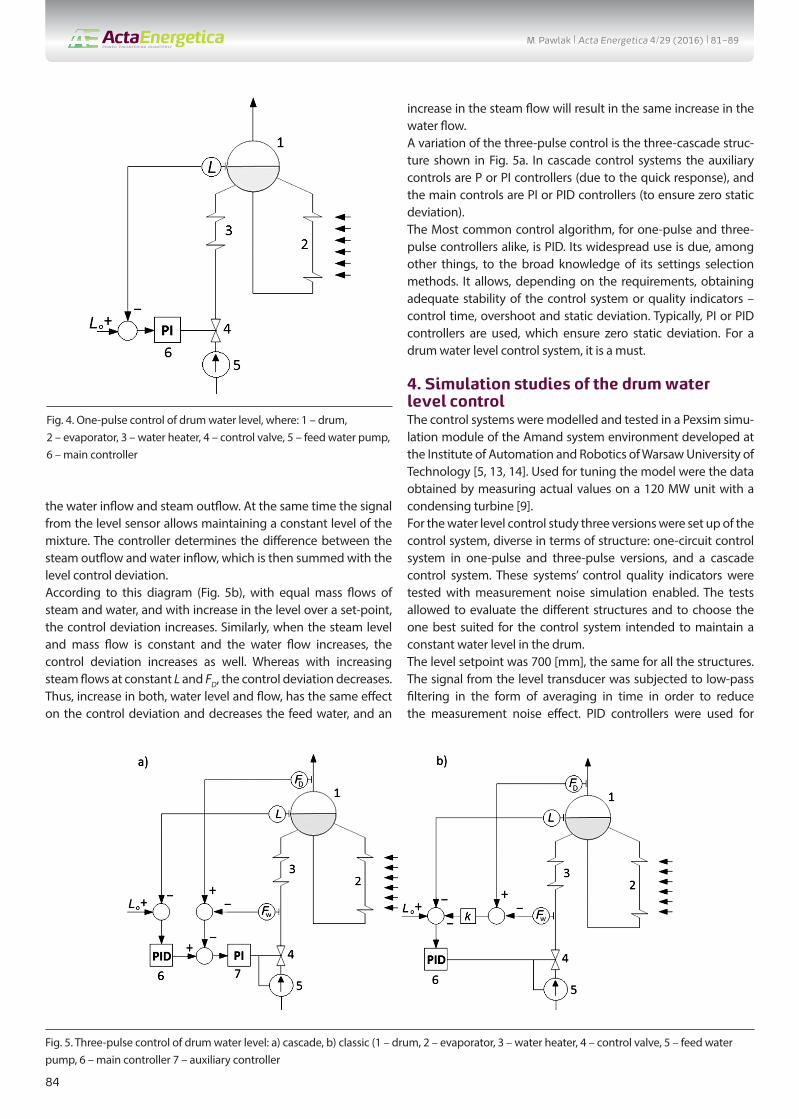
driven by steam turbines fed with steam from the main turbine vent, e.g. 500 MW and 900 MW power units [10]. Throttling (valve position control) is used in small plants and during power unit’s start-up or shut-down. Then the controls interact with the both actuators, i.e. valve and pump, according to a suitable control algorithm.For low power units, especially in industrial plants or in the case of drums with large steam chamber, where larger control devia-tions are admitted, one-pulse (Fig. 4) [1, 2, 3, 6] control systems are used. In these systems water droplets can penetrate to the superheater only at a relatively high level control deviation. For this reason no sudden increase in turbine steam inlet should cause alarm conditions. Then used are the so-called one-pulse structures, i.e. based on a single measurement – water level in the drum (Fig. 4).As already mentioned, the control deviation determination method depends on the control system structure. In the case of one-pulse controllers the deviation is equal to the difference between the set point (Lo) and actual (L) levels of the steam and water mixture in the drum. One-pulse systems are rarely used because of the instability in dynamic states, e.g. in the case of increased steam intake right after the disturbance, which will be shown during simulation tests. When drum level increases, such a controller would reduce the water flow, instead of increasing it. The described condition occurs during the so-called normal boiler operation, or for loads varying by 40-100% from the boil-er’s nominal power. In the case of lower loads, e.g. during shut-down or start-up, or when feeding own auxiliaries only, one-pulse controllers with the adjustment to changed drum pressure are used.In order to eliminate the control system’s faulty operation, three-pulse systems are used, and the additional feeds to the control system are signals from the flow transducers of steam (FD) and feed water (FW) (Fig. 5).The three-pulse structure (Fig. 5) clearly reflects the sense of water level control in the drum, i.e. to maintain balance between
Fig. 3. Change in drum water level, where: 1 – increase in feed water, 2 – decrease in steam intake
M. Pawlak | Acta Energetica 4/29 (2016) | 81–89
84
the water inflow and steam outflow. At the same time the signal from the level sensor allows maintaining a constant level of the mixture. The controller determines the difference between the steam outflow and water inflow, which is then summed with the level control deviation.According to this diagram (Fig. 5b), with equal mass flows of steam and water, and with increase in the level over a set-point, the control deviation increases. Similarly, when the steam level and mass flow is constant and the water flow increases, the control deviation increases as well. Whereas with increasing steam flows at constant L and FD, the control deviation decreases. Thus, increase in both, water level and flow, has the same effect on the control deviation and decreases the feed water, and an
increase in the steam flow will result in the same increase in the water flow.A variation of the three-pulse control is the three-cascade struc-ture shown in Fig. 5a. In cascade control systems the auxiliary controls are P or PI controllers (due to the quick response), and the main controls are PI or PID controllers (to ensure zero static deviation).The Most common control algorithm, for one-pulse and three-pulse controllers alike, is PID. Its widespread use is due, among other things, to the broad knowledge of its settings selection methods. It allows, depending on the requirements, obtaining adequate stability of the control system or quality indicators – control time, overshoot and static deviation. Typically, PI or PID controllers are used, which ensure zero static deviation. For a drum water level control system, it is a must.
4. Simulation studies of the drum water level controlThe control systems were modelled and tested in a Pexsim simu-lation module of the Amand system environment developed at the Institute of Automation and Robotics of Warsaw University of Technology [5, 13, 14]. Used for tuning the model were the data obtained by measuring actual values on a 120 MW unit with a condensing turbine [9].For the water level control study three versions were set up of the control system, diverse in terms of structure: one-circuit control system in one-pulse and three-pulse versions, and a cascade control system. These systems’ control quality indicators were tested with measurement noise simulation enabled. The tests allowed to evaluate the different structures and to choose the one best suited for the control system intended to maintain a constant water level in the drum.The level setpoint was 700 [mm], the same for all the structures. The signal from the level transducer was subjected to low-pass filtering in the form of averaging in time in order to reduce the measurement noise effect. PID controllers were used for
Fig. 4. One-pulse control of drum water level, where: 1 – drum, 2 – evaporator, 3 – water heater, 4 – control valve, 5 – feed water pump, 6 – main controller
Fig. 5. Three-pulse control of drum water level: a) cascade, b) classic (1 – drum, 2 – evaporator, 3 – water heater, 4 – control valve, 5 – feed water pump, 6 – main controller 7 – auxiliary controller
M. Pawlak | Acta Energetica 4/29 (2016) | 81–89
85
adjustments Their settings were selected separately for each structure. For this purpose, the Ziegler-Nichols method was employed. In practice, also in power units, this method is basi-cally impossible to use because of the need to bring the object to the condition of self-sustained oscillations. The opportunity was however exercised to use the method on a model, which elimi-nates the dangers associated with its use.The simplest system, used more in low power facilities (industrial cogeneration plants), is one-pulse control system. It only uses one signal from the water level transducer (Fig. 6). Control devia-tion is determined as the difference between the set-point and actual levels. The control system adjusts the boiler feed water pump performance. PID algorithm was applied and the following controller settings: kp = 0,17; Ti = 148 s; Td = 37 s.Tested was the control system performance for power unit load changes (from 120 MW to 117 MW) (Fig. 7), which may corre-spond to the primary control performance. Primary control adjusts the power unit’s output, following the power system’s
Fig. 6. One-pulse control programme structure: SP – setpoint, h – simulated drum water level, CV – control signal, Display 1 – block of recording and visualization of data from Fig. 7, PID 1 – controller block
Fig. 7. One-pulse control system’s response to step change in the unit’s load (from 120 MW to 117 MW), where: 1 – drum water level setpoint, 2 – water level in the drum, 3 – unit reloading time
Fig. 8. Three-pulse control programme structure: SP – setpoint, h – simulated drum water level, CV – control signal, Display 1 – block of recording and visualization of data from Fig. 10, M_w – feed water flow, M_DT – steam flow to the turbine, Gain 1 – factor proportional to the flows’ differ-ence, Sum 1 – totalizer for streams of water and steam, Sum 1 – totalizer of control deviation, PID 1 – control block
M. Pawlak | Acta Energetica 4/29 (2016) | 81–89
86
frequency and voltage variations. The frequency is a measure of the system’s balancing [9].In this case, the regulation time amounted to approx. 11 minutes. The maximum deviation is shown in Fig. 7. Overshoot can be seen, particularly in Fig. 7, where a reduction in steam intake caused a temporary fall in water level. The controller, trying to refill the tank and to settle the level in the drum, increased the control signal, and therefore after a while the level quickly increased. The controller’s interventions caused extensive over-shoots and unstable operation. Because of this the control in a large power plant must take into account the turbine’s steam intake flow.One solution to the problem encountered by one-pulse controller is three-pulse structure. The main difference between these systems is the method of control deviation determina-tion (Fig. 8). Added to the level measurement is the difference
between the mass flows of water into the drum and of steam to the turbine. In the reported system this difference is multi-plied by a coefficient increasing or decreasing the impact of this signal (Gain 1 block in Fig. 8). This coefficient has been chosen experimentally, because it requires a comparison of values in different units (level and mass flow rate). Flow signals are not filtered, since the impact of measurement noise in flow signals on the control deviation is low in relation to the level measure-ment noise impact. The selected control algorithm is PID, with the following settings: kp = 0,17, Ti = 145 s, Td = 36 s.The selected controller settings have similar values as one-pulse system. However, better regulation quality indicators can be expected. Shown in Fig. 9 are control system responses to step change in power unit load.Regulation time decreased slightly and amounted to approx. 8 min. But the regulation quality improvement was mostly
Fig. 9. Three-pulse control system’s response to step change in the unit’s load (from 120 MW to 117 MW), where: 1 – drum water level set-point, 2 – water level in the drum, 3 – unit reloading time., 4 – total control deviation, Sum 1 block in Fig. 8
Fig. 10. Three-pulse cascade control programme structure: SP – setpoint, h – simulated drum water level, CV – control signal, Display 1, Display 2 – blocks of recording and visualization of data from Fig. 11 and Fig. 12, M_w – feed water flow, M_DT – steam flow to the turbine, Average – average in time, Sum 1 – totalizer for streams of water and steam, Sum 1 – totalizer of control deviation, PID 2 – control block
M. Pawlak | Acta Energetica 4/29 (2016) | 81–89
87
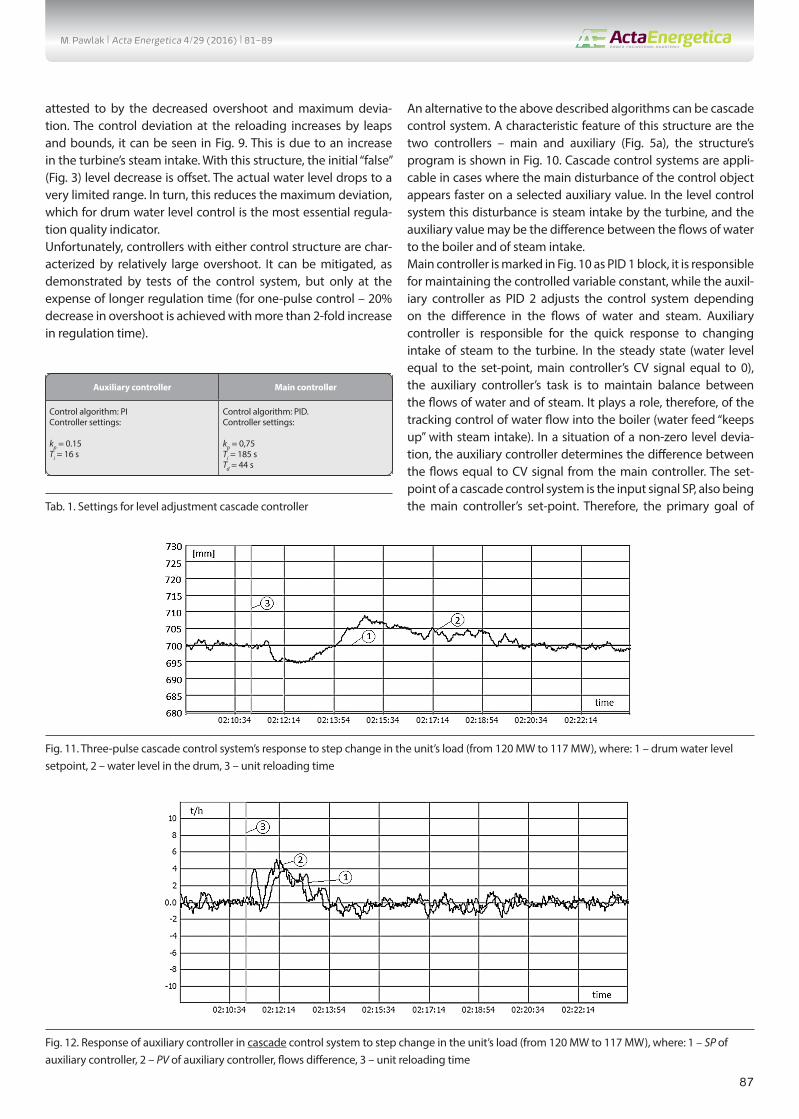
attested to by the decreased overshoot and maximum devia-tion. The control deviation at the reloading increases by leaps and bounds, it can be seen in Fig. 9. This is due to an increase in the turbine’s steam intake. With this structure, the initial “false” (Fig. 3) level decrease is offset. The actual water level drops to a very limited range. In turn, this reduces the maximum deviation, which for drum water level control is the most essential regula-tion quality indicator.Unfortunately, controllers with either control structure are char-acterized by relatively large overshoot. It can be mitigated, as demonstrated by tests of the control system, but only at the expense of longer regulation time (for one-pulse control – 20% decrease in overshoot is achieved with more than 2-fold increase in regulation time).
An alternative to the above described algorithms can be cascade control system. A characteristic feature of this structure are the two controllers – main and auxiliary (Fig. 5a), the structure’s program is shown in Fig. 10. Cascade control systems are appli-cable in cases where the main disturbance of the control object appears faster on a selected auxiliary value. In the level control system this disturbance is steam intake by the turbine, and the auxiliary value may be the difference between the flows of water to the boiler and of steam intake.Main controller is marked in Fig. 10 as PID 1 block, it is responsible for maintaining the controlled variable constant, while the auxil-iary controller as PID 2 adjusts the control system depending on the difference in the flows of water and steam. Auxiliary controller is responsible for the quick response to changing intake of steam to the turbine. In the steady state (water level equal to the set-point, main controller’s CV signal equal to 0), the auxiliary controller’s task is to maintain balance between the flows of water and of steam. It plays a role, therefore, of the tracking control of water flow into the boiler (water feed “keeps up” with steam intake). In a situation of a non-zero level devia-tion, the auxiliary controller determines the difference between the flows equal to CV signal from the main controller. The set-point of a cascade control system is the input signal SP, also being the main controller’s set-point. Therefore, the primary goal of
Auxiliary controller Main controller
Control algorithm: PIController settings:
kp = 0.15Ti = 16 s
Control algorithm: PID.Controller settings:
kp = 0,75Ti = 185 sTd = 44 s
Tab. 1. Settings for level adjustment cascade controller
Fig. 11. Three-pulse cascade control system’s response to step change in the unit’s load (from 120 MW to 117 MW), where: 1 – drum water level setpoint, 2 – water level in the drum, 3 – unit reloading time
Fig. 12. Response of auxiliary controller in cascade control system to step change in the unit’s load (from 120 MW to 117 MW), where: 1 – SP of auxiliary controller, 2 – PV of auxiliary controller, flows difference, 3 – unit reloading time
M. Pawlak | Acta Energetica 4/29 (2016) | 81–89
88
this system is to set a constant level of water. Main controller is responsible for the change in SP signal of PID controller, so that at the appropriate the set-point shall be accomplished. This time the flows difference signal is time-averaged to achieve the auxil-iary controller’s smoother operation.For the auxiliary controller action P or PI is recommended. It was decided to use the integrating action in order to achieve zero static deviation of the auxiliary value. Action PI or PID should have been chosen for the main controller. PID algorithm was selected for its better regulation quality indicators.The controller settings were chosen experimentally based on anal-ysis of the performance of real object [9] and are shown in Tab. 1.A cascade system of drum feed water control could be expected better performance compared to single-circuit systems. In order to validate this thesis identical tests were performed as for the previous systems. Controller’s responses to jumps of level set-point and unit load (from 120 MW to 117 MW) are shown in Fig. 11 and 12.Compared with three-pulse feed water control the waveform of cascade controller’s response to load jumps is much more favourable (Fig. 11). It can be seen in the SP and PV waveforms of auxiliary controller (Fig. 12) that after the change in the unit’s load quickly rose the difference in flows (due to decrease in steam flow). However, it was as quickly reduced to zero by the decrease in the feed water in-flow. Only then the impact could be observed of the drum dynamics on changes in the steam income. From this point on the water level is adjusted by increasing the difference in flows (increase in feed water inflow). The cascade structure allowed to reduce overshoot, which in turn reduced the regulation time (Fig. 11). The auxiliary controller’s quick response allowed therefore to improve the quality indicators of the water level control in the drum.
5. SummaryPower boiler drum with a control and protection system is a very special part of the power unit’s process line, important for reasons of the power unit’s safe operation, prevents the conse-quences of water particles’ ingress to the boiler’s superheater.The paper is a review of the most important parts of a broader analysis of the level control system. It presents the results of the study of the three control structures’ performance. According to this analysis the cascade structure is the best suited for
adjustment of the water level in the drum. Based on the results of these studies a pilot implementation of the system is expected. The cascade structure (Fig. 5a) has the best regulation quality indicators: This is important for power boiler operation, control is provided without devices’ overloading, which increases the power unit’s operational reliability.To evaluate the control systems’ performance, the following regulation quality indicators were adopted: em – maximum dynamic deviation, tr – regulation time defined as the time since the disturbance introduction until the control deviation reaches values within the zone of tolerance and κ – overshoot determines the percentage ratio of the amplitude of the second deviation e2 to the amplitude of the first deviation e1 according to the formula (6), shown in Fig. 13.
(6)
Analysis of the control system responses shown in Fig. 7, 8 and 12 can be concluded that: the maximum control deviation em – is by far the smallest for the cascade controller. Deviation em – is approximately three times lower compared with the control deviation in Fig. 7 and this is the most important parameter for this type of control system. The regulation time for all systems was similar, so it should be born in mind that we are dealing here with an astatic object and the controller’s control signal currently and continuously adjusts level fluctua-tions. It is important to keep it within acceptable limits. With a view to overshoot, the performances of three-pulse controllers were compared. Since the amplitude of the second deviation is greater than that of the first (e2 > e1), which results from the operation of steam and water flow adjusting signals, the over-shoot was determined from a comparison of the amplitude of third deviation (e3) to amplitude e1. Looking in this way, we can say that in Fig. 9 (classical system) the overshoot is 25%, while in the response of the cascade controller from Fig. 11 there is no overshoot κ = 0%.The reported control system is scalable and can be applied to different power boilers, grate boilers in industrial CHP plants or for dust drum boilers in the power industry, where it can affect the reliability of operation.
REFERENCES
1. Alouani A.T., Noureddine A.H., Smoak R.A., “Multivariable Robust Control of a Power Plant Drum Level”, Chapter in New Trends in Systems Theory, Vol. 7 of the series Progress in Systems and Control Theory, New York, Springer Science+Business Media, No. 7, 1991, pp. 65–72.
2. Chakrabory S.K., Manna N., Dey S., “Importance of tree-elements boiler drum level control its installation in power plant”, International Journal of Instrumentation and Control Systems, No. 4(2), 2014, pp. 1–12.
3. Houtz A., Cascade D., “Feed Forward and Boiler Level Control”, con-trolguru.com – Practical Process Control, Automation System Group, Kenai, Alaska, USA, 04.2015.
Fig. 13. Regulation quality criteria – graphical presentation (marked in the text)
M. Pawlak | Acta Energetica 4/29 (2016) | 81–89
89
4. Houtz A.D, Dynamic Shrink/Swell and Boiler Level Control”, control-guru.com – Practical Process Control, Automation System Group, Kenai, Alaska, USA, 04.2015.
5. Kościelny J.M., Korbicz J., „Inteligentny system sterowania i diag-nostyki procesów przemysłowych DiaSter” [DiaSter – an intelligent system for industrial processes’ diagnostics and automatic control], Warszawa 2009.
6. Lindsley D., “Power-plant control and instrumentation. The control of boilers and HRSG systems”, London: The Institution of Electrical Engineers, 2005.
7. Pawlak M., Kościelny J.M., Wasiewicz P., “Method of increasing the reliability and safety of the process through the use of fault tolerant control systems”, Eksploatacja i niezawodność – Maintenance and Reliability, No. 17 (3), 2015, pp. 398–407.
8. Pawlak M., “Improve of reliability of power unit which co-firing bio-mass-cool by implementation diagnostic systems”, Turbomachinery, No. 138, 2010, pp. 56-65.
9. Pawlak M. et al., “Elektrohydrauliczna regulacja bloków energetyc-znych – badania odbiorcze regulacji pierwotnej, wtórnej i trójnej” [Electrohydraulic control of power units – acceptance tests of primary,
secondary, and tertiary controls], X International Conference „Thermal Power Plants. Operation – Upgrades – Repairs”, Słok, 6–8 June 2011.
10. Pawlik M., Strzelczyk F., “Elektrownie” [Power plants], Warszawa, 201011. Rajkumar T., Ramaa V.M., Gobi K., “Boiler drum level control by using
wide open control with three element control system”, Chennai, India, International Monthly Refereed Journal of Research in manage-ment and Technology, No. 2, 2013, pp. 85-96.
12. Rakowski J., “Automatyka cieplnych urządzeń siłowni“ [Automation of power plants’ thermal equipment], Warszawa 1976.
13. Syfert M., Wnuk P., Kościelny J.M., “DiaSter – Intelligent system for diagnostics and automatic control support of industrial processes“, JAMRIS – Journal of Automation, Mobile Robotics & Intelligent Systems, No. 4, 2011, pp. 41–46.
14. Syfert M., Wnuk P., “Przetwarzanie sygnałów w pakiecie PExSim: zasady, techniki, możliwości” [Signal processing in PExSim package: rules, techniques, opportunities], Pomiary – Automatyka – Robotyka [Measurement – Automation – Robotics], No. 11, 2010, pp. 84–89.
15. Trybus L., Subczak M., “Jak obecnie uczy się energetyków“ [How do they train power engineers now], XIX Conference of Automation Engineers, Rytro 2015.
An assistant professor in Electrical Power Engineering at the Technical University of Lodz. Specialist in a power unit’s automatic control and diagnostics. His interests
are connected with application of digital techniques in control, diagnostics, and measurements, in the energy sector in particular. Issues dealt with in his work are also
thematically related to its activities in the Association of Polish Electrical Engineers. Member of the Power System Automation Committee of the Association of Polish
Electrical Engineers. Co-author and author of two patents and 60 publications.
M. Pawlak | Acta Energetica 4/29 (2016) | 81–89
90
PL
Analiza pracy układów regulacji poziomu wody w walczaku kotła energetycznego
AutorMariusz Pawlak
Słowa kluczoweukład regulacji, kocioł parowy, blok energetyczny, regulacja poziomu, walczak, model walczaka
StreszczenieOpisano struktury stosowanych regulatorów poziomu wody w walczaku kotła energetycznego. Walczak pełni bardzo odpowie-dzialne funkcje w procesie technologicznym bloku energetycznego, ponieważ zachodzi tutaj proces oddzielania wody od pary, która po przegrzaniu jest doprowadzana do turbiny. Przedstawiono właściwości dynamiczne walczaka jako obiektu regulacji. Przeprowadzono identyfikację modelu na podstawie danych pomiarowych z rzeczywistego obiektu. W opisywanym układzie warunki pracy urządzeń regulacyjnych i pomiarowych są trudne ze względu na wysoką temperaturę i ciśnienie. Niepoprawna praca układu regulacji może doprowadzić do poważnej awarii. Zaprezentowano analizę pracy trzech struktur regulatora poziomu w celu zapewnienia stabilnej pracy układu.
1. WprowadzenieZ punktu widzenia automatyka kotły ener-getyczne są bardzo skomplikowanymi obiektami sterowania. W całym bloku ener-getycznym znajduje się kilkadziesiąt algo-rytmów regulacji, w tym układ regulacji zasilania. Układy te są ze sobą powiązane i niepoprawna praca jednego z nich wpływa na niezawodność pracy całego bloku ener-getycznego [7, 8].Układ regulacji zasilania ma za zadanie zachowanie stanu równowagi pomiędzy strumieniem wody dopływającej do kotła i strumieniem pary pobieranej przez turbinę. Miarą tego stanu jest poziom wody w walczaku [10, 12]. W tym przypadku układ regulacji zasilania można nazwać układem automatycznej regulacji poziomu wody w walczaku [1, 2, 3]. Tematyka regulacji poziomu wody w kotle energetycznym jest omawiana w publi-kacjach wielu ośrodków naukowych na świecie. Problemy związane z tym układem regulacji znane są od wielu lat i przedstawiane w książkach dotyczących układów regulacji bloku energetycznego [6, 10, 12]. W walczaku mamy do czynienia ze specyficznym medium, czyli mieszaniną parowo-wodną, której parametry silnie zależą od warunków termodynamicznych [4, 10, 12]. Konsekwencją zbyt dużej odchyłki regu-lacji może być tutaj awaryjne odstawienie całego bloku energetycznego [1, 2, 11] i duże straty ekonomiczne, a także zagro-żenie dla bezpieczeństwa ludzi. Dlatego też optymalne dobranie struktury układu i nastaw regulatora wpływa na niezawod-ność pracy całego bloku energetycznego. Analizę pracy takich układów przedsta-wiono w pracach na całym świecie [1, 2, 3, 6, 11, 15]. W pracy [11] przedstawiono przyczyny badań tego układu regulacji: uszkodzenie kotła ze względu na niski poziom wody w walczaku jest jednym z największych problemów eksploatacyj-nych kotła, właściwy układ regulacji może zminimalizować przestoje i koszty naprawy, kontrola poziomu jest kluczem do bezawa-ryjnej i bezpiecznej pracy kotła. W pracach [2, 11] przedstawiono bardzo rozbudowane
układy pomiarów i zabezpieczeń. W tym artykule autor przedstawił badania kaska-dowego układu regulacji w porównaniu z klasycznymi regulatorami: 1-impul-sowym i 3-impulsowym. Układy kaska-dowe zostały także przedstawione w opra-cowaniach [2, 4, 6, 11], ale w nieco innym ujęciu, niż jest to przedstawione na rys. 5a. Rozwiązanie tutaj przedstawione stabilizuje pracę, zwiększa bezpieczeństwo i nieza-wodność pracy kotła energetycznego, nie rozbudowując układu pomiarowego.
2. Właściwości obiektu regulacji poziomu wody w walczakuWalczak to zbiornik ciśnieniowy, który stanowi stałe miejsce w ciągu technolo-gicznym wytwarzania pary przez kocioł energetyczny, oddzielenia pary od wody. Warunkiem koniecznym bezpiecznej pracy kotła jest zapewnienie wystarczającego przepływu mieszaniny parowo-wodnej przez rury parownika. Przepływ ten może być wywołany poprzez: wykorzystanie naturalnego ruchu czynnika, wynikają-cego z różnicy gęstości wody i mieszaniny parowo-wodnej, jest to tzw. obieg natu-ralny (rys. 1a), lub wykorzystanie pracy
dodatkowo zainstalowanych pomp cyrkula-cyjnych (obieg wspomagany, rys. 1b).
W kotłach energetycznych musi być zachowana równowaga między ilością wody zasilającej doprowadzonej do kotła a ilością pary produkowanej przez kocioł. Zapotrzebowanie na parę wynika z obcią-żania mocą elektryczną turbogeneratora. Zbyt niski poziom wody w walczaku może prowadzić do zakłóceń w obiegu wodno--parowym kotła i uszkodzenia źle schłodzo-nych powierzchni ogrzewalnych, nadmierny wzrost poziomu może doprowadzić do prze-dostania się kropel wody z walczaka do prze-grzewacza [2, 11, 12]. Ze względu na dużo większą przejmowalność ciepła wody niż pary powoduje to gwałtowne schłodzenie rur przegrzewacza i powstanie szoków termicznych, które mogą być przyczyną awarii. Zachwiania poziomu wody w walczaku, wynikające z zakłócenia równowagi między dopływem wody i produkcją pary, mogą wynikać z wielu powodów:• zmian ciśnienia pary spowodowanych
ilością lub jakością doprowadzonego paliwa
Rys. 1. Obiegi wodne kotłów walczakowych: a) kocioł o obiegu naturalnym, b) kocioł o obiegu wspomaganym (W – walczak, PP – przegrzewacz pary, PW – podgrzewacz wody, PR – parownik, PZ – pompa wody zasilającej, PC – pompa cyrkulacyjna wspomagająca)
M. Pawlak | Acta Energetica 4/29 (2016) translation | 81–89
This is a supporting translation of the original text published in this issue of “Acta Energetica” on pages 81–89. When referring to the article please refer to the original text.
91
PL
• zapotrzebowania na parę przez turbinę pracującą dla bloku energetycznego biorącego udział w regulacji systemu elektroenergetycznego
• w związku z regulacją temperatury pary przegrzanej może się także zmienić pobór wody wtryskowej.
Ilość wody dopływającej do układu walczaka można traktować jako wejście układu. Jej wartość może być zmieniana przez regu-lację obrotów pompy zasilającej lub poprzez otwieranie i zamykanie zaworu na dopływie do kotła. Regulacja poziomu wody za pomocą zaworu dławiącego jest stosowana jedynie podczas rozruchu dużych bloków energetycznych lub w małych instalacjach przemysłowych z kotłami rusztowymi o małej wydajności. Znacznie efektywniej-szym sposobem regulacji jest sterowanie prędkością obrotową pompy zasilającej. Nie występują wówczas straty ciśnienia na zaworze. Rozwiązanie to jest znacznie droższe ze względu na konieczność insta-lacji pompy z możliwością zmiany prędkości obrotowej wirnika, jednak ekonomicznie uzasadnione z powodu większej sprawności.Walczak, jako obiekt sterowania poziomu z wejściem w postaci dopływu wody zasi-lającej, można opisać jako obiekt inercyjny wysokiego rzędu z całkowaniem wg wzoru (1). Parametry obiektu (stała czasowa, stopień inercji) zależą od konstrukcji danego walczaka [12].
(1)
gdzie: Δh – zmiana poziomu mieszaniny parowo-wodnej w walczaku, ΔFW – zmiana strumienia masy wody zasilającej, T1 – stała inercji, n1 – rząd inercji, k – wzmocnienie.
Przy skokowym wzroście dopływu wody do kotła można zaobserwować spore opóźnienie wynikające z niedogrzania wody zasilającej. Pomimo że do zbiornika dopływa więcej wody, poziom utrzymuje się, a w skrajnych przypadkach może nawet opaść. Powodem takiego zachowania jest kondensacja pewnej części pęcherzy paro-wych pod wpływem spadku temperatury.Model dynamiczny zmian poziomu w walczaku posiada drugie wejście, tym sygnałem jest pobór pary do turbiny. Wejście to można traktować jako zakłócenie, ponieważ jego wartość zależna jest od chwi-lowego obciążenia bloku energetycznego.W chwili, gdy walczak znajduje się w równo-wadze termodynamicznej i poziom miesza-niny parowo-wodnej jest stały, zwiększenie zapotrzebowania na parę przez turbinę powoduje wzrost poziomu mieszaniny parowo-wodnej. Spowodowane jest to spad-kiem ciśnienia pary, następstwem tego jest intensyfikacja powstawania pęcherzy parowych oraz wzrost poziomu. Dzieje się tak, pomimo że masa wody w zbiorniku maleje. Podnoszenie poziomu miesza-niny po pewnym czasie ustaje i poziom zaczyna nieustannie opadać. Chwilowy wzrost poziomu przy zwiększeniu poboru pary może powodować błędne działanie regulatora.Opis dynamiki poziomu mieszaniny parowo--wodnej w postaci transmitancyjnej dla zakłócenia – zmiany poboru pary do turbiny przedstawia transmitancja (2) [12]:
(2)
gdzie: Δh – poziom mieszaniny parowo--wodnej w zbiorniku, ΔFD – zmiana strumienia pary, a – stała różniczko-wania, T2 – stała inercji, n2 – rząd inercji, k – wzmocnienie.W porównaniu z postacią GW(s) transmi-tancja GD(s) różni się znakiem wzmoc-nienia (dopływ cieczy zwiększa, a pobór pary zmniejsza poziom w stanie ustalonym) oraz obecnością współczynnika a w licz-niku transmitancji. Niezerową wartość parametru a ze znakiem ujemnym można utożsamiać z odwrotnym różniczkowaniem rzeczywistym i pozwala odwzorować chwi-lowe „fałszywe” zmiany poziomu w zbior-niku. Skutkiem takiej postaci transmitancji jest nieminimalnofazowość obiektu.Dynamikę zmian poziomu mieszaniny parowo-wodnej w walczaku można opisać w postaci transmitancji wg wzorów (3) przedstawionej na rys. 2:
(3)
gdzie: Δh – zmiana poziomu mieszaniny parowo-wodnej w walczaku, ΔFW – zmiana strumienia masy wody zasilającej, ΔFD – zmiana strumienia pary, T1, T2 – stałe inercji, n1, n2 – rząd inercji, k – wzmocnienie, a – stała różniczkowania.
Przyrównując oba wejścia obiektu, trzeba podkreślić, że wartości ΔFW(s) i ΔFD(s) są przepływami masowymi odpowiednio: wody zasilającej i pary wodnej. Takie zało-żenie ułatwia dalsze projektowanie układów regulacji zasilania, bowiem pierwotnym zadaniem tego układu jest zachowanie stanu równowagi pomiędzy przepływami maso-wymi pary do turbiny i wody do walczaka.Dla znamionowych warunków pracy bloku energetycznego o mocy elektrycznej 120 MW na podstawie danych pomiaro-wych [9] otrzymano model transmitancyjny postaci (4):
(4)
gdzie: h’ – pochodna poziomu wody w walczaku, FW – przepływ masowy wody do kotła.
Drugim krokiem w celu odtworzenia całko-witego modelu poziomu w walczaku była identyfikacja pochodnej poziomu w zależ-ności od poboru pary przez turbinę. Model został aproksymowany do modelu rzędu 3, ostatecznie otrzymano (5):
(5)
gdzie: h’ – pochodna poziomu wody w walczaku, FD – przepływ masowy pary do turbiny.
Odpowiedzi opisanych modeli na skokowe zmiany ilości wody dopływającej do walczaka oraz ilości pary pobieranej do turbiny przedstawiono na rys. 3.
3. Układy regulacji poziomu w kotłach walczakowychStruktura układów regulacji poziomu w kotle walczakowym jest bardzo różna, zależna m.in. od konstrukcji walczaka czy wymaganej jakości regulacji. Ilość wody doprowadzanej do walczaka może być zmie-niana, albo przez oddziaływanie na zawór regulacyjny (4 na rys. 4–5), umieszczony między walczakiem a pompą zasilającą, albo też poprzez oddziaływanie na prędkość obrotową pompy (5 na rys. 5). W dużych elektrowniach zawodowych stosuje się głównie regulację objętościową poprzez oddziaływanie na prędkość obrotową pompy. Na blokach 120 MW i 200 MW pompy główne są napędzane silnikami klat-kowymi asynchronicznymi regulowanymi za pomocą sprzęgła hydrokinetycznego. Do napędu największych pomp wody zasilającej używane są turbiny parowe, do których para jest pobierana z upustu turbiny głównej, np. bloki energetyczne 500 MW i 900 MW [10]. Metodę dławieniową (regulacja położenia zaworu) stosuje się na małych obiektach i podczas rozruchu lub odstawienia bloku energetycznego. Układy regulacji oddziałują
Rys. 2. Model dynamiczny poziomu wody w walczaku
M. Pawlak | Acta Energetica 4/29 (2016) translation | 81–89
This is a supporting translation of the original text published in this issue of “Acta Energetica” on pages 81–89. When referring to the article please refer to the original text.
92
PL
wtedy na oba organy wykonawcze, czyli
na zawór i pompę wg odpowiedniego algo-rytmu sterowania. Dla bloków o małej mocy, zwłaszcza w insta-lacjach przemysłowych oraz w przypadku walczaków o dużej przestrzeni parowej, gdzie dopuszczalne są większe odchyłki regulacji, stosuje się układy regulacji 1-impulsowe (rys. 4) [1, 2, 3, 6]. W tych instalacjach prze-dostanie się kropel wody do przegrzewaczy jest możliwe dopiero przy względnie dużej odchyłce regulacji poziomu. Z tego powodu nagłe zwiększenie poboru pary do turbiny nie powinno wywoływać stanów alarmo-wych. Wówczas stosowane są struktury tzw. 1-impulsowe, tj. opierające się na jednym sygnale pomiarowym – poziomu wody w walczaku (rys. 4).
Jak już wspomniano, sposób wyznaczania odchyłki regulacji zależny jest od struktury układu regulacji. W przypadku regula-torów 1-impulsowych odchyłka jest równa różnicy wartości zadanej (Lo) i wartości chwilowej (L) poziomu mieszaniny parowo--wodnej w walczaku. Układ 1-impulsowy jest stosowany rzadko ze względu na niesta-bilne działanie w stanach dynamicznych, np. w przypadku zwiększonego poboru pary w pierwszej chwili po zakłóceniu, co zostanie wykazane podczas badań
symulacyjnych. Kiedy poziom w walczaku wzrasta, regulator taki zmniejszyłby dopływ wody, zamiast go zwiększyć. Opisany stan występuje podczas tzw. normalnej pracy kotła, czyli dla obciążeń wahających się w granicach 40–100% mocy znamionowej kotła. W przypadku obciążeń niższych, np. podczas odstawiania i rozruchu lub pracy na potrzeby własne, stosuje się regulatory 1-impulsowe z korektą od zmian ciśnienia w walczaku.Aby wyeliminować błędne działanie układu regulacji, stosuje się układy 3-impulsowe, dodatkowymi sygnałami wprowadzanymi do układu regulacji są sygnały z przetwor-nika przepływu pary (FD) oraz wody zasila-jącej (FW) (rys. 5).
Struktura 3-impulsowa (rys. 5) dobrze oddaje sens regulacji poziomu w walczaku, tj. utrzymanie równowagi pomiędzy dopływem wody a odpływem pary. Jednocześnie sygnał pomiarowy z czujnika poziomu pozwala na utrzymanie stałego poziomu mieszaniny. W regulatorze wyzna-czana jest różnica pomiędzy odpływem pary a dopływem wody i wartość ta jest następnie sumowana z odchyłką regulacji poziomu.Zgodnie z tym schematem (rys. 5b), przy równych przepływach masowych pary i wody oraz wzroście poziomu w stosunku do wartości zadanej, odchyłka regulacji rośnie. Podobnie, gdy poziom i prze-pływ masowy pary jest stały, a przepływ wody rośnie, to odchyłka również rośnie. Natomiast dla wzrostu przepływu pary przy stałych wartościach L i FD odchyłka regulacji maleje. Zatem zarówno wzrost poziomu, jak i przepływu wody ma ten sam wpływ na odchyłkę regulacji i powoduje zmniej-szenie dopływu wody zasilającej, a wzrost przepływu pary powoduje taki sam wzrost przepływu wody.Odmianą regulatora 3-impulsowego jest struktura kaskadowa przedstawiona na rys. 5a. W kaskadowych układach regu-lacji dla regulatorów pomocniczych stoso-wane są regulatory typu P lub PI (z uwagi za szybką odpowiedź), natomiast dla regu-latorów głównych stosuje się regulatory typu PI lub PID (w celu zapewnienia zerowej odchyłki statycznej).Algorytm regulacji, zarówno w przy-padku regulatorów 1-impulsowych, jak
i 3-impulsowych, to najczęściej regulator PID. Jego powszechne stosowanie jest spowodowane m.in. szeroką znajomością metod doboru jego nastaw. Umożliwia on, w zależności od postawionych wymagań, uzyskanie odpowiedniej stabilności układu czy wskaźników jakości regulacji – czasu regulacji, przeregulowania i odchyłki statycznej. Zwykle używane są regula-tory w wersji PI lub PID, które zapewniają zerową odchyłkę statyczną. W przypadku układu regulacji poziomu w walczaku jest to konieczność.
4. Badania symulacyjne układu regulacji poziomu wody w walczakuModelowanie i testy układów regulacji zostały przeprowadzone w module symu-lacyjnym Pexsim środowiska systemu Amand, opracowanego w Instytucie Automatyki i Robotyki Politechniki Warszawskiej [5, 13, 14]. W celu strojenia modelu wykorzystano dane pozyskane na podstawie pomiarów wartości rzeczywi-stych na bloku o mocy 120 MW z turbiną kondensacyjną [9]. Na potrzeby badań układu regulacji poziomu wody zrealizowane zostały trzy wersje tego układu, zróżnicowane pod względem struktury: 1-obwodowy układ regulacji w wersji 1-impulsowej i 3-impul-sowej oraz kaskadowy układ regulacji. Przy badaniach wskaźników jakości regulacji tych układów została włączona symulacja szumów pomiarowych. Przeprowadzone testy pozwoliły na ocenę poszczególnych struktur i wybór najlepszej z nich dla układu regulacji utrzymywania stałego poziomu wody w walczaku.Wartość zadana poziomu była iden-tyczna dla wszystkich struktur i wynosiła 700 [mm]. Sygnał z przetwornika poziomu został poddany filtrowaniu dolnoprzepusto-wemu w postaci uśredniania w czasie, w celu zmniejszenia wpływu szumów pomiaro-wych. Do regulacji wykorzystano regula-tory typu PID. Ich nastawy były dobierane oddzielnie dla każdej struktury. Do tego celu wykorzystano metodę Zieglera-Nicholsa. W praktyce m.in. w blokach energetycz-nych metoda ta jest w zasadzie niemożliwa do zastosowania ze względu na konieczność doprowadzenia obiektu do niegasnących oscylacji. Wykorzystano jednak możliwość działania na modelu obiektu, co eliminuje niebezpieczeństwa związane ze stosowa-niem tej metody.Najprostszym układem, stosowanym raczej w obiektach o małej mocy (elektrocie-płownie przemysłowe), jest 1-impulsowy układ regulacji. Wykorzystuje on jedynie sygnał z przetwornika poziomu wody (rys. 6). Odchyłka regulacji jest wyznaczana jako różnica wartości zadanej i wartości chwilowej poziomu. Wyjściem układu regu-lacji jest sygnał sterujący pracą pompy wody zasilającej kocioł. Zastosowano algorytm PID i dobrano nastawy regulatora: kp = 0,17; Ti = 148 s; Td = 37 s.
Przeprowadzono badania zachowania się układu regulacji dla zmian obciążenia bloku energetycznego (ze 120 MW na 117 MW) (rys. 7), co może odpowiadać działaniu regulacji pierwotnej. Regulacja pier-wotna zmienia moc bloku energetycznego
Rys. 3. Zmiana poziomu wody w walczaku kotła, gdzie: 1 – wzrost dopływu wody zasilającej, 2 – zmniejszenie poboru pary
Rys. 4. Układ regulacji poziomu wody w walczaku 1-impulsowym, gdzie: 1 – walczak, 2 – parownik, 3 – podgrzewacz wody, 4 – zawór regulacyjny, 5 – pompa wody zasilającej, 6 – regulator główny
M. Pawlak | Acta Energetica 4/29 (2016) translation | 81–89
This is a supporting translation of the original text published in this issue of “Acta Energetica” on pages 81–89. When referring to the article please refer to the original text.
93
PL
w zależności od zmian częstotliwości napięcia w systemie elektroenergetycznym. Częstotliwość jest miernikiem bilansowania systemu [9]. W tym przypadku czas regulacji wyniósł ok. 11 minut. Odchyłka maksymalna została przedstawiona na rys. 7. Widać przere-gulowanie, szczególnie na rys. 7, gdzie zmniejszenie poboru pary wywołało chwi-lowy spadek poziomu wody. Regulator, starając się uzupełnić zbiornik i wyrównać poziom w walczaku, zwiększył wartość sygnału sterującego, z tego względu po
chwili wartość poziomu zaczęła gwałtownie rosnąć. Działania regulatora wywołały duże przeregulowanie i niestabilną pracę. Z tego powodu brak uwzględnienia wartości stru-mienia poboru pary do turbiny przez regu-lator na dużym obiekcie energetycznym jest niedopuszczalny.Jednym z rozwiązań problemu napo-tkanego przez regulator 1-impulsowy jest struktura 3-impulsowa. Zasadniczą różnicą pomiędzy tymi układami jest sposób wyznaczania odchyłki regulacji (rys. 8). Do sygnału pomiarowego poziomu
dodawana jest różnica przepływu maso-wego wody do walczaka i przepływu maso-wego pary do turbiny. W zrealizowanym układzie różnica ta mnożona jest jeszcze przez współczynnik zmniejszający lub zwiększający oddziaływanie tego sygnału (blok Gain 1 na rys. 8). Współczynnik ten został dobrany doświadczalnie, ponieważ wymaga to porównania wartości o różnych jednostkach (poziom i przepływ masowy). Sygnały przepływów nie są filtrowane, bowiem wpływ szumów pomiarowych dla sygnałów przepływów na odchyłkę regulacji jest niski w stosunku do wpływu szumu pomiaru poziomu. Wybrany algorytm regu-lacji to PID, w którym dobrano nastawy: kp = 0,17, Ti = 145 s, Td = 36 s.
Dobrane nastawy regulatora mają podobne wartości jak układ 1-impulsowy. Można jednak spodziewać się lepszych wskaźników jakości regulacji. Na rys. 9 zaprezentowano odpowiedzi układu regulacji dla skokowej zmiany obciążenia bloku energetycznego.
Czas regulacji zmniejszył się nieznacznie i wyniósł ok. 8 min. O poprawie jakości regu-lacji stanowi jednak głównie zmniejszenie przeregulowania oraz odchyłki maksy-malnej. Wartość uchybu regulacji w chwili zmiany obciążenia rośnie skokowo, można to zaobserwować na rys. 9. Spowodowane jest to zwiększeniem poboru pary do turbiny. Dzięki tej strukturze początkowy „fałszywy” (rys. 3) spadek poziomu jest zniwelowany. Rzeczywisty poziom wody spada w bardzo ograniczonym zakresie. Powoduje to z kolei zmniejszenie odchyłki maksymalnej, czyli w przypadku układu regulacji poziomu w walczaku – najistotniejszego wskaźnika jakości regulacji.Niestety, w przypadku obu struktur regu-latory cechuje stosunkowo duże przeregu-lowanie. Jego zmniejszenie, jak wykazały testy układu regulacji, jest możliwe jedynie kosztem wzrostu czasu regulacji (dla 1-impulsowego regulatora – spadek przere-gulowania o 20% jest osiągany przy ponad 2-krotnym wzroście czasu regulacji). Alternatywą dla opisanych wyżej algo-rytmów może być kaskadowy układ regu-lacji. Cechą charakterystyczną tej struktury są dwa regulatory – główny i pomocniczy (rys. 5a), struktura programowa została przedstawiona na rys. 10. Kaskadowe układy regulacji mają zastosowanie w przypadku, gdy główne zakłócenie obiektu regulacji pojawia się szybciej na pewnej wybranej wartości pomocniczej. W układzie regulacji poziomu takie zakłócenie stanowi pobór pary przez turbinę, a za wartość pomocniczą posłużyć może różnica przepływu wody do kotła i poboru pary.
Regulator główny jest oznaczony na rys. 10 jako blok PID 1, odpowiada za utrzymanie wartości regulowanej na stałym poziomie, natomiast regulator pomocniczy jako PID 2 koryguje układ regulacji w zależności od różnicy poziomu przepływów wody i pary. Regulator pomocniczy odpowiada za szybką reakcję na zmianę poboru pary do turbiny. W stanie ustalonym (poziom wody równy wartości zadanej, sygnał CV regulatora głównego jest równy 0) zadaniem regulatora pomocniczego jest utrzymanie
Rys. 5. Układ regulacji poziomu wody w walczaku 3-impulsowym, gdzie: a) układ kaskadowy, b) układ klasyczny (1 – walczak, 2 – parownik, 3 – podgrzewacz wody, 4 – zawór regulacyjny rozruchowy, 5 – pompa wody zasilającej, 6 – regulator główny, 7 – regulator pomocniczy)
Rys. 6. Struktura programowa 1-impulsowego układu regulacji, gdzie: SP – wartość zadana, h – symulowany poziom wody w walczaku, CV – sygnał sterujący, Display 1 – blok rejestracji i wizualizacji danych z rys. 7, PID 1 – blok regulatora
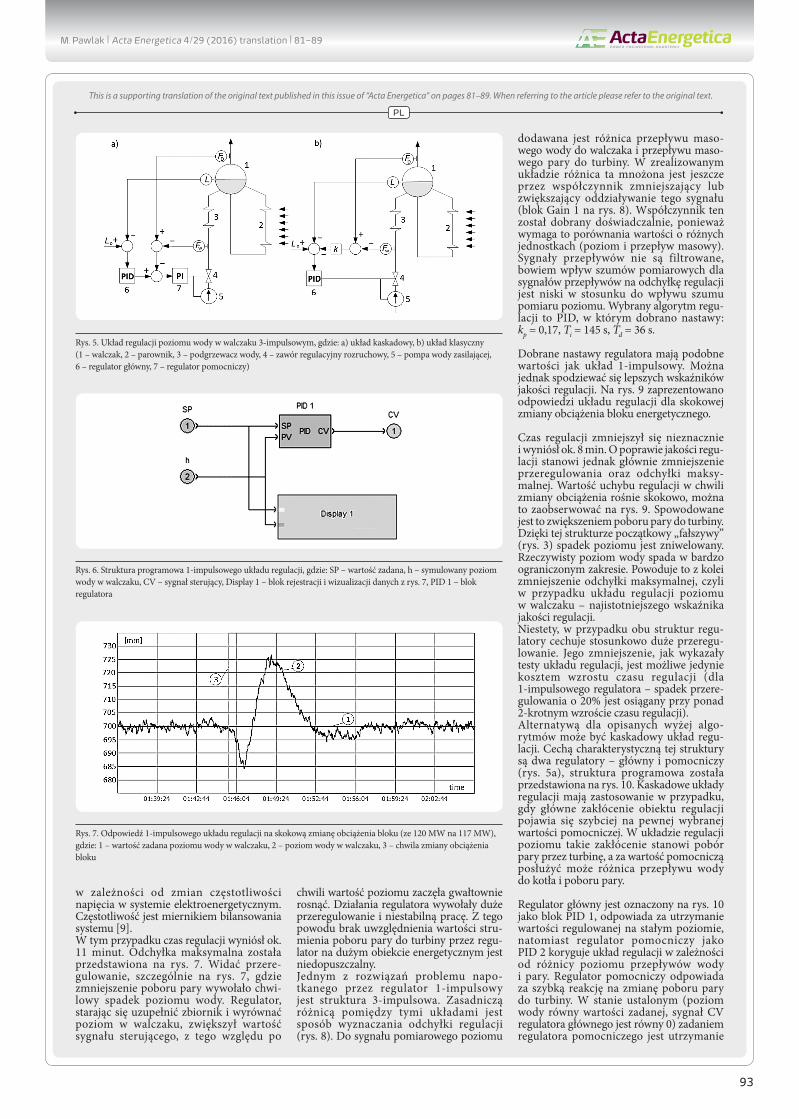
Rys. 7. Odpowiedź 1-impulsowego układu regulacji na skokową zmianę obciążenia bloku (ze 120 MW na 117 MW), gdzie: 1 – wartość zadana poziomu wody w walczaku, 2 – poziom wody w walczaku, 3 – chwila zmiany obciążenia bloku
M. Pawlak | Acta Energetica 4/29 (2016) translation | 81–89
This is a supporting translation of the original text published in this issue of “Acta Energetica” on pages 81–89. When referring to the article please refer to the original text.
94
PL
równowagi pomiędzy przepływami wody i pary. Pełni on zatem rolę nadążnego regu-latora przepływu wody do kotła (dopływ wody „nadąża” za poborem pary). W sytu-acji, gdy odchyłka poziomu jest nieze-rowa, regulator pomocniczy ustala wartość różnicy przepływów równą wartości sygnału CV z regulatora głównego. Sygnałem zadanym kaskadowego układu
regulacji jest sygnał wejściowy SP, jedno-cześnie będący sygnałem wartości zadanej poziomu regulatora głównego. Zatem usta-lenie stałego poziomu wody jest podsta-wowym celem tego układu. Regulator główny odpowiedzialny jest za zmianę sygnału SP regulatora PID tak, aby w odpo-wiednim czasie osiągnąć ustalony poziom zadany. Sygnał różnicy przepływów tym
razem został uśredniony w czasie w celu osiągnięcia płynniejszego działania regula-tora pomocniczego.Dla regulatora pomocniczego zalecana jest akcja P lub PI. Zdecydowano się zastosować akcję całkującą w celu osiągnięcia zerowej odchyłki statycznej wartości pomocniczej. W przypadku regulatora głównego należało wybrać akcję PI lub PID. Wybrany został algorytm PID cechujący się lepszymi wskaź-nikami jakości regulacji.Nastawy regulatorów zostały dobrane ekspe-rymentalnie na podstawie analizy pracy rzeczywistego obiektu [9], przedstawiono je w tab. 1.Po kaskadowym układzie regulacji zasilania walczaka można spodziewać się lepszych rezultatów w porównaniu z układami jednoobwodowymi. W celu sprawdzenia poprawności tej tezy przeprowadzono testy identyczne jak w przypadku poprzednich układów. Odpowiedzi regulatora na skoki wartości zadanej poziomu oraz obciążenia bloku (ze 120 MW na 117 MW) pokazane zostały na rys. 11 i 12.W porównaniu z 3-impulsowym układem regulacji zasilania regulator kaskadowy cechuje znacznie korzystniejszy przebieg odpowiedzi na skok obciążenia (rys. 11). Na przebiegach SP i PV regulatora pomoc-niczego (rys. 12) widać, że po zmianie obciążenia bloku szybko wzrosła różnica przepływów (spowodowana spadkiem przepływu pary). Równie szybko została ona jednak zredukowana do zera poprzez spadek przepływu wody zasilającej. Dopiero wówczas można zaobserwować wpływ dynamiki walczaka na zmianę poboru pary. Od tego momentu poziom wody jest kory-gowany przez zwiększenie różnicy prze-pływów (wzrost dopływu wody zasilającej). Struktura kaskadowa pozwoliła na zmniej-szenie przeregulowania, co z kolei skró-ciło czas regulacji (rys. 11). Szybka reakcja regulatora pomocniczego pozwoliła zatem na poprawę wskaźników jakości regulacji poziomu wody w walczaku.
5. PodsumowanieWalczak kotła energetycznego wraz z układem regulacji i zabezpieczeń jest bardzo szczególnym elementem ciągu technologicznego bloku energetycznego, istotnym ze względów na bezpieczeństwo eksploatacji bloku energetycznego, zapo-biega przed konsekwencjami przedosta-wania się cząsteczek wody do przegrzewacza kotła.Artykuł jest prezentacją najistotniejszych fragmentów szerszej analizy pracy układu regulacji poziomu. Przedstawia on wyniki badań działania trzech struktur regulacji. Struktura kaskadowa wg tej analizy jest
Rys. 8. Struktura programowa 3-impulsowego układu regulacji, gdzie: SP – wartość zadana, h – symulowany poziom wody w walczaku, CV – sygnał sterujący, Display 1 – blok rejestracji i wizualizacji danych z rys. 10, M_w – strumień wody zasilającej, M_DT – strumień pary do turbiny, Gain 1 – współczynnik proporcjonalny do różnicy strumieni, Sum 1 – sumator dla strumieni wody i pary, Sum 2 – sumator uchybu regulacji, PID 1 – blok regulatora
Rys. 10. Struktura programowa 3-impulsowego kaskadowego układu regulacji, gdzie: SP – wartość zadana, h – symu-lowany poziom wody w walczaku, CV – sygnał sterujący, Display 1, Dysplay 2 – bloki rejestracji i wizualizacji danych rys. 11 i rys. 12, M_w – strumień wody zasilającej, M_DT – strumień pary do turbiny, Average – średnia w czasie, Sum 1 – sumator dla strumieni wody i pary, PID 1 – blok regulatora głównego, PID 2 – blok regulatora pomocniczego
Tab. 1. Nastawy dla regulatora kaskadowego regulacji poziomu
Rys. 9. Odpowiedź 3-impulsowego układu regulacji na skokową zmianę obciążenia bloku (ze 120 MW na 117 MW), gdzie: 1 – wartość zadana poziomu wody w walczaku, 2 – poziom wody w walczaku, 3 – chwila zmiany obciążenia bloku, 4 – sumaryczny uchyb regulacji regulatora, blok Sum 1 z rys. 8
Regulator pomocniczy Regulator główny
Algorytm regulacji: PI.Nastawy regulatora:
kp = 0,15Ti = 16 s
Algorytm regulacji: PID.Nastawy regulatora:
kp = 0,75Ti = 185 sTd = 44 s
M. Pawlak | Acta Energetica 4/29 (2016) translation | 81–89
This is a supporting translation of the original text published in this issue of “Acta Energetica” on pages 81–89. When referring to the article please refer to the original text.
95
PL
najlepsza dla układu regulacji poziomu wody w walczaku. Na podstawie wyników tych badań przewidywane jest pilotażowe wdrożenie tego układu. Struktura kaska-dowa (rys. 5a) charakteryzuje się najlep-szymi wskaźnikami jakości regulacji: Ma to znaczenie dla eksploatacji kotła energetycz-nego, regulacja jest prowadzona bez forso-wania urządzeń, co wpływa na zwiększenie niezawodności pracy bloku energetycznego.Do oceny działania systemów regulacji zastosowano następujące wskaźniki jakości regulacji: em – maksymalna odchyłka dyna-miczna, tr – czas regulacji określony jako czas od chwili wprowadzenia zakłócenia do chwili, kiedy odchyłka regulacji osiąga
wartości mieszczące się w strefie tolerancji oraz κ – przeregulowanie określa w procen-tach stosunek amplitudy drugiego odchy-lenia e2 do amplitudy pierwszego odchylenia e1 zgodnie ze wzorem (6), przedstawione na rys. 13.
(6)
Analizując odpowiedzi układów regu-lacji przedstawione na rys. 7, 8 i 12 można stwierdzić, że: maksymalna odchyłka regu-lacji em – jest zdecydowanie najmniejsza dla regulatora kaskadowego. Odchyłka em – jest w przybliżeniu trzykrotnie mniejsza w porównaniu z odchyłką regulacji na rys. 7 i jest to najistotniejszy parametr dla tego układu regulacji. Czas regulacji dla wszystkich układów był podobny, należy pamiętać, że mamy tutaj do czynienia z obiektem astatycznym i sygnał sterujący regulatora koryguje na bieżąco i nieprze-rwanie wahania poziomu. Ważne, aby było utrzymywane w dopuszczalnych granicach. Rozpatrując przeregulowanie, porównano działanie regulatorów o struk-turze 3-impulsowej. Ponieważ amplituda drugiego odchylenia była większa niż amplituda pierwszego (e2 > e1), co wynika z działania sygnałów korekcyjnych stru-mieni pary i wody, przeregulowanie wyzna-czono z porównania amplitudy odchyłki trzeciej (e3) do amplitudy e1. Patrząc w ten
sposób, można stwierdzić, że na rys. 9 (układ klasyczny) przeregulowanie wynosi 25%, natomiast w odpowiedzi regulatora kaskadowego z rys. 11 nie ma przeregulo-wania κ = 0%.Przedstawiony układ sterowania jest skalo-walny i może być zastosowany do kotłów różnej mocy, rusztowych w elektrocie-płowniach przemysłowych lub dla kotłów pyłowych walczakowych w energetyce zawodowej, gdzie może wpłynąć na nieza-wodność eksploatacji.
Bibliografia
1. Alouani A.T., Noureddine A.H., Smoak R.A., Multivariable Robust Control of a Power Plant Drum Level. Chapter in New Trends in Systems Theory, Volume 7 of the series Progress in Systems and Control Theory, New York, Springer Science+Business Media, 1991, No. 7, s. 65–72.
2. Chakrabory S.K., Manna N., Dey S., Importance of tree-elements boiler drum level control its installation in power plant, International Journal of Instrumentation and Control Systems 2014, 4(2), s. 1–12.
3. Houtz A., Cascade D., Feed Forward and Boiler Level Control. controlguru.com – Practical Process Control, Automation System Group, Kenai, Alaska, USA, 04.2015.
4. Houtz A.D, Dynamic Shrink/Swell and Boiler Level Control. controlguru.com – Practical Process Control, Automation System Group, Kenai, Alaska, USA, 04.2015.
5. Kościelny J.M., Korbicz J., Inteligentny system sterowania i diagnostyki procesów przemysłowych DiaSter, Warszawa 2009.
6. Lindsley D., Power-plant control and instrumentation. The control of boilers and HRSG systems. London: The Institution of Electrical Engineers, 2005.
7. Pawlak M., Kościelny J.M., Wasiewicz P., Method of increasing the reliability and safety of the process through the use of fault tolerant control systems, Eksploatacja i Niezawodność – Maintenance and Reliability 2015, 17 (3), s. 398–407.
8. Pawlak M., Improve of reliability of power unit which co-firing biomass-cool by implementation diagnostic systems, Turbomachinery 2010, No. 138, s. 56–65.
9. Pawlak M. i in., Elektrohydrauliczna regu-lacja bloków energetycznych – badania odbiorcze regulacji pierwotnej, wtórnej i trójnej, X Międzynarodowa Konferencja „Elektrownie Cieplne. Eksploatacja – Modernizacje – Remonty”, Słok, 6–8 czerwca 2011.
10. Pawlik M., Strzelczyk F., Elektrownie, Warszawa 2010.
11. Rajkumar T., Ramaa V.M., Gobi K., Boiler drum level control by using wide open control with three element control system, Chennai, India, International Monthly Refereed Journal of Research in manage-ment and Technology, 2013,No. 2, s. 85–96.
12. Rakowski J., Automatyka cieplnych urzą-dzeń siłowni, Warszawa 1976.
13. Syfert M., Wnuk P., Kościelny J.M., DiaSter – Intelligent system for diagnos-tics and automatic control support of
Rys. 11. Odpowiedź 3-impulsowego kaskadowego układu regulacji na skokową zmianę obciążenia bloku (ze 120 MW na 117 MW), gdzie: 1 – wartość zadana poziomu wody w walczaku, 2 – poziom wody w walczaku, 3 – chwila zmiany obciążenia bloku
Rys. 12. Odpowiedź regulatora pomocniczego kaskadowego układu regulacji na skokową zmianę obciążenia bloku (ze 120 MW na 117 MW), okno Display 2, gdzie: 1 – SP regulatora pomocniczego, 2 – PV regulatora pomocniczego, różnica przepływów, 3 – chwila zmiany obciążenia bloku
Rys. 13. Kryteria jakości regulacji – graficzna prezentacja (oznaczenie w tekście)
M. Pawlak | Acta Energetica 4/29 (2016) translation | 81–89
This is a supporting translation of the original text published in this issue of “Acta Energetica” on pages 81–89. When referring to the article please refer to the original text.
96
PL
industrial processes, JAMRIS – Journal of Automation, Mobile Robotics & Intelligent Systems 2011, No. 4, s. 41–46.
14. Syfert M., Wnuk P., Przetwarzanie sygnałów w pakiecie PExSim: zasady, tech-niki, możliwości, Pomiary – Automatyka – Robotyka 2010, No.11, s. 84–89.
15. Trybus L., Subczak M., Jak obecnie uczy się energetyków, XIX Konferencja Automatyków, Rytro 2015.
Mariusz Pawlak dr Politechnika Łódzkae-mail: [email protected] w Instytucie Elektroenergetyki Politechniki Łódzkiej. Specjalista od układów automatyki i diagnostyki bloku energetycznego. Jego zaintereso-wania związane są z zastosowaniem technik cyfrowych w sterowaniu, diagnostyce i pomiarach, przede wszystkim w energetyce. Zagadnienia, którymi zajmuje się w pracy zawodowej, są również tematycznie związane z jego działalnością w Stowarzyszeniu Elektryków Polskich. Członek Komitetu Automatyki Elektroenergetycznej Stowarzyszenia Elektryków Polskich. Współautor i autor 2 patentów oraz 60 publikacji.
M. Pawlak | Acta Energetica 4/29 (2016) translation | 81–89
This is a supporting translation of the original text published in this issue of “Acta Energetica” on pages 81–89. When referring to the article please refer to the original text.