Asif et al. Journal of Remanufacturing 2012, 2:4http://www.journalofremanufacturing.com/content/2/1/4
RESEARCH Open Access
Performance analysis of the closed loop supplychainFarazee MA Asif1*, Carmine Bianchi2, Amir Rashid1 and Cornel Mihai Nicolescu1
Abstract
Purpose: The question of resource scarcity and emerging pressure of environmental legislations has brought a newchallenge for the manufacturing industry. On the one hand, there is a huge population that demands a largequantity of commodities; on the other hand, these demands have to be met by minimum resources and pollution.Resource conservative manufacturing (ResCoM) is a proposed holistic concept to manage these challenges. Thesuccessful implementation of this concept requires cross functional collaboration among relevant fields, and amongthem, closed loop supply chain is an essential domain. The paper aims to highlight some misconceptionsconcerning the closed loop supply chain, to discuss different challenges, and in addition, to show how theproposed concept deals with those challenges through analysis of key performance indicators (KPI).
Methods: The work presented in this paper is mainly based on the literature review. The analysis of performance ofthe closed loop supply chain is done using system dynamics, and the Stella software has been used to do thesimulation.
Findings: The results of the simulation depict that in ResCoM; the performance of the closed loop supply chain ismuch enhanced in terms of supply, demand, and other uncertainties involved. The results may particularly beinteresting for industries involved in remanufacturing, researchers in the field of closed loop supply chain, and otherrelevant areas.
Originality: The paper presented a novel research concept called ResCoM which is supported by system dynamicsmodels of the closed loop supply chain to demonstrate the behavior of KPI in the closed loop supply chain.
BackgroundDue to worldwide population boost, economic growth,and increase in standards of living, current reserves ofnatural resources are proven to be insufficient, and theEarth’s ecosystems are facing increasing threat. Thecurrent growth indicates that the worldwide populationwill be doubled by 2072 [1]. This double population sizewill result in a fivefold increase in the gross domesticproduct (GDP) per capita, with a tenfold increase in re-source consumption and waste generation [2]. By con-tributing 30.7% to the total world GDP and employing a
* Correspondence: [email protected] of Production Engineering, KTH Royal Institute of Technology,Stockholm, SwedenFull list of author information is available at the end of the article
0.7 billion workforce worldwide (estimated in 2010) [3],the manufacturing industry serves as one of the maindriving forces in economic growth. Indeed, the manufac-turing industry is consuming resources and generatingwaste on a large scale at the same time.It is estimated that if the current consumption rate
continues and recycle rate remains the same, then therewill be no iron ore left for consumption in the next cen-tury [4-6]. Besides, the manufacturing industry is one ofthe largest contributors to waste generation. In 2008, ap-proximately 363 million tons of solid waste (account for14% of the total waste) was generated by the manufac-turing industry in the EU-27 [7]. In addition to this,through the extended producer responsibility regulation,manufacturers are now fully or partially accountable for
pen Access article distributed under the terms of the Creative Commonsg/licenses/by/2.0), which permits unrestricted use, distribution, and reproductionroperly cited.
Asif et al. Journal of Remanufacturing 2012, 2:4 Page 2 of 21http://www.journalofremanufacturing.com/content/2/1/4
End-of-Life (EoL) products that are sold in the market.The problem has become more serious with an increasein tax and restriction on the landfill of solid waste.Moreover, in the fast-growing and evolving consumer
market, products seldom reach EoL when a consumerdecides to shift to the next generation of products. Inthose cases, products end up in scrap yards althoughthey retain some values. Recovering only material from aproduct when it could be possible to recover othervalues is not the best practice both from a manufactur-ing and an environmental point of view.To summarize, manufacturing industries have to grow
in the same proportion as the market demands with lim-ited resources, higher-energy efficiency, and lower emis-sion and wastes. The manufacturing industry needssolutions that can solve entirely, or partially, all the pro-blems. Resource conservative manufacturing (ResCoM)is a novel holistic concept which deals with the conser-vation of resources through the product’s multiple lifecycle [8]. ResCoM is defined as follows:
A strategic model which emphasizes conservationof resources through product’s multiple life cycle byproduct design, incorporating supply chain andbusiness model and by integrating OEMs, consumersand other relevant stakeholders. Resources conservativemanufacturing system seeks to optimize material andenergy usage in manufacturing, use phase and end ofuse and value recovery from the product at the end oflife.
ResCoM proposes to design products in a way that cansustain a number of predefined life cycles. At the end ofeach predefined life cycle, products are returned to theoriginal equipment manufacturer (OEM) or to theauthorized third party; upon return, remanufacturing orother EoL strategies, such as recycling and landfilling, areundertaken. Remanufactured products are then redistrib-uted through the ResCoM closed loop supply chain usingthe ResCoM business model. As multiple life cycles re-quire the same product to come back and forth in severaloccasions, a robust closed loop supply chain is vital.The main objectives of this research are as follows:
� To introduce a novel concept named as ResCoM,� To demonstrate how key performance indicators
(KPI) such as rate (production, assembly, shipment,order), delivery delay, level of inventory, backlog,and capacity (production and assembly) in theclosed loop supply chain are affected under variablequantity of product flow at variable times, [9,10], and
� To show how adoption of ResCoM conceptimproves the robustness of the closed loop supplychain.
Closed loop supply chain: a state-of-the-art reviewDesigning and managing supply chains to ensure collec-tion of used products (usually addressed as ‘core’) aretwo of the essentials for products’ multiple life cycles. Asupply chain of this kind is usually addressed as a re-verse supply chain or closed loop supply chain. A signifi-cant difference can be observed when defining these twoterms. It is appropriate to address the chain of core col-lection as the reverse supply chain, if the following con-ditions are fulfilled:
� The recovered cores do not enter the main streamof the forward supply chain.
� The recovered contents of the original productsused by other firms to manufacture products serve adifferent purpose [11,12].
It should be noted that core collection activities canonly be referred to as a closed loop supply chain if thefollowing conditions are fulfilled:
� The core is collected by the OEM or the third partyremanufacturer that acts as the supplier to theOEM.
� The core enters (and is used) in the main stream ofa manufacturing forward material flow.
� The remanufactured product is sold in the same wayas the new one, i.e., the remanufactured product isnot considered as a different product variant, andorder and supply is not handled separately.
Figure 1a,b,c describes the material flow in differenttypes of supply chains.The ideal closed loop supply chain, which is essential
for the success of the product’s multiple life cycle, isshown in Figure 1a. By clarifying the existing misconcep-tions, the closed loop supply chain management can bedefined as follows [13]:
The design, control, and operation of a system tomaximize value creation over the entire life cycle of aproduct with dynamic recovery of value from differenttypes and volumes of returns over time.
In the remanufacturing system, the core acts as rawmaterial, and seamless operation of the system entirelydepends on the efficiency of the core collection. Itbecomes especially challenging as the core is not sup-plied by one or a few suppliers in a periodic and system-atic manner. Instead, the suppliers of the core are theend consumers who own one or a few products and re-turn those products whenever they need or want. Inaddition to this, the consumers’ geographic locationscould be anywhere on the globe. The supply chain
a.
b.
c.
Figure 1 Material flow in different types of supply chain. Different arrows in the figures illustrate direction of product and component flowin the supply chain.
Asif et al. Journal of Remanufacturing 2012, 2:4 Page 3 of 21http://www.journalofremanufacturing.com/content/2/1/4
becomes further complicated with product variety, re-turn time, quality of the core, product life cycle, technol-ogy life cycle, cost of collection, and so on.Guide and Van [13] have put together the past 15 years’
research development in the closed loop supply chainwhich provides an overview of relevant research areas,and Lundmark et al. [14] have presented a literature re-view pointing out industrial challenges within the remanu-facturing system. Researchers who have worked with theclosed loop supply chain have more or less acknowledgedthe problem of uncertainty related to timing and quantityof the returned core, quality of the core, and mismatch be-tween the supply and demand of the core and remanufac-tured product. This problem was mentioned in the earlyresearch done by Thierry et al. [15], and the most recentwork presented by Guide and Van [13] indicates that theproblem still exists. Along the way, these problems havebeen brought up by several authors; among them, the con-tributions of Gungor and Gupta [16], Seitz and Peattie[17], and Toffel [18] are worth mentioning. By reviewingseveral relevant research, the underlying reasons of uncer-tainty have been identified as follows:
� The return of the core occurs for different reasonsin different periods of time [19,20].
� A product’s EoL is the result of the complexrelationships between age and pattern of use (userconditions, user interactions, levels of service andmaintenance, etc.) [21].
� Some products never return as the products move outof the region where legislative or other obligations arenot valid and return is not economically feasible.
� The product’s information is lost; thus, the corecollection from the product is done manually on thebasis of trial and error, which often causesdestruction of cores. Freiberger et al. [22] have givenan example of difficulties in testing andremanufacturing of electronic and mechatronicvehicle components due to lack of information.
� Remanufacturing is treated as a separate business;therefore, demand and supply is tackled independently.
� Products are not designed for efficient recovery [23,24].
However, with the increase in interest to conserveresources, efforts to minimize the uncertainties in core
Asif et al. Journal of Remanufacturing 2012, 2:4 Page 4 of 21http://www.journalofremanufacturing.com/content/2/1/4
collection are also getting attention. To ensure flawlesscore returns, some sort of agreement between OEMs,consumers, and remanufacturers is needed. There areseveral business models that have been adopted by thepioneering OEMs in remanufacturing. Östlin et al. [20]have discussed some of the relationships and core acqui-sition strategies often used by the OEMs. Kumar andMalegeant [25] pointed out that strategic alliance be-tween the OEMs and eco-non-profit organizations inthe collection process not only helps to acquire cores atEoL/end of use (EoU), but also creates value for thefirm. Among all these, the most commonly used busi-ness models for core collection are ownership-based andbuyback. However, from the publication of Lifset andLindhqvist [26], it is understood that the ownership-based business model is not straightforward, and its suc-cess depends upon careful analysis of the profit and loss.In other words, the ownership-based business model isnot always feasible. Buyback is not as efficient as it issupposed to be if the consumers are not concerned andmotivated.Moreover, this solves half of the problem. It is true
that these kinds of business models bring a certain levelof certainty to the timing of the core returns, but uncer-tainty related to the quality of the core remains unsolved[8-11]. At the same time, the above-mentioned businessmodels aim to bring cores back at the EoL/EoU, atwhich point, value recovery becomes extremely difficult.It is also important to consider the consumer’s percep-tion about newness of the product as it influences returnof the core. Most of the business models may fail to ful-fill its purpose if the consumers have a negative attitudetowards the remanufactured product. The rest of thebusiness models may fail if the customers wish tochange brand or manufacturer.
System dynamics and its application in closed loop supplychainSystem dynamics is a method to enhance learning in thecomplex system which is grounded in the theory of non-linear dynamics and feedback control developed inmathematics, physics, and engineering. Basically, the dy-namic tendency of any complex system is the result of asystem’s internal structures, feedback mechanism, andcausal relationships among factors that are active in thesystem [27]. System dynamics was introduced by JayWright Forrester and developed at MIT in the mid1950s. Since then, system dynamics has been applied toa wide range of issues in social, economic, and engineer-ing sciences.Ilgin and Gupta [28] concluded that the application of
simulation, stochastic programming, robust optimization,and sensitivity and scenario analyses has become quitepopular in research due to a high degree of uncertainty
involved in reverse logistics. They have also mentionedthat more studies are needed to better control the effectsof uncertainties in the closed loop supply chain. Systemdynamics is one of such modeling and simulation methodwhich is widely used in the management of productionsystems, especially in the supply chain (forward) for aboutfive decades. An overview of the frame of the researchthat applied system dynamics in the supply chain is pre-sented by Angerhofer and Angelides [29], Georgiadis andVlachos [30], and Vlachos et al. [31]. The trend of usingsystem dynamics in the analysis of the closed loop supplychain is relatively new but growing; at the same time,Kumar and Yamaoka [32] mentioned the lack of systemdynamics research in studying the closed loop supplychain. Nevertheless, fair progress has been made in thisrespect.Georgiadis and Vlachos [30] studied the long-term be-
havior of reverse supply chains with product recoveryunder the influence of various ecological awarenesses.Later, Vlachos et al. [31] examined capacity planningpolicies of a single product’s forward and reverse supplychain transient flows due to market, technological,and regulatory parameters. Georgiadis et al. [33] andGeorgiadis and Efstratios [34] developed models of systemdynamics to study the closed loop supply chain withremanufacturing both for single-product and two-producttypes under two alternative scenarios which incorporate adynamic capacity modeling approach.In a recent work, Qingli et al. [35] continued the work
of Vlachos et al. [31], to some extent, and added thebullwhip effect into their studies. Similar modeling hasbeen done by Schröter and Spengler [36], but their focuswas product recovery to obtain spare parts for equip-ment, when the original equipment is no longer pro-duced. Poles and Cheong [37] modeled the closed loopsupply chain to determine factors that influence the re-turn of cores and concluded that customer behavior andthe level of service agreement improve control overreturns, thus, reducing uncertainty in remanufacturingsystems.The research mentioned above focused mainly on op-
erational issues of the closed loop supply chain. Besiouet al. [38] argued that even though system dynamics hasbeen applied to various environmental problems, busi-ness policy, and strategy, few strategic sustainability pro-blems in the closed loop supply chain are reported.Nevertheless, Georgiadis and Besiou [39] combinedstrategies of environmental sustainability with oper-ational issues of the closed loop supply chain to studytheir interaction and understand their impact on the en-vironment. In an earlier research, Georgiadis and Besiou[40] examined the impact of innovation and ecologicalmotivation to study the long-term behavior of the closedloop supply chain which can be used as a strategic tool.
Asif et al. Journal of Remanufacturing 2012, 2:4 Page 5 of 21http://www.journalofremanufacturing.com/content/2/1/4
These are only few of the publications; besides these,there are a large number of publications available. Apartfrom applying system dynamics, linear programmingmodels for the closed loop supply chain network designare quite popular among researchers. The review ofmathematical models using linear programming has notbeen included in this paper. The authors recommendthe work of Özkir and Basligil [41] for an overview of re-search done to design the closed loop supply chain net-work using the linear programming approach.
Critical review of the state-of-the-artThere is a misconception concerning the closed loopsupply chain. Supply chains designed to collect coresand developed to sell remanufactured products in a sec-ondary market (bypassing the OEMs) are not necessarilyclosed. Apart from this fact, it is an established truththat the main problem of the closed loop supply chain isthe uncertainty in timing of core return and the qualityof the returned cores. A fundamental but rarely dis-cussed truth is that most of the researchers suggestimplementing the closed loop supply chain conceptwhere the product, or the business model, is notdesigned for it.The scope of applying system dynamics in the closed
loop supply chain is large compare to what had beendone so far. System dynamics has been applied in bothoperational and strategic issues of the closed loop supplychain. However, studying and analyzing the performance(or behavior of KPI) of the closed loop supply chainunder the influence of uncertain quantity and quality ofreturned core in unpredictable intervals using systemdynamics had not been the main focus of the researchup to this point. The influence of the uncertainty in stra-tegic resources such as inventory, capacity, backlog, anddemand in the closed loop supply chain had not beenextensively covered in most research.
ResCoM: a new paradigm of manufacturingAccording to the definition presented in the ‘Back-ground’ section, ResCoM is a holistic approach that providesa complete solution to maximize resource conservation andminimize waste. ResCoM is built upon the concept of theproduct’s multiple life cycle.The concept of product life cycle can simply be
explained as follows: the life cycle of a product (thatcontains more than one part) is generally equal to thelife cycle of the component that has the shortest life. Forexample, a product consists of three components X, Y,and Z, and each has the designed life of 1, 2, and 3 years,respectively. Basically, the product will reach its EoLwhen one of the components fails. Considering thatother factors do not affect the component’s life, compo-nent ‘X’ will fail at the age of one, and eventually, the
product will be discarded. It is to be noted that compo-nents ‘Y’ and ‘Z’ have equal and twice as manyremaining lives compared with X, respectively. If the en-tire product is discarded, the potential recoverable valuesare lost. Instead, if component X can be replaced orupgraded at the age of 1 year and component X isreplaced or upgraded again along with Y at the age of 2years, then the product can sustain three life cycles. Al-ternatively, the ideal case is to design a product thatcontains components that have the same duration of life.Of course, in reality, it is not as straightforward as it hasbeen explained. It is important to highlight that the lifecycle of a product/component is not time-dependent,which means that the time when a product/componentwill reach its EoL is not exactly deterministic. The lifecycle duration of a product is the result of a complex re-lationship mainly between age, operating conditions, ser-vice, and maintenances during the life cycle and the userlocations. It is not possible to determine the exact inter-val of each life cycle. Therefore, ResCoM proposes to de-velop a robust design method to reduce the uncertaintyin predicting the EoL and to integrate life cycle-monitoring devices to monitor the physical/functionalcondition of critical components.In ResCoM, the product is named as resource conser-
vative product (RCP) which is used as a ‘brand’ name.Each life cycle of RCP is labeled with a resource conser-vation level (RCL). The concept is illustrated inFigure 2a. In principle, RCL0 refers to a new RCP thatcontains only new components, and it is at the start ofits first life cycle, having several life cycles ahead. Com-ponents at a certain level are called RCLi (where i = 0, 1,2. . .) components, such as RCL0 components, RCL1components, and so on. At the end of life cycle 1 (i.e.,end-of-resource conservation level 0 (EoRCL0)), whenthe desired performance reaches the minimum allow-able, the product is recalled, upgrading and replacementof complements are done, and remanufacturing is per-formed. RCL1, which is the beginning of the second lifecycle, contains new components of RCL0 and upgradedcomponents of RCL0 and may contain some new com-ponents. This approach continues until the productfinishes its predetermined number of life cycles. At theend of each life cycle, the product is restored to thedesired performance level. This so far explains the lifecycle at the product or subassembly level. The life cycleof the component is slightly different and is illustratedin Figure 2b.Let us assume that a product is assembled with three
components represented by X, Y, and Z and that theirperformance index over time is shown in Figure 2b withred, blue, and green curves, respectively. In this particu-lar case, the life cycle (i.e., three life cycles) of the prod-uct is determined based on the component which has
Figure 2 Product’s (a) and component’s (b) life cycle in ResCoM.
Asif et al. Journal of Remanufacturing 2012, 2:4 Page 6 of 21http://www.journalofremanufacturing.com/content/2/1/4
the longest design life, i.e., component Z. At RCL0, theproduct contains three new components. At EoRCL0,component X reaches the minimum allowable perform-ance, which is then replaced with a similar component.It means that at RCL1, the product will have two RCL0components and one new component and so on.So far, the core concept of ResCoM and product’s mul-
tiple life cycle has been briefly presented. Readers are re-ferred to the work of Asif [8] for further details.Among the many dimensions of ResCoM research
framework, the closed loop supply is an essential elem-ent. The innovative approach of managing the closedloop product system in ResCoM is further elaborated inthe following sections.
ResCoM closed loop supply chainAs discussed in the preceding section, in the product’smultiple life cycle approach, the product will return atseveral occasions and will go through remanufacturing.To facilitate this, the closed loop supply chain is required.The operational effectiveness of a supply chain mostlydepends on the smooth flow of material both in forwardand reverse directions without constraining the plannedcapacity of the manufacturing processes. It means thatthe manufacturing system for RCL0 products and themanufacturing systems for RCL1 to RCLi should not beover- or under-capacitated. To ensure this, the expectedquantity of the product to be manufactured at RCL0 andRCL1 to RCLi needs to be known. As the RCL0 productrefers to a newly manufactured product and follows astandard manufacturing forward supply chain, it is rela-tively simple to plan. On the other hand, RCL1 to RCLimanufacturing significantly depends on the availability ofthe products (cores) from their previous life cycles. Avail-ability of the returned products and scrap rate of thereturned products are the main obstacles to the successof the closed loop supply chain. In ResCoM, the problemof product availability is solved through product design,estimation of life cycle duration, and the number of life
cycle and business model. In ResCoM, the quantity andthe timing of the product return are predictable within acertain confidence interval. However, the other problemwith the quality of the returned product is not entirelysolved but minimized to a large extent.In the conventional approach, it is estimated that the
scrap rate of returned product can be anything from 15%to 85%. The reasons for this large variation are mainly dueto age, operating conditions of product, and quality of ser-vice that the product receives during the life cycle. InResCoM, the age of the returned product is known, and theservice of the product is managed and controlled by theOEM (or authorized service provider). This means that innormal circumstance, the quality of the returned productsis known within a certain confidence interval. The func-tional condition of critical components in the products willbe monitored during operation; if there is any deviation inthe desired performance, the product will be recalled earl-ier. In this way, currently perceived scrap rate can certainlybe reduced, which eventually can create a robust closedloop supply chain with minimum uncertainty.There are other issues, such as designing the network,
planning and controlling the logistics, and production atRCL1 to RCLi, which are also related to the success ofthe closed loop supply chain. These issues are greatlyinfluenced by the types of product, size, and periphery ofthe market. As the concept is presented in a genericcontext and does not refer to any specific product, dis-cussion around these issues is not within the scope ofthe research at this point.
ResCoM business modelThe ResCoM approach is not well fitted with the ordinarysell-buy-sell business model. It requires a model that goesbeyond the conventional business model and establishes astrong relationship among OEMs, consumers, and thirdparties (if the OEM decides to outsource RCL1 to RCLiproduction). Based on the concept of RCP brand and RCLlabeling, the business model of resource conservative
Figure 3 The summarized resource conservative manufacturing business model. RCL0 is the new RCP product with resource conservationlevel zero; RCLi is the RCP with resource conservation level i = 1, 2, 3.
Asif et al. Journal of Remanufacturing 2012, 2:4 Page 7 of 21http://www.journalofremanufacturing.com/content/2/1/4
manufacturing is illustrated in Figure 3. In this model, theRCP production at RCL0 and RCLi are separate functionsof the same enterprise. However, RCLi production can beoutsourced by the OEM only if the entire process is con-trolled by the OEM. In the ResCoM business model, consu-mers are part of the manufacturing system and mostlyresponsible for returning the product at the end of each lifecycle. As mentioned earlier, consumers are still reluctant to-wards secondhand products. Therefore, at the beginning,the business model suggests a dedicated RCP reselling unit,which will act as the bridge between the consumer andOEM or third party suppliers. The basis of their relation-ship and the interest of each stakeholder are determinedmainly based on the product type, number of returns, ar-rangement of returns, and way of reselling. Besides, theRCP reselling unit will also be engaged in promoting RCL1to RCLi product adoption as a social and moral responsibil-ity. Once the business model is established and consumersbecome comfortable with the product’s multiple life cycleand consider product returning as part of their social re-sponsibility, the RCP reselling unit will be abolished. Theordinary product distribution unit will take over both RCL0and RCLi product selling.
The modeling approach and the models of supply chainsThe models that are presented in this paper retain differ-ent objectives than the publications mentioned in the‘System dynamics and its application in closed loop sup-ply chain’ section. The main purpose of the modeling isto study and analyze the performance of the closed loopsupply chain. Therefore, the model does not propose
any solution; instead, the model is used to understandthe behavior of KPI of the closed loop supply chain inconventional and in the proposed ResCoM context. Themodels are used to analyze the robustness of the con-ventional forward supply chain in the settings of theconventional closed loop supply chain and compare it tothe proposed one by ResCoM. The aim of the modelingis to see how the KPI in the closed loop supply chainvary with time in different settings. In addition, the aimis to understand the main drivers affecting the KPI aswell as the end results, and the behaviors of the strategicresources. Two models have been built, and four differ-ent analyses have been made. The behavior of KPI hasbeen analyzed for the following:
The models have been built in three steps. In the firststep, forward and reverse supply chains have been modeledwithout any dependency. In the second step, forward andreverse supply chains have been combined, i.e., the closedloop supply chain where the forward supply chain is influ-enced by the reverse supply chain. In the third step, themodel has been built as how ResCoM proposes. In the fol-lowing sections, the structure of these models is described.The supply chain is modeled with inventory control
Inventory
Expecteddemand
Desired WIP inventory
Inventory gap
Backlog
Backlog gap
Desired backlog
Desired production
Shipment
Order
Change in expected demand
+
+-
+ -
+
+
+
+
+
+
-
-+
++
-
Inventory control
Inventory
Shipment rate
Delivery delay
Perceived deliverydelay
Pressure to expand capacity
Effect of pressure
Desired deliverydelay
Desired capacit y
Current capacity
Change in capacity
Time to preceivedelivery delay
Capacity additiondelay
Initial capacity
+ -
+
+
+
+
+
+
-
+-
Capacity acquisition
Backlog
Order
Shipment
Delivery delay
Delivery delay ratio Desired delivery
delay
Effect of delivery delay on demand
+
-
+-
-+
-
-
Order backlog
Figure 4 Causal loop diagram of inventory control, capacity acquisition, and order backlog.
Asif et al. Journal of Remanufacturing 2012, 2:4 Page 8 of 21http://www.journalofremanufacturing.com/content/2/1/4
mechanism, capacity acquisition, demand backlog, and de-mand forecasting. The performance of the supply chain isanalyzed in respect to the level of inventories, backlogs,rates (production, assembly, shipment, etc.), and delays.The causal structures of the feedback loops used in themodels are shown in Figure 4.Regardless of which model settings are discussed, the
performance indicators, drivers, end results, and stra-tegic resources have the same structure and relation-ships. For example, the end result order (rate) directlyinfluences the strategic resource backlog. The end resultis driven by the delivery delay ratio which is influencedby delivery delay. Delivery delay is influenced by theshipment (rate).Similarly, in case of capacity acquisition loop, the end
result is the change in the capacity of the system. Thisend result is driven by the pressure to expand capacity,which causes the strategic resource capacity to fall orrise. This is directly influenced by the delivery delay.Finally, in case of inventory, the end result is the
desired production rate which is driven by inventory gapand backlog gap. The gaps are influenced by the
strategic resource backlog, expected demand, and the in-ventory itself which are influenced by the delivery delay.
Mathematical formulationThe main mathematical formulations used in the model-ing are shown in Additional file 1. However, dependingon where in the models these concepts are used, the no-tation to define the flows, stocks and variables arenamed accordingly. For detail mathematical formulationof each section in the model the readers are referred tothe work of Asif [8].
Forward supply chainThe forward supply chain has been modeled with thesectors named as production capacity, assembly capacity,production work in progress (WIP) inventory, assemblyWIP inventory, finished product inventory, productionbacklog, assembly backlog, sales backlog, and demandforecasting.a The stock and flow diagram of the forwardsupply chain is shown in Figure 5. The followingassumptions have been made:
Production delivery delay perceived by companyTime to perceive
production delivery delay
Normal order
Production capacity acquisition delay
Pressure to expand production capacity
Production WIPinventory
~
Effect of expansion pressure on desired production
capacity
Planned assembly delay
Desired productionrate for backlog control
Productionstart rate
Desired production rate
for inventory control
Current productioncapacity
Shipment delay
Desired productionstart rate
Production WIPinventory
Planned production start delay
Expected demand
Desired production backlog
Planned production delay
Productionbacklog gap
Desired productionrate for backlog control
Desired production WIP inventory
Production WIP
inventory coverage
Production WIPinventory gap
Desired productionstart rate
Desired shipment rate
Assembly backlog
Assembly orderrate
Assembly order fulfillment
rate
Planned assembly delay
Actual assembly delay
Assembly backlog
Assembly delivery delay ratio
Assembly rate
~
Effect of assembly
DD on order
Desired assembly rate for backlog
control
Production
backlog
Productionorder rate
Production order
fulfillmentrate
Actual production delay
Production delivery delay ratio
Production rate
Actual production delay
~
Effect of production DD on order
Planned production delay
+
+
Finished product inventory
Demand forecasting
Sales backlog
Assembly WIP inventory
Assembly capacity
Production capacityForward supply chain
Production WIP inventory
Assembly backlogProduction backlog
Figure 5 Stock and flow diagram of forward supply chain.
Asif et al. Journal of Remanufacturing 2012, 2:4 Page 9 of 21http://www.journalofremanufacturing.com/content/2/1/4
� The models are built for a single product.� Production starting capacity is infinite.� Shipment of product is only constrained by availability
of product in the finished product inventory.� Order placed by the consumers is constant.
In the forward supply chain sector, the stock of produc-tion WIP inventory is accumulated at the desired produc-tion rate, and the inventory moved to the next step(assembly WIP inventory) at the production rate. The pro-duction rate can be determined in four ways as follows:
� Available production WIP inventory starts to moveto the next stage after minimum production delay.
� Available production WIP inventory starts to moveto the next stage as much as the current productioncapacity allows.
� Available production WIP inventory starts to moveto the next stage at a rate that can bring theproduction backlog to the desired level.
� Available production WIP inventory starts to move tobring the assembly WIP inventory at the desired level.
Current production capacity is an accumulative value ofthe difference between the desired and current production
capacity over time. If the ratio of actual and planned pro-duction delay becomes larger, then that would create apressure to expand capacity. This pressure causes thedesired capacity to rise after a predefined delay.Similarly, in the sales backlog sector, the expected de-
mand is an accumulative value of the difference betweenthe expected demand and sales order rate over time. It isto be noted that the expected demand represents infor-mation, not the physical product. If the ratio of actualand planned distribution delay becomes larger, then thatwould cause a drop in the order rate. This causes theexpected demand to fall. However, the expected demanddoes not rise or fall immediately but after a predefineddelay. It is important to note that in the model, normalorder that is placed by the consumers has been consid-ered as the order rate in all steps, i.e., shipment, assem-bly, and production in the forward supply chain.As mentioned earlier, in the production backlog sector,
the production order rate is considered the same as the nor-mal order placed by the consumers. ‘This rate causes theproduction backlog to rise, and backlog decreases with therate of production order fulfillment rate, which is basicallythe production rate (it also reduces production WIP inven-tory). The backlog and the rate at which the order is ful-filled determine the actual production delay. The ratio
Asif et al. Journal of Remanufacturing 2012, 2:4 Page 10 of 21http://www.journalofremanufacturing.com/content/2/1/4
between planned and actual production delay would causethe order to fall if the ratio becomes greater than one. Simi-lar to the expected demand, production backlog also repre-sents information, not physical product.In addition, the production WIP inventory sector is
used to estimate the desired production WIP inventoryand desired production backlog. Based on the expecteddemand and how much inventory to keep, the desiredproduction WIP inventory is estimated. Similarly, basedon expected demand and planned production delay, thedesired production backlog is determined. Desired pro-duction start rate is estimated based on the gap betweenthe desired and actual inventory and the gap betweenthe desired and actual backlog.Exactly the same stock and flow structure follows in
the assembly WIP inventory and finished product inven-tory as of production WIP inventory. The assembly cap-acity, assembly backlog, assembly WIP inventory, salesbacklog, and finished product inventory sectors haveexactly the same flow and stock structure as the produc-tion part of the model.
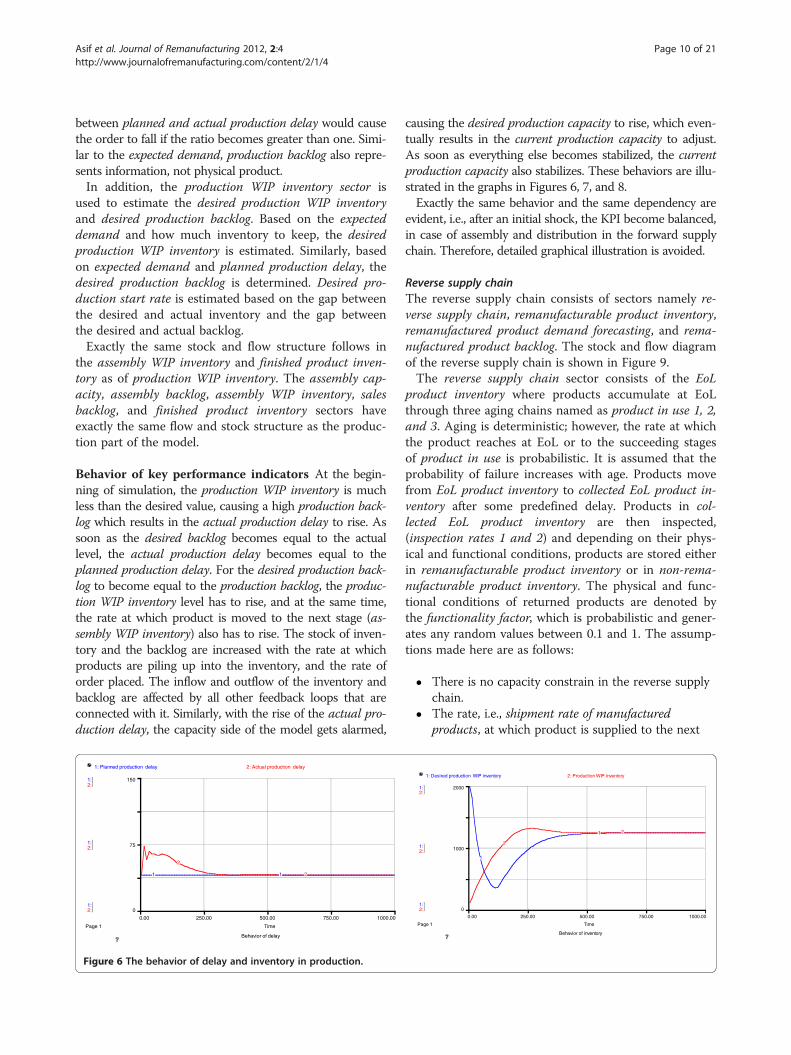
Behavior of key performance indicators At the begin-ning of simulation, the production WIP inventory is muchless than the desired value, causing a high production back-log which results in the actual production delay to rise. Assoon as the desired backlog becomes equal to the actuallevel, the actual production delay becomes equal to theplanned production delay. For the desired production back-log to become equal to the production backlog, the produc-tion WIP inventory level has to rise, and at the same time,the rate at which product is moved to the next stage (as-sembly WIP inventory) also has to rise. The stock of inven-tory and the backlog are increased with the rate at whichproducts are piling up into the inventory, and the rate oforder placed. The inflow and outflow of the inventory andbacklog are affected by all other feedback loops that areconnected with it. Similarly, with the rise of the actual pro-duction delay, the capacity side of the model gets alarmed,
Behavior of delay
Page 1
0.00 250.00 500.00 750.00 1000.00
Time
1:
1:
1:
2:
2:
2:
0
75
150
1: Planned production delay 2: Actual production delay
1 1
2
2
Figure 6 The behavior of delay and inventory in production.
causing the desired production capacity to rise, which even-tually results in the current production capacity to adjust.As soon as everything else becomes stabilized, the currentproduction capacity also stabilizes. These behaviors are illu-strated in the graphs in Figures 6, 7, and 8.Exactly the same behavior and the same dependency are
evident, i.e., after an initial shock, the KPI become balanced,in case of assembly and distribution in the forward supplychain. Therefore, detailed graphical illustration is avoided.
Reverse supply chainThe reverse supply chain consists of sectors namely re-verse supply chain, remanufacturable product inventory,remanufactured product demand forecasting, and rema-nufactured product backlog. The stock and flow diagramof the reverse supply chain is shown in Figure 9.The reverse supply chain sector consists of the EoL
product inventory where products accumulate at EoLthrough three aging chains named as product in use 1, 2,and 3. Aging is deterministic; however, the rate at whichthe product reaches at EoL or to the succeeding stagesof product in use is probabilistic. It is assumed that theprobability of failure increases with age. Products movefrom EoL product inventory to collected EoL product in-ventory after some predefined delay. Products in col-lected EoL product inventory are then inspected,(inspection rates 1 and 2) and depending on their phys-ical and functional conditions, products are stored eitherin remanufacturable product inventory or in non-rema-nufacturable product inventory. The physical and func-tional conditions of returned products are denoted bythe functionality factor, which is probabilistic and gener-ates any random values between 0.1 and 1. The assump-tions made here are as follows:
� There is no capacity constrain in the reverse supplychain.
� The rate, i.e., shipment rate of manufacturedproducts, at which product is supplied to the next
Behavior of inventory
Page 1
0.00 250.00 500.00 750.00 1000.00
Time
1:
1:
1:
2:
2:
2:
0
1000
2000
1: Desired production WIP inventory 2: Production WIP inventory
1
1
2
2
Behavior of backlog
Page 1
0.00 250.00 500.00 750.00 1000.00
Time
1:
1:
1:
2:
2:
2:
0
1000
2000
1: Desired production backlog 2: Production backlog
1
1
2
2
Behavior of rate
Page 1
0.00 250.00 500.00 750.00 1000.00
Time
1:
1:
1:
2:
2:
2:
3:
3:
3:
0
15
30
1: Production rate 2: Production start rate 3: Desired production rate for backlog control
1
12 2
3
3
Figure 7 The behavior of backlog and rate in production.
Asif et al. Journal of Remanufacturing 2012, 2:4 Page 11 of 21http://www.journalofremanufacturing.com/content/2/1/4
stage is only constrained by the availability ofcollected EoL product inventory andremanufacturable product inventory or the desiredshipment rate of remanufactured product.
� Each product reaching EoL creates a demand, andorder is placed immediately.
The stock and flow structure used in the sectors rema-nufactured product backlog, remanufactured product de-mand forecasting, and remanufactured product inventoryhas the same structure as the backlogs, demand forecast-ing, and inventory sectors described in the forward sup-ply chain in the previous section.
Behavior of key performance indicators Behavior ofKPI in the reverse supply chain is not the same as thatin KPI in the forward supply chain. The main reason forinconsistency in the behavior is the random variablesthat determine different rates in the model. Besides, in
Beh
Page 1
0.00 250.00
1:
1:
1:
2:
2:
2:
0
75
150
1: Desired production capacity
1
2
Figure 8 The behavior of capacity in production.
the reverse supply chain model, the demand is consid-ered to be more than the supply. This causes theplanned and actual distribution delay, inventory, back-log, and shipment rates never to balance. This hypoth-esis is a well-known fact in the reverse supply chain. Thebehavior of KPI is illustrated in the graphs in Figures 10and 11.From the above graphs, it can be concluded that the re-
verse supply chain is unstable in nature. The uncertainty ofcore arriving time, quantity, and quality causes the feedbackloops to suffer. This kind of behavior limits the possibilityto create a robust policy. The decision makers usually can-not identify key drivers within the system that can improvethe system’s performance in such situations.
Conventional closed loop supply chainIn the conventional closed loop supply chain, the above-mentioned two models have been kept the same withtwo distinct differences. Firstly, remanufacturable product
avior of capacity
500.00 750.00 1000.00
Time
2: Current production capacity
1 2
Product in use 1
EoL 1
Delivery rate
1 to 2
EoL 2
Product in use 2
Product in
use 3
Delivery rate2 to 3
EoL delay 1
EoL ratio 1
EoLproduct inventory
EoL delay 2
EoL ratio 2
EoL 3
EoL delay 3
EoL ratio 3
Inspection
rate 1
Inspection rate 2
Remanufactureable product inventory
Non remanufactureable
product inventory
Collection delay
Shipment delay for remanufactured
product
Shipment rate ofremanufactured product
Min inspection delay
Functionalityfactor
Desired
inspection rate 1
Delivery rate 1
Shipment rate
Planned distribution delay
for remanufacturedproduct
Remanufactured
productorder backlog
Order rate of remanufactured
product
EoL product
order fulfillmentrate
Planned distribution delay for remanufactured
product
Actual remanufactured
product distribution delay
Normal order rateof remanufactured product
Remanufactured productdelivery delay
ratio
Shipment rate of
remanufactured product
~
Effect of remanufactured product DD on
order
Desired shipment rate of remanufactured product
Order rate of remanufactured
product
Expected demand of remanufactured
product
+
Change in expected
demand 2
Time to adjust expected demand 2
Remanufactureable product
inventory gap
Remanufactureable
product inventory
Desired inspection rate 1
Expected demand
of remanufacturedproduct
Desired remanufactured product order backlogRemanufactured product
order backlog gap
Planned inspection delay
Desired remanufactureable product inventory
Remanufactureable product inventory coverage
Remanufactured product
order backlog
Collected EOL productinventory
Collection rate
EoL 2
EoL 1
EoL 3
Desired shipment rate of remanufactured product
-
+
Remanufactured product backlog
Remanufactured product demand forecasting
Remanufactureable product inventory
Reverse supply chain
Figure 9 Stock and flow diagram of the reverse supply chain.
Asif et al. Journal of Remanufacturing 2012, 2:4 Page 12 of 21http://www.journalofremanufacturing.com/content/2/1/4
inventory has been connected to the assembly WIP inven-tory, i.e., products accumulated in the remanufacturableproduct inventory move to the assembly WIP inventory atthe shipment rate of manufactured product. Secondly, theorder rate of remanufactured product has been added inthe sectors production backlog, assembly backlog, andsales backlog in the forward supply chain. The changes areshown in the model with ‘green’-colored flows and
Behavior of delay
Page 1
0.00 250.00 500.00 750.00 1000.00
Time
1:
1:
1:
2:
2:
2:
0
125
250
1: Planned distribution delay for remanufactured product 2: Actual remanufactured product distribution delay
1 1
2
2
Figure 10 The behavior of delay and inventory in the reverse supply
connections in Figure 12. The main assumptions madehere are as follows:
� Both remanufactured and newly manufacturedproducts are sold through the same channel.
� All remanufactured products are as good as thenewly manufactured products and can substitute theneed for production.
Figure 11 The behavior of backlog and rate in the reverse supply chain.
Asif et al. Journal of Remanufacturing 2012, 2:4 Page 13 of 21http://www.journalofremanufacturing.com/content/2/1/4
� The market becomes larger as soon as the firmdecides to remanufacture products.
� All remanufacturable products are remanufacturedwithout any delay. It means that the shipment delayfor remanufactured product is not constrained byother factors such as delay in capacity acquisitionand delay in order processing.
Desired assembly capacity
Current assembly
capacity
+
Change in assembly capacity
Desired production rate
for inventory control
Assembly delivery delay perceived by company
Time to perceive
assembly delivery delay
Planned assembly delay
Assembly capacity acquisition delay
Desired production capacity
Current productioncapacity
Assembly WIP
inventory
Pressure to expand assembly capacity
~
Effect of expansion pressure on desired assembly
capacity
+
Change in production capacity
Min productiondelay
Productirate
Planned production delay
Desired assembly
backlog
Actual assembly delay
Assembly
backlog gap
Desired ain
Assembly WIPinventory gap
Planned production
delay
Production
backlog
Production delivery delay perceived by companyTime to perceive
production delivery delay
Normal order
Production capacity acquisition delay
Pressure to expand production capacity
Production WIP
inventory
~
Effect of expansion pressure on desired production
capacity
Desired productionrate for backlog control
Productionstart rate
Desi
productiofor inventor
Current produccapacity
Desired productionstart rate
Production WIPinventory
Planned production start delay
Expected
demandDesired production
backlog
Planned production delay
Productionbacklog gap
Desired productionrate for backlog control
Desired production WIP inventory
Production WIP
inventory coverage
Production WIPinventory gap
Desired productionstart rate
Planned assembly delay
Assembly backlog
Desired assembly rate for backlog
control
Production
backlog
Productionorder rate
Production or
fulfillmentrate
Actual prod delay
Production delivery delay ratio
Actual production delay
~
Effect of production
DD on order
Planned production delay
+
Assembly WIP inventory
Assembly capacity
Production capacity
Production WIP inventory
Production backlog
Figure 12 Stock and flow diagram of the forward supply chain in con
Behavior of key performance indicators The behaviorof KPI in production (forward supply chain) of the con-ventional closed loop supply chain is shown in Fig-ures 13, 14, and 15.Two distinct differences are evident in the behavior
of KPI in case of production in the conventionalclosed loop supply chain compared with the forward
1: Planned production delay 2: Actual production delay
1 1
2 2
Behavior of inventory
Page 1
0.00 250.00 500.00 750.00 1000.00
Time
1:
1:
1:
2:
2:
2:
0
1250
2500
1: Production WIP inventory 2: Desired production WIP inventory
1
1
2
2
Figure 13 The behavior of delay and inventory in production in the conventional closed loop supply chain.
Asif et al. Journal of Remanufacturing 2012, 2:4 Page 14 of 21http://www.journalofremanufacturing.com/content/2/1/4
supply chain discussed in the ‘Forward supply chain’section:
� The graphs are not balancing.� The graphs continuously fluctuate.
In case of other parts of the forward supply chain inthe conventional closed loop supply chain scenario, i.e.,assembly and distribution exhibit balancing but fluctuat-ing characteristics. The reason of graphs in productionnot balancing in the closed loop supply chain (both inconventional and ResCoM scenarios) has been men-tioned in the ‘Discussion’ section.The reverse part of the supply chain in conventional
closed loop supply chain shows similar behavior patternas shown in Figure 10 and Figure 11.
Closed loop supply chain in ResCoMThe closed loop supply chain in ResCoM has a slightlydifferent structure than the conventional closed loopsupply chain. As in ResCoM, the time of product returnis predetermined; the aging chain does not exist in themodel. The only delay to accumulate products fromproduct in use 1 to EoL product inventory is predefined.
Behavior of backlog
Page 1
0.00 250.00 500.00 750.00 1000.00
Time
1:
1:
1:
2:
2:
2:
0
1000
2000
1: Production backlog 2: Desired production backlog
1
1
2
2
Figure 14 The behavior of backlog and rate in production in the con
In addition to this, all products are assumed to bereturned; therefore, there is no random variation in theEoL ratio. Moreover, the functionality factor that deter-mines inspection rates 1 and 2 is assumed to be quitehigh (90% of the products are remanufacturable) andconstant. This assumption is in line with the argumentmade in the ‘ResCoM a new paradigm of manufacturing’section, i.e., in the proposed ResCoM approach, thequality of returned products is known (high) to some ex-tent, and almost all of them can be used further (ifdesigned for multiple life cycle). The assumptions madein the models discussed above are valid, and no newassumptions are made. The stock and flow diagram ofthe reverse part of the ResCoM proposed closed loopsupply chain is shown in Figure 16. The stock and flowdiagram of the forward part of the closed loop supplychain proposed by ResCoM remains the same as inFigure 12.
Behavior of key performance indicators The behaviorof KPI in the forward part in the ResCoM proposedclosed loop supply chain is shown in Figures 17, 18,and 19.
Behavior of rate
Page 1
0.00 250.00 500.00 750.00 1000.00
Time
1:
1:
1:
2:
2:
2:
3:
3:
3:
0
25
50
1: Production rate 2: Production start rate 3: Desired production rate for backlog control
1
122
33
ventional closed loop supply chain.
Product in use 1
EoL 1
EoL delay 1
EoL ratio 1
EoLproduct inventory
Inspection
rate 1
Inspection rate 2
Remanufactureable product inventory
Non remanufactureable
product inventory
Collection delay
Shipment delay for remanufactured
product
Shipment rate ofremanufactured product
Min inspection delay
Functionalityfactor
Desired inspection rate 1
Delivery rate 1
Shipment rate
Planned distribution delay for remanufactured
product
Remanufactured
productorder backlog
Order rate of remanufactured
product
EoL product order fulfillment
rate
Planned distribution delay for remanufactured
product
Actual remanufactured product
distribution delay
Normal order rateof remanufactured product
Remanufactured productdelivery delay
ratio
Shipment rate of
remanufactured product
~
Effect of remanufactured product DD on
order
Desired shipment rate of remanufactured product
Order rate of remanufactured
product
Expected demand of remanufactured
product
+
Change in expected
demand 2
Time to adjust expected demand 2
Remanufactureable product
inventory gap
Remanufactureable
product inventory
Desired inspection rate 1
Expected demand
of remanufacturedproduct
Desired remanufactured product order backlogRemanufactured product
Figure 16 Stock and flow diagram of reverse supply chain in ResCoM proposed closed loop supply chain.
Behavior of capacity
Page 1
0.00 250.00 500.00 750.00 1000.00
Time
1:
1:
1:
2:
2:
2:
0
75
150
1: Desired production capacity 2: Current production capacity
11
2
2
Figure 15 The behavior of capacity in production in the conventional closed loop supply chain.
Asif et al. Journal of Remanufacturing 2012, 2:4 Page 15 of 21http://www.journalofremanufacturing.com/content/2/1/4
Actual production delay Vs. Planned production delay
Page 1
0.00 250.00 500.00 750.00 1000.00
Time
1:
1:
1:
2:
2:
2:
0
75
150
1: Planned production delay 2: Actual production delay
1 1
2 2
Behavior of inventory
Page 1
0.00 250.00 500.00 750.00 1000.00
Time
1:
1:
1:
2:
2:
2:
0
1250
2500
1: Production WIP inventory 2: Desired production WIP inventory
1
1
2
2
Figure 17 The behavior of delay and inventory in production in ResCoM proposed closed loop supply chain.
Asif et al. Journal of Remanufacturing 2012, 2:4 Page 16 of 21http://www.journalofremanufacturing.com/content/2/1/4
The behavior of KPI in the reverse part of the ResCoMproposed closed loop supply chain scenario shows a sig-nificant difference compared with that in the conventionalclosed loop supply chain scenario shown in the ‘Reversesupply chain’ section. These behaviors are shown inFigures 20 and 21.
Results and discussionSimulation resultsThe simulation results have been presented in terms ofperformance of the supply chain in three different set-tings. The trend (graphs) of the KPI such as level of in-ventories, backlogs, rates, and delays are shown inrespective sections. The trends clearly depict that the re-verse supply chain faces uncertainty due to the availabil-ity of cores and the quality of returned cores. Theforward supply chain becomes unstable when the reversesupply chain is combined, i.e., the conventional closedloop supply chain. The forward supply chain becomesstable again if the resource ResCoM approach isadopted.The feedback loop that exists within the dynamics of
the supply chain helps decision makers to take actionsthat are sustainable over time. The simulation helps tounderstand to what extent the policy is robust and thedrivers that affect robustness of the current policy. In
Behavior of backlog
Page 1
0.00 250.00 500.00 750.00 1000.00
Time
1:
1:
1:
2:
2:
2:
0
1000
2000
1: Production backlog 2: Desired production backlog
1
1
2
2
Figure 18 The behavior of backlog and rate in production in ResCoM
the case of the forward supply chain, this is particularlytrue and is validated through the model once again.However, in the case of the closed loop supply chain, theconventional supply chain management policies cannotbe applied or it is not possible to create a robust policy.Industries that use the reverse supply chain or closedloop supply chain cannot manage their supply chainwith traditional thinking and well-established policies.Industries that are planning to incorporate the reversesupply chain with their forward supply chain should,from these models, gain insight that as soon as two sup-ply chains are combined, their policies (that have beenin place and working well) will be disturbed, and the ro-bustness will not be within manageable limits. Neverthe-less, if the concept of ResCoM is adopted, the closedloop supply chain will behave more or less similarly ashow the conventional forward supply chain usuallybehaves.
Model testingThe models were tested through the initialization of themodel in a balanced equilibrium. It means that all stocksin the system remain unchanged despite the variation oftime, requiring their inflow and outflow to be equal. Thepart of the model with random variables could not beinitialized as it is; in this case, random variables were
Behavior of rate
Page 10.00 250.00 500.00 750.00 1000.00
Time
1:
1:
1:
2:
2:
2:
3:
3:
3:
0
25
50
1: Production rate 2: Production start rate 3: Desired producti…e for backlog control
1
12
2
33
proposed closed loop supply chain.
Behavior of capacity
Page 1
0.00 250.00 500.00 750.00 1000.00
Time
1:
1:
1:
2:
2:
2:
0
75
150
1: Desired production capacity 2: Current production capacity
1
1
2
2
Figure 19 The behavior of capacity in production in ResCoM proposed closed loop supply chain.
Asif et al. Journal of Remanufacturing 2012, 2:4 Page 17 of 21http://www.journalofremanufacturing.com/content/2/1/4
replaced by constant values. Initialization confirms thatthere is no discrepancy in the equations or in the feed-back loops.The models were tested using the extreme condition
test [27], where extreme input values were assigned con-currently. The reverse part did not fulfill the conditionof the extreme test due to the random variables used inthe reverse supply chain.The simulation time has been extended to test if the
model causes any reaction. In this case, the trends(graphs) of KPI remain more or less steady despite thelargely varied simulation duration.
DiscussionThe models that have been presented are generic mod-els, which do not depict any specific type of product orindustry. The boundaries of the models are quite broad;therefore, there is a lack in details in many cases. The
Behavior of delay
Page 1
0.00 250.00 500.00 750.00 1000.00
Time
1:
1:
1:
2:
2:
2:
0
150
300
1: Planned distribution delay for remanufactured product 2: Actual remanufactured product distribution delay
1 1
2
2
Figure 20 Delay and inventory behavior in reverse supply chain in Re
input data of the models are fabricated but correspondto the reality. In the models, some random variables areused, which do not comply with the system dynamicsprinciples as Sterman describes randomness as a meas-ure of our ignorance, not intrinsic to the system. In thisparticular case, randomness could not have been avoidedas no research has been found that describes these phe-nomena otherwise; the span of the analysis is relativelyshorter than what system dynamics usually suggests, andfinally, there is a lack of empirical data.The model raised at least two questions related to dy-
namics of policy and performance of supply chain. Thisis the first question: when remanufactured productsenter (in rate of nondeterministic number) the forwardsupply chain and the production rate adjusts itself, whatare the dynamics and feedback loops acting on it? Thisexplains the behavior (non-balancing trends) of KPI inthe production part in the forward supply chain after
Figure 21 Backlog and rate behavior in reverse supply chain in ResCoM proposed closed loop supply chain.
Asif et al. Journal of Remanufacturing 2012, 2:4 Page 18 of 21http://www.journalofremanufacturing.com/content/2/1/4
combining the reverse supply chain with the forwardsupply chain. The other question is as follows: when afirm decides to enter the remanufacturing (new) market,how do the dynamics of the supply and demand andmarket share become balanced and what are the feed-back loops that cause it to balance? At the same time, ithas been realized that environmental benefits, change insocietal perception, and level of natural resource conser-vation are needed to be incorporated in the model tomake it complete.The purpose of the modeling has been different from
what is usually expected from system dynamics model-ing. Through modeling, it has been shown how the pol-icy and its leverage get affected when there is largeuncertainty in any part of the supply chain. Therefore,the descriptions and arguments that are built around themodels may not be as they would have been in the caseof a conventional system dynamics model.Referring to the question that usually emerges while
choosing between continuous and discrete event simula-tions, the main factor in deciding which modeling tool touse is the level of aggregation sufficient for a particular ob-ject at hand [42]. Morecroft [43] has proven that similarresults can be obtained using both system dynamics anddiscrete event simulation. However, system dynamics isparticularly useful in demonstrating the complex dynamicrelations of factors that are essential to manage a supplychain. It also helps to visualize the feedback loops andhow they influence each other in a supply chain. More-over, it gives management a base for decision making i.e.,in a supply chain, in what degree of freedom one has tochange different variables. As the objective of modelinghas been to demonstrate performance of the supply chainin different settings and how they influence each other interms of behavior, no other tool can fulfill the purpose asexplicitly as the system dynamics did.Apart from the modeling, the research presented in
this paper tried to collect and summarize the researchdone in the closed loop supply chain. Moreover, this
work attempted to clarify the misconceptions and pro-blems related to the closed loop supply chain. A novelconcept, ResCoM, is presented to show the relevance ofthe research work with the state-of-the-art research. Fi-nally, through KPI analysis of the closed loop supplychain, it is proven that the closed loop supply chainfaces less uncertainty in terms of the supply and demandof products in ResCoM. As a by-product of this re-search, knowledge base has been created in the field ofsystem dynamics applied in supply chain management.
ConclusionsBased on the review and analysis of the research in thearea of closed loop supply chains, it is evident that theprevailing approach to close the loop for product multiplelife cycle or remanufacturing is inherent to business think-ing and models used for open loop manufacturing. Theclassic challenges of the closed loop supply chain, i.e., un-certain product returns, create serious problems for themultiple life cycle approach. Only the business thinkingunique to closing the loop can solve this problem.Moreover, it has been observed that isolated research
in the areas of product design, closed loop supply chain,and business model has progressed, but the fundamentalproblems are still unique in the conventional approach.We proposed an alternative approach, which is partiallydescribed in this work, called ResCoM. The essentialfeatures of the proposed ResCoM model are as follows:
� Products designed for multiple life cycles withpredefined life,
� Integration of forward (RCL0 production) andreverse (RCLi production) manufacturing functionsinto a single enterprise, and
� Customer integration as a business function of theenterprise
will ensure enhanced visibility of the products duringtheir entire life cycle as regards to the quality, quantity,
Asif et al. Journal of Remanufacturing 2012, 2:4 Page 19 of 21http://www.journalofremanufacturing.com/content/2/1/4
and timing of their return to the remanufacturing func-tion; this visibility will minimize the uncertainties inproduct returns. This work also concludes that for ad-vancement in developing successful product multiple lifecycle, the current approach of research on isolated pro-blems and implementation of its results in the industryis inefficient. The ResCoM concept requires a frameworkfor a system level approach integrating four major func-tions of the manufacturing enterprise: product designand development, supply chain design and management,marketing and consumer behavior, and manufacturingand remanufacturing technologies should be integratedto form a unified research platform.By reviewing and analyzing the research in the area of
closed loop supply chain in stochastic environment, thiswork concludes that system dynamics has been appliedin both operational and strategic issues of the closedloop supply chain. However, there is a need for furtherresearch as closed loop supply chain deals with complexissues. Using system dynamics, different researchers havedescribed different phenomena of the closed loop supplychain which are important in creating the knowledgebase. Models presented in this paper used system dy-namics to demonstrate the robustness of the closed loopsupply chain by analyzing the performance in conven-tional and in the ResCoM proposed approach. Throughanalysis of the behavior of KPI, it can be concluded thatthe ResCoM proposed closed loop is much more robustin terms of operations and faces less uncertainty. It isimportant for the policymakers to understand the behav-ior of KPI in order to set a robust policy. The behaviorof KPI in ResCoM also shows that robust policies can beadopted in this approach as the uncertainty isminimized.
MethodsThe methodological approach taken for this researchcan be best described as the cyclic process explained byLeedy and Ormrod [44] which includes the following:
� Problem identification and setting the research goal,� Subdividing the problem to smaller elements,� Introducing hypotheses that might lead to the
solution,� Gathering data and information that the hypotheses
and problem lead to,� Presenting the data in the form of a result to show
that the problem has been solved, the question hasbeen answer, or the result support or do not supportthe hypotheses, and
� Finally, validation and verification of the results.
While research methodology is a systematic way to doresearch, methods of research is just the means for
conduction of research [45]. The research methodologyremains the same throughout the research, while meth-ods can be different at different stages of research. Asthe research presented in this paper is in conceptualstage, and it is a small part of the ResCoM researchparadigm, therefore, all the steps of the cyclic processdescribed above may not be obvious at first glance.The foundation of the research presented in this paper
is mainly based on literature review. Some knowledgeand experiences gathered by the authors by attendinginternational conferences have also been reflected in thiswork. This is to say that the original problem formula-tion was measured and analyzed against the literature inthe topic, and this led to the final problem form. Thesefoundations have motivated the authors to describe bysimulation the widely spoken problem of the closed loopsupply chain, i.e., uncertainty in quantity and quality andarrival time of core. System dynamics principle has beenused to model the closed loop supply chains, and theStella software has been used to visually demonstrate thebehavior of KPI in different scenarios. Finally, the resultsof simulation have been presented in the form of behav-ioral comparison of KPI in conventional and ResCoMproposed closed loop supply chain settings. However, noreal data has been used to run the simulation as the ob-jective of the modeling was to highlight the particularbehavior of the KPI, not to simply quantify them.
EndnotesaWords written in italics from this point forward are
the terms used in the simulation models.
Additional file
Additional file 1: Mathematical formulations. Main mathematicalformulations used in the models.
Competing interestsThe authors declare that they have no competing interests.
Authors’ contributionsFMAA contributed in developing the concept of resource conservativemanufacturing, carried out the research presented in the paper, did themodeling, and made the draft of the paper. CB contributed in modeling,provided ideas for the modeling approach, and reviewed the modeling part ofthe research. AR contributed in developing the concept of resource conservativemanufacturing, supervised the research, provided ideas for research, and alsorevised the paper critically for important intellectual content. CMN contributed indeveloping the concept of resource conservative, supervised the research,revised the paper critically for important intellectual content, and gave the finalapproval of the version to be published. All authors read and approved the finalmanuscript.
Authors’ informationFMAA is a PhD student at the Department of Production Engineering, KTH RoyalInstitute of Technology, Sweden. He has been awarded the TechnologyLicentiate degree in September 2011. Apart from his Licentiate thesis, he haspublished articles for the Proceeding of Swedish production Symposium,DAAAM Baltic, and DAAAM international conferences. CB is a full professor of
Asif et al. Journal of Remanufacturing 2012, 2:4 Page 20 of 21http://www.journalofremanufacturing.com/content/2/1/4
Business and Public Management at the Department of International Studies,University of Palermo (Italy) where he is also the scientific coordinator of theCED4 System Dynamics Group. He is the director of the masters degree courseon “Managing business growth through system dynamics and accountingmodels: a strategic control perspective” and of the international PhD program on“Model based public planning, policy design, and management”. He is also theassociate editor of the System Dynamics Review. His main research and consultingareas are related to small business growth management, entrepreneuriallearning, startup, matching system dynamics with accounting models, dynamicscenario planning, dynamic balanced scorecards, business process analysis, andperformance management. AR is a researcher and assistant professor at theDepartment of Production Engineering, KTH the Royal Institute of Technology,Sweden. He has been working in different manufacturing industries until hejoined KTH in 2010. His research emphasis has been the analysis and control ofmachining system dynamics and extending his expertise towards sustainablemanufacturing. He is the author of many scholarly articles published in manyinternational journal and highly reputed conference proceedings. He hassignificant experience in the management of collaborative R&D projects throughlocally and EC funded projects. CMN is a full professor at the Department ofProduction Engineering, KTH the Royal Institute of Technology, Sweden. He isthe chair of the research division called Machine and Process Technology. Asidefrom the many publications in different international journal and highly reputedconference proceedings, he has published some books. He has been activelyinvolved in research and teaching since the beginning of his career and hadsupervised many PhD students.
AcknowledgmentsThe authors acknowledge the financial support received from the SwedishInstitute (www.si.se) through the project Lifecycle Management andSustainability in the Baltic Region.
Author details1Department of Production Engineering, KTH Royal Institute of Technology,Stockholm, Sweden. 2Department of Political Sciences, University of Palermo,Palermo, Italy.
Received: 11 June 2012 Accepted: 9 October 2012Published: 6 November 2012
References1. The World Bank: World development indicators. 2011. http://data.worldbank.
org/data-catalog/world-development-indicators/wdi-2011 (2011). Accessed18 June 2011.
2. Kumar V, Bee D, Tumkor S, Shirodkar P, Bettig B, Sutherland J: Towardssustainable “product and material flow” cycles: identifying barriers toachieving product multi-use and zero waste. In ASME 2005 InternationalMechanical Engineering Congress and Exposition. Orlando, Florida:; 2005.
3. CIA: The World Factbook. http://www.cia.gov/library/publications/the-world-factbook/geos/xx.html (2011). Accessed 18 June 2011.
4. Jorgenson JD: Mineral commodity summaries. 2011. http://minerals.usgs.gov/minerals/pubs/mcs/2011/mcs2011.pdf (2011). Accessed 20 June 2011.
5. World Steel Association: World steel in figures. 2011. http://www.worldsteel.org/media-centre/press-releases/2011/wsif.html (2011). Accessed 20 June2011.
6. Bureau of Internal Recycling: World steel recycling in figures 2006–2010: steelscrap - a raw material for steelmaking. http://www.bir.org/assets/Documents/publications/brochures/aFerrousReportFinal2006-2010.pdf(2010). Accessed 20 June 2011.
7. Eurostat European Commission: Energy, transport and environment indicators.http://epp.eurostat.ec.europa.eu/cache/ITY_OFFPUB/KS-DK-10-001/EN/KS-DK-10-001-EN.PDF. Accessed 20 June 2011.
8. Asif FMA: Resource conservative manufacturing: a new generation ofmanufacturing. Licentiate thesis, KTH Royal Institute of Technology; 2011.
9. Akkermans HA, Oorschot KEV: Relevance assumed: a case study ofbalanced scorecard development using system dynamics. Journal of theOperational Research Society 2005, 56:931–94.
10. Bianchi C: Enhancing Performance Management and SustainableOrganizational Growth through System Dynamics Modeling. In SystemicManagement for Intelligent Organizations: Concepts, Model-Based Approaches,and Applications. Edited by Groesser SN & Zeier R. Heidelberg: Springer-Publishing; 2012:(under process)
11. Asif FMA, Nicolescu CM: Minimizing uncertainty involved in designing theclosed-loop supply network for multiple-lifecycle of products. In Annalsof DAAAM for 2010 and Proceeding of the 21st International DAAAMSymposium: Intelligent Manufacturing and Automation: Focus onInterdisciplinary Solutions, Zadar. Edited by Katalinic B.; 2010.
13. Guide VDR, Van Wassenhove LN: The evolution of closed-loop supplychain research. Oper Res 2009, 57(1):10–18.
14. Lundmark P, Sundin E, Björkman M: Industrial challenges within theremanufacturing system. In Proceedings of Swedish Production Symposium.Gothenberg:; 2009.
15. Thierry MC, Salomon M, Van Wassenhove L: Strategic issues in productrecovery management. Calif Manag Rev 1995, 37(2):114–145.
16. Gungor A, Gupta SM: Issue in environmentally consciousmanufacturing and product recovery: a survey. Comput Ind Eng1999, 36(4):811–853.
17. Seitz M, Peattie KJ: Meeting the closed-loop challenge: the case ofremanufacturing. Calif Manag Rev 2004, 46(2):74–79.
19. Parlikad AK, McFarlane DD: Recovering value from “End-of-Life” equipment: acase study on the role of product information.: Technical report: Centre forDistributed Automation and Control, University of Cambridge; 2004.
20. Sundin E, Björkman M, Ostlin J: Importance of closed-loop supply chainrelationship for product remanufacturing. Int J Prod Econ 2008, 115(2):336–348.
21. de Brito MP, Dekker R: A framework for reverse logistics. Rotterdam: ErasmusResearch Institute of Management; 2003.
22. Freiberger S, Albrecht M, Käufl J: Reverse engineering technologies forremanufacturing of automotive systems communicating via CAN bus.Journal of Remanufacturing 2011, 1:6.
23. Kerr W, Ryan C: Eco-efficiency gains from remanufacturing a case studyof photocopier remanufacturing at Fuji Xerox Australia. J Clean Prod2001, 9(1):75–81.
24. Sundin E, Bras B: Making functional sales environmentally andeconomically beneficial through product remanufacturing. J Clean Prod2005, 13(9):913–925.
25. Kumar S, Malegeant P: Strategic alliance in a closed-loop supply chain: acase of manufacturer and eco-non-profit organization. Technovation 2006,26(10):1127–1135.
26. Lifset R, Lindhqvist T: Does leasing improve end of product lifemanagement? J Ind Ecol 1999, 3(4):10–13.
27. Sterman JD: Business Dynamics: Systems Thinking and Modeling for aComplex World. Boston: McGraw-Hill/Irwin; 2000.
28. Ilgin MA, Gupta SM: Environmentally conscious manufacturing andproduct recovery (ECMPRO): a review of the state of the art. J EnvironManage 2010, 91(3):563–591.
29. Angerhofer BJ, Angelides MC: System dynamics modelling in supply chainmanagement: research review. In Proceedings of the 32nd Conference onWinter Simulation. Orlando:; 2000.
30. Georgiadis P, Vlachos D: The effect of environmental parameters onproduct recovery. Eur J Oper Res 2003, 157(2):449–464.
31. Vlachos D, Georgiadis P, Iakovou E: A system dynamics model for dynamiccapacity planning of remanufacturing in closed-loop supply chains.Comput Oper Res 2007, 34(2):367–394.
32. Kumar S, Yamaoka T: System dynamics study of the Japanese automotiveindustry closed loop supply chain. J Manuf Technol Manag 2007, 18(2):115–138.
33. Georgiadis P, Vlachos D, Tagaras G: The impact of product lifecycle oncapacity planning of closed-loop supply chains with remanufacturing.Prod Oper Manag 2006, 15:514–527.
34. Georgiadis P, Athanasiou E: The impact of two-product joint lifecycles oncapacity planning of remanufacturing networks. European Journal ofOperations Research 2010, 202(2):420–433.
35. Qingli D, Hao S, Hui Z: Simulation of remanufacturing in reverse supplychain based on system dynamics. In IEEE, Service Systems and ServiceManagement, 2008 International Conference. Melbourne:; 2008.
36. Schröter M, Spengler T: A system dynamics model for strategicmanagement of spare parts in closed-loop supply chains. In The 23rdInternational Conference of the System Dynamics Society. Boston:; 2005.
Asif et al. Journal of Remanufacturing 2012, 2:4 Page 21 of 21http://www.journalofremanufacturing.com/content/2/1/4
37. Poles R, Cheong F: A system dynamics model for reducing uncertainty inremanufacturing systems. In PACIS 2009 Proceedings. Hyderabad:; 2009.
38. Besiou M, Georgiadis P, Van Wassenhove LN: Official recycling andscavengers: symbiotic or conflicting. European Journal of OperationsResearch 2012, 218(2):563–576.
39. Georgiadis P, Besiou M: Environmental and economical sustainability ofWEEE closed-loop supply chains with recycling: a system dynamicsanalysis. Int J Adv Manuf Technol 2010, 47:475–493.
40. Georgiadis P, Besiou M: Sustainability in electrical and electronicequipment closed-loop supply chains: a system dynamics approach. JClean Prod 2008, 16(15):1665–1678.
41. Özkir V, Basligil H: Modelling product recovery processes in closed loopsupply chain network design. Int J Prod Res 2012, 50(8):2218–2233.
42. Semere DT: Configuration design of a high performance and responsivemanufacturing system.: Doctoral thesis, KTH Royal Institute of Technology;2005.
43. Morecroft J: Strategic modelling and business dynamics: a feedback systemapproach. West Sussex: John Wiley & Sons Ltd.; 2007.
44. Leedy PD, Ormrod JE: Practical Research Planning and Design. New Jersey:Merrill/Pearson Education, Inc.; 2010.
45. Kothari CR: Research Methodology: Methods and Techniques. Delhi: New AgeInternational Limited; 2004.
doi:10.1186/2210-4690-2-4Cite this article as: Asif et al.: Performance analysis of the closed loopsupply chain. Journal of Remanufacturing 2012 2:4.
Submit your manuscript to a journal and benefi t from: