28
.99999. P Performance A Analysis R Report 2007 99999. Prepared By Profit Planning Group SAMPLE

.99999.
PPerformance AAnalysis RReport2007
.99999.
Prepared ByProfit Planning Group
SAMPLE

.99999.
PROFIT PLANNING GROUP1790 38th Street, Suite 204, Boulder, Colorado 80301v 303.444.6212 f 303.444.9245
February 1, 2010
Dear Participant,Thank you for participating in this year's survey. The following document is aconfidential report comparing your results to other participants.This report can only be as accurate as the data submitted for your firm. The analystsworking on this project exercised the utmost care in coding and analyzing your data toprovide the most accurate set of comparisons possible. However, since the data youprovided were not necessarily based on audited financial statements, we can make nowarranties with respect to the information contained in the report.If you did not provide complete information, those missing values are coded as notavailable (N/A). You may submit additions or revisions and we will re-run your report.Since this requires special processing, the fee for this service is $200 payable by youdirectly to Profit Planning Group.If you have any questions about the information that follows, please fax them tous and we will be delighted to respond to your inquiry.
Sincerely,Profit Planning Group
SAMPLE

.99999.
Table Of Contents
Section 1: Introduction ........................................................................................................................... 1Performance Scorecard ................................................................................................................... 2Summary Financial Results.............................................................................................................. 3
Section 2: Detailed Results .................................................................................................................... 4Return On Investment ...................................................................................................................... 6Income Statement............................................................................................................................ 7Expenses In Relationship To Gross Margin ..................................................................................... 8Balance Sheet.................................................................................................................................. 9Financial Ratios ............................................................................................................................. 10Asset Productivity Ratios................................................................................................................ 11Operating Productivity Ratios......................................................................................................... 12Employee Productivity Ratios......................................................................................................... 13
Section 3: Trend Analysis .................................................................................................................... 14
Section 4: Planning For Improved Results ........................................................................................... 17Improving Profitability By Managing The CPVs .............................................................................. 18Increase Sales ............................................................................................................................... 19Increase Gross Margin Percentage................................................................................................ 20Reduce Operating Expenses ......................................................................................................... 21Increase Inventory Turnover .......................................................................................................... 22A Complete CPV Plan.................................................................................................................... 23An Action Plan For Your Firm......................................................................................................... 24Profit Toolkit OnlineTM..................................................................................................................... 25
2007 Profit Planning Group, Inc.
SAMPLE

© 2007 Profit Planning Group, Inc. 1 .99999.
Section 1: IntroductionThis report is designed to help your firm strengthen it’s financial position by providing an analysis ofyour firm’s financial performance in comparison to the performance of all other participating firms.
ABOUT THIS DOCUMENTTo aid your analysis, this report is organized into the following sections:Section 1: IntroductionThis section focuses on a summary of key financial data and the firm’s performance scorecard.Section 2: Detailed ResultsThis section provides detailed comparisons between the firm and other participants including the typicalfirm and the most profitable firms.Section 3: Trend AnalysisFor firms that have participated in the past, this section presents a comparative overview of financialresults over time to provides long term insights into the firm’s performance.Section 4: Planning For Improved ResultsThis section presents an Action Plan of recommendations developed specifically for your firm.
EXPLANATION OF STATISTICSMediansMost of the figures presented in this report are based on median results. A median value is the middlevalue from the list of all reported values sorted from highest to lowest. Unlike averages (means),medians are not influenced by extreme highs or lows. Medians are, therefore, the preferred statistic forthis analysis since they best represent a typical firm’s results.High Profit FirmsThe high profit category includes the top firms based on pre-tax return on assets (ROA).FIFO Adjustment and Averages for Inventory, Accounts Receivable, and Accounts PayableIf LIFO reserve data were collected, firms were adjusted to FIFO impacting cost of goods, grossmargin, and inventory. If available, ratio calculations use average values for inventory, accountsreceivable, and accounts payable. Values used for this firm were $3,776,878 for cost of goods, $1,937,353for gross margin, $610,773 for accounts receivable, $1,190,325 for inventory, and $429,771 for accountspayable.
PERFORMANCE SCORECARDThe performance scorecard on the following page graphically shows, item by item, where your firmstands in relation to all participating firms. This standing is the percentile rank of your result for an itemin the list of all results reported for that item. The rank places your result into one of four quartileclassifications labeled INSPECT, FAIR, GOOD, and STRONG. Note that INSPECT does notnecessarily indicate that your result is a problem but the majority of firms do produce better results forthese items. These items may require a more detailed analysis within your firm.
SAMPLE

.99999. 2 © 2007 Profit Planning Group, Inc.
Performance Scorecard: Your Firm Compared With All Participants© 2007 Profit Planning Group
99999YourFirm Inspect Fair Good Strong
Strategic Profit Model Ratios
Profit Margin (Pre-tax) 1.4
Asset Turnover 2.8
Return On Assets (Pre-tax) 3.9
Financial Leverage 2.8
Return On Net Worth (Pre-tax) 10.7
Income Statement
Sales Volume (Millions) 5.71
Sales Growth -8
Cost Of Goods Sold 66.1
Gross Margin 33.9
Payroll Expenses 23.7
Occupancy Expenses 3
All Other Operating Expenses 6
Total Operating Expenses 32.7
Operating Profit 1.2
Financial Ratios
Current Ratio 2.8
Quick Ratio 0.9
Accounts Payable To Inventory 36.1
Debt To Equity 1.8
EBIT To Total Assets 7
Times Interest Earned 2.3
Productivity Ratios
Average Collection Period (Days) 39.8
Inventory Turnover (Times) 3.2
Inventory Holding Period (Days) 115
Sales To Inventory Ratio (Times) 4.8
Gross Margin Return On Inventory 162.8
Employee Productivity Ratios
Sales Per Employee 190474
Payroll Per Employee 45133
Gross Margin Per Employee 64578
Personnel Productivity Ratio 69.9
SAMPLE

© 2007 Profit Planning Group, Inc. 3 .99999.
Summary Financial ResultsHigh Sales
Typical Profit Under $15 Package YourFirm Firm Million Focus Firm
Sales Volume $13,491,000 $17,851,115 $5,714,231 $9,602,615 $5,714,231
Strategic Profit Model RatiosProfit Margin (Pre-tax) 3.3% 9.3% 2.4% 2.8% 1.4%Asset Turnover 2.8 3.0 2.4 2.6 2.8Return On Assets (Pre-tax) 9.2% 27.9% 5.8% 7.3% 3.9%Financial Leverage 1.9 1.8 1.8 1.9 2.8Return On Net Worth (Pre-tax) 17.5% 50.2% 10.4% 13.9% 10.7%Income StatementNet Sales 100.0% 100.0% 100.0% 100.0% 100.0%Cost Of Goods Sold 64.9 65.3 59.1 60.6 66.1Gross Margin 35.1 34.7 40.9 39.4 33.9Operating ExpensesPayroll Expenses 22.5 19.0 26.2 27.6 23.7Occupancy Expenses 2.8 2.1 4.5 3.5 3.0Other Operating Expenses 6.6 4.6 7.9 5.6 6.0Total Operating Expenses 31.9 25.7 38.6 36.7 32.7Operating Profit 3.2 9.0 2.3 2.7 1.2Other Income/Expenses 0.1 0.3 0.1 0.1 0.2Profit Before Taxes 3.3% 9.3% 2.4% 2.8% 1.4%Financial RatiosCurrent Ratio 2.1 2.1 2.6 2.2 2.8Quick Ratio 0.8 0.9 0.9 0.8 0.9Accounts Payable To Inventory 33.4% 33.9% 32.0% 26.0% 36.1%Accounts Payable Payout Period (Days) 37.2 32.5 29.2 33.1 41.5Debt To Equity 0.9 0.8 0.8 0.9 1.8EBIT To Total Assets 10.9% 29.1% 7.4% 9.1% 7.0%Times Interest Earned 6.5 24.3 4.4 5.0 2.3Asset Productivity RatiosAverage Collection Period (Days) 40.8 42.3 39.8 36.2 39.8Inventory Turnover (Times) 3.4 3.7 3.2 3.3 3.2Inventory Holding Period (Days) 107.4 98.6 114.1 110.6 115.0Gross Margin Return On Inventory 207.7% 240.5% 208.3% 193.5% 162.8%Growth & Cash SufficiencyGrowth Potential Index 12.4% 32.2% 9.8% 12.4% 1.5%Cash Cycle (Days) 111.0 108.4 124.7 113.7 113.3Cash To Current Liabilities 13.4% 20.1% 24.2% 12.8% 0.0%Defensive Interval (Days) 10.8 33.2 25.3 9.4 0.0Sales To Working Capital 5.6 5.8 4.9 5.2 4.8Operating Productivity RatiosSales Per Stockkeeping Unit (SKUs) $817 $1,300 $496 $697 $635Inventory Per Stockkeeping Unit (SKUs) $174 $220 $101 $145 $132Sales Per Order $789 $870 $897 $372 $1,905Employee Productivity RatiosSales Per Employee $272,153 $299,246 $235,065 $198,874 $190,474Gross Margin Per Employee $96,816 $124,219 $90,071 $79,105 $64,578Payroll Per Employee $61,759 $70,263 $55,912 $50,746 $45,133Personnel Productivity Ratio 64.1% 54.7% 64.1% 70.0% 69.9%
SAMPLE

.99999. 4 © 2007 Profit Planning Group, Inc.
Section 2: Detailed Results To facilitate comparisons, data in this section of the report is organized into the following columns:Typical ResultsThe Typical Firm column presents figures based the medians of all participating firm’s.High Profit FirmsThe High Profit Firm column includes the top firms based upon pre-tax return on assets.Sales VolumeThis column presents median based results for firms in the category Sales Under $15 Million.Sales MixThe Package Focus column reports medians for all firms with this sales mix. Firms were classifiedbased on the concentration of bulk sales versus package sales.Your Firm’s ResultsThe final column presents the figures reported for Your Firm. If LIFO reserve data were collected, firmswere adjusted to FIFO impacting cost of goods, gross margin, and inventory. If available, ratiocalculations use average values for inventory, accounts receivable, and accounts payable. Valuesused for this firm were $3,776,878 for cost of goods, $1,937,353 for gross margin, $610,773 for accountsreceivable, $1,190,325 for inventory, and $429,771 for accounts payable.
Return On Assets
9.2 27.9 5.8 7.3 3.90.0
5.0
10.0
15.0
20.0
25.0
30.0
Typical Firm High Profit Firm Sales Under $15Million
Package Focus Your Firm
% O
f Ass
ets
Gross Margin & Operating Expenses
35.1 34.7 40.9 39.4 33.931.9 25.7 38.6 36.7 32.70.0
5.0
10.0
15.0
20.0
25.0
30.0
35.0
40.0
45.0
Typical Firm High Profit Firm Sales Under $15Million
Package Focus Your Firm
% O
f Sal
es
Gross Margin % Operating Expenses %SAMPLE

© 2007 Profit Planning Group, Inc. 5 .99999.
Inventory Turnover
3.2 3.3 3.23.4 3.72.9
3.0
3.1
3.2
3.3
3.4
3.5
3.6
3.7
3.8
Typical Firm High Profit Firm Sales Under $15Million
Package Focus Your Firm
Tim
es
Average Collection Period
39.8 36.2 39.840.8 42.333.0
34.0
35.0
36.0
37.0
38.0
39.0
40.0
41.0
42.0
43.0
Typical Firm High Profit Firm Sales Under $15Million
Package Focus Your Firm
Day
s
Sales Per Employee
272,153 299,246 235,065 198,874 190,4740
50,000
100,000
150,000
200,000
250,000
300,000
350,000
Typical Firm High Profit Firm Sales Under $15Million
Package Focus Your Firm
Dol
lars
SAMPLE

.99999. 6 © 2007 Profit Planning Group, Inc.
Return On InvestmentThe Strategic Profit Model examines the return on investment performance of your firm in total andanalyzes the different factors that contribute to overall results. The model assumes that the firm'sprimary objective is to achieve a desirable rate of return on owners' investment, commonly referred toas return on net worth (RONW) or return on equity. There are five components to the Strategic ProfitModel. Your results are shown below.
Path 1 Path 2 Path 3Profit
Margin XAsset
Turnover =Return On
Assets XFinancialLeverage =
Return OnNet Worth
1.4% 2.8 3.9% 2.8 10.7%
The Strategic Profit Model
Two of the components in the model represent return on investment.Return On Assets = Profit Before Taxes ÷ Total Assets x 100Return on assets (ROA) is the direct result of the first two components or pathways; profit marginmultiplied by asset turnover. The pre-tax return on assets ratio should at least equal the cost of capital.For your company ROA is 3.9 percent.Return On Net Worth = Profit Before Taxes ÷ Net Worth x 100Return on net worth (RONW) is a return on investment ratio based on net worth or owners' investmentin the business. You should strive for a RONW at least exceeding the return available on risk-freeinvestments plus an incremental rate that offsets both inflation and risk. It should also provideadequate funds to provide for the growth of the business. Your firm has a RONW of 10.7 percent; thatis, for every $1.00 of net worth, the firm produced 10.7¢ of profit before taxes.
The two return on investment ratios are driven by three performance ratios, each representing adifferent profitability pathway.Path 1: Profit Margin = Profit Before Taxes ÷ Net Sales x 100The most important profitability pathway is profit margin management. A profit margin of 1.4 percentmeans that for every $1.00 of sales the company was able to produce 1.4¢ in profit before taxes.Path 2: Asset Turnover = Net Sales ÷ Total AssetsThe asset turnover ratio measures asset productivity, or how many dollars of sales your companygenerates per dollar invested in assets. The ratio of 2.8 means that the firm is able to generate $2.80in sales for every $1.00 in assets. Usually, asset turnover is improved by increasing inventory turnoverand by collecting accounts receivable faster.Path 3: Financial Leverage = Total Assets ÷ Net WorthFinancial leverage measures the extent to which the firm uses outside (non-owner) financing. Thehigher the ratio, the more the firm relies on outside financing. The ratio of 2.8 times suggests that forevery $1.00 in net worth, the firm had $2.80 in total assets. If for every $2.80 in total assets the ownersput up $1.00, then outsiders put up the remaining $1.80.
High SalesTypical Profit Under $15 Package Your
Firm Firm Million Focus Firm
Strategic Profit Model RatiosProfit Margin (Pre-tax) 3.3% 9.3% 2.4% 2.8% 1.4%Asset Turnover 2.8 3.0 2.4 2.6 2.8Return On Assets (Pre-tax) 9.2% 27.9% 5.8% 7.3% 3.9%Financial Leverage 1.9 1.8 1.8 1.9 2.8Return On Net Worth (Pre-tax) 17.5% 50.2% 10.4% 13.9% 10.7%
SAMPLE

© 2007 Profit Planning Group, Inc. 7 .99999.
Income StatementThe income statement provides a detailed perspective on your firm's ability to:
• Generate adequate sales• Produce those sales at a reasonable gross margin• Control the expenses associated with the sales• Ultimately produce a profit
In analyzing the sales to profit process it is essential to note how important very small changes can be.For your company, every percentage point increase in gross margin or decrease in operating expensesresults in an additional $57,142 of profit.
High SalesTypical Profit Under $15 Package Your
Firm Firm Million Focus Firm
Number Of Firms Reporting 23 10 13 12
Sales PerformanceSales Volume $13,491,000 $17,851,115 $5,714,231 $9,602,615 $5,714,231Sales Growth (2004 To 2006) 8.6% 14.2% 3.5% 8.8% -8.3%
Income StatementNet Sales 100.0% 100.0% 100.0% 100.0% 100.0%Cost Of Goods Sold 64.9 65.3 59.1 60.6 66.1Gross Margin 35.1 34.7 40.9 39.4 33.9Payroll ExpensesOwner/Executive Salaries & Bonuses 3.9 2.7 5.1 5.6 N/ASales Salaries, Commissions & Bonuses 5.3 5.1 6.6 6.5 N/AAll Other Salaries, Wages & Bonuses 10.3 8.1 10.4 10.8 N/ATotal Salaries, Wages & Bonuses 19.5 15.9 22.1 22.9 18.7Payroll Taxes (FICA, Workers Comp. & Unemp.) 1.4 1.3 2.0 2.1 2.3Group Insurance (Medical, Hospitalization, etc.) 1.2 1.2 1.6 1.9 N/ABenefit Plans (Firnges, Pension, etc.) 0.4 0.6 0.5 0.7 N/ATotal Payroll Expenses 22.5 19.0 26.2 27.6 23.7Occupancy ExpensesUtilities (Heat, Light, Power, Water) 0.4 0.3 0.6 0.5 0.8Telephone 0.3 0.3 0.4 0.4 0.2Building Repairs & Maintenance 0.2 0.2 0.2 0.2 0.1Rent Or Ownership In Real Estate 1.9 1.3 3.3 2.4 1.9Total Occupancy Expenses 2.8 2.1 4.5 3.5 3.0Other Operating ExpensesInsurance (Business Liability & Casualty) 0.3 0.3 0.6 0.3 0.3Depreciation & Amortization 0.6 0.4 0.7 0.8 1.6Bad Debt Losses 0.0 0.0 0.1 0.0 0.4Interest Expense 0.6 0.4 0.7 0.7 1.1All Other Operating Expenses 5.1 3.5 5.8 3.8 2.6Total Other Operating Expenses 6.6 4.6 7.9 5.6 6.0Total Operating Expenses 31.9 25.7 38.6 36.7 32.7Operating Profit 3.2 9.0 2.3 2.7 1.2Other Income 0.1 0.3 0.1 0.1 0.2Interest Expense 0.6 0.4 0.7 0.7 1.1Other Non-Operating Expenses 0.0 0.0 0.0 0.0 0.0Profit Before Taxes 3.3% 9.3% 2.4% 2.8% 1.4%
SAMPLE

.99999. 8 © 2007 Profit Planning Group, Inc.
Expenses In Relationship To Gross MarginGross margin represents the income available after paying for all product purchases. Many firms like toexamine expenses in relationship to gross margin. The feeling is that gross margin represents themoney available for expenses and profit, so the analysis provides a good basis for control.One word of caution is in order. Gross margins may vary by an appreciable amount in the industry.Consequently, an expense item that is a low percentage of gross margin may reflect excellent expensecontrol or it may reflect greater success in producing gross margin. The figures must always be viewedin that light.
High SalesTypical Profit Under $15 Package Your
Firm Firm Million Focus Firm
Expenses In Relationship To GMGross Margin 100.0% 100.0% 100.0% 100.0% 100.0%Payroll ExpensesOwner/Executive Salaries & Bonuses 11.1 7.8 12.5 14.2 N/ASales Salaries, Commissions & Bonuses 15.1 14.7 16.1 16.5 N/AAll Other Salaries, Wages & Bonuses 29.3 23.3 25.4 27.4 N/ATotal Salaries, Wages & Bonuses 55.6 45.8 54.0 58.1 55.3Payroll Taxes (FICA, Workers Comp. & Unemp.) 4.0 3.7 4.9 5.3 6.8Group Insurance (Medical, Hospitalization, etc.) 3.4 3.5 3.9 4.8 N/ABenefit Plans (Firnges, Pension, etc.) 1.1 1.7 1.2 1.8 N/ATotal Payroll Expenses 64.1 54.7 64.1 70.0 69.9Occupancy ExpensesUtilities (Heat, Light, Power, Water) 1.1 0.9 1.5 1.3 2.3Telephone 0.9 0.9 1.0 1.0 0.6Building Repairs & Maintenance 0.6 0.6 0.5 0.5 0.3Rent Or Ownership In Real Estate 5.4 3.7 8.1 6.1 5.5Total Occupancy Expenses 8.0 6.1 11.0 8.9 8.7Other Operating ExpensesInsurance (Business Liability & Casualty) 0.9 0.9 1.5 0.8 0.9Depreciation & Amortization 1.7 1.2 1.7 2.0 4.7Bad Debt Losses 0.0 0.0 0.2 0.0 1.1Interest Expense 1.7 1.2 1.7 1.8 3.3All Other Operating Expenses 14.5 10.1 14.2 9.6 7.7Total Other Operating Expenses 18.8 13.3 19.3 14.2 17.7Total Operating Expenses 90.9 74.1 94.4 93.1 96.4Operating Profit 9.1 25.9 5.6 6.9 3.6Other Income 0.3 0.9 0.3 0.2 0.5Interest Expense 1.7 1.2 1.7 1.8 3.3Other Non-Operating Expenses 0.0 0.0 0.0 0.0 0.0Profit Before Taxes 9.4% 26.8% 5.9% 7.1% 4.1%
SAMPLE

© 2007 Profit Planning Group, Inc. 9 .99999.
Balance SheetThe balance sheet reports where a company's money is invested and how that investment is financed.The balance sheet is a picture of financial position at a specific moment in time.
ASSETSAssets represent the total investment in the firm. Two very influential accounts to focus on for improvedasset productivity are accounts receivable and inventory. These two accounts are important becausethey are large and they are controllable.Accounts Receivable, or uncollected credit sales, are dollars currently unavailable to meet cashobligations. Offering credit terms to customers is essentially a tool to facilitate sales. The resultingaccounts receivable, however, should be viewed as loans to customers.Inventory represents the firm's investment in merchandise on hand. Excessive inventory is expensive.Inventory carrying costs may include interest, personal property taxes, markdowns, and shrinkage.However, inventory shortages may hinder sales productivity if out-of-stock items become lost sales.
LIABILITIES AND NET WORTHLiabilities and net worth are sources of capital that finance company assets. By definition a completebalance sheet requires that ASSETS = LIABILITIES + NET WORTH.Liabilities are essentially loans from non-owners including suppliers and financial institutions. Of allthe outside sources, accounts payable are the most important because these funds are interest-free.Net Worth is the owners' investment in the firm. It represents paid-in capital, loans from owners, andretained company earnings. Net worth is the only money financing the business which carries nostated return. In fact, return on owners' investment carries 100% risk; it is totally dependent on thefinancial performance of the firm. Therefore, the rate of return on net worth or owners' equity should bea rate that justifies the risk being taken in the business.
High SalesTypical Profit Under $15 Package Your
Firm Firm Million Focus Firm
AssetsCash & Marketable Securities 5.6% 8.5% 7.9% 4.5% 0.0%Accounts Receivable 26.8 30.8 23.0 22.6 30.0Inventory 51.7 50.2 51.6 50.0 59.0Other Current Assets 1.7 1.2 1.7 1.7 1.7Total Current Assets 85.8 90.7 84.2 78.8 90.6Fixed & Non-current Assets 14.2 9.3 15.8 21.2 9.4Total Assets 100.0% 100.0% 100.0% 100.0% 100.0%
Liabilities And Net WorthAccounts Payable 18.0% 19.4% 15.9% 14.6% 21.1%Notes Payable 17.5 15.8 11.0 14.6 6.0Other Current Liabilities 6.2 7.0 5.8 6.0 5.0Total Current Liabilities 41.7 42.2 32.7 35.2 32.2Long Term Liabilities 5.7 2.2 11.7 12.2 31.5Net Worth Or Owner Equity 52.6 55.6 55.6 52.6 36.3Total Liabilities & Net Worth 100.0% 100.0% 100.0% 100.0% 100.0%
SAMPLE

.99999. 10 © 2007 Profit Planning Group, Inc.
Financial RatiosSuppliers, bankers and outside creditors have a wide range of financial ratios at their disposal toassess lending risks. The ratios on this page are often used to determine asset financing needs.
Current Ratio = Current Assets ÷ Current LiabilitiesCurrent assets produce the cash to pay current liabilities. Therefore, the greater the safety margin ofcurrent assets you have with respect to current liabilities, the greater your ability to pay these liabilities.The traditional comfort level for the current ratio is about 2.0. At this level, a company has $2.00 ofassets that can be turned into cash for every $1.00 of current liabilities.
Quick Ratio = (Cash + Accounts Receivable) ÷ Current LiabilitiesThe quick ratio measures a company's ability to pay its current liabilities from its most liquid assets,assets that can be quickly converted to cash to pay bills. Inventory is the least liquid current asset andis excluded from this calculation. A quick ratio of at least 1.0 reflects traditional thinking regardingliquidity.
Accounts Payable To Inventory = Accounts Payable ÷ Inventory x 100This ratio measures the amount of inventory that is financed by the suppliers of that inventory. Thehigher the ratio, the more the company is capitalizing on interest-free financing.
Accounts Payable Payout Period = Accounts Payable ÷ (Cost Of Goods Sold ÷ 365 Days)This ratio measures the timeliness of paying suppliers. The challenge is to pay promptly enough totake full advantage of cash discounts and maintain a sound credit rating, yet negotiate the best termspossible to make effective use of this interest-free source of capital.
Debt To Equity = Total Liabilities ÷ Net WorthThe greater the proportion of its financing that is obtained from owners, the less worry the company hasin meeting its fixed obligations. At the same time excessive reliance on owner financing slows the rateat which the firm can grow. The debt to equity ratio shows the balance that management has struckbetween debt and owners' equity. A mix of $1.00 debt to $1.00 equity is usually considered prudent.
EBIT To Total Assets = Earnings Before Interest And Taxes ÷ Total Assets x 100EBIT to Total Assets provides a profitability analysis based on operating earnings, before interest andincome taxes. This ratio is best compared with a company's annual rate on borrowed funds. If a firm'sEBIT to Total Assets ratio is higher than its cost of capital, it can afford to use debt to financeexpansion.
Times Interest Earned = (Profit Before Taxes + Interest) ÷ InterestThis ratio measures the number of times earnings before interest and taxes will cover interestpayments on debt. It also shows the level to which income can decline before a firm is unable to meetits interest obligations.
High SalesTypical Profit Under $15 Package Your
Firm Firm Million Focus Firm
Finanial RatiosCurrent Ratio 2.1 2.1 2.6 2.2 2.8Quick Ratio 0.8 0.9 0.9 0.8 0.9Accounts Payable To Inventory 33.4% 33.9% 32.0% 26.0% 36.1%Accounts Payable Payout Period (Days) 37.2 32.5 29.2 33.1 41.5Debt To Equity 0.9 0.8 0.8 0.9 1.8EBIT To Total Assets 10.9% 29.1% 7.4% 9.1% 7.0%Times Interest Earned 6.5 24.3 4.4 5.0 2.3
SAMPLE

© 2007 Profit Planning Group, Inc. 11 .99999.
Asset Productivity RatiosAsset productivity ratios measure the effectiveness of the firm in managing inventory and accountsreceivable. The ratios reveal the amount of sales and gross margin that the assets generate and howlong assets are being held and are unavailable to meet cash obligations.
Average Collection Period = Accounts Receivable ÷ (Credit Sales ÷ 365 Days)This ratio measures the average number of days it takes to collect cash from credit sales (accountsreceivable). Generally the collection period should not exceed one and one-third times your regularcredit terms. That is, if your terms are Net 30, the collection period should not exceed 40 days.
Inventory Turnover = Cost Of Goods Sold ÷ Average InventoryInventory is one of the most controllable asset investments. Inventory turnover is an indication of thevelocity with which inventory investment moves through the business.
Inventory Holding Period = 365 Days ÷ Inventory TurnoverThe inventory holding period reflects how many days of inventory are on hand. Managers and ownersmust be concerned with a holding period that is longer than necessary due to the high costs of capitaltied up in excess inventory. On the other hand, reducing inventory levels too much could result in lostsales if certain products are not available when the customer wants them.
Sales To Inventory Ratio = Sales ÷ Average Inventory At CostThe sales to inventory ratio is another method for measuring inventory performance. It measures thedollars of sales volume that are generated from each dollar the firm has invested in inventory.
Gross Margin Return On Inventory = Gross Margin ÷ Average Inventory x 100GMROI measures the dollars of gross margin that are being produced by each dollar invested ininventory. The ratio may also be calculated by multiplying the gross margin percentage times the salesto inventory ratio. Combining these two measures in GMROI enables the firm to consciously considerthe trade-off between gross margin and inventory utilization.
High SalesTypical Profit Under $15 Package Your
Firm Firm Million Focus Firm
CollectionsCash Sales (% Of Sales) 2.0% 1.0% 2.0% 3.5% 2.0%Average Collection Period (Days) 40.8 42.3 39.8 36.2 39.8Bad Debt Losses (% Of Sales) 0.0% 0.0% 0.1% 0.0% 0.4%
InventoryInventory Turnover (Times) 3.4 3.7 3.2 3.3 3.2Inventory Holding Period (Days) 107.4 98.6 114.1 110.6 115.0Sales To Inventory Ratio (Times) 5.0 6.2 4.9 5.0 4.8Gross Margin Return On Inventory 207.7% 240.5% 208.3% 193.5% 162.8%
SAMPLE

.99999. 12 © 2007 Profit Planning Group, Inc.
Operating Productivity RatiosThe absolute level of sales is important in influencing economies of scale and the ability of the firm tobuy successfully. However, sales volume does not provide a particularly good measure of marketingproductivity. This is best done with the various ratios and customer productivity.
Sales Per SKU = Net Sales ÷ Number Of Stockkeeping UnitsA stockkeeping unit (SKU) is a single item defined as narrowly as possible, considering issues such assize, color, manufacturer, style and the like. Two items purchased from the same supplier that are thesame size, but different colors, are two distinct SKUs. The ability to produce a high level of sales perSKU suggests that the firm has simplified its operations for maximum productivity.
Inventory Per SKU = Inventory ÷ Number Of SKUsThe critical role of inventory is to provide the maximum level of customer service. This is usuallyachieved by having a high level of inventory behind each item sold.
Sales Per Order = Net Sales ÷ Number Of Orders ShippedProcessing, filling and delivering a customer order involves a large amount of expense that is the sameregardless of invoice size. The higher the sales per order, the more able the firm is to cover these fixedexpenses with additional gross margin dollars generated on the sale.
Sales Per Order Line = Net Sales ÷ Average Number Of Order LinesProcessing orders also involves a relatively fixed cost per order line. Increasing the average line valuealso allows the firm to cover fixed costs more profitably.
High SalesTypical Profit Under $15 Package Your
Firm Firm Million Focus Firm
VendorsNumber Of Vendors Represented 425 528 200 375 15Sales Per Vendor $32,183 $35,012 $23,548 $23,548 $380,949
Stockkeeping Units (SKUs)
Number Of SKUs 12,392 11,836 12,392 15,196 9,000Sales Per SKU $817 $1,300 $496 $697 $635Inventory Per SKU $174 $220 $101 $145 $132
OrdersNumber Of Orders Per Month 1,240 2,393 544 1,916 250Sales Per Order $789 $870 $897 $372 $1,905Average Lines Per Order 4.0 3.5 4.1 5.6 7.0Sales Per Order Line $145 $173 $154 $75 $272
Sales By Method Of DeliveryCompany Truck 16.5% 15.0% 15.0% 40.0% 15.0%Common Carrier 79.0 79.0 80.0 56.4 85.0Drop Ship From Supplier 1.0 2.0 1.0 1.0 0.0Customer Pick-Up 3.5 4.0 4.0 2.6 0.0Total Sales 100.0% 100.0% 100.0% 100.0% 100.0%
SAMPLE

© 2007 Profit Planning Group, Inc. 13 .99999.
Employee Productivity RatiosEmployees are the lifeblood of any organization. Without a properly motivated and compensated workforce, few firms can produce much more than basic levels of performance. However, as mentionedearlier, employee payroll costs make up the single largest expense category on the income statement.In controlling employee payroll, the key to success is not the absolute level of compensation, but rathercompensation in relationship to the productivity of employees.
Sales Per Employee = Net Sales ÷ Total Full-Time Equivalent EmployeesThe sales dollars generated per employee are a crucial factor when analyzing ways to improveprofitability. Technology utilization, innovative management systems, incentive compensation plans,and the elimination of redundant or inefficient functions most dramatically influence employeeproductivity.
Personnel Productivity Ratio = Payroll Expense ÷ Gross Margin x 100The personnel productivity ratio is the percent of gross profit dollars that are spent on employees.Clearly, the lower the ratio of payroll to gross profit, the greater the firm's profitability is likely to be.Caution needs to be exercised in evaluating this ratio as it is influenced very dramatically by the grossmargin percentage.
High SalesTypical Profit Under $15 Package Your
Firm Firm Million Focus Firm
Employees (FTE)
Total Number Of Employees 38.0 52.0 19.5 31.5 30.0Packaging Employees 4.5 6.5 2.5 5.0 5.0
Employee ProductivitySales Per Employee $272,153 $299,246 $235,065 $198,874 $190,474Gross Margin Per Employee $96,816 $124,219 $90,071 $79,105 $64,578Salary Per Employee $50,483 $58,722 $44,932 $42,597 $35,685Payroll Per Employee (Including Benefits) $61,759 $70,263 $55,912 $50,746 $45,133Payroll Expense (% Of Sales) 22.5% 19.0% 26.2% 27.6% 23.7%Personnel Productivity Ratio 64.1% 54.7% 64.1% 70.0% 69.9%SAMPLE
.99999. 14 © 2007 Profit Planning Group, Inc.
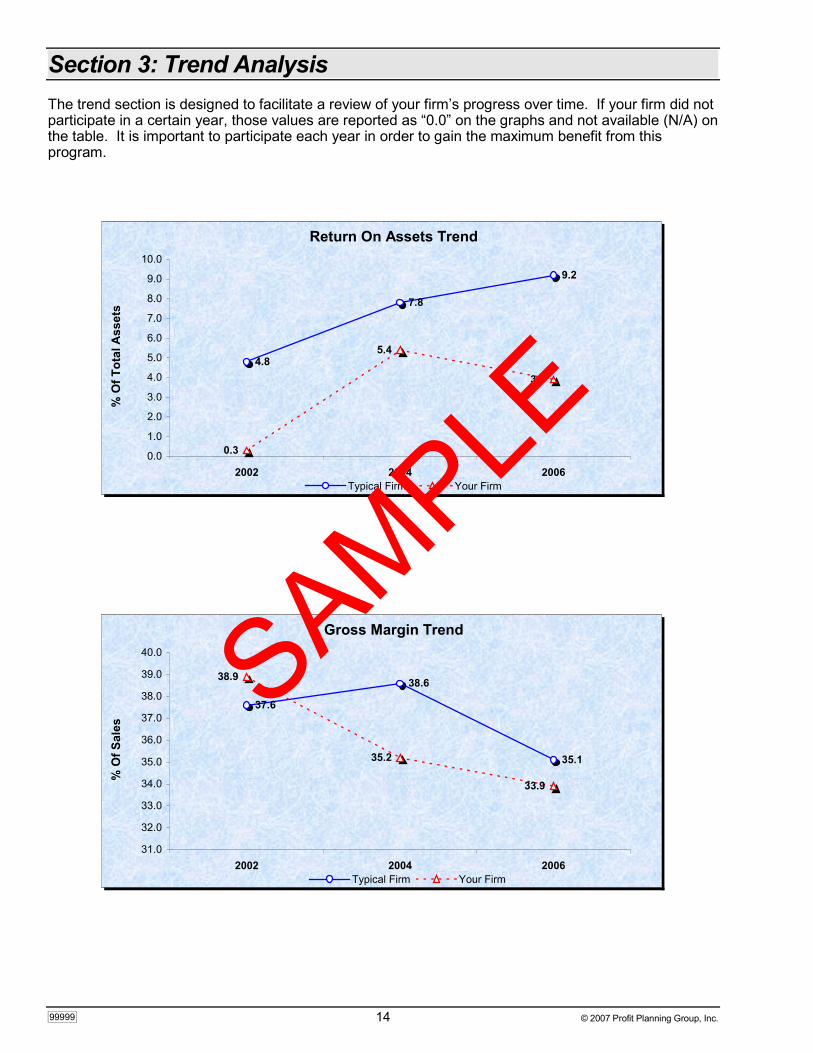
Section 3: Trend AnalysisThe trend section is designed to facilitate a review of your firm’s progress over time. If your firm did notparticipate in a certain year, those values are reported as “0.0” on the graphs and not available (N/A) onthe table. It is important to participate each year in order to gain the maximum benefit from thisprogram.
Return On Assets Trend
4.8
7.8
9.2
3.9
5.4
0.30.0
1.0
2.0
3.0
4.0
5.0
6.0
7.0
8.0
9.0
10.0
2002 2004 2006
% O
f Tot
al A
sset
s
Typical Firm Your Firm
Gross Margin Trend
38.6
35.1
33.9
37.6
38.9
35.2
31.0
32.0
33.0
34.0
35.0
36.0
37.0
38.0
39.0
40.0
2002 2004 2006
% O
f Sal
es
Typical Firm Your Firm
SAMPLE

© 2007 Profit Planning Group, Inc. 15 .99999.
Operating Expense Trend
35.331.932.7
35.438.8
32.7
0.0
5.0
10.0
15.0
20.0
25.0
30.0
35.0
40.0
45.0
2002 2004 2006
% O
f Sal
es
Typical Firm Your Firm
Inventory Turnover Trend
3.23.4
3.23.1
2.4
2.8
0.0
0.5
1.0
1.5
2.0
2.5
3.0
3.5
4.0
2002 2004 2006
Tim
es
Typical Firm Your Firm
Average Collection Period Trend
45.040.839.8
46.6
65.362.2
0.0
10.0
20.0
30.0
40.0
50.0
60.0
70.0
2002 2004 2006
Day
s
Typical Firm Your Firm
SAMPLE

.99999. 16 © 2007 Profit Planning Group, Inc.
Trend AnalysisYour Firm 2002 Your Firm 2004 Your Firm 2006
Dollars % Dollars % Dollars %
Strategic Profit Model Ratios
Profit Margin (Pre-tax) 0.1 2.5 1.4Asset Turnover 2.0 2.2 2.8Return On Assets (Pre-tax) 0.3 5.4 3.9Financial Leverage 3.0 3.0 2.8Return On Net Worth (Pre-tax) 0.8 16.3 10.7
Income Statement
Net Sales 4,099,893 100.0 5,391,801 100.0 5,714,231 100.0Cost Of Goods Sold 2,504,581 61.1 3,495,596 64.8 3,776,878 66.1Gross Margin 1,595,312 38.9 1,896,205 35.2 1,937,353 33.9Operating ExpensesPayroll Expenses 1,147,666 28.0 1,314,825 24.4 1,353,988 23.7Occupancy Expenses 192,654 4.7 194,687 3.6 169,368 3.0Other Operating Expenses 249,360 6.1 255,130 4.7 343,633 6.0Total Operating Expenses 1,589,680 38.8 1,764,642 32.7 1,866,989 32.7Operating Profit 5,632 0.1 131,563 2.4 70,364 1.2Other Income/Expenses 0 0.0 2,036 0.0 8,947 0.2Profit Before Taxes 5,632 0.1 133,599 2.5 79,311 1.4
Balance Sheet
AssetsCash & Marketable Securities 0 0.0 125,795 5.0 0 0.0Accounts Receivable 733,639 35.7 918,788 36.9 610,773 30.0Inventory 1,041,569 50.7 1,367,735 54.9 1,201,651 59.0Other Current Assets 7,969 0.4 4,356 0.2 34,345 1.7Total Current Assets 1,783,177 86.9 2,416,674 97.0 1,846,769 90.6Fixed & Noncurrent Assets 269,664 13.1 75,325 3.0 191,624 9.4Total Assets 2,052,841 100.0 2,491,999 100.0 2,038,393 100.0Liabilities & Net WorthAccounts Payable 382,060 18.6 542,965 21.8 429,771 21.1Notes Payable 722,405 35.2 870,148 34.9 123,102 6.0Other Current Liabilities 229,102 11.2 85,230 3.4 102,488 5.0Total Current Liabilities 1,333,567 65.0 1,498,343 60.1 655,361 32.2Long Term Liabilities 36,766 1.8 174,885 7.0 642,825 31.5Net Worth Or Owner Equity 682,508 33.2 818,771 32.9 740,207 36.3Total Liabilities & Net Worth 2,052,841 100.0 2,491,999 100.0 2,038,393 100.0
Key Ratios
Current Ratio 1.3 1.6 2.8Quick Ratio 0.6 0.7 0.9Accounts Payable To Inventory 36.7 44.0 36.1Accounts Payable Payout Period (Days) 55.7 56.7 41.5Debt To Equity 2.0 2.0 1.8EBIT To Total Assets 3.4 7.3 7.0Times Interest Earned 1.1 3.8 2.3Average Collection Period (Days) 65.3 62.2 39.8Inventory Turnover (Times) 2.4 2.8 3.2Inventory Holding Period (Days) 151.8 131.4 115.0Sales To Inventory Ratio (Times) 3.9 4.3 4.8GMROI 153.2 150.7 162.8Sales Per Employee 128,122 158,582 190,474Gross Margin Per Employee 49,854 55,771 64,578Personnel Productivity Ratio 71.9 69.3 69.9
SAMPLE
© 2007 Profit Planning Group, Inc. 17 .99999.
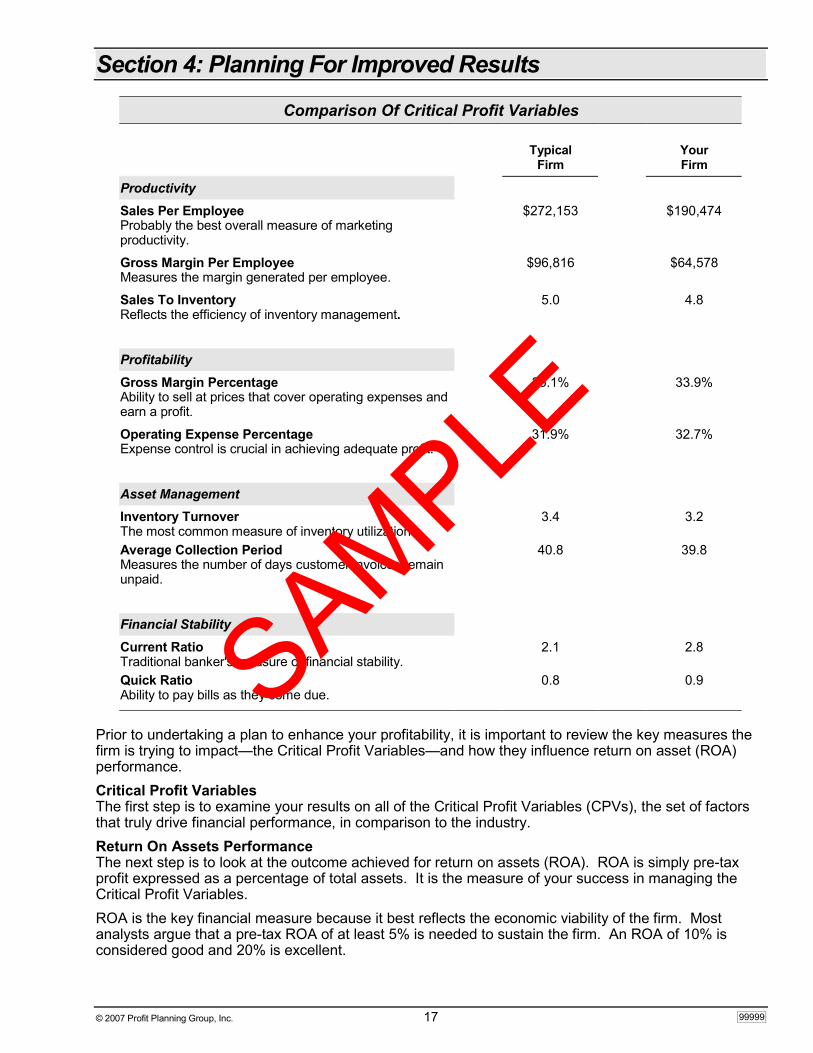
Section 4: Planning For Improved Results
Comparison Of Critical Profit Variables
Typical YourFirm Firm
ProductivitySales Per EmployeeProbably the best overall measure of marketingproductivity.
$272,153 $190,474
Gross Margin Per EmployeeMeasures the margin generated per employee.
$96,816 $64,578
Sales To InventoryReflects the efficiency of inventory management.
5.0 4.8
ProfitabilityGross Margin PercentageAbility to sell at prices that cover operating expenses andearn a profit.
35.1% 33.9%
Operating Expense PercentageExpense control is crucial in achieving adequate profit.
31.9% 32.7%
Asset ManagementInventory TurnoverThe most common measure of inventory utilization.
3.4 3.2
Average Collection PeriodMeasures the number of days customer invoices remainunpaid.
40.8 39.8
Financial StabilityCurrent RatioTraditional banker's measure of financial stability.
2.1 2.8
Quick RatioAbility to pay bills as they come due.
0.8 0.9
Prior to undertaking a plan to enhance your profitability, it is important to review the key measures thefirm is trying to impact—the Critical Profit Variables—and how they influence return on asset (ROA)performance.Critical Profit VariablesThe first step is to examine your results on all of the Critical Profit Variables (CPVs), the set of factorsthat truly drive financial performance, in comparison to the industry.Return On Assets PerformanceThe next step is to look at the outcome achieved for return on assets (ROA). ROA is simply pre-taxprofit expressed as a percentage of total assets. It is the measure of your success in managing theCritical Profit Variables.ROA is the key financial measure because it best reflects the economic viability of the firm. Mostanalysts argue that a pre-tax ROA of at least 5% is needed to sustain the firm. An ROA of 10% isconsidered good and 20% is excellent.
SAMPLE

.99999. 18 © 2007 Profit Planning Group, Inc.
Improving Profitability By Managing The CPVsOf all the factors impacting the financial performance of any Sample Association firm, these areparticularly important:
• The level of sales volume generated• The gross margin associated with those sales• The level of expenses required to produce the sales• The inventory investment required to support the sales
The following pages examine how improving each CPV by 3.0% impacts the profitability of your firm.This exercise will clearly demonstrate how sensitive profit is to small changes in these measures.Specifically, the following scenarios are examined:
• Sales are increased to $5,885,658 without incurring an increase in fixed expenses• Gross margin percentage is increased to 34.9% with the same level of sales volume• Fixed expenses are decreased to $1,448,783 without negatively impacting the sales volume
generated• Inventory turnover is increased to 3.3 by lowering inventory• A complete plan in which all of these CPVs are changed at the same time
These scenarios are discussed in detail on the following pages. For each, abbreviated financialstatements are presented. In reviewing them, please note how dramatically profit and return oninvestment are impacted by relatively modest changes in each of these critical profit variables.
Following the improvement examples, recommendations developed specifically for your firm can befound on the Action Program page. The goal is to become one of the most profitable firms in theindustry over time. All of the suggested improvements can be achieved by moving towards orexceeding industry norms.
SAMPLE

© 2007 Profit Planning Group, Inc. 19 .99999.
Increase Sales
2006 Reported And Potential ResultsReported Potential
Dollars % Dollars %INCOME STATEMENTNet Sales 5,714,231 100.0 5,885,658 100.0Direct Cost Of Sales 3,776,878 66.1 3,890,184 66.1Gross Margin 1,937,353 33.9 1,995,474 33.9Fixed Expenses 1,493,591 26.1 1,493,591 25.4Variable Expenses 373,398 6.5 384,600 6.5Total Operating Expenses 1,866,989 32.7 1,878,191 31.9Operating Profit 70,364 1.2 117,283 2.0Other Income/Expenses 8,947 0.2 8,947 0.2Interest Impact N/A N/A -2,719 0.0Profit Before Taxes 79,311 1.4 123,511 2.1ASSETSCash 0 0.0 0 0.0Trade Accounts Receivable 610,773 30.0 629,096 30.1Inventory 1,201,651 59.0 1,237,701 59.1All Other Assets 225,969 11.1 225,969 10.8Total Assets 2,038,393 100.0 2,092,766 100.0Inventory Turnover (Times) 3.2 3.2Average Collection Period (Days) 39.8 39.8Return On Assets 3.9 5.9
This exhibit demonstrates the impact of a 3.0% sales increase achieved without increasing expensesor lowering the gross margin percentage.As sales rise, some additional inventory is necessary. This, in turn, will require an increase in interestexpense to finance the additional inventory. Most other factors remain constant and both profit andreturn on assets increase sharply.When sales change there is always the possibility that expenses might also change. The question ishow much expenses will change and why? To examine this issue you need to understand thedistinction between fixed expenses and variable expenses.Fixed Expenses: These expenses, often referred to as overhead expenses, represent the fixedcommitments required to operate the business for the year. They are considered fixed because theydo not change when sales change by a modest amount. These expenses include items such as rent,utilities and depreciation. They also include most of the payroll expense.Variable Expenses: These are operating expenses that rise and fall as sales rise and fall. The classicvariable expense is commissions. Other variable expenses may include bad debts, advertising, andemployee overtime.The key is to increase sales while holding fixed expenses constant. Fundamentally, there are threeways in which sales can be enhanced versus fixed expenses:• Raise the average transaction size
This involves trading the customer up to higher quality products, doing add-on selling or raisingprices.
• Increase the service levelThis involves being in-stock a greater percentage of the time, thereby generating more sales fromthe same customer base.
• Find more prospects with the current budgetThis involves more effective promotional expenditures and providing a higher level of customersatisfaction to maximize repeat purchasing.
SAMPLE

.99999. 20 © 2007 Profit Planning Group, Inc.
Increase Gross Margin Percentage
2006 Reported And Potential ResultsReported Potential
Dollars % Dollars %INCOME STATEMENTNet Sales 5,714,231 100.0 5,714,231 100.0Direct Cost Of Sales 3,776,878 66.1 3,718,757 65.1Gross Margin 1,937,353 33.9 1,995,474 34.9Fixed Expenses 1,493,591 26.1 1,493,591 26.1Variable Expenses 373,398 6.5 373,398 6.5Total Operating Expenses 1,866,989 32.7 1,866,989 32.7Operating Profit 70,364 1.2 128,485 2.2Other Income/Expenses 8,947 0.2 8,947 0.2Interest Impact N/A N/A 925 0.0Profit Before Taxes 79,311 1.4 138,356 2.4ASSETSCash 0 0.0 0 0.0Trade Accounts Receivable 610,773 30.0 610,773 30.2Inventory 1,201,651 59.0 1,183,159 58.6All Other Assets 225,969 11.1 225,969 11.2Total Assets 2,038,393 100.0 2,019,901 100.0Inventory Turnover (Times) 3.2 3.2Average Collection Period (Days) 39.8 39.8Return On Assets 3.9 6.8
This exhibit demonstrates the impact of a 3.0% increase in gross margin percentage while net salesremains unchanged. Gross margin percentage is simply the gross margin dollars produced during theyear expressed as a percentage of sales.Gross margin measures the ability of the firm to sell products at prices that generate profit. It istypically the strongest single factor in influencing profitability. Every firm must be extremely aware ofeven small changes in gross margin.The old adage is still true – buy low, sell high. However, in improving gross margin performance theissue is somewhat more complex:
• Buy effectivelyA lower cost of goods is almost always obtained by buying a larger quantity. However,overbuying creates a number of other problems. The challenge is to buy effectively.
• Control internal operationsThis involves a number of issues such as mark-downs, obsolete goods, inventory shrinkage,and accounting errors.
• Sell at appropriate pricesIn a competitive environment, some items are extremely price sensitive and must be priced tomaximize sales and strengthen the company’s competitive position. Other items are much lessprice competitive and represent major margin enhancement opportunities. Proper pricing of allitems is essential.
SAMPLE

© 2007 Profit Planning Group, Inc. 21 .99999.
Reduce Operating Expenses
2006 Reported And Potential ResultsReported Potential
Dollars % Dollars %INCOME STATEMENTNet Sales 5,714,231 100.0 5,714,231 100.0Direct Cost Of Sales 3,776,878 66.1 3,776,878 66.1Gross Margin 1,937,353 33.9 1,937,353 33.9Fixed Expenses 1,493,591 26.1 1,448,783 25.4Variable Expenses 373,398 6.5 373,398 6.5Total Operating Expenses 1,866,989 32.7 1,822,181 31.9Operating Profit 70,364 1.2 115,172 2.0Other Income/Expenses 8,947 0.2 8,947 0.2Interest Impact N/A N/A 0 0.0Profit Before Taxes 79,311 1.4 124,119 2.2ASSETSCash 0 0.0 0 0.0Trade Accounts Receivable 610,773 30.0 610,773 30.0Inventory 1,201,651 59.0 1,201,651 59.0All Other Assets 225,969 11.1 225,969 11.1Total Assets 2,038,393 100.0 2,038,393 100.0Inventory Turnover (Times) 3.2 3.2Average Collection Period (Days) 39.8 39.8Return On Assets 3.9 6.1
Cutting costs is the most fundamental means of increasing profits. Indeed, every dollar savedproduces a full dollar of profits. But, caution is in order to insure that all cost reductions are only forunnecessary expenditures. Any reduction in expenses that also diminishes sales ultimately will have anegative impact on profits.In this exhibit, expenses are still presented as either fixed or variable as defined previously:
• Fixed ExpensesThis category, often referred to as overhead expenses, represents the fixed commitmentsrequired to operate the business for the year. In the following exhibit these have been reducedby 3.0%.
• Variable ExpensesThese operating expenses include factors such as commissions, bad debts and other handlingexpenses associated with increased sales dollars. These expenses increase or decreasealmost automatically as sales volume increases or decreases.
SAMPLE

.99999. 22 © 2007 Profit Planning Group, Inc.
Increase Inventory Turnover
2006 Reported And Potential ResultsReported Potential
Dollars % Dollars %INCOME STATEMENTNet Sales 5,714,231 100.0 5,714,231 100.0Direct Cost Of Sales 3,776,878 66.1 3,776,878 66.1Gross Margin 1,937,353 33.9 1,937,353 33.9Fixed Expenses 1,493,591 26.1 1,493,591 26.1Variable Expenses 373,398 6.5 373,398 6.5Total Operating Expenses 1,866,989 32.7 1,866,989 32.7Operating Profit 70,364 1.2 70,364 1.2Other Income/Expenses 8,947 0.2 8,947 0.2Interest Impact N/A N/A 1,802 0.0Profit Before Taxes 79,311 1.4 81,113 1.4ASSETSCash 0 0.0 0 0.0Trade Accounts Receivable 610,773 30.0 610,773 30.5Inventory 1,201,651 59.0 1,165,601 58.2All Other Assets 225,969 11.1 225,969 11.3Total Assets 2,038,393 100.0 2,002,343 100.0Inventory Turnover (Times) 3.2 3.3Average Collection Period (Days) 39.8 39.8Return On Assets 3.9 4.1
Inventory control impacts not only asset productivity, but also sales productivity and financial stability.Excessive inventory is expensive as carrying costs include such items as interest, personal propertytaxes and insurance. Further, financing excess inventory may result in overloaded debt, therebyupsetting financial stability. On the other hand, inventory shortages put a drag on sales productivity;having popular items out-of-stock represent lost sales. In short, the cost of carrying inventory has to bebalanced against the profit opportunities lost by not having product in stock, ready for sale.To ensure proper inventory performance, management needs to adhere to the following program:• Buy in proper quantities• Work with fewer suppliers on a more meaningful basis• Monitor performance of each item closely• Clear dead items out of the assortment• Insure adequate shrinkage control proceduresThis exhibit demonstrates the impact of a 3.0% improvement in inventory turnover. It does so byreducing inventory, that is, holding sales constant while reducing inventory to save on carrying costs.
SAMPLE

© 2007 Profit Planning Group, Inc. 23 .99999.
A Complete CPV Plan
2006 Reported And Potential ResultsReported Potential
Dollars % Dollars %INCOME STATEMENTNet Sales 5,714,231 100.0 5,885,658 100.0Direct Cost Of Sales 3,776,878 66.1 3,830,320 65.1Gross Margin 1,937,353 33.9 2,055,338 34.9Fixed Expenses 1,493,591 26.1 1,448,783 24.6Variable Expenses 373,398 6.5 384,600 6.5Total Operating Expenses 1,866,989 32.7 1,833,383 31.2Operating Profit 70,364 1.2 221,955 3.8Other Income/Expenses 8,947 0.2 8,947 0.2Interest Impact N/A N/A 1,005 0.0Profit Before Taxes 79,311 1.4 231,907 3.9ASSETSCash 0 0.0 0 0.0Trade Accounts Receivable 610,773 30.0 610,223 30.2Inventory 1,201,651 59.0 1,182,095 58.6All Other Assets 225,969 11.1 225,969 11.2Total Assets 2,038,393 100.0 2,018,287 100.0Inventory Turnover (Times) 3.2 3.3Average Collection Period (Days) 39.8 38.6
Return On Assets 3.9 11.5
This exhibit examines the impact of making a 3.0% improvement in all CPVs simultaneously:
• Sales increases to $5,885,658• Gross Margin Percentage increases to 34.9%• Fixed Expenses decrease to $1,448,783• Inventory Turnover increases to 3.3 timesSAMPLE
.99999. 24 © 2007 Profit Planning Group, Inc.
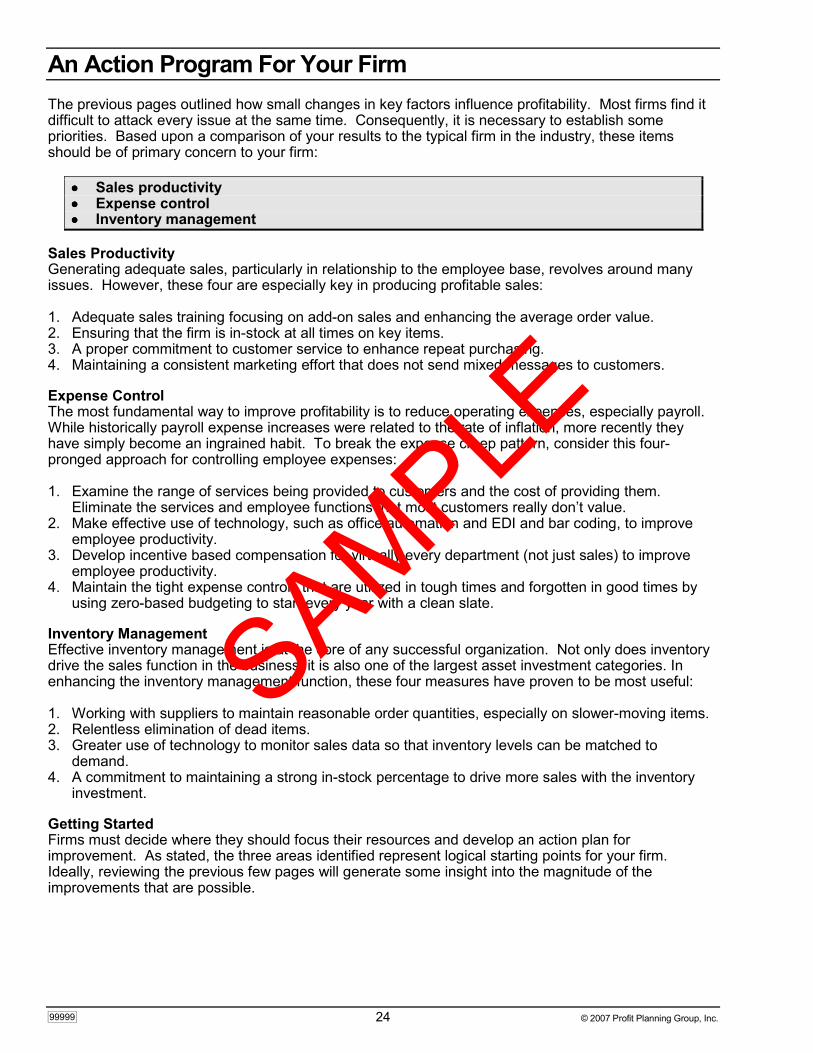
An Action Program For Your FirmThe previous pages outlined how small changes in key factors influence profitability. Most firms find itdifficult to attack every issue at the same time. Consequently, it is necessary to establish somepriorities. Based upon a comparison of your results to the typical firm in the industry, these itemsshould be of primary concern to your firm:
•••• Sales productivity•••• Expense control•••• Inventory management
Sales ProductivityGenerating adequate sales, particularly in relationship to the employee base, revolves around manyissues. However, these four are especially key in producing profitable sales:
1. Adequate sales training focusing on add-on sales and enhancing the average order value.2. Ensuring that the firm is in-stock at all times on key items.3. A proper commitment to customer service to enhance repeat purchasing.4. Maintaining a consistent marketing effort that does not send mixed messages to customers.
Expense ControlThe most fundamental way to improve profitability is to reduce operating expenses, especially payroll.While historically payroll expense increases were related to the rate of inflation, more recently theyhave simply become an ingrained habit. To break the expense creep pattern, consider this four-pronged approach for controlling employee expenses:
1. Examine the range of services being provided to customers and the cost of providing them.Eliminate the services and employee functions that most customers really don’t value.
2. Make effective use of technology, such as office automation and EDI and bar coding, to improveemployee productivity.
3. Develop incentive based compensation for virtually every department (not just sales) to improveemployee productivity.
4. Maintain the tight expense controls that are utilized in tough times and forgotten in good times byusing zero-based budgeting to start every year with a clean slate.
Inventory ManagementEffective inventory management is at the core of any successful organization. Not only does inventorydrive the sales function in the business, it is also one of the largest asset investment categories. Inenhancing the inventory management function, these four measures have proven to be most useful:
1. Working with suppliers to maintain reasonable order quantities, especially on slower-moving items.2. Relentless elimination of dead items.3. Greater use of technology to monitor sales data so that inventory levels can be matched to
demand.4. A commitment to maintaining a strong in-stock percentage to drive more sales with the inventory
investment.
Getting StartedFirms must decide where they should focus their resources and develop an action plan forimprovement. As stated, the three areas identified represent logical starting points for your firm.Ideally, reviewing the previous few pages will generate some insight into the magnitude of theimprovements that are possible.
SAMPLE
© 2007 Profit Planning Group, Inc. 25 .99999.
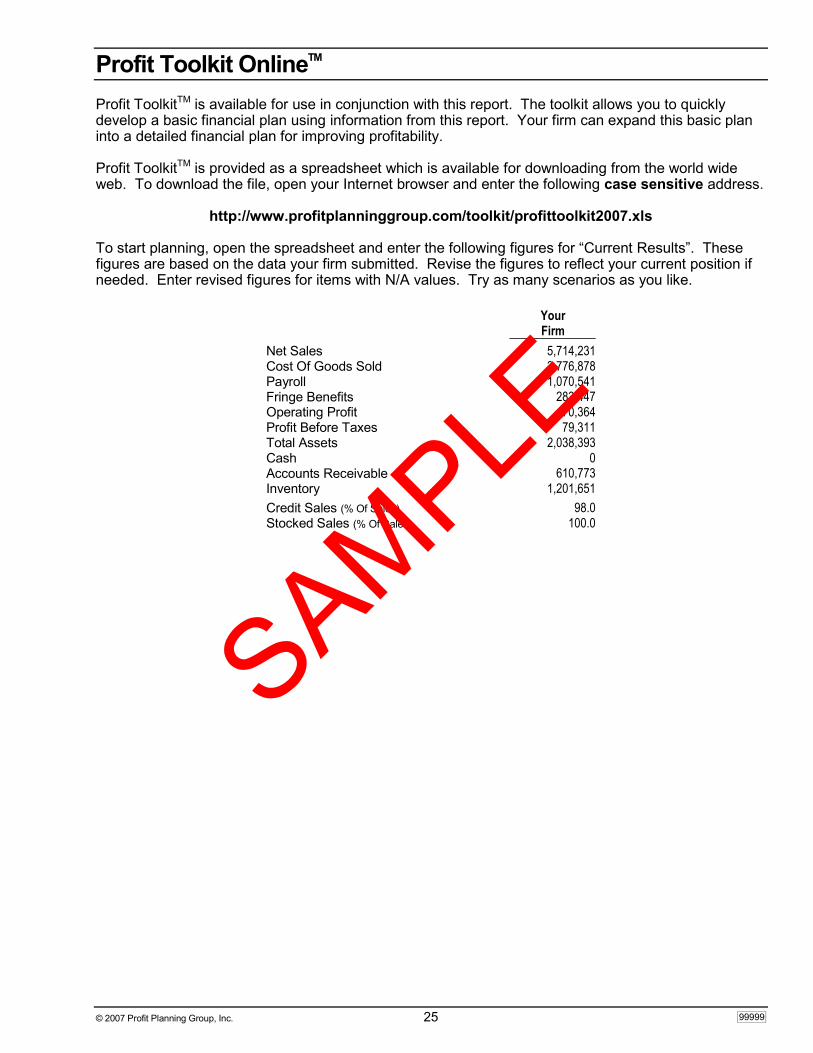
Profit Toolkit OnlineTM
Profit ToolkitTM is available for use in conjunction with this report. The toolkit allows you to quicklydevelop a basic financial plan using information from this report. Your firm can expand this basic planinto a detailed financial plan for improving profitability.
Profit ToolkitTM is provided as a spreadsheet which is available for downloading from the world wideweb. To download the file, open your Internet browser and enter the following case sensitive address.
http://www.profitplanninggroup.com/toolkit/profittoolkit2007.xls
To start planning, open the spreadsheet and enter the following figures for “Current Results”. Thesefigures are based on the data your firm submitted. Revise the figures to reflect your current position ifneeded. Enter revised figures for items with N/A values. Try as many scenarios as you like.
YourFirm
Net Sales 5,714,231Cost Of Goods Sold 3,776,878Payroll 1,070,541Fringe Benefits 283,447Operating Profit 70,364Profit Before Taxes 79,311Total Assets 2,038,393Cash 0Accounts Receivable 610,773Inventory 1,201,651Credit Sales (% Of Sales) 98.0Stocked Sales (% Of Sales) 100.0
SAMPLE


