47
Performance and Asset Management Advisory Council ANNUAL REPORT December 2018

Performance and Asset Management Advisory Council
ANNUAL REPORT
December 2018

Report of the Performance and Asset Management Advisory Council: Progress by MassDOT Highway Division on Integrated Asset Management
i
TABLE OF CONTENTS
1. 0 Introduction ............................................................................................................................................... 1
1.1 Legislation: A Mandate for Progress ............................................................................................................................. 1
1.2 Context for this Report .................................................................................................................................................. 2
1.3 Structure of This Report ................................................................................................................................................ 2
1.4 What’s New ................................................................................................................................................................... 2
2. 0 Highway Division ...................................................................................................................................... 4
2.1 Submission of the Initial Transportation Asset Management Plan to FHWA ................................................................ 4
2.2 Investment in the Highway Division .............................................................................................................................. 4
2.3 Highway Division Assets ............................................................................................................................................... 5
2.4 Asset Performance and Forecasts for the Highway Division ........................................................................................ 6
2.5 Highway Division Progress in 2018 and Next Steps ................................................................................................... 10
3. 0 MBTA ........................................................................................................................................................ 13
3.1 MBTA Assets .............................................................................................................................................................. 13
3.2 Investment in the MBTA .............................................................................................................................................. 16
3.3 Performance and Forecasts at the MBTA ................................................................................................................... 16
3.4 MBTA Progress in 2018 and Next Steps .................................................................................................................... 20
4. 0 Rail and Transit Division ........................................................................................................................ 23
4.1 Rail and Transit Division Assets ................................................................................................................................. 24
4.2 Investment in the Rail and Transit Division ................................................................................................................. 26
4.3 Asset Performance and Forecasts in the Rail and Transit Division ............................................................................ 28
4.4 Rail and Transit Division Progress in 2018 and Next Steps ....................................................................................... 31
5. 0 Aeronautics Division .............................................................................................................................. 32
5.1 Aeronautics Division Assets ........................................................................................................................................ 32
5.2 Investment in the Aeronautics Division ....................................................................................................................... 33
5.3 Asset Performance and Forecasts in the Aeronautics Division .................................................................................. 33
5.4 Aeronautics Division Next Steps ................................................................................................................................. 35
6. 0 Municipalities and Regions .................................................................................................................... 36
6.1 Municipal and Regional Assets ................................................................................................................................... 36
6.2 Investments in Municipalities and Regions ................................................................................................................. 39
Report of the Performance and Asset Management Advisory Council: Progress by MassDOT Highway Division on Integrated Asset Management
ii
LIST OF FIGURES
Figure 1.1 Examples of MassDOT Assets ..................................................................................................................1
Figure 2.1 Average Annual Investment in Highway Division Programs, 2019-2023 ...................................................5
Figure 2.2 Pavement Condition Ratings in 2017 ........................................................................................................6
Figure 2.3 Bridge Condition in 2018 ...........................................................................................................................7
Figure 2.4 NHS Bridge Deck Area in Poor Condition | 2013-2027 .............................................................................8
Figure 2.5 Tunnels Inspected by MassDOT ...............................................................................................................9
Figure 2.6 MassDOT Culvert Inventory as of Spring 2018 .......................................................................................10
Figure 2.7 Example of Culvert Replacement ............................................................................................................11
Figure 2.8 MassDOT Standards for Stream Crossing Design ..................................................................................11
Figure 2.9 Screenshot from the Business Intelligence Dashboard ...........................................................................12
Figure 3.1 Assets in a Typical Transit Station ..........................................................................................................15
Figure 3.2 Average Annual Investment in MBTA Programs, 2019-2023 ..................................................................16
Figure 3.3 2018 Performance and 2019 Targets for MBTA Rolling Stock ................................................................17
Figure 3.4 2018 Performance and 2019 Targets for MBTA Equipment ....................................................................18
Figure 3.5 2018 Performance and 2019 Targets for MBTA Facilities .......................................................................19
Figure 3.6 2018 Performance and 2019 Targets for MBTA Infrastructure ................................................................20
Figure 3.7 Proposed Management System for Existing Assets and Data Process Flow ..........................................22
Figure 4.1 Regional Transit Authorities (RTAs) in Massachusetts ...........................................................................23
Figure 4.2 Inventory of MassDOT Rail Assets ..........................................................................................................24
Figure 4.3 Ownership of Active Rail Lines in Massachusetts ...................................................................................25
Figure 4.4 Average Annual Investment in Rail Programs, 2019-2023 CIP ...............................................................27
Figure 4.5 Average Annual Investment in Transit Programs, 2019-2023 CIP ..........................................................28
Figure 4.6 Performance of MassDOT Rail Assets ....................................................................................................29
Figure 4.7 Freight Rail Lines in Massachusetts by Weight Rating ............................................................................30
Figure 5.1 Average Annual Aeronautics Division Capital Investments, 2019-2023 ..................................................33
Figure 5.2 Screen Capture of MassDOT Airport Pavement Management System ...................................................34
Figure 5.3 Airport Pavement Condition in 2012 and 2016, by Use ...........................................................................34
Figure 6.1 Metropolitan and Rural Planning Regions in Massachusetts ..................................................................36
Figure 6.2 Municipal NHS Lane Miles by Town ........................................................................................................37
Figure 6.3 Municipal NBI Deck Area by Town ..........................................................................................................38
Figure 6.4 BRI Inspection Progress, 2016 to 2018 ...................................................................................................38
Figure 6.5 Hadsell Street Bridge Before and After 2017 Replacement ....................................................................39

Report of the Performance and Asset Management Advisory Council: Progress by MassDOT Highway Division on Integrated Asset Management
iii
December 13, 2018
The Honorable Joan B. Lovely
Vice Chair
Senate Committee on Ways and Means
State House, Room 413-A
Boston, MA 02133
The Honorable Jeffrey Sánchez
Chair
House Committee on Ways and Means
State House, Room 243
Boston, MA, 02133
The Honorable Joseph A. Boncore
Senate Chair
Joint Committee on Transportation
State House, Room 112
Boston, MA 02133
The Honorable William M. Straus
House Chair
Joint Committee on Transportation
State House, Room 134
Boston, MA 02133
Members of the General Court:
On behalf of the Performance and Asset Management Advisory Council, I am pleased to submit this report in
compliance with Chapter 46, Section 12 of the Acts of 2013 and as referenced in Chapter 6C, which requires the
Council to report annually on progress by the Massachusetts Department of Transportation (MassDOT) to develop a
mature asset management system.
Transportation Asset Management (TAM), according to the American Association of State Highway and Transportation
Officials (AASHTO), “is a strategic and systematic process of operating, maintaining, upgrading and expanding physical
assets effectively throughout their lifecycle.” Asset management supports “better decision making based upon quality
information and well-defined objectives."
Spurred on by regulatory framework established at the State and Federal levels, MassDOT has steadily expanded the
breadth of its TAM practice, improving in-turn the information available for operations, maintenance and capital planning
of infrastructure. This progress has been documented in the PAMAC Annual Report since 2015.
For the Highway Division, this report discusses the submission to the Federal Highway Administration (FHWA) of an
Initial Transportation Asset Management Plan (TAMP), which has already begun to guide state reliability investments
on the National High System (NHS). The TAMP will be finalized in 2019. Also included are discussions of bridge and
pavement condition, tunnel system inspection and condition assessment, drainage and resiliency work, and business
intelligence system development.
In October the MBTA filed an asset management plan with the Federal Transit Administration. It continues to focus
on implementing TAM in all areas of the Agency. This report summarizes MBTA asset inventory and performance and
includes plans for internal process and technology improvements.

Report of the Performance and Asset Management Advisory Council: Progress by MassDOT Highway Division on Integrated Asset Management
iv
This report also summarizes MassDOT Rail and Transit and Aeronautics Division activities and discusses asset
management topics at the municipal level.
MassDOT is charged with maintaining existing infrastructure, adapting to climate change and extreme weather, and
anticipating the mobility needs of a future Commonwealth. Accurate information on asset condition and performance
are critical to make the right long-term investment decisions. The Council can once again report significant progress
by the operating divisions of MassDOT and the MBTA toward the employment of sound TAM practices to inform these
decisions.
The Council looks forward to remaining a resource for MassDOT, local governments, and the Legislature in the
upcoming year.
Respectfully Submitted,
Patricia Leavenworth, P.E., Chair
Performance and Asset Management Advisory Council
Pat Ciaramella, Old Colony Planning Council
Karen Sawyer Conard, Merrimack Valley Planning Commission
Christopher Hennessey, Cohen Kinne Valicenti & Cook LLP
David Knowlton, City of Salem MA
Patricia Leavenworth, Chief Engineer, MassDOT (Chair)
Ariela Lovett, Massachusetts Municipal Association
Robert Moylan, MassDOT Board Member
John Pourbaix, Construction Industries of Massachusetts

Report of the Performance and Asset Management Advisory Council: Progress by MassDOT Highway Division on Integrated Asset Management
v
Title VI Notice
The Massachusetts Department of Transportation (MassDOT) fully complies with Title VI of the Civil Rights Act of 1964
and related state laws. MassDOT offers a variety of resources/services in Spanish, Portuguese, Haitian Creole, Khmer,
Chinese and Vietnamese, among others, free of charge. Services include but are not limited to the following: oral
interpreters, written language services and translations of vital documents. If you need help understanding this
document because you do not speak English or have a disability which impacts your ability to read the text, please
contact MassDOT’s Office for Diversity and Civil Rights at (857) 368-8580 or (617) 368-7306 (TTY) or via our website
at www.massdot.gov. If you believe that you or anyone in a specific class of persons has been subjected to
discrimination prohibited by Title VI and other nondiscrimination laws based on race, color, national origin, sex, age,
disability or gender, you or your representative may file a complaint with MassDOT, which we can help you to complete.
A complaint must be filed no later than 180 days after the date of the alleged discrimination. If you require further
information, please contact MassDOT’s Office for Diversity and Civil Rights at (857) 368-8580 or (857)-266-0603 (TTY)
or via our website at www.massdot.gov.
Aviso de Título VI
El Departamento de Transporte de Massachusetts (MassDOT) cumple plenamente con el Título VI de la Ley de
Derechos Civiles de 1964 y las leyes estatales relacionadas al mismo. MassDOT ofrece una variedad de
recursos/servicios en español, portugués, criollo haitiano, camboyano, chino y vietnamita, entre otros, libre de costo.
Entre varios servicios se encuentran los siguientes: intérpretes orales, servicios de lengua escrita y traducción de
documentos vitales. Si usted necesita ayuda para entender este documento ya que no habla inglés o tiene una
incapacidad que afecta su habilidad de leer el texto, por favor contacte a la Oficina para la Diversidad y Derechos
Civiles de MassDOT al (857) 368-8580 o el (617) 368-7306 (TTY) o a través de nuestro sitio web en www.massdot.gov.
Si cree que usted o cualquier otro individuo perteneciente a una clase específica de personas ha sufrido discriminación
prohibida por el Título VI y otras leyes antidiscriminatorias basada en raza, color, origen nacional, sexo, edad,
incapacidad o género, usted o su representante puede presentar una queja a Mass- DOT, la cual podemos ayudarle
a llenar. Se debe presentar la queja a más tardar 180 días después de la fecha de la discriminación alegada. Si
necesita más información, por favor contacte a la Oficina para la Diversidad y Derechos Civiles de MassDOT al (857)
368-8580 o (857)-266-0603 (TTY) o a través de nuestro sitio web en www.massdot.gov.
Caso esta informação seja necessária em outro idioma, favor contar o Especialista em Título VI do MassDOT pelo
telefone 857-368-8580.
如果需要使用其它语言了解信息,请联系马萨诸塞州交通部 (MassDOT)《民权法案》第六章专
员,电话857-368-8580。
如果需要使用其它語言了解信息,請聯繫馬薩諸塞州交通部 (MassDOT)《民權法案》第六章
專員,電話857-368-8580。

Report of the Performance and Asset Management Advisory Council: Progress by MassDOT Highway Division on Integrated Asset Management
vi
Если Вам необходима данная информация на любом другом языке, пожалуйста, свяжитесь со cпециалистом
по Титулу VI Департамента Транспорта штата Массачусетс (MassDOT) по тел: 857-368-8580.
Si yon moun vle genyen enfòmasyon sa yo nan yon lòt lang, tanpri kontakte Espesyalis MassDOT Title VI la nan
nimewo 857-368-8580.
Nếu quý vị cần thông tin này bằng tiếng khác, vui lòng liên hệ Chuyên viên Luật VI của MassDOT theo số điện thoại
857-368-8580.
Si vous avez besoin d'obtenir une copie de la présente dans une autre langue, veuillez contacter le spécialiste du
Titre VI de MassDOT en composant le 857-368-8580.
Se ha bisogno di ricevere queste informazioni in un’altra lingua si prega di contattare lo Specialista MassDOT del
Titolo VI al numero 857-368-8580.
ប្រសិនបរើបោក-អ្នកប្រវូការរកប្ប្រព័រ៌មានបនេះ សូមទាក់ទកអ្នកឯកបទសប ើជពូំកទី6ររសM់assDot
តាមរយៈប ខទូរស័ពទ 857-368-8580
نت إن 857-368-8580 حاجة ك ى ب لومات ھذه إل ع م غة ال ل صال ىجرجى أخرى، ب ي الات صائ أخ قرة ب ف سة ال ساد ال
لى ف ع ھات ال
Report of the Performance and Asset Management Advisory Council: Progress by MassDOT Highway Division on Integrated Asset Management
1
1. 0 Introduction
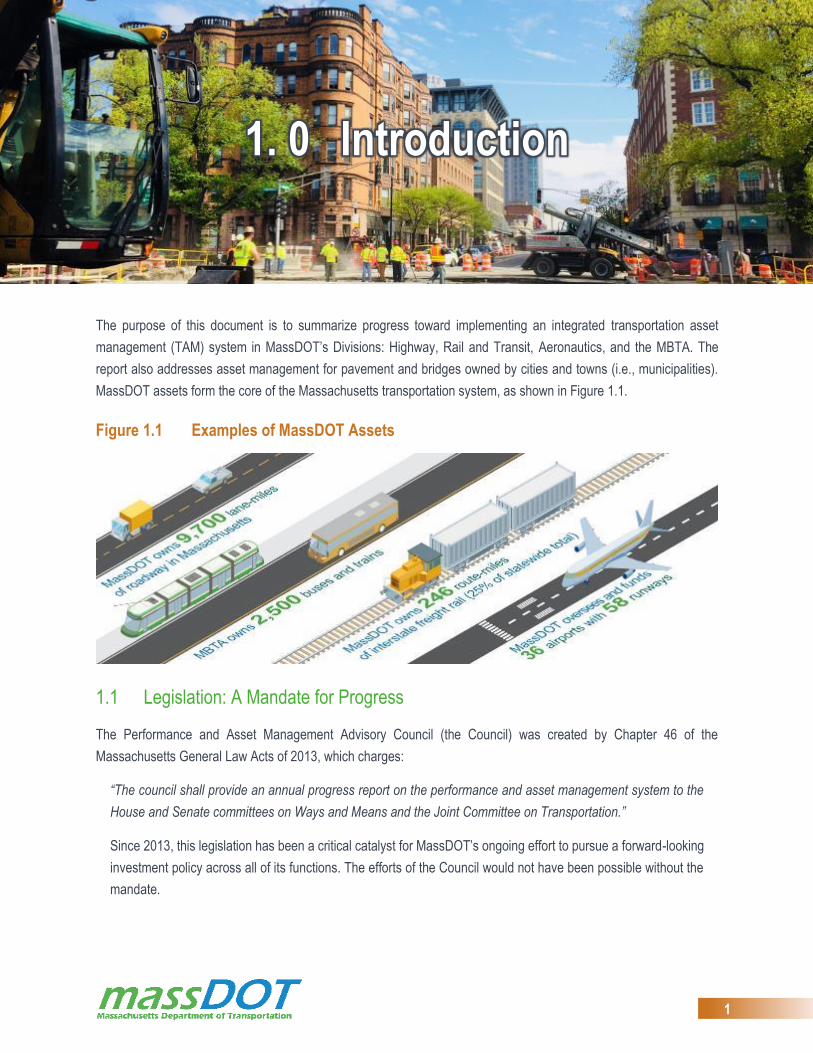
The purpose of this document is to summarize progress toward implementing an integrated transportation asset
management (TAM) system in MassDOT’s Divisions: Highway, Rail and Transit, Aeronautics, and the MBTA. The
report also addresses asset management for pavement and bridges owned by cities and towns (i.e., municipalities).
MassDOT assets form the core of the Massachusetts transportation system, as shown in Figure 1.1.
Figure 1.1 Examples of MassDOT Assets
1.1 Legislation: A Mandate for Progress
The Performance and Asset Management Advisory Council (the Council) was created by Chapter 46 of the
Massachusetts General Law Acts of 2013, which charges:
“The council shall provide an annual progress report on the performance and asset management system to the
House and Senate committees on Ways and Means and the Joint Committee on Transportation.”
Since 2013, this legislation has been a critical catalyst for MassDOT’s ongoing effort to pursue a forward-looking
investment policy across all of its functions. The efforts of the Council would not have been possible without the
mandate.

Report of the Performance and Asset Management Advisory Council: Progress by MassDOT Highway Division on Integrated Asset Management
2
1.2 Context for this Report
MassDOT has made significant strides since its creation in 2009 to incorporate performance-based, data-driven
planning principles and to keep pace with innovative methods in the maintenance and operation of transportation
systems. Internal and external championing of asset management practices has underpinned this progress.
MassDOT’s progress in implementing asset management is keeping Massachusetts apace with Federal requirements.
Congress introduced the requirement for Transportation Performance Management (TPM) in 2012 with the Moving
Ahead for Progress in the 21st Century Act (MAP-21). MAP-21 priorities have been carried forward in the Fixing
America’s Surface Transportation Act (FAST Act) of 2015. The Federal Highway Administration (FHWA) and Federal
Transit Administration (FTA) have implemented final TAM rules in 2017 that are discussed in the related sections of
this report. These rules establish performance measures, and in some cases set minimum thresholds for
statewide asset condition and require MassDOT to set performance targets.
This report is designed to align with the MassDOT Tracker FY2018. That document summarizes additional performance
metrics for each of MassDOT’s divisions. While this document focuses on asset management and system condition,
the Tracker includes measures of customer experience, budget and capital performance, safety, and health and
sustainable transportation.
1.3 Structure of This Report
This report summarizes the TAM practice of the MassDOT Highway Division, the MassDOT Rail and Transit Division,
the MassDOT Aeronautics Division, MBTA, and Municipalities. For each of these groups, the report (Sections 2-5)
presents a list of assets; investment levels; past and future performance; and progress since last year’s report and next
steps for the coming year(s).
1.4 What’s New
This report is intended to build on the reports from prior years and call out notable advances in asset management
throughout MassDOT and the MBTA. This year’s report highlights the following:
For the Highway Division
A summary of the Division’s initial Transportation Asset Management Plan (TAMP).
Update on Bridge and Pavement Condition
A discussion of several efforts involving drainage and resiliency.
For the MBTA
A discussion of the MBTA’s organizational commitment to asset management.
An update on the development of MBTA asset management data systems.

Report of the Performance and Asset Management Advisory Council: Progress by MassDOT Highway Division on Integrated Asset Management
3
A summary of the agency’s Transportation Asset Management Plan (TAM Plan).
For the Rail and Transit Division
A discussion of MassDOT’s rail asset management support project.
For the Aeronautics Division
A discussion of the goals and approach of the upcoming Massachusetts State Aviation System Plan (MSASP).
Related to Municipal Infrastructure
A summary of inventory and condition for municipally-owned small bridges.

Report of the Performance and Asset Management Advisory Council: Progress by MassDOT Highway Division on Integrated Asset Management
4
2. 0 Highway Division
The Highway Division submitted an initial Transportation Asset Management Plan (TAMP) to the Federal Highway
Administration (FHWA) on April 30, 2018. The TAMP is a key component of the Federal Transportation Performance
Management regulatory framework, and the document describes the asset management processes which State
Departments of Transportation employ for improvements to and preservation of the National Highway System (NHS).
The final TAMP will be submitted in June of 2019 following the completion of remaining plan elements and incorporation
of FHWA feedback.
2.1 Submission of the Initial Transportation Asset Management Plan to FHWA
The filing of the initial TAMP represents a significant milestone in development of performance-based capital planning
at MassDOT. The processes described within the Highway Division’s Initial TAMP have grown from mandates within
Massachusetts General Law and have been promoted by MassDOT leadership past and present. While the TAMP is
focused on the NHS, the asset management processes described in the plan are universally applied to MassDOT
assets, and are the underlying framework for all reliability investments within the MassDOT CIP.
The TAMP outlines the MassDOT Asset Management approach as follows:
Regular update of Inventory and condition data.
Deliberate approach to the lifecycle management of infrastructure with the objective of minimizing overall cost of
ownership.
Forecasting of condition and performance outcomes at various investment levels.
Consideration and mitigation of risks which could impact desired performance outcomes.
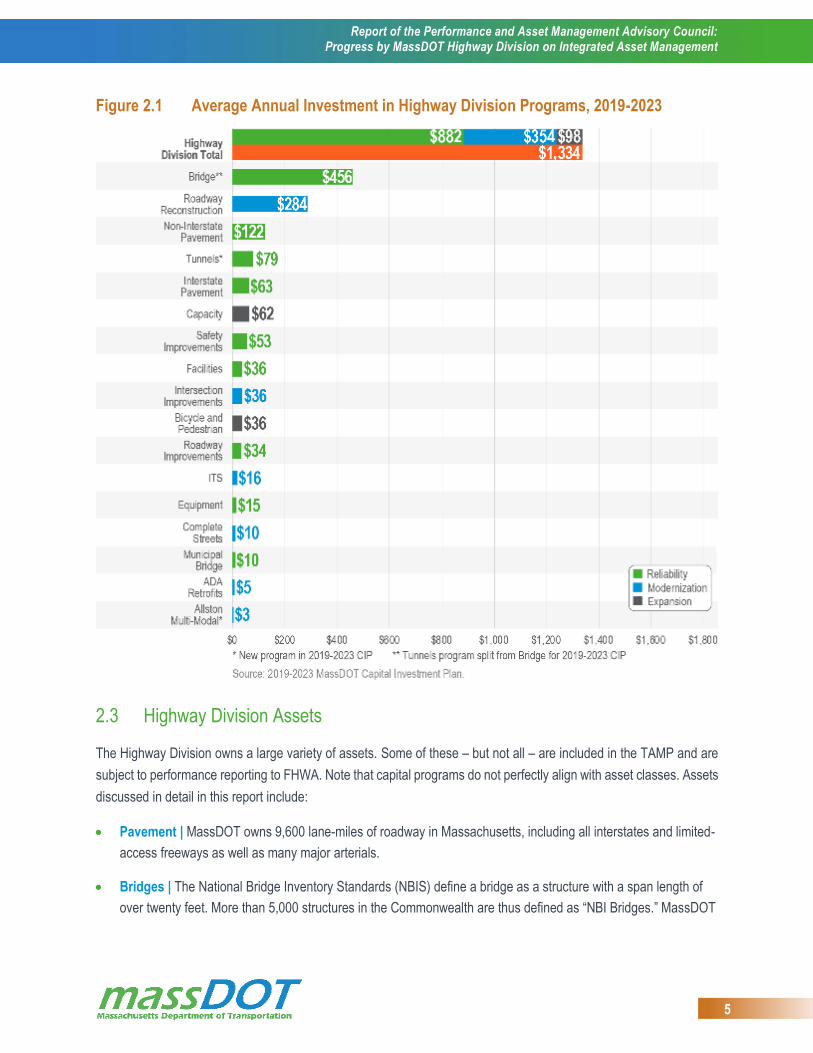
2.2 Investment in the Highway Division
Annual average investment in each Highway Division capital program in the 2019-2023 CIP is shown in Figure 2.1.
Report of the Performance and Asset Management Advisory Council: Progress by MassDOT Highway Division on Integrated Asset Management
5
Figure 2.1 Average Annual Investment in Highway Division Programs, 2019-2023
2.3 Highway Division Assets
The Highway Division owns a large variety of assets. Some of these – but not all – are included in the TAMP and are
subject to performance reporting to FHWA. Note that capital programs do not perfectly align with asset classes. Assets
discussed in detail in this report include:
Pavement | MassDOT owns 9,600 lane-miles of roadway in Massachusetts, including all interstates and limited-
access freeways as well as many major arterials.
Bridges | The National Bridge Inventory Standards (NBIS) define a bridge as a structure with a span length of
over twenty feet. More than 5,000 structures in the Commonwealth are thus defined as “NBI Bridges.” MassDOT
Report of the Performance and Asset Management Advisory Council: Progress by MassDOT Highway Division on Integrated Asset Management
6
has capital responsibility for bridges owned by the Highway Division and by municipalities. Municipalities are
responsible for preservation of their bridges.
Tunnels | Tunnels include the structure, overhead elements (e.g., ceiling panels & lighting), and life safety and
ventilation equipment. MassDOT owns 7 tunnels which are comprised of 44 individual tunnel subsections. All
Highway Division tunnels reside within the Metropolitan Highway System (MHS).
Drainage Culverts | Culverts are structures with a span less than 10 feet and a diameter greater than four feet
(i.e., not pipes). To date, MassDOT has identified approximately 5,000 culverts.
Other MassDOT Assets not discussed in this report include:
Ancillary Structures | Ancillary structures are vertical or overhanging and would impede the roadway if they fell.
These include full and cantilever-span support structures for static and variable message signs, electronic tolling
gantries, traffic signal supports, and lighting structures.
Signs and Signals | MassDOT owns more than 250,000 signs and signposts and 1,531 traffic signals.
Pedestrian Ramps | MassDOT owns more than 26,000 pedestrian ramps.
Bicycle and Sidewalk Accommodations | MassDOT owns sidewalks and bicycle lanes on many roadways.
2.4 Asset Performance and Forecasts for the Highway Division
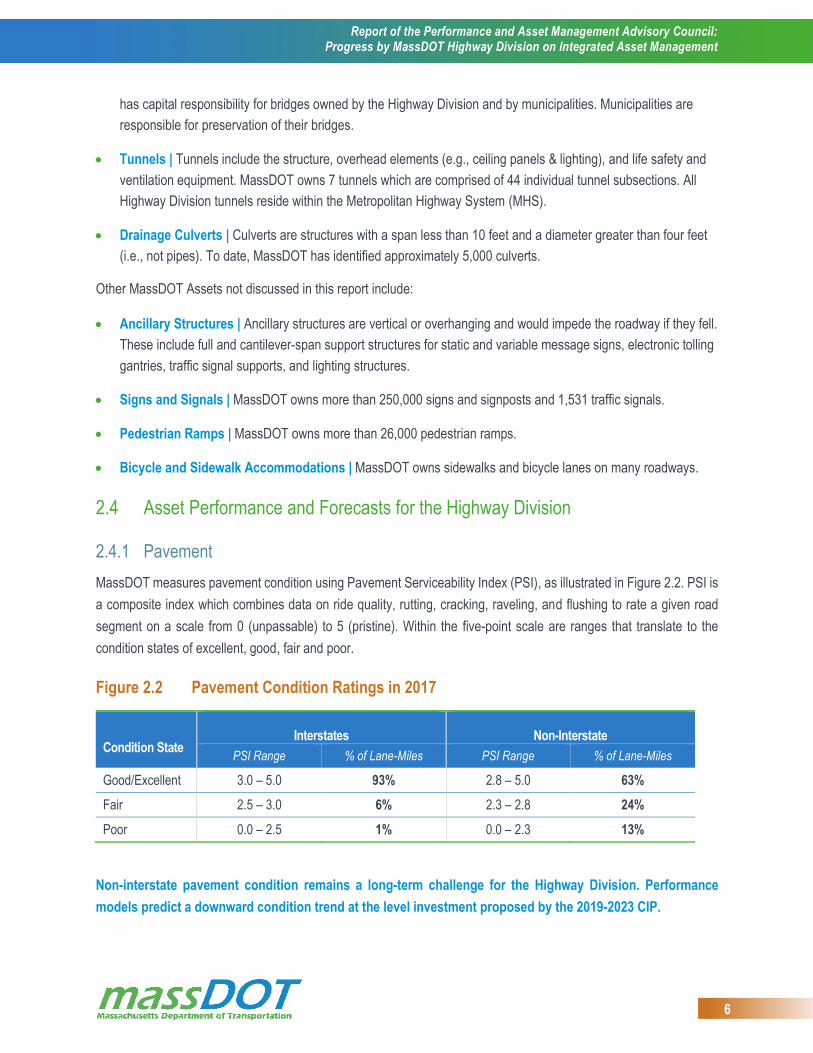
2.4.1 Pavement
MassDOT measures pavement condition using Pavement Serviceability Index (PSI), as illustrated in Figure 2.2. PSI is
a composite index which combines data on ride quality, rutting, cracking, raveling, and flushing to rate a given road
segment on a scale from 0 (unpassable) to 5 (pristine). Within the five-point scale are ranges that translate to the
condition states of excellent, good, fair and poor.
Figure 2.2 Pavement Condition Ratings in 2017
Condition State Interstates Non-Interstate
PSI Range % of Lane-Miles PSI Range % of Lane-Miles
Good/Excellent 3.0 – 5.0 93% 2.8 – 5.0 63%
Fair 2.5 – 3.0 6% 2.3 – 2.8 24%
Poor 0.0 – 2.5 1% 0.0 – 2.3 13%
Non-interstate pavement condition remains a long-term challenge for the Highway Division. Performance
models predict a downward condition trend at the level investment proposed by the 2019-2023 CIP.

Report of the Performance and Asset Management Advisory Council: Progress by MassDOT Highway Division on Integrated Asset Management
7
To maximize the effectiveness of available funding, MassDOT is increasing the use of pavement preservation on good
and fair roadways to delay further degradation and extend pavement useful life at comparatively lower cost than
rehabilitation (e.g. sealing of a residential driveway). Consistent preservation investments, coupled with rehabilitation
projects, will result in a lower cost of ownership than found from rehabilitation alone. Preservation will not however
replace the need for investment in conventional pavement resurfacing projects.
Project scope is a major factor in the outcome of pavement investments. Segments are selected for investment through
the MassDOT Pavement Management System and are then fully developed into projects based on an in-depth
engineering assessment of corridor conditions. In many cases, needs exist beyond the pavement, and can include
bridge deficiencies, safety hardware upgrades, drainage repairs or upgrades, and improvements to bicycle/pedestrian
accommodation. Once a project is fully designed, it is not uncommon to find significant portions of the project budget
allocated to work outside of the pavement. Outwardly this appears to be an increased cost of ownership for pavement
but is reflective of investments toward other assets.
2.4.2 Bridges
The National Bridge Inventory Standards (NBIS) define a bridge as a structure with a span length of over twenty feet.
More than 5,000 structures in the Commonwealth are thus defined as “NBI Bridges,” of which 1,569 are owned by
municipalities and most of the remainder are owned by MassDOT.
The NHS consists of Interstates and roadways which serve major transportation, commercial and other strategic
transport facilities. 2,270 bridges in Massachusetts are on the NHS. Of these, 73 are owned by municipalities and the
remainder – 2,167 NHS bridges – are owned by MassDOT. Approximately 44% of Massachusetts bridges are on the
NHS; however, over 70% of bridge deck area is on the NHS. Because of the multi-lane facilities which the structures
carry, NHS bridges are on average three times the size of non-NHS structures.
Current Condition of NHS and Non-NHS Bridges
FHWA’s final rule on bridge performance measures has defined two condition metrics for bridges: percentage of NHS
deck area on bridges that are in good and poor condition. FHWA defines bridge condition using the nine-point
National Bridge Inspection Standards (NBIS) scale, where higher values indicate better condition. “Good” condition
begins at a rating of 7, and “Poor” is defined as “structurally deficient” (SD), a rating of 4 or lower. MassDOT has
adopted the FHWA performance measure. The distribution of bridge deck area among condition states for NHS and
Non-NHS structures is shown in Figure 2.3.
Figure 2.3 Bridge Condition in 2018
Condition State NHS Non-NHS
NBI Score Range % of Deck Area NBI Score Range % of Deck Area
Good 7 – 10 16% 7 – 10 25%
Fair 5 – 6 71% 5 – 6 67%

Report of the Performance and Asset Management Advisory Council: Progress by MassDOT Highway Division on Integrated Asset Management
8
Poor 0 – 4 13% 0 – 4 8%
As of November 2018, 12.7% of the NHS bridge area in Massachusetts is rated poor, which exceeds the
maximum threshold of 10% identified by FHWA. Exceeding the Federal threshold requires MassDOT to make a
minimum investment in bridges – MassDOT has invested above this level since 2008. At the rate of bridge
investment proposed by the 19-23 CIP, MassDOT does not expect to achieve the 10% condition threshold
within the next five years, as shown in Figure 2.4.
Figure 2.4 NHS Bridge Deck Area in Poor Condition | 2013-2027
2.4.3 Tunnels
MassDOT tracks seven structures that are classified as tunnels or that are comprised of tunnels – the Sumner and
Callahan Tunnels, the Prudential Tunnel, the CANA Tunnel (City Square in Charlestown), and on the Central Artery:
the Ted Williams, I-90 Connector, and Tip O’Neill (I-93) Tunnels.
Tunnel assets are identified with “Tunnel Identification Numbers” (TINs). MassDOT tracks TINs owned by several
entities, including MassDOT, Massport, MBTA, Boston Properties, the Massachusetts Convention Center Authority
(MCCA), and Simon/Copley. Two TINs are “highway transit” tunnels – Silver Line and Harvard Square – both owned
and overseen by the MBTA. While the MBTA manages the maintenance and inspection of these tunnels, the inspection
data is passed on to FHWA by MassDOT.
Tunnel assets include not only the structural elements of a tunnel (roof, walls, floor, and columns), but also roadway
assets (pavement, fencing), and safety/operations assets (ventilation ducts, struts, hanging panels, lighting, pumps,
0%
2%
4%
6%
8%
10%
12%
14%
16%
18%
0
1
2
3
4
5
2013
2014
2015
2016
2017
2018
2019
2020
2021
2022
2023
2024
2025
2026
2027
Per
cent
of N
HS
Dec
k A
rea
Sq.
ft. o
f NH
S D
eck
Are
a
Millions
Deck Area Resolved Deck Area Deteriorated% Deck Area Poor | Actual % Deck Area Poor | Forecast
Report of the Performance and Asset Management Advisory Council: Progress by MassDOT Highway Division on Integrated Asset Management
9
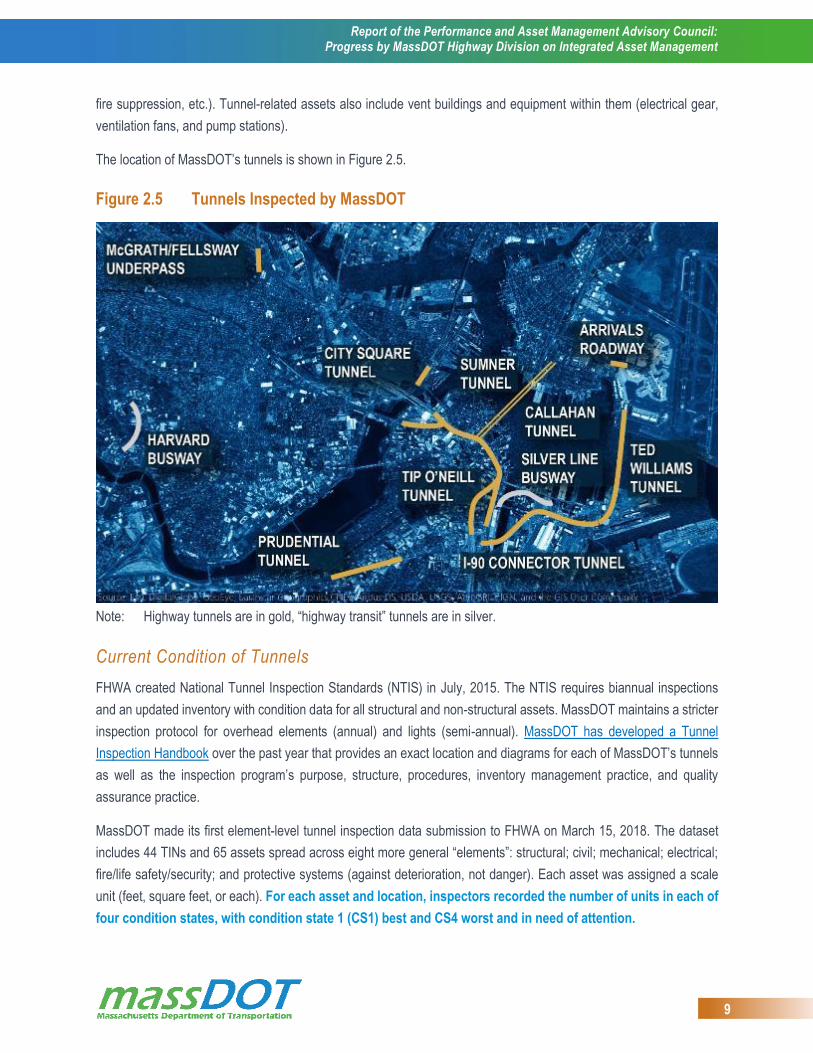
fire suppression, etc.). Tunnel-related assets also include vent buildings and equipment within them (electrical gear,
ventilation fans, and pump stations).
The location of MassDOT’s tunnels is shown in Figure 2.5.
Figure 2.5 Tunnels Inspected by MassDOT
Note: Highway tunnels are in gold, “highway transit” tunnels are in silver.
Current Condition of Tunnels
FHWA created National Tunnel Inspection Standards (NTIS) in July, 2015. The NTIS requires biannual inspections
and an updated inventory with condition data for all structural and non-structural assets. MassDOT maintains a stricter
inspection protocol for overhead elements (annual) and lights (semi-annual). MassDOT has developed a Tunnel
Inspection Handbook over the past year that provides an exact location and diagrams for each of MassDOT’s tunnels
as well as the inspection program’s purpose, structure, procedures, inventory management practice, and quality
assurance practice.
MassDOT made its first element-level tunnel inspection data submission to FHWA on March 15, 2018. The dataset
includes 44 TINs and 65 assets spread across eight more general “elements”: structural; civil; mechanical; electrical;
fire/life safety/security; and protective systems (against deterioration, not danger). Each asset was assigned a scale
unit (feet, square feet, or each). For each asset and location, inspectors recorded the number of units in each of
four condition states, with condition state 1 (CS1) best and CS4 worst and in need of attention.

Report of the Performance and Asset Management Advisory Council: Progress by MassDOT Highway Division on Integrated Asset Management
10
Per the requirements of the Metropolitan Highway System (MHS) Trust Agreement, MassDOT has retained a third-
party consultant to conduct a Triennial Inspection of the MHS. The MHS consists of the Boston Extension of the
Massachusetts Turnpike (I-90), the facilities built by the Central Artery and Tunnel project, the Sumner and Callahan
tunnels, and the Tobin Bridge. The triennial inspection will provide an independent determination of the state of good
repair of the MHS, including the Tunnels, and make recommendations for capital investments. The report will be filed
in the fall of 2018, and the recommendations will be considered in future Capital Programming.
2.5 Highway Division Progress in 2018 and Next Steps
2.5.1 Drainage and Resiliency
Culvert Inventory
The Highway Division began to inventory highway drainage culverts in the spring of 2016 through an innovative process
based on record construction plans. Using desktop GIS tools, Highway Staff overlaid aerial photography, roadway
centerline, and wetland resource data with scanned construction plans to identify the location, type and size of State-
owned culverts. Each Highway District has prioritized the inventory work in descending order of roadway functional
classification, beginning with the Interstate system. These data will be used to identify needs for culvert inspection, and
ultimately maintenance or replacement.
Going into summer 2018, MassDOT has confirmed 4,957 culverts, estimated at 83% of the statewide inventory
of 6,000 (as compared to 70% at this time last year). This inventory is illustrated in Figure 2.7 (next page).
Figure 2.6 MassDOT Culvert Inventory as of Spring 2018

Report of the Performance and Asset Management Advisory Council: Progress by MassDOT Highway Division on Integrated Asset Management
11
To record the condition of the identified culverts, as well as that of catch basins and manholes, MassDOT has
developed a mobile inspection platform: the “Drainage and Utility Collector”. Using this tool, inspections can be logged
directly from the field. MassDOT is initiating inspections of culverts by first focusing within the limits of upcoming
resurfacing projects, making the most of field staff while facilitating the future coupling of culvert and pavement repairs.
Figure 2.7 shows a sample of the culvert replacement work MassDOT can accomplish with this information.
Figure 2.7 Example of Culvert Replacement
Statewide Drainage Study
To facilitate the culvert inventory, the Highway Division applied for and was awarded a grant from FHWA to pursue a
pilot project for the integration of asset management and extreme weather vulnerability. The FHWA study builds on
MassDOT’s pilot project in the Deerfield River Watershed and the culvert inspection by incorporating measures of risk
under severe weather conditions – the culverts most likely to wash out under riverine flooding. These measures are
specific stream power (SSP) and percent bankfull width – the percentage of the stream’s 1.5-year maximum width that
falls between the culvert’s walls (the Massachusetts standard is 120%), as shown in Figure 2.8.
Figure 2.8 MassDOT Standards for Stream Crossing Design
Report of the Performance and Asset Management Advisory Council: Progress by MassDOT Highway Division on Integrated Asset Management
12
As with the culvert inventory, data from the FHWA study will be integrated into MassDOT’s project generation structure
through the MaPIT tool – project proponents will be able to easily see if a risky culvert exists within their proposed
boundaries.
2.5.2 Data Systems and Business Intelligence
In the past year, the Highway Division has made significant progress in implementing several data systems and
business intelligence tools to make its business more efficient and effective. These include:
VUEWorks | VUEWorks is being implemented as the Highway Division’s work order management system. It will
centralize the management service requests and allow geo-location of work orders so that MassDOT can map
where repairs are needed in real time.
Construction Field Inspection Application | MassDOT is replacing its paper field inspection reports and
diaries with an online application form. At the end of each day, MassDOT will know where all of its field staff
were and what work they oversaw.
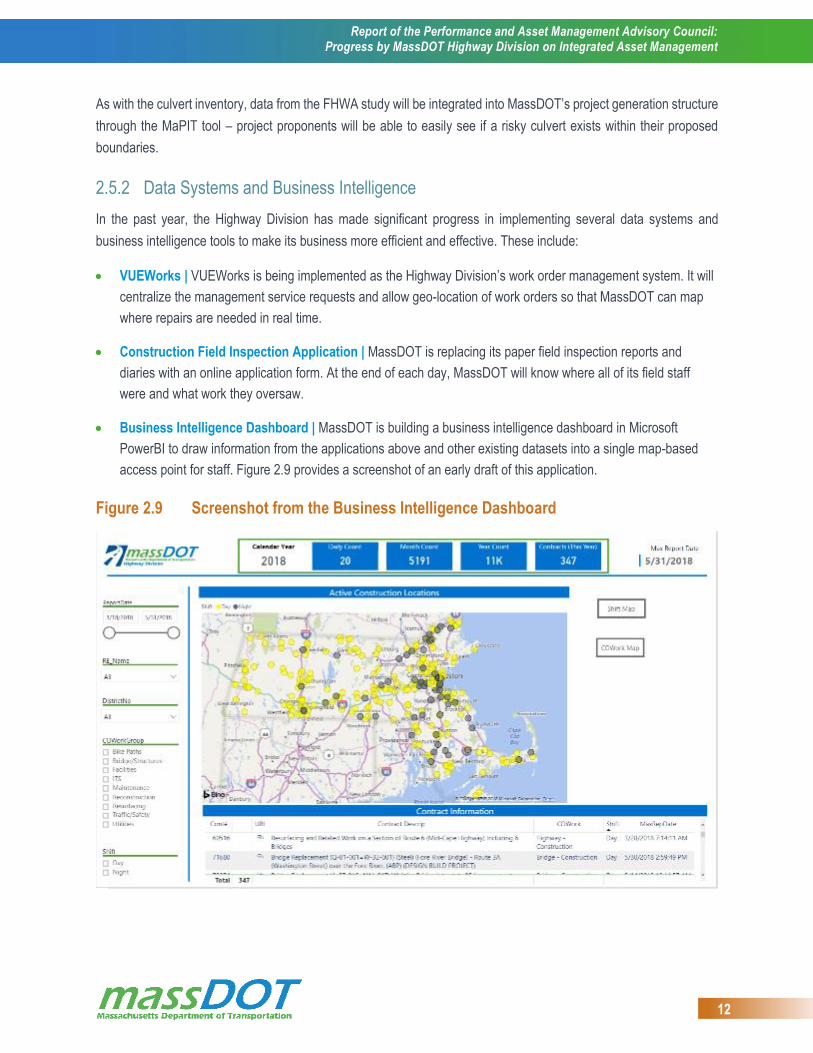
Business Intelligence Dashboard | MassDOT is building a business intelligence dashboard in Microsoft
PowerBI to draw information from the applications above and other existing datasets into a single map-based
access point for staff. Figure 2.9 provides a screenshot of an early draft of this application.
Figure 2.9 Screenshot from the Business Intelligence Dashboard
Report of the Performance and Asset Management Advisory Council: Progress by MassDOT Highway Division on Integrated Asset Management
13
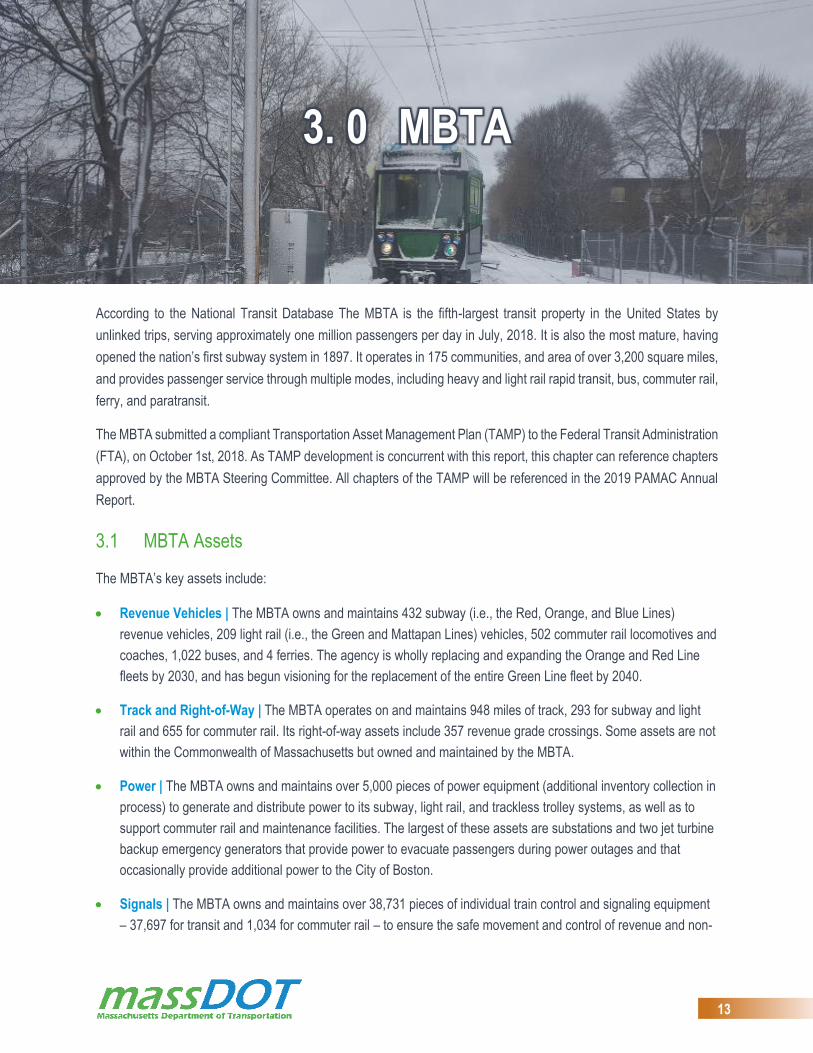
3. 0 MBTA
According to the National Transit Database The MBTA is the fifth-largest transit property in the United States by
unlinked trips, serving approximately one million passengers per day in July, 2018. It is also the most mature, having
opened the nation’s first subway system in 1897. It operates in 175 communities, and area of over 3,200 square miles,
and provides passenger service through multiple modes, including heavy and light rail rapid transit, bus, commuter rail,
ferry, and paratransit.
The MBTA submitted a compliant Transportation Asset Management Plan (TAMP) to the Federal Transit Administration
(FTA), on October 1st, 2018. As TAMP development is concurrent with this report, this chapter can reference chapters
approved by the MBTA Steering Committee. All chapters of the TAMP will be referenced in the 2019 PAMAC Annual
Report.
3.1 MBTA Assets
The MBTA’s key assets include:
Revenue Vehicles | The MBTA owns and maintains 432 subway (i.e., the Red, Orange, and Blue Lines)
revenue vehicles, 209 light rail (i.e., the Green and Mattapan Lines) vehicles, 502 commuter rail locomotives and
coaches, 1,022 buses, and 4 ferries. The agency is wholly replacing and expanding the Orange and Red Line
fleets by 2030, and has begun visioning for the replacement of the entire Green Line fleet by 2040.
Track and Right-of-Way | The MBTA operates on and maintains 948 miles of track, 293 for subway and light
rail and 655 for commuter rail. Its right-of-way assets include 357 revenue grade crossings. Some assets are not
within the Commonwealth of Massachusetts but owned and maintained by the MBTA.
Power | The MBTA owns and maintains over 5,000 pieces of power equipment (additional inventory collection in
process) to generate and distribute power to its subway, light rail, and trackless trolley systems, as well as to
support commuter rail and maintenance facilities. The largest of these assets are substations and two jet turbine
backup emergency generators that provide power to evacuate passengers during power outages and that
occasionally provide additional power to the City of Boston.
Signals | The MBTA owns and maintains over 38,731 pieces of individual train control and signaling equipment
– 37,697 for transit and 1,034 for commuter rail – to ensure the safe movement and control of revenue and non-
Report of the Performance and Asset Management Advisory Council: Progress by MassDOT Highway Division on Integrated Asset Management
14
revenue service . Federally-mandated Positive Train Control (PTC) implementation will increase commuter rail
signaling equipment significantly, as will renewal and expansion of new signaling technology on transit lines.
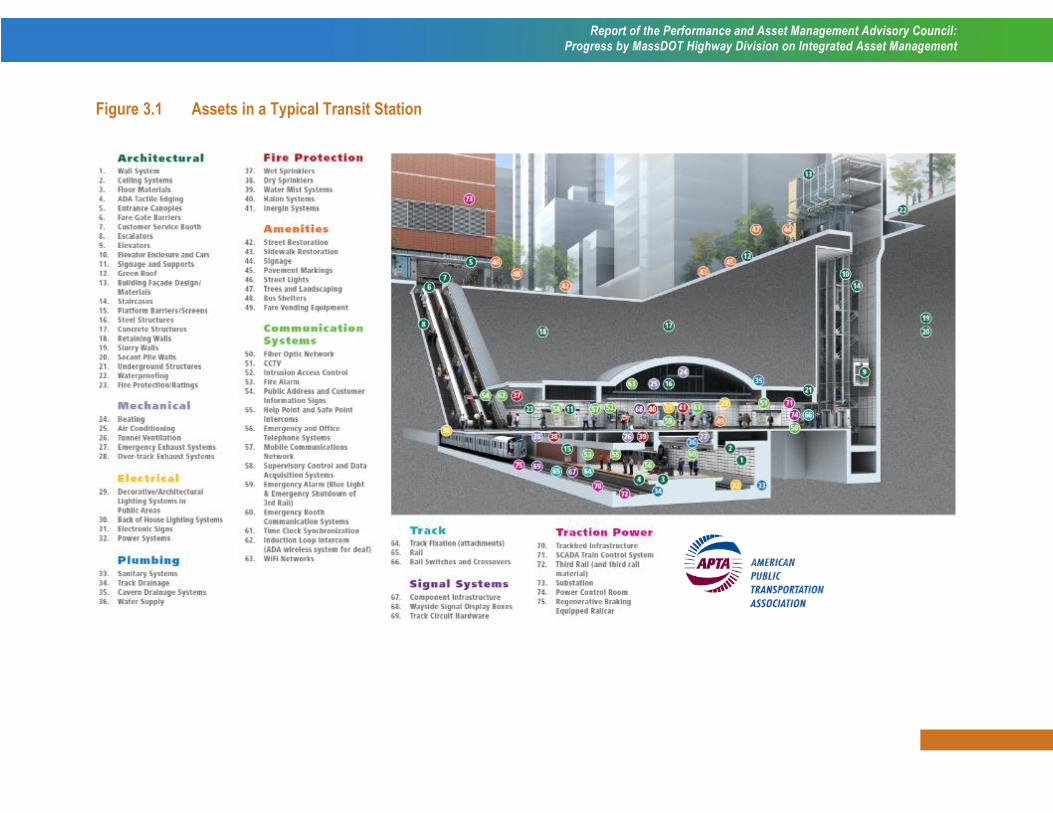
Stations | Figure 3.1 (next page) illustrates the many assets that are contained within a single station. The
MBTA owns and maintains 137 subway stations, 138 commuter rail stations, 176 MBTA bus shelters (487 more
shelters are not owned or maintained by the MBTA) out of 7,686 bus stops, and one ferry dock. To maintain
accessibility of the system for all customers, the MBTA provides 198 elevators and 178 escalators.
Bridges and Tunnels | The MBTA owns and maintains approximately 230 crossovers, 974 turnouts, 46.2 miles
of tunnels, 459 bridges, 1.81 miles of retaining walls and 1,303 Culverts. The MBTA’s tunnel assets include
walls, utility lines, ceilings, signage, de-watering equipment, ventilation systems, and electrical and lighting
systems.
Service Vehicles | The MBTA owns over 1,676 service vehicles (across commuter rail and transit), including
general-purpose fleet, operations, and support equipment (e.g., aerial lifts, compressors, cranes, portable signs),
operations and support vehicles (e.g., bucket trucks, fuel trucks, snow fighters, tow trucks), and the fleet of the
Transit Police.
Communications | The MBTA maintains a state-of-the-art Operations Control Center (OCC) as well as
telephone equipment (including emergency phones and intercoms), automated management systems for life
safety equipment, systemwide radio, a “wide area network” (i.e., intranet), and public address equipment and
electronic signs.
Fare Equipment | The MBTA owns and maintains approximately 1,600 fare boxes, 453 vending machines, and
611 gates. Overall, the automated fare collection (AFC) or “Charlie Card” system accounts for nearly 3,000
assets.
Parking | The MBTA owns and maintains 9 parking garages and 98 parking lots.
Facilities | The MBTA owns and maintains approximately 150 maintenance and administration buildings (as with
stations, there are many combinations of assets), layover areas, and fueling and pumping stations across all
modes (transit and commuter rail). These include facilities outside of the Commonwealth of Massachusetts, as
well as elevators and escalators within these facilities.
FTA is in the process of implementing a requirement that the MBTA submit a full asset inventory to the National Transit
Database (NTD) asset inventory module on an annual basis. Approximately 25% of the MBTA’s assets are required to
be reported for October 2018. The agency has committed to a multi-year plan to add 100% of its asset classes to the
submission in October, 2019.
Report of the Performance and Asset Management Advisory Council: Progress by MassDOT Highway Division on Integrated Asset Management
15
Figure 3.1 Assets in a Typical Transit Station
Report of the Performance and Asset Management Advisory Council: Progress by MassDOT Highway Division on Integrated Asset Management
16
3.2 Investment in the MBTA
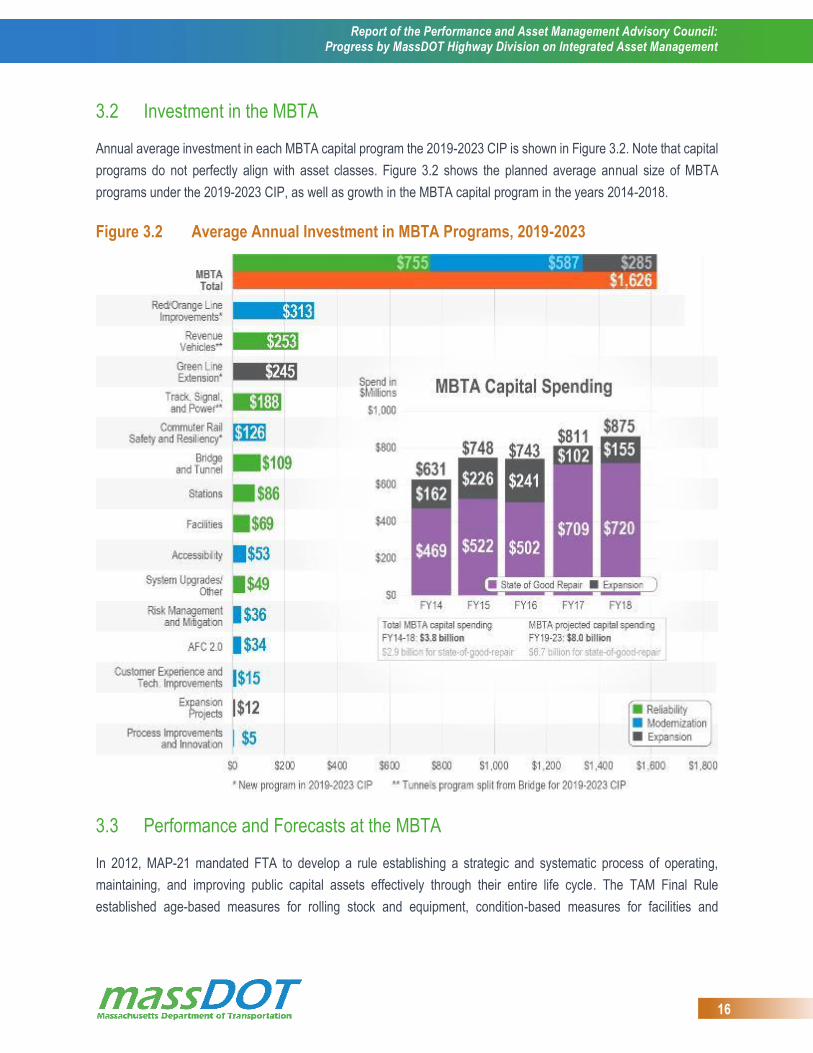
Annual average investment in each MBTA capital program the 2019-2023 CIP is shown in Figure 3.2. Note that capital
programs do not perfectly align with asset classes. Figure 3.2 shows the planned average annual size of MBTA
programs under the 2019-2023 CIP, as well as growth in the MBTA capital program in the years 2014-2018.
Figure 3.2 Average Annual Investment in MBTA Programs, 2019-2023
3.3 Performance and Forecasts at the MBTA
In 2012, MAP-21 mandated FTA to develop a rule establishing a strategic and systematic process of operating,
maintaining, and improving public capital assets effectively through their entire life cycle. The TAM Final Rule
established age-based measures for rolling stock and equipment, condition-based measures for facilities and

Report of the Performance and Asset Management Advisory Council: Progress by MassDOT Highway Division on Integrated Asset Management
17
performance-based measures for fixed guideway assets as a minimum annual reporting requirement for transit
operators.
The MBTA has produced performance measures and targets for rolling stock (revenue vehicles), equipment (service
vehicles, facilities, and infrastructure (track) and has submitted them to FTA in the TAM Plan as of October, 2018.
3.3.1 Performance for Rolling Stock
Per FTA guidance, MBTA calculated the FY 2018 baseline measure for each mode and asset type by dividing the
number of vehicles beyond their useful life benchmark by the total vehicles within each category. The FY 2019
performance targets use this baseline as a starting point, accounting for any decommissioning of existing vehicles or
commissioning of new vehicles, and reflect the ongoing aging of the revenue vehicle fleet offset by anticipated capital
investment in FY 2019.
The MBTA has several major revenue vehicle capital programs underway in FY 2019, including the complete
replacement and modernization of the Red and Orange heavy rail fleets, significant replacement of the bus fleet, new
Green Line light rail vehicles to support the extension of that line to Somerville and Medford, and a robust fleet program
for The RIDE paratransit vehicles. Also during FY 2019, the MBTA Commuter Rail will reintroduce locomotives and
coaches that were taken out of service for major rehabilitation. Overall, the MBTA anticipates the summary measure
of rolling stock state of good repair will improve seven percentage points from 30% at or beyond useful life benchmark
in FY 2018 to 23% at or beyond useful life benchmark in FY 2019. Performance will continue to improve as new
Orange Line cars, Red Line cars, buses, and paratransit vehicles are commissioned in FY 2020 and beyond. Rolling
stock performance and targets are summarized in Figure 3.3.
Figure 3.3 2018 Performance and 2019 Targets for MBTA Rolling Stock
Percentage of revenue vehicles that have met or exceeded their useful life benchmark (ULB)
Mode Asset Type ULB (years) 2018 Measure 2019 Target
Bus Bus 14 25% 25%
Light Rail Light Rail Vehicle 31 46% 41%
Heavy Rail Heavy Rail Vehicle 31 58% 56%
Commuter Rail Commuter Rail Locomotive 39 27% 24%
Commuter Rail Passenger Coach 39 0% 0%
Ferry Ferryboat 25 0% 0%
Paratransit
Automobile 6 46% 3%
Minivan 7 0% 0%
Van 7 29% 13%
Total 30% 23%

Report of the Performance and Asset Management Advisory Council: Progress by MassDOT Highway Division on Integrated Asset Management
18
3.3.2 Performance for Equipment
Per FTA guidance, MBTA calculated the FY 2018 baseline measure for each mode and asset type by dividing the
number of vehicles beyond their useful life benchmark by the total vehicles within each category. The FY 2019 targets
use this baseline as a starting point, accounting for any decommissioning of existing vehicles or commissioning of new
vehicles, and reflect the ongoing aging of the non-revenue vehicle fleet partially offset by the impact of anticipated
capital investment in FY 2019. The MBTA chose to use agency-specific useful life benchmarks for non-revenue
vehicles rather than the default values set by the FTA. The agency-specific ULB for each asset type varies depending
on the function and purpose of the vehicle. Some equipment is stored indoors and used sporadically, and therefore
can perform adequately even if well beyond its ULB.
The MBTA will initiate a new non-revenue vehicle procurement in FY 2019. However, a greater number of vehicles
will exceed their useful life benchmark in FY 2019, which results in an overall increase in the percentage of non-revenue
vehicles exceeding ULB. Overall, the MBTA anticipates the summary measure of equipment state of good repair will
degrade two percentage points from 20% at or beyond useful life benchmark in FY 2018 to 22% at or beyond useful
life benchmark in FY 2019.
The Non-Revenue Vehicle capital program is focused on replacing highest impact vehicles, including those used for
winter response and track maintenance, which may not always be the oldest vehicles in the fleet. This means that our
measures may degrade, even though capital investment is underway. Equipment performance and targets are
summarized in Figure 3.4.
Figure 3.4 2018 Performance and 2019 Targets for MBTA Equipment
Percentage of service vehicles that have met or exceeded their useful life benchmark (ULB)
Mode Asset Type ULB (years) 2018 Measure 2019 Target
Transit
Automobile varies 22% 22%
Other Rubber Tire Vehicle varies 25% 29%
Steel Wheel Vehicle varies 38% 38%
Commuter Rail
Automobile varies 12% 17%
Other Rubber Tire Vehicle varies 12% 13%
Steel Wheel Vehicle varies 33% 33%
MBTA-Wide
Automobile varies 20% 21%
Other Rubber Tire Vehicle varies 19% 21%
Steel Wheel Vehicle varies 34% 34%
Total 20% 22%
Report of the Performance and Asset Management Advisory Council: Progress by MassDOT Highway Division on Integrated Asset Management
19
3.3.3 Performance for Facilities
Consistent with FTA guidance, the MBTA is undertaking physical condition assessments of all facilities and will only
report condition ratings for approximately 41 percent of these facilities in the NTD submission. In order to develop
performance targets, the MBTA segmented facilities between those that have a baseline condition assessment to
report in the FY 2019 NTD submission and those for which condition assessments are still underway. Due to the
ongoing nature of these assessments, performance measures and targets, and in line with the guidance provided by
the NTD, the MBTA is only setting targets for the facilities that have undergone an on-site assessment.
Per FTA guidance, MBTA calculated the FY 2018 baseline measure for each category by dividing the number of
facilities with a TERM score below a three by the total number of facilities in that category that had a completed baseline
condition assessment in FY 2018. The FY 2019 targets use this baseline as a start point and reflect anticipated capital
investment in FY 2019 only for facilities with a baseline condition assessment. Targets for the remainder of the system
will be set once all facility condition assessments are completed.
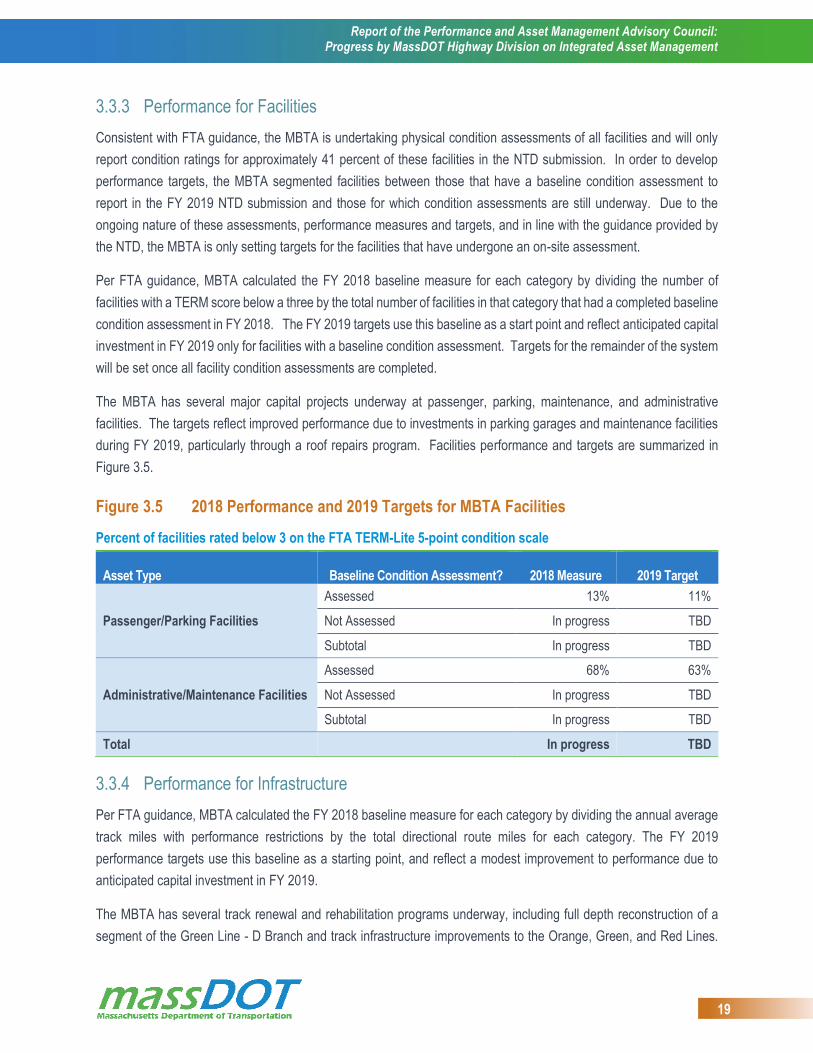
The MBTA has several major capital projects underway at passenger, parking, maintenance, and administrative
facilities. The targets reflect improved performance due to investments in parking garages and maintenance facilities
during FY 2019, particularly through a roof repairs program. Facilities performance and targets are summarized in
Figure 3.5.
Figure 3.5 2018 Performance and 2019 Targets for MBTA Facilities
Percent of facilities rated below 3 on the FTA TERM-Lite 5-point condition scale
Asset Type Baseline Condition Assessment? 2018 Measure 2019 Target
Passenger/Parking Facilities
Assessed 13% 11%
Not Assessed In progress TBD
Subtotal In progress TBD
Administrative/Maintenance Facilities
Assessed 68% 63%
Not Assessed In progress TBD
Subtotal In progress TBD
Total In progress TBD
3.3.4 Performance for Infrastructure
Per FTA guidance, MBTA calculated the FY 2018 baseline measure for each category by dividing the annual average
track miles with performance restrictions by the total directional route miles for each category. The FY 2019
performance targets use this baseline as a starting point, and reflect a modest improvement to performance due to
anticipated capital investment in FY 2019.
The MBTA has several track renewal and rehabilitation programs underway, including full depth reconstruction of a
segment of the Green Line - D Branch and track infrastructure improvements to the Orange, Green, and Red Lines.
Report of the Performance and Asset Management Advisory Council: Progress by MassDOT Highway Division on Integrated Asset Management
20
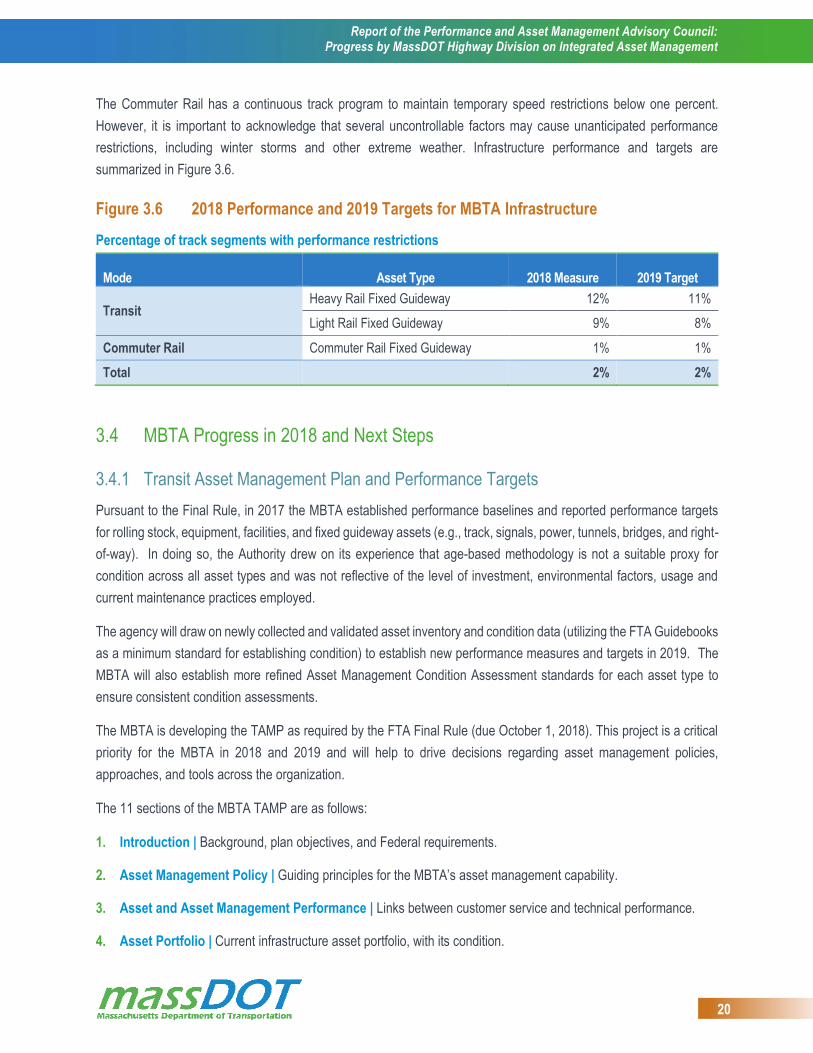
The Commuter Rail has a continuous track program to maintain temporary speed restrictions below one percent.
However, it is important to acknowledge that several uncontrollable factors may cause unanticipated performance
restrictions, including winter storms and other extreme weather. Infrastructure performance and targets are
summarized in Figure 3.6.
Figure 3.6 2018 Performance and 2019 Targets for MBTA Infrastructure
Percentage of track segments with performance restrictions
Mode Asset Type 2018 Measure 2019 Target
Transit Heavy Rail Fixed Guideway 12% 11%
Light Rail Fixed Guideway 9% 8%
Commuter Rail Commuter Rail Fixed Guideway 1% 1%
Total 2% 2%
3.4 MBTA Progress in 2018 and Next Steps
3.4.1 Transit Asset Management Plan and Performance Targets
Pursuant to the Final Rule, in 2017 the MBTA established performance baselines and reported performance targets
for rolling stock, equipment, facilities, and fixed guideway assets (e.g., track, signals, power, tunnels, bridges, and right-
of-way). In doing so, the Authority drew on its experience that age-based methodology is not a suitable proxy for
condition across all asset types and was not reflective of the level of investment, environmental factors, usage and
current maintenance practices employed.
The agency will draw on newly collected and validated asset inventory and condition data (utilizing the FTA Guidebooks
as a minimum standard for establishing condition) to establish new performance measures and targets in 2019. The
MBTA will also establish more refined Asset Management Condition Assessment standards for each asset type to
ensure consistent condition assessments.
The MBTA is developing the TAMP as required by the FTA Final Rule (due October 1, 2018). This project is a critical
priority for the MBTA in 2018 and 2019 and will help to drive decisions regarding asset management policies,
approaches, and tools across the organization.
The 11 sections of the MBTA TAMP are as follows:
1. Introduction | Background, plan objectives, and Federal requirements.
2. Asset Management Policy | Guiding principles for the MBTA’s asset management capability.
3. Asset and Asset Management Performance | Links between customer service and technical performance.
4. Asset Portfolio | Current infrastructure asset portfolio, with its condition.

Report of the Performance and Asset Management Advisory Council: Progress by MassDOT Highway Division on Integrated Asset Management
21
5. Risk Management | Risk definitions, management options, and monitoring approach.
6. Lifecycle Management Strategies | Approaches including maintenance, overhaul, and replacement.
7. Work Plans and Budget Forecasts
8. Asset Management Practices | Organizational structure, business processes, and technology.
9. Improvement Actions | Individual actions and program for continuous improvement.
10. Interdependencies | Internal (MBTA departments) and external entities (e.g. Amtrak, MassDOT, and others).
11. Appendices | Further information on each asset class, lifecycle strategies, and unconstrained work plans to
achieve a state of good repair.
In parallel with the TAMP, the MBTA is also developing a TAM Improvement Program, consisting of recommended
improvements to the agencies TAM business practices in alignment with global best practices and international
standards.
3.4.2 Asset Management Governance
The MBTA has established an Asset Management Governance Board consisting of senior MBTA leadership to
complement PAMAC to define, enforce, and resource the TAM program throughout the agency. This council consists
of representatives from across the MBTA, including the General Manager, the Deputy General Manager, and all key
leadership direct reports.
Guiding the MBTA’s asset management program, plans, and strategies are seven core principles aligned to each of
the organization’s strategic objectives and priorities:
Focus on State-of-Good Repair | We will work to bring all of the MBTA’s assets, including fleets and facilities,
to a state-of-good-repair within 15 years.
Transparency | We will ensure that all decisions are data-driven, transparent, and consistent, enabling us to
clearly demonstrate the prioritized investments across asset classes.
Efficient and Effective Delivery | We will work to meet or exceed service delivery goals by ensuring necessary
work to maintain service is undertaken for all MBTA assets and opportunities for improving service delivery are
considered.
Cognizance of Risk | We will effectively identify, prioritize, and manage asset and asset-related risks, including
safety, reliability, financial, performance, and climate-related risk.
Fiscal Responsibility | We will continue and sustain the MBTA’s fiscal discipline by optimizing available
resources through lifecycle management, reliability-centered maintenance, business process improvements, and
the adoption of other best practices.
Report of the Performance and Asset Management Advisory Council: Progress by MassDOT Highway Division on Integrated Asset Management
22
Social Responsibility | We will work to build the confidence and trust of all internal and external stakeholders
demonstrating good practice in all we do.
Industry Leadership | As one of the largest agencies in the US, we will work to both achieve compliance with
Federal and State requirements and serve as a leader among peer agencies.
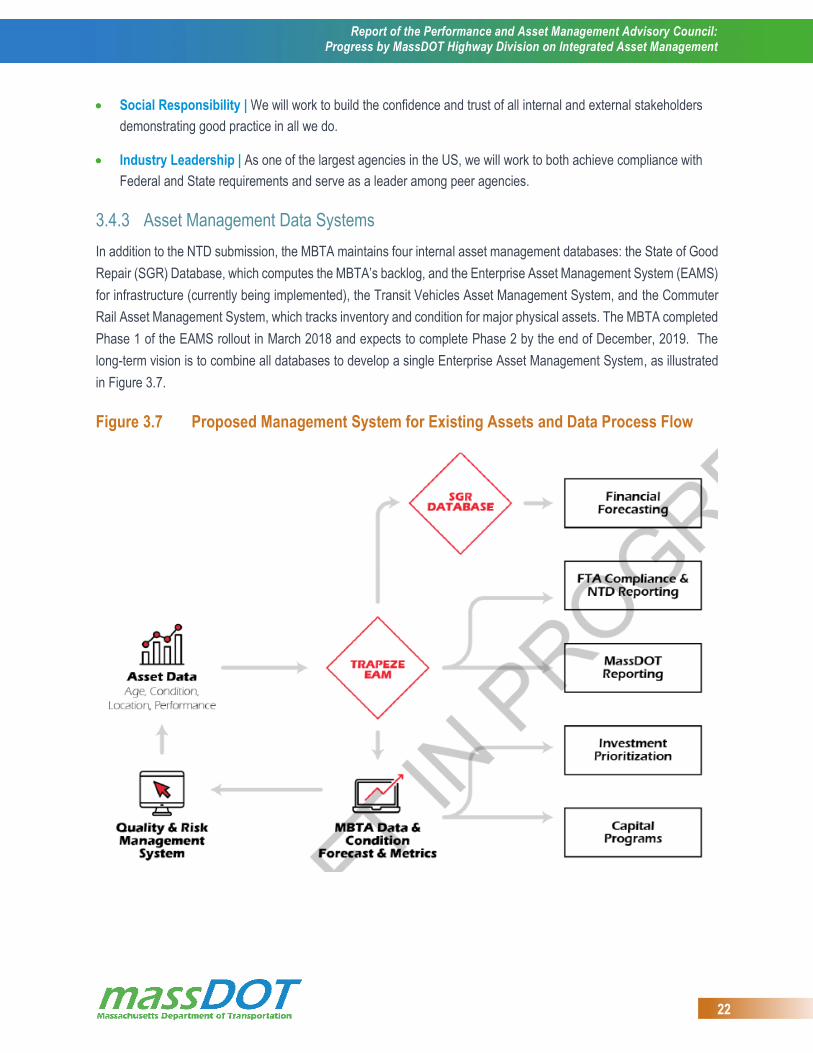
3.4.3 Asset Management Data Systems
In addition to the NTD submission, the MBTA maintains four internal asset management databases: the State of Good
Repair (SGR) Database, which computes the MBTA’s backlog, and the Enterprise Asset Management System (EAMS)
for infrastructure (currently being implemented), the Transit Vehicles Asset Management System, and the Commuter
Rail Asset Management System, which tracks inventory and condition for major physical assets. The MBTA completed
Phase 1 of the EAMS rollout in March 2018 and expects to complete Phase 2 by the end of December, 2019. The
long-term vision is to combine all databases to develop a single Enterprise Asset Management System, as illustrated
in Figure 3.7.
Figure 3.7 Proposed Management System for Existing Assets and Data Process Flow

Report of the Performance and Asset Management Advisory Council: Progress by MassDOT Highway Division on Integrated Asset Management
23
4. 0 Rail and Transit Division
The MassDOT Rail and Transit Division oversees and funds the rail and transit networks outside of the MBTA’s service
area. It both owns and oversees railroad used for passenger and freight service. It also collaborates with 15 regional
transit authorities (RTAs) that use buses, vans and paratransit vehicles to provide 29 million annual passenger trips on
282 routes in 231 communities. A map of the RTA’s service area is provided in Figure 4.1.
Figure 4.1 Regional Transit Authorities (RTAs) in Massachusetts
The Rail and Transit Division also administers Federal Transit Administration (FTA) Section 5310 Enhanced Mobility
of Seniors and Individuals with Disabilities funds and state Mobility Assistance Program (MAP) funds through the
annual Community Transit Grant Program (CTGP). Recipients of this funding include the RTAs, private non-profit
organizations, municipal governments, and private taxi services (including Uber and Lyft).
Report of the Performance and Asset Management Advisory Council: Progress by MassDOT Highway Division on Integrated Asset Management
24
4.1 Rail and Transit Division Assets
4.1.1 Rail Assets
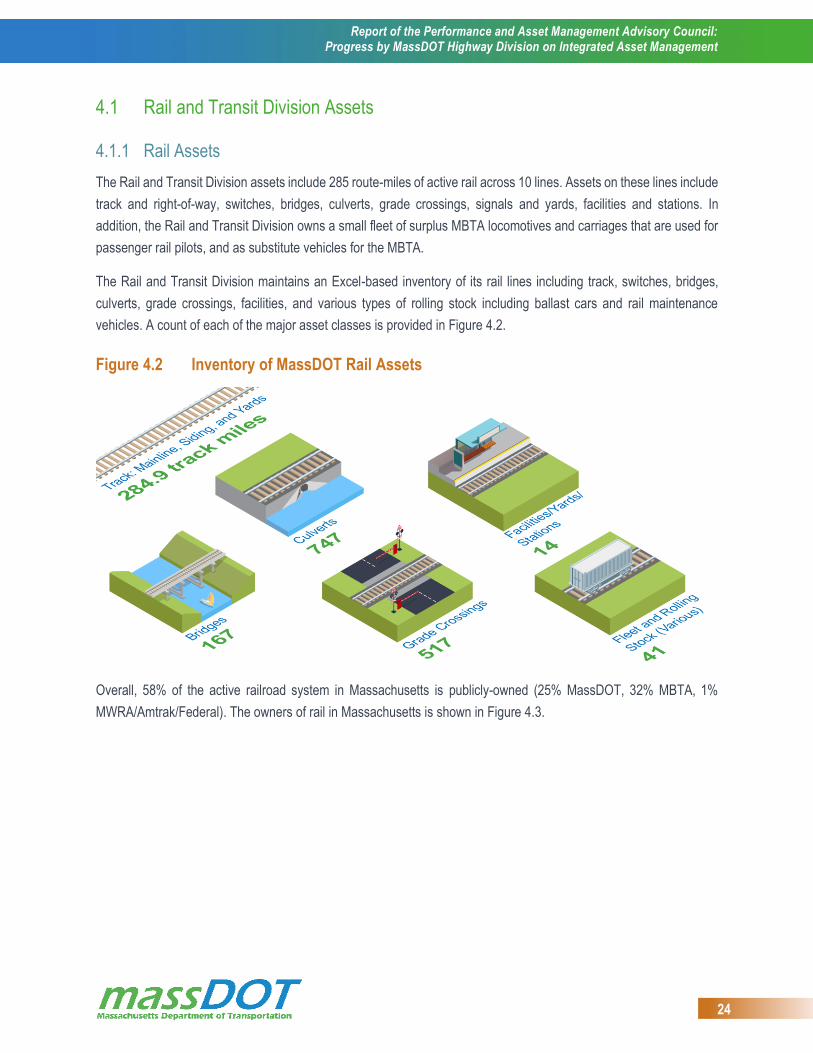
The Rail and Transit Division assets include 285 route-miles of active rail across 10 lines. Assets on these lines include
track and right-of-way, switches, bridges, culverts, grade crossings, signals and yards, facilities and stations. In
addition, the Rail and Transit Division owns a small fleet of surplus MBTA locomotives and carriages that are used for
passenger rail pilots, and as substitute vehicles for the MBTA.
The Rail and Transit Division maintains an Excel-based inventory of its rail lines including track, switches, bridges,
culverts, grade crossings, facilities, and various types of rolling stock including ballast cars and rail maintenance
vehicles. A count of each of the major asset classes is provided in Figure 4.2.
Figure 4.2 Inventory of MassDOT Rail Assets
Overall, 58% of the active railroad system in Massachusetts is publicly-owned (25% MassDOT, 32% MBTA, 1%
MWRA/Amtrak/Federal). The owners of rail in Massachusetts is shown in Figure 4.3.

Report of the Performance and Asset Management Advisory Council: Progress by MassDOT Highway Division on Integrated Asset Management
25
Figure 4.3 Ownership of Active Rail Lines in Massachusetts
4.1.2 Transit Assets
Transit assets overseen by MassDOT include:
Vehicles for mobility assistance | The Community Transit Grant Program (CTGP) utilizes Section 5310 and
Mobility Assistance Program (MAP) funds to purchase accessible vehicles to meet the statewide needs of
seniors and persons with disabilities (operated by the RTAs, Council on Aging and eligible non-profit
organizations). In general, these vehicles are vans or cutaway (short) buses.
Intercity buses | MassDOT owns a fleet of intercity buses that are operated by private companies to improve
regional and intercity transportation throughout the Commonwealth.
RTA assets | The 15 RTAs own revenue vehicles (for fixed-route and demand response service), non-revenue
vehicles and facilities.
As recipients of Federal funding, MassDOT and the RTAs must complete a Transit Asset Management (TAM) plan
including an inventory of capital assets by October 2018. Asset inventories must include rolling stock, facilities and
equipment (non-revenue support-service vehicles, maintenance vehicles and equipment over $50,000 in acquisition
value). Condition assessments must be included for any asset for which an agency has direct capital responsibility.
MassDOT uses the GrantsPlus grant tracking software to keep this inventory for mobility assistance vehicles and
intercity buses.
Report of the Performance and Asset Management Advisory Council: Progress by MassDOT Highway Division on Integrated Asset Management
26
Several RTAs have adopted TransAM, an open-source asset management platform for managing transportation
assets. The system contains an inventory of revenue and support vehicles, facilities and equipment, including age and
condition, and can forecast SGR and compute backlog. Other RTAs have adopted and implemented other tools and
strategies to meet Federal requirements.
4.2 Investment in the Rail and Transit Division
4.2.1 Investment in Rail
MassDOT’s investment in rail in 2018 has produced notable results. Some examples of particularly visible investments
include:
Framingham/Middleborough Line Improvements | Since purchasing the Framingham/Middleborough Line in
2015, MassDOT has embarked on an aggressive improvement program, including track replacement, culvert
replacement, bridge improvement, and grade crossing improvement and replacement. Taken together, this
program has raised the line to Class III and to a load rating of 286,000 lb per car (“286K”), the national standard
for freight rail. In addition, a section of the line has been prepared for use by a pilot MBTA service to Foxborough
and nine miles have been de-stressed with joint elimination work.
Industrial Rail Access Program (IRAP) | MassDOT has recently awarded its sixth round of IRAP funding. IRAP
is a public-private partnership that combines funding to help eligible applicants invest in industry-based freight
rail infrastructure improvement projects. The goals of the program are to stimulate economic development, grow
Massachusetts corporations, keep manufacturing jobs and create new jobs through increased efficiency,
production capacity, and improved distribution logistics. IRAP VI will invest $1.8 million in public funds – matched
to $2.4 million in private funds – in five projects:
− Western Recycling Rail Spur Project | Wilbraham | $500,000.
− Middlesex Corporation Concrete Plant Siding Restoration | Littleton | $500,000.
− Patriot Beverage/Injection Molding Enterprise Siding Extension Project | Littleton | $500,000.
− Rousselot Gelatin Rail Extension Project | Peabody | $221,640.
− Grafton and Upton Railroad Bulk Liquid Transloading Railyard Expansion Project | Upton | $133,045.
Eastern Massachusetts Capital Improvements | MassDOT recently completed the following capital
improvements throughout the eastern part of the Commonwealth:
− Installed 73,459 new ties and 1,684 switch timbers.
− 50,170 tons of ballast and 212,243 track-feet of tamping/surfacing.
− Crossing reconstruction was completed at 12 locations.
− 3,400 TF of track reconstruction completed .
Report of the Performance and Asset Management Advisory Council: Progress by MassDOT Highway Division on Integrated Asset Management
27
− Bridge repairs were completed on the Framingham Secondary and the Middleboro Subdivision.
− Four culvert replacement were completed along the Watuppa Branch.
Western Massachusetts Capital Improvements | MassDOT recently completed the following capital
improvements throughout the western part of the Commonwealth:
− Knowledge Corridor | Installed 5,000 ties, installed 1 mile of CWR, installed 3 turnouts, surfaced 5 miles of
track, inspected 10 bridges and completed 30 miles of brush cutting.
− Berkshire Line | Installed 1,000 ties, installed timber bridge caps at 2 bridges, inspected 130 culverts, 53
public and private grade crossings, completed 37 miles of brush cutting and rehabilitated 1 grade crossing.
− Adams Branch | Installed 1 mile of track and completed 8 miles of brush cutting.
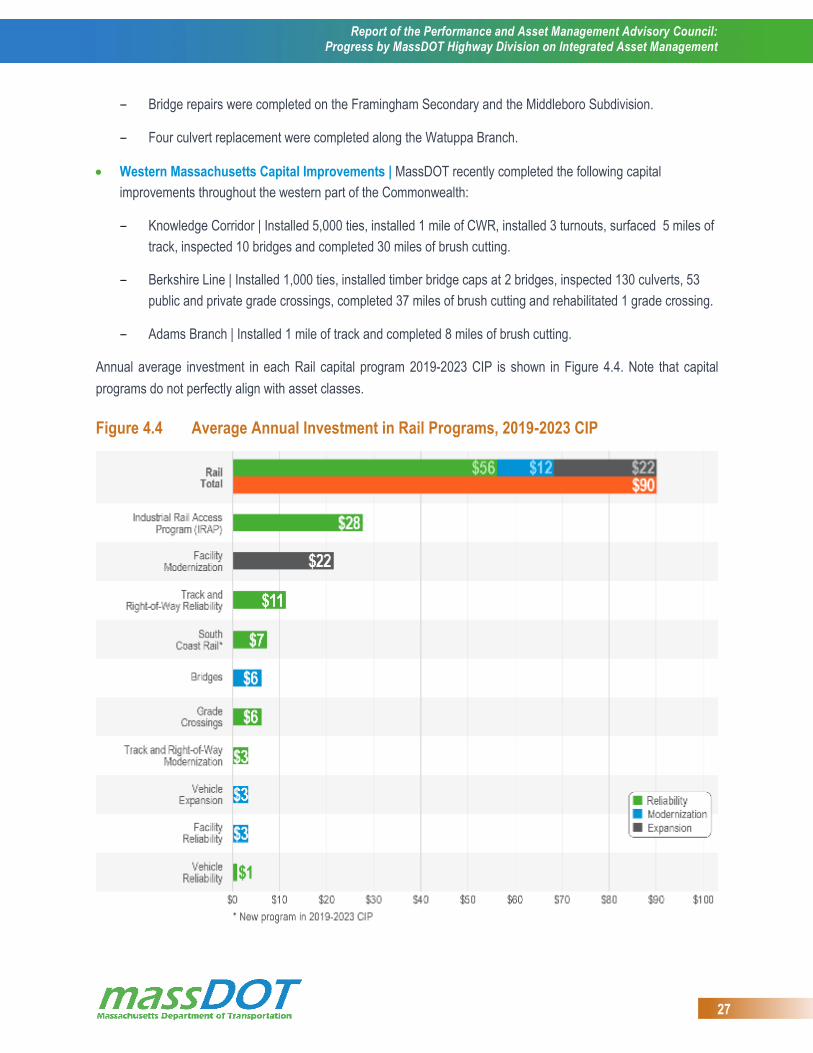
Annual average investment in each Rail capital program 2019-2023 CIP is shown in Figure 4.4. Note that capital
programs do not perfectly align with asset classes.
Figure 4.4 Average Annual Investment in Rail Programs, 2019-2023 CIP

Report of the Performance and Asset Management Advisory Council: Progress by MassDOT Highway Division on Integrated Asset Management
28
4.2.2 Investment in Transit
MassDOT’s investment in transit in 2018 has produced notable results. Some examples of these investments include:
FY18 RTA Vehicle Replacement | MassDOT contributed $14.5 Million to replace 179 RTA vehicles (136 buses
and 43 minibuses).
SFY18 CTGP Vehicle Replacement | MassDOT awarded 153 replacement vehicles to RTAs, private non-profit
organizations and municipal governments.
Annual average investment in each Transit capital program 2019-2023 CIP is shown in Figure 4.5. Note that capital
programs do not perfectly align with asset classes.
Figure 4.5 Average Annual Investment in Transit Programs, 2019-2023 CIP
4.3 Asset Performance and Forecasts in the Rail and Transit Division
4.3.1 Performance and Forecasts for Rail
MassDOT has reviewed and refined existing rail inventory and condition data to perform an initial assessment of its
current portfolio. The condition evaluation considered a variety of factors as available including: age, maintenance
history, visual assessment, and remaining life. Based on preliminary analysis, MassDOT has profiled the average age
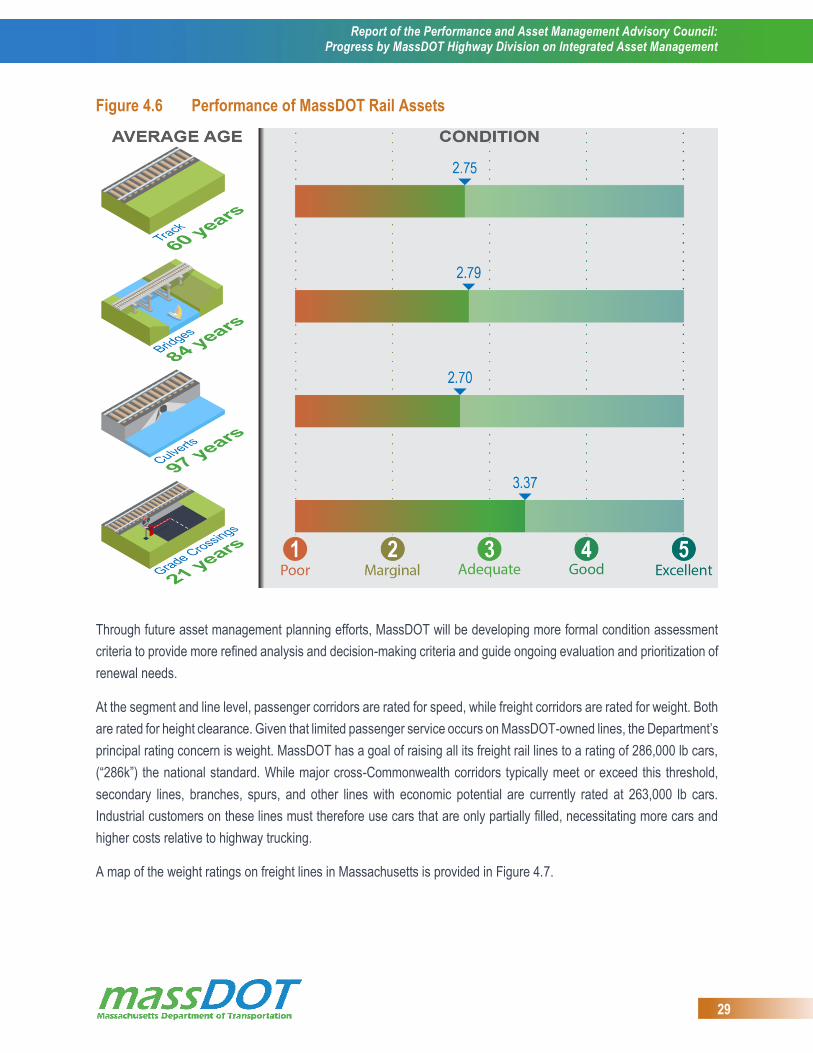
and condition of its assets and will be developing estimated funding forecasts, as summarized in Figure 4.6.
Report of the Performance and Asset Management Advisory Council: Progress by MassDOT Highway Division on Integrated Asset Management
29
Figure 4.6 Performance of MassDOT Rail Assets
Through future asset management planning efforts, MassDOT will be developing more formal condition assessment
criteria to provide more refined analysis and decision-making criteria and guide ongoing evaluation and prioritization of
renewal needs.
At the segment and line level, passenger corridors are rated for speed, while freight corridors are rated for weight. Both
are rated for height clearance. Given that limited passenger service occurs on MassDOT-owned lines, the Department’s
principal rating concern is weight. MassDOT has a goal of raising all its freight rail lines to a rating of 286,000 lb cars,
(“286k”) the national standard. While major cross-Commonwealth corridors typically meet or exceed this threshold,
secondary lines, branches, spurs, and other lines with economic potential are currently rated at 263,000 lb cars.
Industrial customers on these lines must therefore use cars that are only partially filled, necessitating more cars and
higher costs relative to highway trucking.
A map of the weight ratings on freight lines in Massachusetts is provided in Figure 4.7.

Report of the Performance and Asset Management Advisory Council: Progress by MassDOT Highway Division on Integrated Asset Management
30
Figure 4.7 Freight Rail Lines in Massachusetts by Weight Rating
4.3.2 Performance and Forecasts for Transit
MassDOT and the RTAs are required to develop Transit Asset Management (TAM) plans and submit their performance
measures and target to the National Transit Database (NTD) by October 2018. The specific TAM Plan elements that
are required depend on the category of provider (Tier I or II).
In 2012, MAP-21 mandated FTA to develop a rule establishing a strategic and systematic process of operating,
maintaining, and improving public capital assets effectively through their entire life cycle. The TAM Final Rule
established age-based measures for rolling stock and equipment, condition-based measures for facilities and
performance-based measures for fixed guideway assets as a minimum standard for transit operators.
Performance of MassDOT Transit Assets
MassDOT holds the title for mobility assistance vehicles and intercity buses, though they are all operated by others.
MassDOT has defined a ULB of 5 years/100,000 miles (whichever comes first) for vans and 7 years/150,000 miles for
Report of the Performance and Asset Management Advisory Council: Progress by MassDOT Highway Division on Integrated Asset Management
31
cutaways (whichever comes first). By rule, MassDOT does not hold title for vehicles older than these benchmarks –
the title is released to the operator. To reflect this practice, MassDOT has set a performance metric of 0% of MassDOT
transit revenue vehicles exceed ULB.
4.4 Rail and Transit Division Progress in 2018 and Next Steps
4.4.1 Continued Development of Rail Asset Management
In 2017 and 2018, MassDOT has developed a full inventory and condition database for its rail assets. In 2019,
MassDOT will further develop its rail asset management practice by evaluating performance measurement approaches
and forecasting opportunities. In addition, MassDOT is working to hire project managers who will identify improvements
that are necessary on lines, advocate for resources, and manage improvement projects through completion.
4.4.2 Completion of Transit Asset Management Plans and Targets
MassDOT and the RTAs will complete TAM Plans by October, 2018. Information in these plans will be reviewed and
presented to the Council, along with performance targets, in the 2019 PAMAC Annual Report.
Report of the Performance and Asset Management Advisory Council: Progress by MassDOT Highway Division on Integrated Asset Management
32
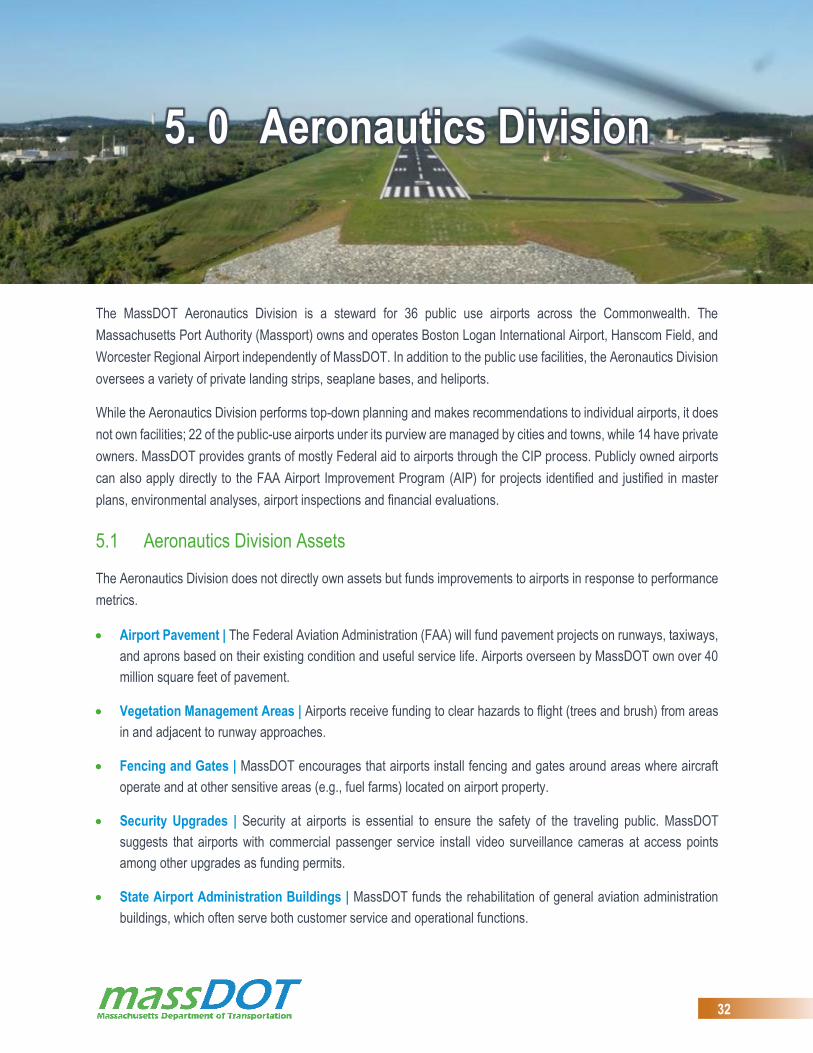
5. 0 Aeronautics Division
The MassDOT Aeronautics Division is a steward for 36 public use airports across the Commonwealth. The
Massachusetts Port Authority (Massport) owns and operates Boston Logan International Airport, Hanscom Field, and
Worcester Regional Airport independently of MassDOT. In addition to the public use facilities, the Aeronautics Division
oversees a variety of private landing strips, seaplane bases, and heliports.
While the Aeronautics Division performs top-down planning and makes recommendations to individual airports, it does
not own facilities; 22 of the public-use airports under its purview are managed by cities and towns, while 14 have private
owners. MassDOT provides grants of mostly Federal aid to airports through the CIP process. Publicly owned airports
can also apply directly to the FAA Airport Improvement Program (AIP) for projects identified and justified in master
plans, environmental analyses, airport inspections and financial evaluations.
5.1 Aeronautics Division Assets
The Aeronautics Division does not directly own assets but funds improvements to airports in response to performance
metrics.
Airport Pavement | The Federal Aviation Administration (FAA) will fund pavement projects on runways, taxiways,
and aprons based on their existing condition and useful service life. Airports overseen by MassDOT own over 40
million square feet of pavement.
Vegetation Management Areas | Airports receive funding to clear hazards to flight (trees and brush) from areas
in and adjacent to runway approaches.
Fencing and Gates | MassDOT encourages that airports install fencing and gates around areas where aircraft
operate and at other sensitive areas (e.g., fuel farms) located on airport property.
Security Upgrades | Security at airports is essential to ensure the safety of the traveling public. MassDOT
suggests that airports with commercial passenger service install video surveillance cameras at access points
among other upgrades as funding permits.
State Airport Administration Buildings | MassDOT funds the rehabilitation of general aviation administration
buildings, which often serve both customer service and operational functions.

Report of the Performance and Asset Management Advisory Council: Progress by MassDOT Highway Division on Integrated Asset Management
33
5.2 Investment in the Aeronautics Division
Massachusetts relies heavily on matching grants from the FAA’s AIP, as do all states. Recognizing that not all airport
sponsors are eligible for Federal funding, MassDOT initiated the Airport Safety and Maintenance Program (ASMP),
which can provide state-funded grants-in-aid to close the funding gap for these sponsors.
The ASMP serves to leverage funds for safety, maintenance, and security projects that have been selected for the CIP.
ASMP typically supports a state share of 80% and a local airport share of 20% with no Federal participation. These
projects are often routine maintenance that address deficiencies noted in MassDOT airport inspections (such as
pavement condition, security issues and vegetation overgrowth). Airport planning, new construction and equipment
grants are also eligible.
Planned annual average investment in each asset class from 2019-2023 is shown in Figure 5.1.
Figure 5.1 Average Annual Aeronautics Division Capital Investments, 2019-2023
5.3 Asset Performance and Forecasts in the Aeronautics Division
Pavement represents one of the largest capital investments in the Massachusetts statewide airport system, and the
condition of these pavements is important both from cost-effectiveness and safety standpoints. Timely airport pavement
maintenance and rehabilitation are crucial because repairs are much more costly once the condition deteriorates below
a certain level. Additionally, airport pavement weaknesses, such as cracks and loose debris, pose a significant safety
risk to aircraft.
The FAA requires that pavements be inspected every three to five years. A new statewide pavement assessment was
completed by an outside contractor in June, 2017, with the next scheduled for 2020 and every three years thereafter.
In 2018 and in other intervening years, MassDOT Aeronautics staff complete annual in-house assessments.
A web portal for airport pavement condition data provides both summaries of statewide pavement condition by airport
type and pavement use. It also provides an interactive pavement viewer for all MassDOT-sponsored airports which
color-codes a map of all pavement at each facility and representative photographs, as shown in Figure 5.2.
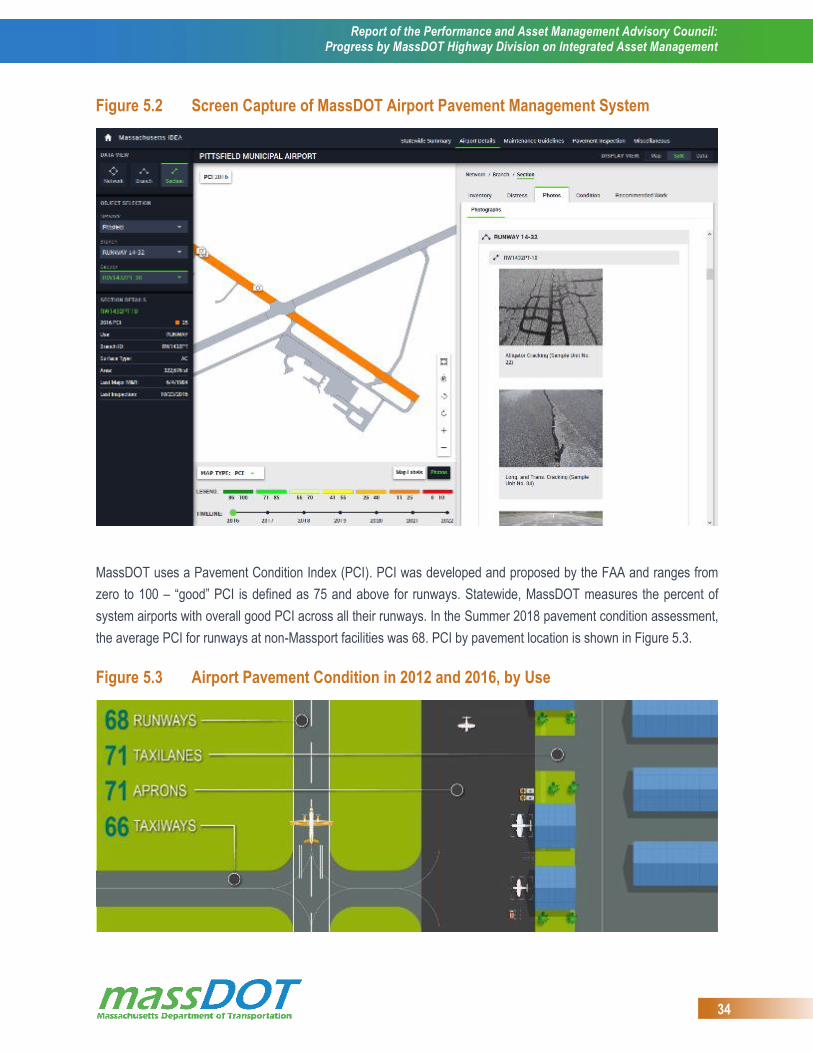
Report of the Performance and Asset Management Advisory Council: Progress by MassDOT Highway Division on Integrated Asset Management
34
Figure 5.2 Screen Capture of MassDOT Airport Pavement Management System
MassDOT uses a Pavement Condition Index (PCI). PCI was developed and proposed by the FAA and ranges from
zero to 100 – “good” PCI is defined as 75 and above for runways. Statewide, MassDOT measures the percent of
system airports with overall good PCI across all their runways. In the Summer 2018 pavement condition assessment,
the average PCI for runways at non-Massport facilities was 68. PCI by pavement location is shown in Figure 5.3.
Figure 5.3 Airport Pavement Condition in 2012 and 2016, by Use
Report of the Performance and Asset Management Advisory Council: Progress by MassDOT Highway Division on Integrated Asset Management
35
MassDOT has collaboratively set the following performance targets for airport PCI:
70 in 2020.
72 in 2022.
75 in the long-term.
5.4 Aeronautics Division Next Steps
The Aeronautics Division is planning an update to the Massachusetts Statewide Airport System Plan in FY2019. This
update will:
Extensively assess the current statewide airport system.
Assess current and future deficiencies in the system.
Establish a long-term vision for the system and guidelines to continue its successful development.
Plan for meeting the current and future needs of the system while evaluating the impact of new technologies
related to aviation.
The development of goals and measurements is a critical step in the system planning process. The SASP will capture
a level of data that enables MassDOT to make informed decisions. Once a vision has been established, the SASP will
identify specific and individual system goals that will direct and track progress toward that vision and will ultimately
produce a benchmarking system for potential projects.
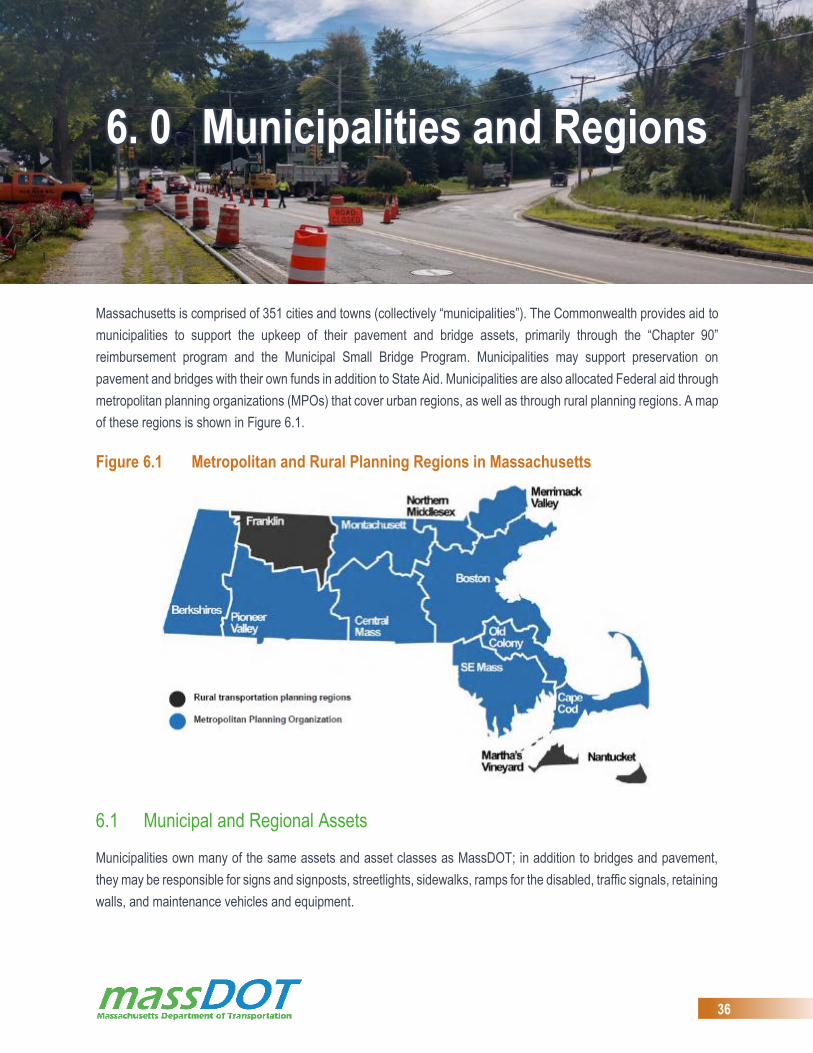
Report of the Performance and Asset Management Advisory Council: Progress by MassDOT Highway Division on Integrated Asset Management
36
6. 0 Municipalities and Regions
Massachusetts is comprised of 351 cities and towns (collectively “municipalities”). The Commonwealth provides aid to
municipalities to support the upkeep of their pavement and bridge assets, primarily through the “Chapter 90”
reimbursement program and the Municipal Small Bridge Program. Municipalities may support preservation on
pavement and bridges with their own funds in addition to State Aid. Municipalities are also allocated Federal aid through
metropolitan planning organizations (MPOs) that cover urban regions, as well as through rural planning regions. A map
of these regions is shown in Figure 6.1.
Figure 6.1 Metropolitan and Rural Planning Regions in Massachusetts
6.1 Municipal and Regional Assets
Municipalities own many of the same assets and asset classes as MassDOT; in addition to bridges and pavement,
they may be responsible for signs and signposts, streetlights, sidewalks, ramps for the disabled, traffic signals, retaining
walls, and maintenance vehicles and equipment.

Report of the Performance and Asset Management Advisory Council: Progress by MassDOT Highway Division on Integrated Asset Management
37
6.1.1 Municipal Pavement
Of the 72,700 lane-miles of pavement in Massachusetts, 56,000 are owned by municipalities. 2,400 of these are on
the NHS, approximately 25% of the overall system in the Commonwealth. 28% of the total is in communities in the top
ten statewide by lane-mileage. The distribution of municipal NHS pavement is shown in Figure 6.2.
Figure 6.2 Municipal NHS Lane Miles by Town
MassDOT collects a biannual condition survey of the entire NHS regardless of owner, and condition data for the
municipal NHS are stored with MassDOT’s own dataset. In addition, communities collect their own condition data for
both NHS and the much larger non-NHS subsets of their road networks in their own pavement management systems
(PMS). Of the 351 cities and towns in Massachusetts, 142 responded to the MMA IN 2017 that they currently operate
a PMS. An additional 82 responded to the MMA that they do not, and 127 did not respond to the survey.
6.1.2 Municipal Bridges
In addition to the distinction between bridges located on and off the NHS, municipal bridges are divided by size. As for
structures owned by MassDOT, FHWA distinguishes bridges with a span length in excess of 20 feet as National Bridge
Inventory (NBI) bridges. MassDOT refers to those between 10 and 20 feet as “BRI” or “small” bridges, and those
between 4 and 10 feet as culverts.

Report of the Performance and Asset Management Advisory Council: Progress by MassDOT Highway Division on Integrated Asset Management
38
In contrast to pavement, the strong majority of NBI deck area in the Commonwealth is owned by MassDOT – 4 million
of 37 million square feet are owned by municipalities. In another contrast to pavement, municipal bridge area is
concentrated away from Boston (96% of BRIs are located outside of District 6), as shown in Figure 6.3. It should be
noted that many bridges cross waterways that define the borders of communities, so square footage for each
community is approximate.
Figure 6.3 Municipal NBI Deck Area by Town
MassDOT’s goal is to inspect small bridges with the same biannual frequency as is required for NBIs (which have a
20-foot span length or greater), and the initial round of statewide inspections is underway. There are currently 1,464
known small bridge locations in the state (this number is updated periodically due to field confirmation), with
approximately 1,000 owned by municipalities, and the remainder owned by MassDOT.
The overall inventory is 99% complete (up from 64% last year). Based on current data, approximately 15% of
municipally-owned small bridges are rated poor. The progress of BRI inspections is shown in Figure 6.4.
Figure 6.4 BRI Inspection Progress, 2016 to 2018
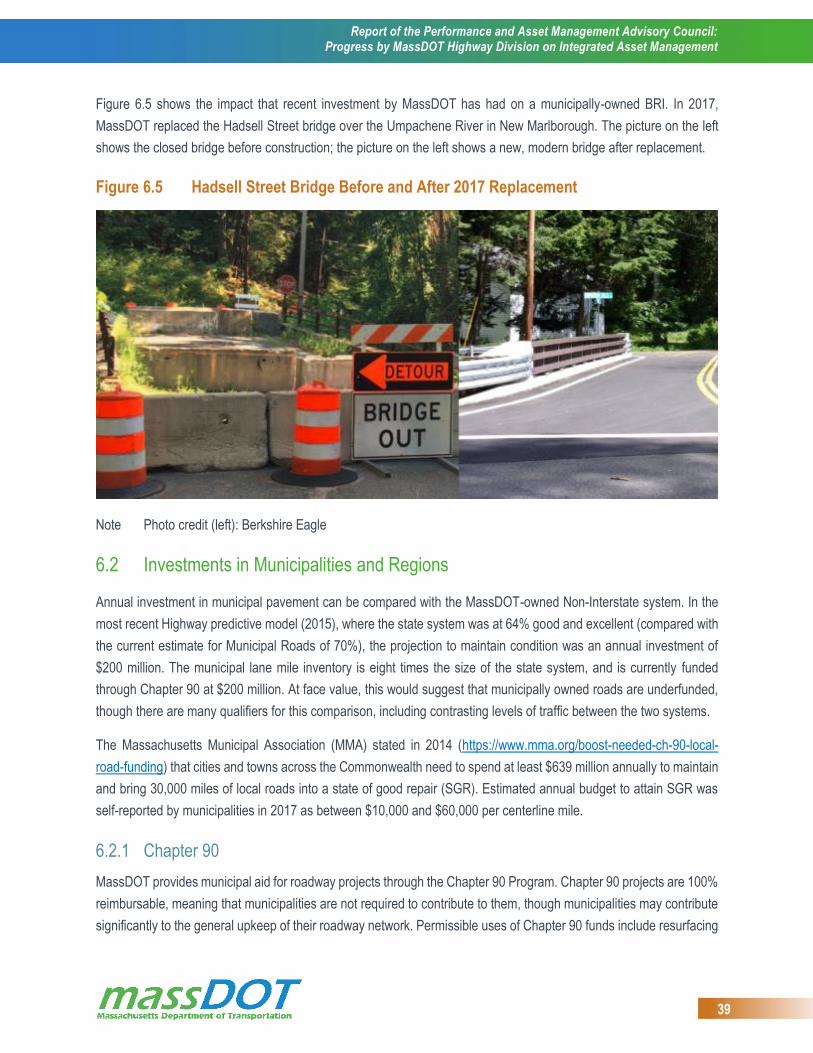
Report of the Performance and Asset Management Advisory Council: Progress by MassDOT Highway Division on Integrated Asset Management
39
Figure 6.5 shows the impact that recent investment by MassDOT has had on a municipally-owned BRI. In 2017,
MassDOT replaced the Hadsell Street bridge over the Umpachene River in New Marlborough. The picture on the left
shows the closed bridge before construction; the picture on the left shows a new, modern bridge after replacement.
Figure 6.5 Hadsell Street Bridge Before and After 2017 Replacement
Note Photo credit (left): Berkshire Eagle
6.2 Investments in Municipalities and Regions
Annual investment in municipal pavement can be compared with the MassDOT-owned Non-Interstate system. In the
most recent Highway predictive model (2015), where the state system was at 64% good and excellent (compared with
the current estimate for Municipal Roads of 70%), the projection to maintain condition was an annual investment of
$200 million. The municipal lane mile inventory is eight times the size of the state system, and is currently funded
through Chapter 90 at $200 million. At face value, this would suggest that municipally owned roads are underfunded,
though there are many qualifiers for this comparison, including contrasting levels of traffic between the two systems.
The Massachusetts Municipal Association (MMA) stated in 2014 (https://www.mma.org/boost-needed-ch-90-local-
road-funding) that cities and towns across the Commonwealth need to spend at least $639 million annually to maintain
and bring 30,000 miles of local roads into a state of good repair (SGR). Estimated annual budget to attain SGR was
self-reported by municipalities in 2017 as between $10,000 and $60,000 per centerline mile.
6.2.1 Chapter 90
MassDOT provides municipal aid for roadway projects through the Chapter 90 Program. Chapter 90 projects are 100%
reimbursable, meaning that municipalities are not required to contribute to them, though municipalities may contribute
significantly to the general upkeep of their roadway network. Permissible uses of Chapter 90 funds include resurfacing
Report of the Performance and Asset Management Advisory Council: Progress by MassDOT Highway Division on Integrated Asset Management
40
and related work (e.g., bridges, right-of-way acquisition, shoulders, side road approaches, landscaping, drainage,
sidewalk, traffic control and service facilities, and lighting).
Municipalities are allocated Chapter 90 funds based a composite of three factors:
Road miles – 58.33%.
Population – 20.83%.
Employment – 20.83%.
After the total apportionment for a city or town is calculated, municipalities apply for reimbursement against it on a
project-by-project basis.
6.2.2 Municipal Small Bridge Program
As small bridges are not recognized by the Federal Government, they are not eligible for Federal Funding. To close
this gap, the Legislature has established the Municipal Small Bridge Program at $50 million over five years. The
municipality is responsible for procuring a pre-approved designer, securing right-of-way, securing permits, procuring a
pre-approved contractor, and administrating the construction contract. MassDOT’s only responsibility is to select the
projects and reimburse the funds spent up to a $500,000 maximum per sponsor.


