Membrane distillation is an emerging membrane pro-cess based on evaporation of a volatile solvent. One of its often stated advantages is the low flux sensitivity toward concentration of the processed fluid, in contrast to reverse osmosis. In the present paper, we looked at 2 high-solids applications of the dairy industry: skim milk and whey. Performance was assessed under various hydrodynamic conditions to investigate the feasibility of fouling mitigation by changing the operating param-eters and to compare performance to widespread mem-brane filtration processes. Whereas filtration processes are hydraulic pressure driven, membrane distillation uses vapor pressure from heat to drive separation and, therefore, operating parameters have a different bear-ing on the process. Experimental and calculated results identified factors influencing heat and mass transfer under various operating conditions using polytetra-fluoroethylene flat-sheet membranes. Linear velocity was found to influence performance during skim milk processing but not during whey processing. Lower feed and higher permeate temperature was found to reduce fouling in the processing of both dairy solutions. Concentration of skim milk and whey by membrane distillation has potential, as it showed high rejection (>99%) of all dairy components and can operate us-ing low electrical energy and pressures (<10 kPa). At higher cross-flow velocities (around 0.141 m/s), fluxes were comparable to those found with reverse osmosis, achieving a sustainable flux of approximately 12 kg/h·m2 for skim milk of 20% dry matter concentration and approximately 20 kg/h·m2 after 18 h of operation with whey at 20% dry matter concentration. Key words: membrane distillation , milk concentra-tion , whey concentration , membrane performance
INTRODUCTION
Membrane distillation (MD) is a new membrane process that is thermally driven and can use low-grade waste or solar heat and can be integrated into indus-try heat paths (Hausmann et al., 2012). A hydropho-bic membrane ensures that only water in the vapor state can pass through the membrane driven by the vapor pressure gradient between feed and permeate side. Its ability to use waste heat is advantageous for concentration applications, especially considering that concentration and drying are the most energy-intensive operations in the dairy industry (Ramírez et al., 2006).
Preconcentration before powder production via spray drying is currently performed using reverse osmosis (RO) and evaporation. The use of MD is proposed to potentially improve the cost and primary energy ef-ficiency of the process. Reverse osmosis has low specific energy requirements but the separation function re-quires electrical energy, whereas MD can use low-grade thermal energy (Hanemaaijer et al., 2006). Compared with evaporation, the ability of MD to operate at low temperatures can also be advantageous for heat-sensitive dairy components. Because only vapor crosses the membrane, MD is capable of producing high-purity water without being influenced by feed stream con-centration. Reverse osmosis performance, on the other hand, is directly influenced by concentration in terms of flux as well as retention, whereas evaporation en-thalpy is hardly influenced by concentration. However, the water produced by normal evaporation operations is often contaminated, as the vapor may carry small droplets of liquid that contain contaminants (Sääsk, 2009). Advantages of MD over evaporation include the ability to avoid this due to the membrane barrier, leading to high-quality product water. Also, the smaller vapor space indicates that MD can offer a much larger area for evaporation with a given footprint and the contained feed channel results in liquid velocities that can be sustained without surface instabilities (Nii et al., 2002).
Performance assessment of membrane distillation for skim milk and whey processing Angela Hausmann ,* Peter Sanciolo ,* Todor Vasiljevic ,† Ulrich Kulozik ,‡ and Mikel Duke *1
* Institute for Sustainability and Innovation, College of Engineering and Science, and † Advanced Food Systems Research Unit, College of Health and Biomedicine, Victoria University, PO Box 14428, Melbourne, Victoria, 8001, Australia ‡ Institute for Food Process Engineering and Dairy Technology, Technische Universität München, 85354 Munich, Germany
Received May 19, 2013. Accepted October 5, 2013. 1 Corresponding author: [email protected]
Journal of Dairy Science Vol. 97 No. 1, 2014
MEMBRANE DISTILLATION IN DAIRY PROCESSING 57
In MD, high flow velocities (shear) are used to im-prove the temperature profile along the membrane, and also to minimize temperature polarization (Zhang et al., 2010) and cake formation to achieve the best fluxes. However, the increased pressure associated with increased shear can exceed the liquid entry pressure, causing untreated liquid feed to pass through the mem-brane. This is more likely to occur at the module inlet as the pressure gradually decreases toward the outlet (Piry et al., 2008). Also, flow-induced wall shear stress can preferentially remove larger particles rather than small ones (Gryta, 2008; Ding et al., 2010), resulting in a denser filter cake. Whereas fouling adds an additional thermal resistance to the direct-contact membrane distillation (DCMD) process, the morphology of the fouling layer can also affect the mass transfer from the bulk to the membrane surface (e.g., in a dense gel layer, water needs to diffuse through the layer to reach the membrane surface), whereas a porous layer may not affect mass transfer.
Fouling models proposed in MD literature are used to calculate temperatures at the membrane surface (Gryta and Tomaszewska, 1998; Srisurichan et al., 2006; Mar-tínez and Rodríguez-Maroto, 2008). Figure 1 shows a schematic of the DCMD separation function, includ-ing the temperature distribution across the membrane. This model allows calculation of membrane and fouling
resistances and changes to these during MD processing at constant operating parameters over time. Also, heat transfer efficiency can be quantitatively estimated and analyzed.
At steady state, the heat energy difference from inlet to outlet of the module equals the heat energy trans-ferred across the boundary layers, fouling layer, and membrane:
ΔQ m= −( ) = −( ) = −( )=
� C T T h T T h T Tf FB in FB out FP FB Fl Fl Fl FM, ,
JHlatentt + −( ) = −h T T h T TM FM PM PP PM PB( ),
[1]
where ΔQ = heat transfer, �m = mass flow, Cf = spe-cific heat of water on the feed side of the membrane, TFB = temperature of feed bulk, TFl = temperature of fouling layer, TFM = temperature of feed membrane, TPM = temperature of permeate membrane, TPB = temperature of permeate bulk, hFP = heat transfer coef-ficient of the feed side polarization layer, hFl = heat transfer coefficient of the fouling layer, hM = heat transfer coefficient of the membrane, hPP = heat trans-fer coefficient of the temperature polarization layer on the permeate side, J = flux through the membrane, and Hlatent = latent heat of evaporation. From the heat bal-ance in Equation 1, TFl, TFM, TPM can be estimated.
Figure 1. Temperature profile across the membrane in a typical direct-contact membrane distillation (DMCD) process. Q = heat transfer; TFB = temperature of feed bulk; TFl = temperature of fouling layer; TFM = temperature of feed membrane; TPM = temperature of permeate membrane; TPB = temperature of permeate bulk.
58 HAUSMANN ET AL.
Journal of Dairy Science Vol. 97 No. 1, 2014
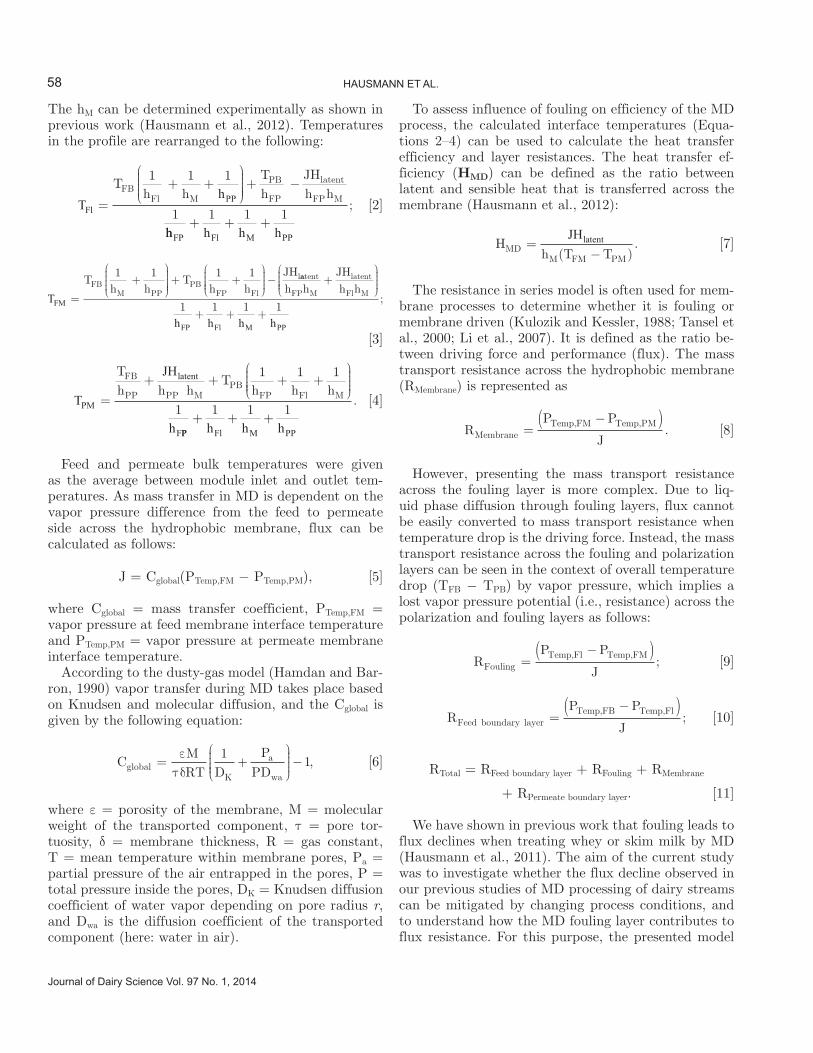
The hM can be determined experimentally as shown in previous work (Hausmann et al., 2012). Temperatures in the profile are rearranged to the following:
Th
FlPP=
+ +⎛
⎝⎜⎜⎜⎜
⎞
⎠⎟⎟⎟⎟⎟+ −T
h hTh h hFB
Fl M
PB
FP FP M
1 1 1
1
JHlatent
hh h h hFP Fl M PP+ + +1 1 1
; [2]
TFM =+
⎛
⎝⎜⎜⎜⎜
⎞
⎠⎟⎟⎟⎟⎟+ +
⎛
⎝⎜⎜⎜⎜
⎞
⎠⎟⎟⎟⎟−T
h hT
h hFBM PP
PBFP Fl
1 1 1 1 JHlaatent latentJHh h h hFP M Fl M
+⎛
⎝⎜⎜⎜⎜
⎞
⎠⎟⎟⎟⎟
+ + +1 1 1 1h h h hFP Fl M PP
;
[3]
T
JH
h
PM
latent
F
=
+ + + +⎛
⎝⎜⎜⎜⎜
⎞
⎠⎟⎟⎟⎟
Th h h
Th h h
FB
PP PP MPB
FP Fl M
1 1 1
1
PP Fl M PPh h h+ + +1 1 1
. [4]
Feed and permeate bulk temperatures were given as the average between module inlet and outlet tem-peratures. As mass transfer in MD is dependent on the vapor pressure difference from the feed to permeate side across the hydrophobic membrane, flux can be calculated as follows:
J = Cglobal(PTemp,FM − PTemp,PM), [5]
where Cglobal = mass transfer coefficient, PTemp,FM = vapor pressure at feed membrane interface temperature and PTemp,PM = vapor pressure at permeate membrane interface temperature.
According to the dusty-gas model (Hamdan and Bar-ron, 1990) vapor transfer during MD takes place based on Knudsen and molecular diffusion, and the Cglobal is given by the following equation:
CD
Pglobal
K
a= +⎛
⎝⎜⎜⎜⎜
⎞
⎠⎟⎟⎟⎟−
ετδ
,MRT PDwa
11 [6]
where ε = porosity of the membrane, M = molecular weight of the transported component, τ = pore tor-tuosity, δ = membrane thickness, R = gas constant, T = mean temperature within membrane pores, Pa = partial pressure of the air entrapped in the pores, P = total pressure inside the pores, DK = Knudsen diffusion coefficient of water vapor depending on pore radius r, and Dwa is the diffusion coefficient of the transported component (here: water in air).
To assess influence of fouling on efficiency of the MD process, the calculated interface temperatures (Equa-tions 2–4) can be used to calculate the heat transfer efficiency and layer resistances. The heat transfer ef-ficiency (HMD) can be defined as the ratio between latent and sensible heat that is transferred across the membrane (Hausmann et al., 2012):
Hh T TMDM FM PM
=−
JHlatent( )
. [7]
The resistance in series model is often used for mem-brane processes to determine whether it is fouling or membrane driven (Kulozik and Kessler, 1988; Tansel et al., 2000; Li et al., 2007). It is defined as the ratio be-tween driving force and performance (flux). The mass transport resistance across the hydrophobic membrane (RMembrane) is represented as
RP P
JMembraneTemp FM Temp PM=
−( ), , . [8]
However, presenting the mass transport resistance across the fouling layer is more complex. Due to liq-uid phase diffusion through fouling layers, flux cannot be easily converted to mass transport resistance when temperature drop is the driving force. Instead, the mass transport resistance across the fouling and polarization layers can be seen in the context of overall temperature drop (TFB − TPB) by vapor pressure, which implies a lost vapor pressure potential (i.e., resistance) across the polarization and fouling layers as follows:
We have shown in previous work that fouling leads to flux declines when treating whey or skim milk by MD (Hausmann et al., 2011). The aim of the current study was to investigate whether the flux decline observed in our previous studies of MD processing of dairy streams can be mitigated by changing process conditions, and to understand how the MD fouling layer contributes to flux resistance. For this purpose, the presented model
Journal of Dairy Science Vol. 97 No. 1, 2014
MEMBRANE DISTILLATION IN DAIRY PROCESSING 59
was applied to determine the influence of hydrodynam-ics on fouling with dairy streams during MD.
MATERIALS AND METHODS
Iterative Model to Describe Fouling in MD
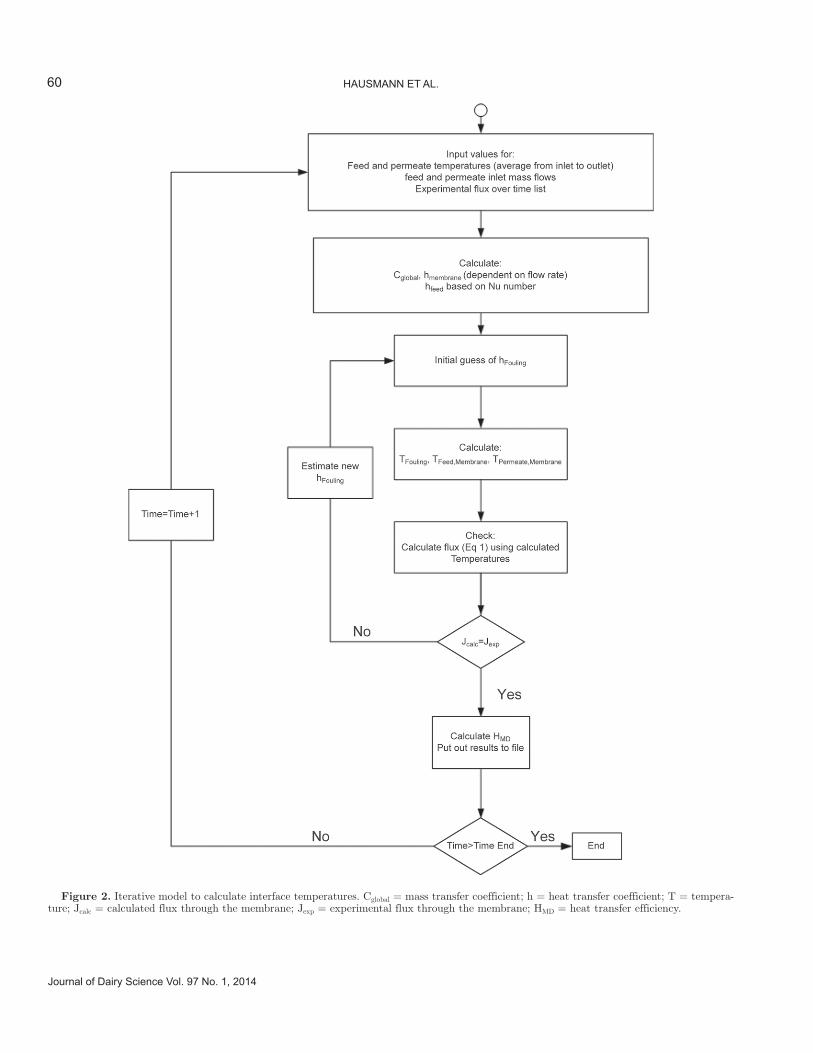
The iterative model described above was used to cal-culate temperatures at the various interfaces (TFl, TFM, and TPM) using experimentally determined flux and temperatures of the bulk solution inlet and outlet tem-peratures, as shown in Figure 2. To calculate interface temperatures using Equations 2 to 4, the temperature polarization coefficient (hFB) can be estimated using dimensionless numbers (Phattaranawik et al., 2003; Martínez and Rodríguez-Maroto, 2007; Gryta, 2008) and the Cglobal can be determined experimentally when running only water. For the iterative model, an initial hFl can be assumed to calculate interface temperatures; these can then be incorporated into the flux (Equation 5) and compared with measured experimental results. If the estimated flux deviates from the experimentally determined flux, a new hFl is estimated and tempera-tures recalculated until flux values match. As presented in previous work, whey flux is time dependent (Haus-mann et al., 2011); therefore, another iteration loop can be included to calculate flux and temperatures as they change over time. For this, flux values for every measurement can be used as input for the model and an end time can be defined.
DCMD Equipment
A schematic of the equipment used to test DCMD with dairy solutions is shown in Figure 3. Flat-sheet polytetrafluoroethylene (PTFE) membranes supplied by Ningbo Changqui Porous Membrane Technology Co. Ltd. (Ningbo, China) were made with a scrim (woven) support layer, 0.5-μm nominal pore size, 20-μm thickness, and water contact angle of 140 ± 5°. A laboratory-scale Osmonics SEPA CF module (GE Osmonics, Minneapolis, MN) housing provided an ef-fective membrane area of 0.014 m2. A peristaltic pump with 2 heads provided a steady flow on both sides of the membrane. On the permeate side, cold stripping water was circulated to provide the temperature difference and to allow vapor condensation on the cold side. The inlet pressure and all 4 inlet and outlet temperatures, as well as the permeate weight were recorded continu-ously; the flux was calculated from the permeate weight gain.
Experiments were performed in continuous mode, such that the concentration of the dairy components remained approximately constant during the course of
the experiment. A peristaltic pump was used to inter-mittently transfer the permeate back into the feed con-tainer every 30 min for 5 min. A rigid tube was clamped inside the permeate container at a certain height to ensure that only additional permeate was pumped back into the feed container, whereas the initial fraction of that permeate (the stripping water) remained in the permeate container.
Dairy Fluids
Skim milk and whey powders (composition shown in Table 1) were reconstituted using deionized water, making a total solids concentration of 20%, unless stated otherwise. The use of powders enabled starting experiments at a selected concentration, which allowed exploration of time-related effects independently of concentration-related effects. It also avoided batch to batch as well as seasonal variations, as powders used in this study were taken from a single batch. To pre-vent microorganism growth, 0.2 g/L of sodium azide (Sigma-Aldrich, St. Louis, MO) was added to the feed solutions. Both skim milk and whey powders were ob-tained from a local manufacturer.
Operating Procedure
A new membrane was used for each experiment and performance was benchmarked under standardized con-ditions: 54°C feed in, 5°C permeate in, flow of 200 mL/min (0.047 m/s). A relatively low flow was chosen to ensure that the pressure never exceeded 10 kPa, as mod-erate increases in pressure have been shown to compress polytetrafluoroethylene MD membranes (Zhang et al., 2011) and lead to reduced flux. Pressure pulsing caused by the peristaltic pumps were on the order of ±2 kPa. Deionized water was used for benchmarking and flux recorded after a 1-h stabilization period. The operating conditions for experiments were kept consistent with benchmarking parameters, unless stated otherwise. Bubbles were removed from the system before the start of the experiments by positioning the module vertically until no more air bubbles were detected at the module outlets. A high flow rate for 1 min was used to facilitate bubble removal. Each experiment was run for around 20 h to replicate a desirable runtime for commercial applications in the dairy industry where daily cleaning is necessary to prevent microbial growth.
Operating Parameter Variation
The flux was in some cases converted to a relative flux (percentage − measured flux/pure water flux × 100) to study the fouling effects without artifacts due
60 HAUSMANN ET AL.
Journal of Dairy Science Vol. 97 No. 1, 2014
Figure 2. Iterative model to calculate interface temperatures. Cglobal = mass transfer coefficient; h = heat transfer coefficient; T = tempera-ture; Jcalc = calculated flux through the membrane; Jexp = experimental flux through the membrane; HMD = heat transfer efficiency.
Journal of Dairy Science Vol. 97 No. 1, 2014
MEMBRANE DISTILLATION IN DAIRY PROCESSING 61
to flux changes simply induced by changing driving forces. The conversion to relative flux also corrects for minor temperature variations and allows examination of relations between the operational parameter and performance changes due to the nature of the feed solu-tion.
Analytical Methods
Wet-Chemistry Analyses of Fouling Layers. To analyze the composition of fouling layers after ex-periments, the membranes were cut into 14-cm2 strips and soaked in 2 mL of deionized water overnight at 50°C. The membrane surface was then scraped with a surgical blade to remove all matter remaining on the membrane into the original soaking water. The mem-brane was then placed in clean deionized water and the procedure was repeated until no visible fouling was left on the membrane and no visible particles were in the soaking water. The resulting solution was left at 50°C again until all particulates were dissolved. The con-centration of fouling compounds per cm2 of membrane
was calculated from the concentration in the soaking water. These analyses were performed 3 times for every sample and the standard deviation is reported as error bars in the graphs.
Lactose HPLC. Lactose in the fouling layer samples was determined by an HPLC system (Shimadzu Corp., Kyoto, Japan) as reported elsewhere (Ramchandran et al., 2012). For this, 900-μL samples were filtered through a 0.45-μm syringe filter into HPLC sample bottles. An Agilent Zorbax Carbohydrate column (Agilent Tech-nologies Inc., Santa Clara, CA) and a light-scattering detector were used. The flow rate was set to 1.4 mL per minute and the mobile phase consisted of 75% aceto-nitrile and 25% HPLC-grade water. Standards of 0.05, 0.1, 0.2, 0.5, 1, and 2% were run to produce a calibra-tion curve. The injection volume was 10 μL.
Inductively Coupled Plasma Atomic Emission Spectroscopy. Fouling layer samples were analyzed for cations (K+, Na+, Ca2+, Mg2+, P) using a Shimadzu inductively coupled plasma (ICP) E-9000 unit (Shi-madzu Corp.). Samples containing a high amount of proteins were subjected to a wet-digestion step before
Figure 3. Flow diagram of laboratory-scale direct-contact membrane distillation (DCMD) setup for operation at constant concentration. TR = temperature of retentate; PR = pressure of retentate; PP = pressure of permeate; TP = temperature of permeate.
Table 1. Compositions of powders used in this study (%)
ICP atomic emission spectroscopy analysis, as suggest-ed by Kira and Maihara (2007). Aliquots of 100 μL of sample were mixed with 1 mL of HNO3 (65%, vol/vol) and heated to boiling temperature for at least an hour or until decoloration occurred, leaving a clear solution as evidence of OM being fully digested. The digested sample and 10 mL of HNO3 (5%) were transferred into a volumetric flask and filled to the standard volume using deionized water to dilute samples as needed to achieve a total solids concentration below 0.1%. Samples not containing organics were acidified using the same amount of HNO3 but were not subjected to a diges-tion step. All samples were filtered through a 0.45-μm syringe filter into ICP sample bottles. All calibration solutions were prepared using standard solutions for each element following a dilution scheme to establish a calibration curve for each mineral.
Total Organic Carbon and Total Nitrogen Analysis. Samples were analyzed for total organic car-bon (TOC) and total nitrogen (TN) using a TOC and TN analyzer (VCSH; Shimadzu Corp.). Sample prepara-tion involved dilution to below 100 mg/kg of carbon. For TN analysis, which was measured as an indicator for protein, samples needed to be diluted below 50 mg/kg. After creating a calibration curve, a standard so-lution of 100 mg/kg of potassium hydrogen phthalate (KHP) for TOC and 50 mg/kg of potassium nitrate (KNO3) for TN analysis were used to confirm the origi-nal calibration. To convert the nitrogen reading to milk protein, the nitrogen measurement was multiplied by a Kjeldahl factor of 6.38 (van der Ven et al., 2002). This is equivalent to the Kjeldahl method, which is officially recognized as a standard reference method in food sci-ence and technology (Metsämuuronen et al., 2011).
Vapor Pressure Determination. As vapor pres-sure is the driving force of MD, measurements were used as a tool to estimate driving force reduction caused by solids in the feed solution and by an established fouling layer. An AquaLab water activity (aw) meter (Decagon Devices Inc., Pullman, WA) was used, which measures aw at a set temperature. Water activity gives the direct comparison of the solution’s vapor pressure to vapor pressure of pure water with the following equation:
appw =0, [12]
where p = vapor pressure of water in the substance and p0 = vapor pressure of pure water at the same temperature.
This instrument did not allow for in situ measure-ments; instead, fouled membranes after experiments as well as new membranes were used to cover and seal
sample containers. Using a syringe, the containers were filled with the respective dairy solution after having glued the membrane onto the sample container. The needle entry point was glued to prevent liquid from exiting the container. To ensure that the container was fully sealed it was dipped in water to check for possible leaks from the sample container. The AquaLab instru-ment required that the system was left to stabilize until repeated vapor pressure measurements were constant. Water activity was measured at an MD operating tem-perature of 54°C, as temperature influences aw (Kelly and Wexler, 2006).
All experiments were replicated at least once and triple subsampling was done for the analytical assess-ments. The results in the tables and graphs are pre-sented as means of at least 6 observations ± standard deviation.
RESULTS AND DISCUSSION
Deionized Water Benchmark Tests
The performance of membrane processes is often af-fected by the time dependency of permeate flux (Yee et al., 2009) due to fouling or changes in membrane morphology, or both. As industrial membrane processes often need to operate for long periods of time, it is im-portant to study the influence of the different operating parameters on long-term performance before designing an industrial plant.
Running MD of deionized water for an extended pe-riod of time (20 h) revealed a drop in feed outlet tem-perature, whereas other temperatures remained stable (Figure 4). Also, flux declined at a very similar pattern as the feed outlet temperature. The membrane was then removed from the module and dried in a vacuum oven before continuing the MD process. The reduced flux and feed outlet temperature did not recover after the drying step and started off at same level as the previous run finished (indicated on the right of Figure 4).
The drop in flux could be explained by changes in the thermal conductivity of the membrane, resulting from a slight membrane compaction during MD, which has also been observed elsewhere (Barbe et al., 2000; Gryta, 2005). The high porosity of the membrane used also promotes membrane compaction. However, in another study, this has been found to increase flux due to the decreased free path length the vapor has to pass (Gryta, 2005). The observed decrease in flux here can be related to the changes in temperature profile and the reduced temperature at the module outlet and, therefore, a lower driving force at the module outlet. The highest decline in feed outlet temperature from 42 to 39°C was observed in the first 6 h. In the following 11
Journal of Dairy Science Vol. 97 No. 1, 2014
MEMBRANE DISTILLATION IN DAIRY PROCESSING 63
h, a gradual decline of only 1°C was recorded. Flux, on the other hand, still declined after these initial 6 h by around 10%, which indicates that membrane compac-tion was not the only cause for the flux decrease. This test, therefore, indicated that a slight reduction in flux occurred under simple water conditions due to initial conditioning of the membrane.
Effect of Wall Shear Stress on Dairy Fouling Induced by Different Flow Velocities
It is generally understood that increasing linear ve-locity in membrane systems leads to an increased wall shear stress, which generally helps to decrease thickness of a forming cake layer by removing particles from the membrane surface (Cheryan, 1998). Figure 5 shows that flux during skim milk concentration indeed increased with increasing linear velocity. However, this effect was less pronounced at higher flow rates. Figure 5b shows that the relative flux (percentage of pure water flux) increased with increasing velocity and reached a pla-teau at flow rates exceeding 600 mL/min (0.141 m/s). This behavior of a diminishing effect of increasing shear stress is often found with pressure-driven filtration processes and is due to less cake formation at higher flow rates. In addition, high shear stress preferentially removes bigger molecules rather than small ones, which can result in a denser layer (Grandison et al., 2000). In the case of MD, a denser fouling layer could potentially also be related to vapor pressure reduction, as less water from the bulk solution transports to the mem-brane surface, thereby resulting in more concentrated material on the surface. A maximum sustainable flux of approximately 12 kg/m2 per hour was achieved at the higher velocities and 54°C, which is comparable to RO fluxes at 60°C and a 2-fold concentration factor, which were recorded around 12 to 15 kg/m2 per hour (De Boer and Hiddink, 1980).
As skim milk flux is sensitive to different flow rates, reversibility of lowering shear and, therefore, flux in steps from maximum to minimum before increasing again has been tested and is shown as hysteresis in Figure 5b. The changes to the fouling layer occurring at lower flow cannot be reversed when the flux is increased again, resulting in 26% hysteresis. At lower flow, the wall shear stress that disrupts the filter cake is reduced and more material accumulates at the membrane sur-face, resulting in a thicker layer (Altmann and Rip-perger, 1997). The hysteresis observed indicates that fouling has occurred at lower flow rates, underlining the importance of appropriate startup conditions for membrane processes.
The flux and relative flux performance for whey is shown in Figure 6. Flux values are considerably higher
Figure 4. Pure water flux and temperatures of polytetrafluoroethylene (PTFE) flat-sheet membrane over time.
Figure 5. Skim milk flow variation during direct-contact mem-brane distillation (DCMD). (a) Flux over time. (b) Relative flux over linear velocity also showing reversibility of feed flow rate variation.
64 HAUSMANN ET AL.
Journal of Dairy Science Vol. 97 No. 1, 2014
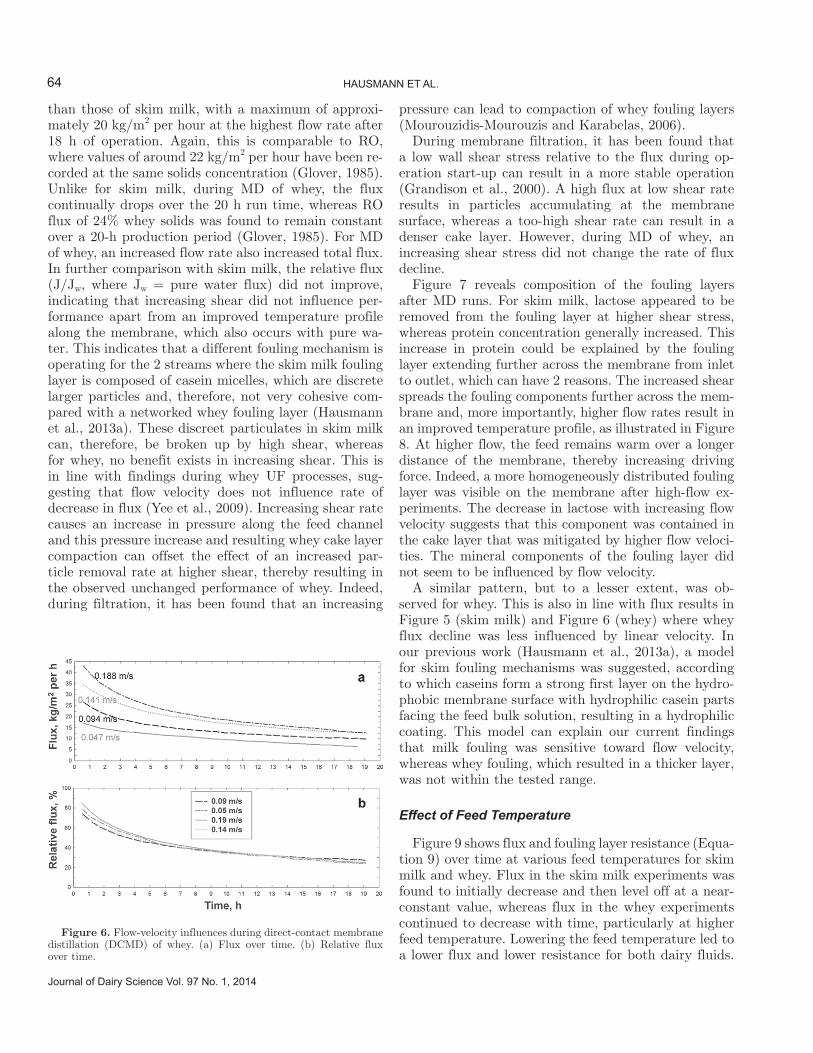
than those of skim milk, with a maximum of approxi-mately 20 kg/m2 per hour at the highest flow rate after 18 h of operation. Again, this is comparable to RO, where values of around 22 kg/m2 per hour have been re-corded at the same solids concentration (Glover, 1985). Unlike for skim milk, during MD of whey, the flux continually drops over the 20 h run time, whereas RO flux of 24% whey solids was found to remain constant over a 20-h production period (Glover, 1985). For MD of whey, an increased flow rate also increased total flux. In further comparison with skim milk, the relative flux (J/Jw, where Jw = pure water flux) did not improve, indicating that increasing shear did not influence per-formance apart from an improved temperature profile along the membrane, which also occurs with pure wa-ter. This indicates that a different fouling mechanism is operating for the 2 streams where the skim milk fouling layer is composed of casein micelles, which are discrete larger particles and, therefore, not very cohesive com-pared with a networked whey fouling layer (Hausmann et al., 2013a). These discreet particulates in skim milk can, therefore, be broken up by high shear, whereas for whey, no benefit exists in increasing shear. This is in line with findings during whey UF processes, sug-gesting that flow velocity does not influence rate of decrease in flux (Yee et al., 2009). Increasing shear rate causes an increase in pressure along the feed channel and this pressure increase and resulting whey cake layer compaction can offset the effect of an increased par-ticle removal rate at higher shear, thereby resulting in the observed unchanged performance of whey. Indeed, during filtration, it has been found that an increasing
pressure can lead to compaction of whey fouling layers (Mourouzidis-Mourouzis and Karabelas, 2006).
During membrane filtration, it has been found that a low wall shear stress relative to the flux during op-eration start-up can result in a more stable operation (Grandison et al., 2000). A high flux at low shear rate results in particles accumulating at the membrane surface, whereas a too-high shear rate can result in a denser cake layer. However, during MD of whey, an increasing shear stress did not change the rate of flux decline.
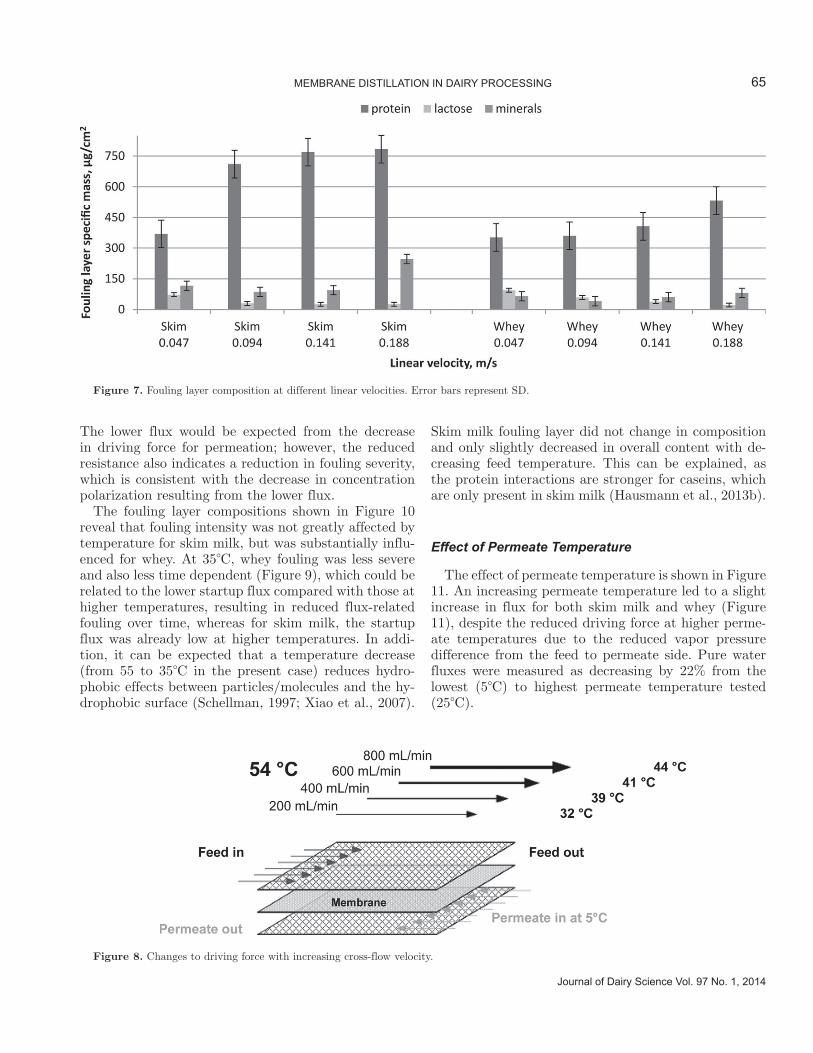
Figure 7 reveals composition of the fouling layers after MD runs. For skim milk, lactose appeared to be removed from the fouling layer at higher shear stress, whereas protein concentration generally increased. This increase in protein could be explained by the fouling layer extending further across the membrane from inlet to outlet, which can have 2 reasons. The increased shear spreads the fouling components further across the mem-brane and, more importantly, higher flow rates result in an improved temperature profile, as illustrated in Figure 8. At higher flow, the feed remains warm over a longer distance of the membrane, thereby increasing driving force. Indeed, a more homogeneously distributed fouling layer was visible on the membrane after high-flow ex-periments. The decrease in lactose with increasing flow velocity suggests that this component was contained in the cake layer that was mitigated by higher flow veloci-ties. The mineral components of the fouling layer did not seem to be influenced by flow velocity.
A similar pattern, but to a lesser extent, was ob-served for whey. This is also in line with flux results in Figure 5 (skim milk) and Figure 6 (whey) where whey flux decline was less influenced by linear velocity. In our previous work (Hausmann et al., 2013a), a model for skim fouling mechanisms was suggested, according to which caseins form a strong first layer on the hydro-phobic membrane surface with hydrophilic casein parts facing the feed bulk solution, resulting in a hydrophilic coating. This model can explain our current findings that milk fouling was sensitive toward flow velocity, whereas whey fouling, which resulted in a thicker layer, was not within the tested range.
Effect of Feed Temperature
Figure 9 shows flux and fouling layer resistance (Equa-tion 9) over time at various feed temperatures for skim milk and whey. Flux in the skim milk experiments was found to initially decrease and then level off at a near-constant value, whereas flux in the whey experiments continued to decrease with time, particularly at higher feed temperature. Lowering the feed temperature led to a lower flux and lower resistance for both dairy fluids.
Figure 6. Flow-velocity influences during direct-contact membrane distillation (DCMD) of whey. (a) Flux over time. (b) Relative flux over time.
Journal of Dairy Science Vol. 97 No. 1, 2014
MEMBRANE DISTILLATION IN DAIRY PROCESSING 65
The lower flux would be expected from the decrease in driving force for permeation; however, the reduced resistance also indicates a reduction in fouling severity, which is consistent with the decrease in concentration polarization resulting from the lower flux.
The fouling layer compositions shown in Figure 10 reveal that fouling intensity was not greatly affected by temperature for skim milk, but was substantially influ-enced for whey. At 35°C, whey fouling was less severe and also less time dependent (Figure 9), which could be related to the lower startup flux compared with those at higher temperatures, resulting in reduced flux-related fouling over time, whereas for skim milk, the startup flux was already low at higher temperatures. In addi-tion, it can be expected that a temperature decrease (from 55 to 35°C in the present case) reduces hydro-phobic effects between particles/molecules and the hy-drophobic surface (Schellman, 1997; Xiao et al., 2007).
Skim milk fouling layer did not change in composition and only slightly decreased in overall content with de-creasing feed temperature. This can be explained, as the protein interactions are stronger for caseins, which are only present in skim milk (Hausmann et al., 2013b).
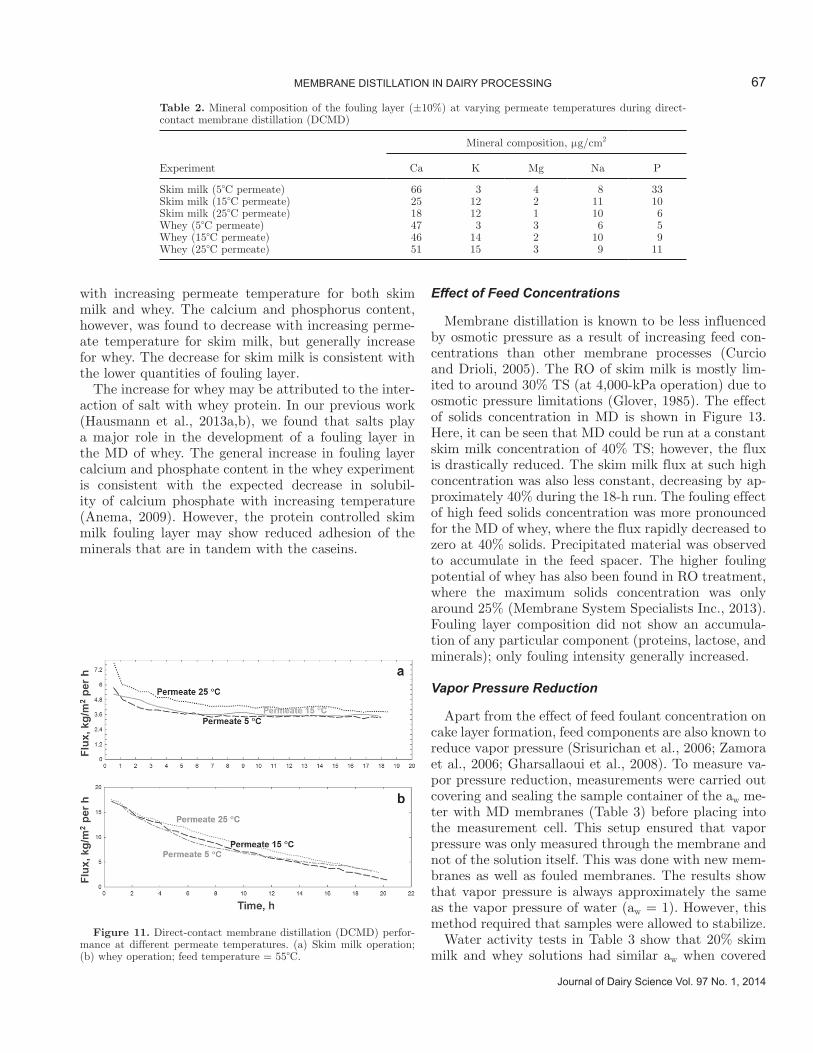
Effect of Permeate Temperature
The effect of permeate temperature is shown in Figure 11. An increasing permeate temperature led to a slight increase in flux for both skim milk and whey (Figure 11), despite the reduced driving force at higher perme-ate temperatures due to the reduced vapor pressure difference from the feed to permeate side. Pure water fluxes were measured as decreasing by 22% from the lowest (5°C) to highest permeate temperature tested (25°C).
Figure 7. Fouling layer composition at different linear velocities. Error bars represent SD.
Figure 8. Changes to driving force with increasing cross-flow velocity.
66 HAUSMANN ET AL.
Journal of Dairy Science Vol. 97 No. 1, 2014
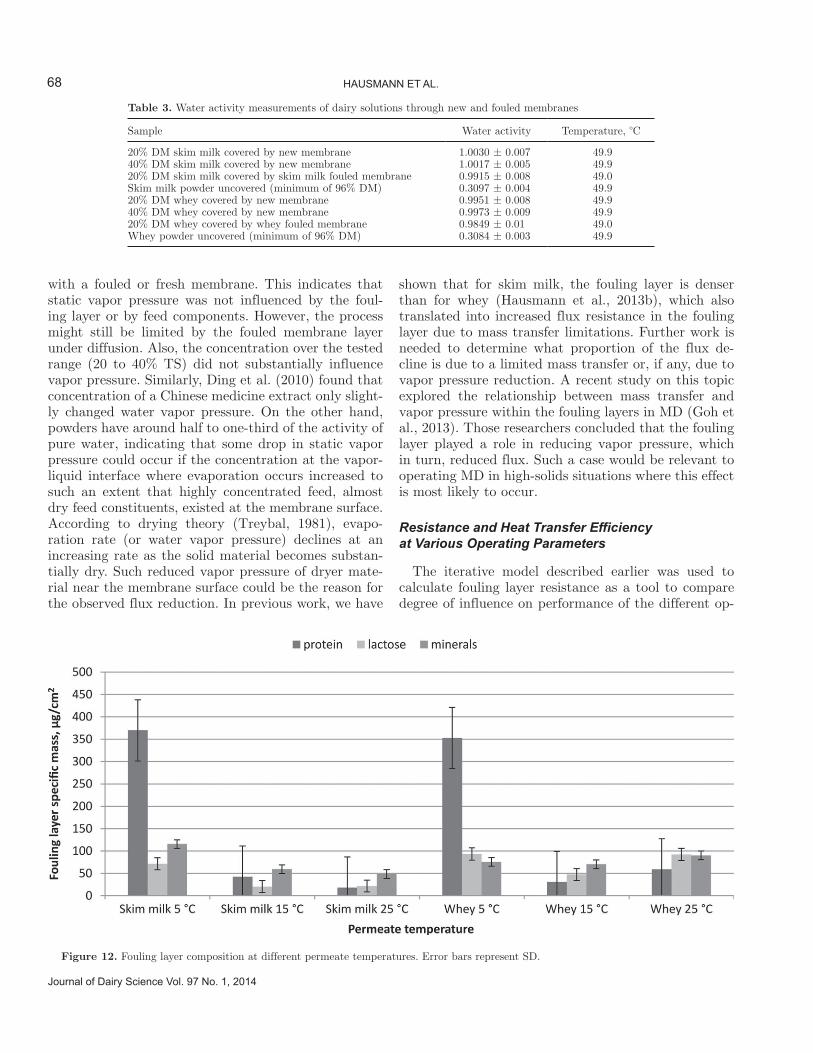
The fouling layer composition, as shown in Figure 12, clearly shows that fouling is reduced at higher permeate temperatures, with changed ratios between the differ-ent components. Mainly, proteins were found to deposit less at higher permeate temperatures. In general, it has been shown that protein fouling is less severe at lower temperatures during membrane filtration (Cheryan, 1998); however, within the temperature range tested in the present work, the protein fouling amount increased with decreasing membrane surface temperature. This observation would require in-detail protein analysis but might, for the skim milk case, be explained by proper-ties of casein micelles, the size and structural organiza-
tion of which is influenced by environmental factors, including temperature and pH. At low temperatures (below 20°C), β-CN, one of the structural proteins in the casein micelle, tends to leak out into the serum and consequently may deposit on the surface of the membrane due to its high hydrophobicity (Walstra et al., 1999). The reduced fouling effect at higher perme-ate temperature outbalances the effect of a lower driv-ing force resulting in an overall higher flux at higher permeate temperature.
The mineral content of the fouling layer on the feed side of the membrane is shown in Table 2. The potas-sium content in the fouling layer was found to increase
Figure 9. Flux (a, c) and resistance (R; b, d) of feed temperature variation during direct-contact membrane distillation (DCMD) of skim milk (a and b) and whey (c and d); permeate temperature = 5°C.
Figure 10. Fouling layer composition at different feed temperatures. Error bars represent SD.
Journal of Dairy Science Vol. 97 No. 1, 2014
MEMBRANE DISTILLATION IN DAIRY PROCESSING 67
with increasing permeate temperature for both skim milk and whey. The calcium and phosphorus content, however, was found to decrease with increasing perme-ate temperature for skim milk, but generally increase for whey. The decrease for skim milk is consistent with the lower quantities of fouling layer.
The increase for whey may be attributed to the inter-action of salt with whey protein. In our previous work (Hausmann et al., 2013a,b), we found that salts play a major role in the development of a fouling layer in the MD of whey. The general increase in fouling layer calcium and phosphate content in the whey experiment is consistent with the expected decrease in solubil-ity of calcium phosphate with increasing temperature (Anema, 2009). However, the protein controlled skim milk fouling layer may show reduced adhesion of the minerals that are in tandem with the caseins.
Effect of Feed Concentrations
Membrane distillation is known to be less influenced by osmotic pressure as a result of increasing feed con-centrations than other membrane processes (Curcio and Drioli, 2005). The RO of skim milk is mostly lim-ited to around 30% TS (at 4,000-kPa operation) due to osmotic pressure limitations (Glover, 1985). The effect of solids concentration in MD is shown in Figure 13. Here, it can be seen that MD could be run at a constant skim milk concentration of 40% TS; however, the flux is drastically reduced. The skim milk flux at such high concentration was also less constant, decreasing by ap-proximately 40% during the 18-h run. The fouling effect of high feed solids concentration was more pronounced for the MD of whey, where the flux rapidly decreased to zero at 40% solids. Precipitated material was observed to accumulate in the feed spacer. The higher fouling potential of whey has also been found in RO treatment, where the maximum solids concentration was only around 25% (Membrane System Specialists Inc., 2013). Fouling layer composition did not show an accumula-tion of any particular component (proteins, lactose, and minerals); only fouling intensity generally increased.
Vapor Pressure Reduction
Apart from the effect of feed foulant concentration on cake layer formation, feed components are also known to reduce vapor pressure (Srisurichan et al., 2006; Zamora et al., 2006; Gharsallaoui et al., 2008). To measure va-por pressure reduction, measurements were carried out covering and sealing the sample container of the aw me-ter with MD membranes (Table 3) before placing into the measurement cell. This setup ensured that vapor pressure was only measured through the membrane and not of the solution itself. This was done with new mem-branes as well as fouled membranes. The results show that vapor pressure is always approximately the same as the vapor pressure of water (aw = 1). However, this method required that samples were allowed to stabilize.
Water activity tests in Table 3 show that 20% skim milk and whey solutions had similar aw when covered
Figure 11. Direct-contact membrane distillation (DCMD) perfor-mance at different permeate temperatures. (a) Skim milk operation; (b) whey operation; feed temperature = 55°C.
Table 2. Mineral composition of the fouling layer (±10%) at varying permeate temperatures during direct-contact membrane distillation (DCMD)
with a fouled or fresh membrane. This indicates that static vapor pressure was not influenced by the foul-ing layer or by feed components. However, the process might still be limited by the fouled membrane layer under diffusion. Also, the concentration over the tested range (20 to 40% TS) did not substantially influence vapor pressure. Similarly, Ding et al. (2010) found that concentration of a Chinese medicine extract only slight-ly changed water vapor pressure. On the other hand, powders have around half to one-third of the activity of pure water, indicating that some drop in static vapor pressure could occur if the concentration at the vapor-liquid interface where evaporation occurs increased to such an extent that highly concentrated feed, almost dry feed constituents, existed at the membrane surface. According to drying theory (Treybal, 1981), evapo-ration rate (or water vapor pressure) declines at an increasing rate as the solid material becomes substan-tially dry. Such reduced vapor pressure of dryer mate-rial near the membrane surface could be the reason for the observed flux reduction. In previous work, we have
shown that for skim milk, the fouling layer is denser than for whey (Hausmann et al., 2013b), which also translated into increased flux resistance in the fouling layer due to mass transfer limitations. Further work is needed to determine what proportion of the flux de-cline is due to a limited mass transfer or, if any, due to vapor pressure reduction. A recent study on this topic explored the relationship between mass transfer and vapor pressure within the fouling layers in MD (Goh et al., 2013). Those researchers concluded that the fouling layer played a role in reducing vapor pressure, which in turn, reduced flux. Such a case would be relevant to operating MD in high-solids situations where this effect is most likely to occur.
Resistance and Heat Transfer Efficiency at Various Operating Parameters
The iterative model described earlier was used to calculate fouling layer resistance as a tool to compare degree of influence on performance of the different op-
Table 3. Water activity measurements of dairy solutions through new and fouled membranes
Sample Water activity Temperature, °C
20% DM skim milk covered by new membrane 1.0030 ± 0.007 49.940% DM skim milk covered by new membrane 1.0017 ± 0.005 49.920% DM skim milk covered by skim milk fouled membrane 0.9915 ± 0.008 49.0Skim milk powder uncovered (minimum of 96% DM) 0.3097 ± 0.004 49.920% DM whey covered by new membrane 0.9951 ± 0.008 49.940% DM whey covered by new membrane 0.9973 ± 0.009 49.920% DM whey covered by whey fouled membrane 0.9849 ± 0.01 49.0Whey powder uncovered (minimum of 96% DM) 0.3084 ± 0.003 49.9
Figure 12. Fouling layer composition at different permeate temperatures. Error bars represent SD.
Journal of Dairy Science Vol. 97 No. 1, 2014
MEMBRANE DISTILLATION IN DAIRY PROCESSING 69
erating parameters with each other, and to investigate the feasibility of fouling mitigation by changing the operating parameters. Results in Table 4 show foul-ing layer resistances as well as HMD. The HMD indicates the portion of heat energy being used for evaporation versus heat energy being lost due to heat conduction. A value higher than 1 indicates that more heat is being used for evaporation than lost through conduction. The HMD can, therefore, be used to elucidate the effect of fouling on energy requirements. For whey fouling, layer resistance increases over time; here, values after half a run (at 10 h) are shown.
As Table 4 shows, for skim milk, increasing the flow rate had the highest beneficial effect on fouling resis-tance (9 times reduction over the tested range), fol-lowed by reducing the feed temperature (5 times), and finally, an increasing permeate temperature (4.7 times). Concentration is a factor often dictated by the applica-tion and not often free to be altered; however, increas-ing the concentration from 20 to 40% increased the fouling layer resistance by 56%. The best heat transfer efficiency was achieved at high permeate temperature, a value above 1 indicating that it is advantageous to operate at higher permeate temperatures, as more of the heat is being used for evaporation than is being lost through conduction. The higher heat efficiency at high permeate temperatures was expected, as sensible heat loss is linear to temperature drop and insensitive to average temperature drop, whereas flux is exponen-tial to average temperature drop. So, as the permeate temperature rises, sensible heat loss is reduced with less impact on flux.
For whey, flow rate was found not to influence normal-ized flux; however, fouling layer resistance was reduced at higher flow, whereas heat transfer efficiency seemed to be barely influenced. This indicates that although a lower temperature gradient across the membrane was needed to achieve the same flux, the same proportion of heat energy was used for evaporation. A feed tempera-ture reduction had the highest bearing on performance, reducing resistance by 7.6 fold over the tested range. This is in line with DCMD results of highly soluble NaCl, where it was also found that feed temperature had the most significant effect on permeate flux (Bah-manyar et al., 2012). The 35°C feed temperature with
Figure 13. Direct-contact membrane distillation (DCMD) of (a) skim milk and (b) whey at varying feed concentrations.
Table 4. Resistance of fouling layer (RFl) and membrane (RM) as well as heat transfer efficiency (HMD) during direct-contact membrane distillation (DCMD) of skim milk and whey at various operating parameters (all parameters: ±10%)
whey is actually the only case in which the fouling layer resistance was lower than the pure membrane’s resis-tance, meaning that the process performance was lim-ited by the membrane, not the fouling layer; however, heat transfer efficiency was adversely affected by feed temperature. Furthermore, retention of major minerals, organic carbon, and TN was measured for all experi-ments and found to be >99% for all measured cases.
CONCLUSIONS
The responses to varying process parameters for whey and skim milk shown in this study confirm the importance of optimization of the process for each type of dairy stream. In general, whey resulted in higher fluxes and higher energy efficiency compared with skim milk. The MD of skim milk was found to have low energy efficiency and low flux but it was found that this can be offset by higher permeate temperatures or optimized flow rates, or both. It was found that an increase in cross-flow velocity from 0.05 to 0.14 m/s was useful in the mitigation of fouling during the MD of skim milk and whey, resulting in fluxes comparable with those found with RO. Under optimized conditions, the benefit of a lower electrical energy demand for MD could find practical use for concentrating skim milk or whey. The flux and higher energy efficiency achieved with these dairy streams warrants further MD stud-ies to assess the potential for more cost-effective whey and skim milk concentration than is currently possible using RO or high-temperature evaporation. The often-stated advantage of MD to not be influenced by feed concentration was not confirmed due to excessive mem-brane fouling, which might be related to vapor pressure reduction as a result of an increased concentration at the membrane surface. This is a possible reason for flux reduction and would form an additional resistance for vapor transfer. This concept is novel for membrane fouling, being a special case for MD, which draws from drying theory and is subject to further investigations.
ACKNOWLEDGMENTS
This work was conducted under an Australian Re-search Council Linkage Project (LP0990532) co-funded by Dairy Innovation Australia Ltd. (Werribee, Victo-ria, Australia).
REFERENCES
Altmann, J., and S. Ripperger. 1997. Particle deposition and layer for-mation at the crossflow microfiltration. J. Membr. Sci. 124:119–128.
Anema, S. G. 2009. Stability of milk-derived calcium phosphate sus-pensions. Dairy Sci. Technol. 89:269–282.
Bahmanyar, A., M. Asghari, and N. Khoobi. 2012. Numerical simula-tion and theoretical study on simultaneously effects of operating parameters in direct contact membrane distillation. Chem. Eng. Process.: Process Intensification 61:42–50.
Barbe, A. M., P. A. Hogan, and R. A. Johnson. 2000. Surface mor-phology changes during initial usage of hydrophobic, microporous polypropylene membranes. J. Membr. Sci. 172:149–156.
Cheryan, M. 1998. Ultrafiltration and Microfiltration Handbook. Technomic Publishing Co. Inc., Lancaster, PA.
Curcio, E., and E. Drioli. 2005. Membrane distillation and related operations—A review. Separ. Purif. Rev. 34:35–86.
De Boer, R., and J. Hiddink. 1980. Membrane processes in the dairy industry. Desalination 35:169–192.
Ding, Z., L. Liu, Z. Liu, and R. Ma. 2010. Fouling resistance in con-centrating TCM extract by direct contact membrane distillation. J. Membr. Sci. 362:317–325.
Gharsallaoui, A., B. Rogé, J. Génotelle, and M. Mathlouthi. 2008. Re-lationships between hydration number, water activity and density of aqueous sugar solutions. Food Chem. 106:1443–1453.
Glover, F. A. 1985. Ultrafiltration and Reverse Osmosis for the Dairy Industry. National Institute for Research in Dairying, Reading, UK.
Goh, S., Q. Zhang, J. Zhang, D. McDougald, W. B. Krantz, Y. Liu, and A. G. Fane. 2013. Impact of a biofouling layer on the vapor pressure driving force and performance of a membrane distillation process. J. Membr. Sci. 438:140–152.
Grandison, A. S., W. Youravong, and M. J. Lewis. 2000. Hydrody-namic factors affecting flux and fouling during ultrafiltration of skimmed milk. Lait 80:165–174.
Gryta, M. 2005. Long-term performance of membrane distillation pro-cess. J. Membr. Sci. 265:153–159.
Gryta, M. 2008. Fouling in direct contact membrane distillation pro-cess. J. Membr. Sci. 325:383–394.
Gryta, M., and M. Tomaszewska. 1998. Heat transport in the mem-brane distillation process. J. Membr. Sci. 144:211–222.
Hamdan, M. H., and R. M. Barron. 1990. A dusty gas flow model in porous media. J. Comput. Appl. Math. 30:21–37.
Hanemaaijer, J. H., J. van Medevoort, A. E. Jansen, C. Dotremont, E. van Sonsbeek, T. Yuan, and L. De Ryck. 2006. Memstill mem-brane distillation—A future desalination technology. Desalination 199:175–176.
Hausmann, A., P. Sanciolo, T. Vasiljevic, E. Ponnampalam, N. Quispe-Chavez, M. Weeks, and M. Duke. 2011. Direct contact membrane distillation of dairy process streams. Membranes 1:48–58.
Hausmann, A., P. Sanciolo, T. Vasiljevic, M. Weeks, and M. Duke. 2012. Integration of membrane distillation into heat paths of in-dustrial processes. Chem. Eng. J. 211–212:378–387.
Hausmann, A., P. Sanciolo, T. Vasiljevic, M. Weeks, K. Schroën, S. Gray, and M. Duke. 2013a. Fouling of dairy components on hydro-phobic polytetrafluoroethylene (PTFE) membranes for membrane distillation. J. Membr. Sci. 442:149–159.
Hausmann, A., P. Sanciolo, T. Vasiljevic, M. Weeks, K. Schroën, S. Gray, and M. Duke. 2013b. Fouling mechanisms of dairy streams during membrane distillation. J. Membr. Sci. 441:102–111.
Kelly, J. T., and A. S. Wexler. 2006. Water uptake by aerosol: Water activity in supersaturated potassium solutions and deliquescence as a function of temperature. Atmos. Environ. 40:4450–4468.
Kira, C. S., and V. A. Maihara. 2007. Determination of major and minor elements in dairy products through inductively coupled plasma optical emission spectrometry after wet partial digestion and neutron activation analysis. Food Chem. 100:390–395.
Kulozik, U., and H.-G. Kessler. 1988. Permeation rate during reverse osmosis of milk influenced by osmotic pressure and deposit forma-tion. J. Food Sci. 53:1377–1383.
Li, M., Y. Zhao, S. Zhou, W. Xing, and F.-S. Wong. 2007. Resistance analysis for ceramic membrane microfiltration of raw soy sauce. J. Membr. Sci. 299:122–129.
Martínez, L., and J. M. Rodríguez-Maroto. 2007. On transport resis-tances in direct contact membrane distillation. J. Membr. Sci. 295:28–39.
Journal of Dairy Science Vol. 97 No. 1, 2014
MEMBRANE DISTILLATION IN DAIRY PROCESSING 71
Martínez, L., and J. M. Rodríguez-Maroto. 2008. Membrane thickness reduction effects on direct contact membrane distillation perfor-mance. J. Membr. Sci. 312:143–156.
Membrane System Specialists Inc. 2013. Reverse osmosis. Accessed Feb. 28, 2013. http://www.mssincorporated.com/reverseosmosis.htm.
Metsämuuronen, S., M. Mänttäri, and M. Nyström. Comparison of analysis methods for protein concentration and its use in UF frac-tionation of whey. Desalination 283:156–164.
Mourouzidis-Mourouzis, S. A., and A. J. Karabelas. 2006. Whey pro-tein fouling of microfiltration ceramic membranes—Pressure ef-fects. J. Membr. Sci. 282:124–132.
Nii, S., R. S. Jebson, and E. L. Cussler. 2002. Membrane evaporators. J. Membr. Sci. 201:149–159.
Phattaranawik, J., R. Jiraratananon, and A. G. Fane. 2003. Effect of pore size distribution and air flux on mass transport in direct con-tact membrane distillation. J. Membr. Sci. 215:75–85.
Piry, A., W. Kühnl, T. Grein, A. Tolkach, S. Ripperger, and U. Ku-lozik. 2008. Length dependency of flux and protein permeation in crossflow microfiltration of skimmed milk. J. Membr. Sci. 325:887–894.
Ramchandran, L., P. Sanciolo, T. Vasiljevic, M. Broome, I. Powell, and M. Duke. 2012. Improving cell yield and lactic acid production of Lactococcus lactis ssp. cremoris by a novel submerged membrane fermentation process. J. Membr. Sci. 403–404:179–187.
Ramírez, C. A., M. Patel, and K. Blok. 2006. From fluid milk to milk powder: Energy use and energy efficiency in the European dairy industry. Energy 31:1984–2004.
Sääsk, A. 2009. The coming of membrane distillation technology. De-salination and Water Reuse Quarterly 19:41–48.
Schellman, J. A. 1997. Temperature, stability, and the hydrophobic interaction. Biophys. J. 73:2960–2964.
Srisurichan, S., R. Jiraratananon, and A. G. Fane. 2006. Mass transfer mechanisms and transport resistances in direct contact membrane distillation process. J. Membr. Sci. 277:186–194.
Tansel, B., W. Y. Bao, and I. N. Tansel. 2000. Characterization of fouling kinetics in ultrafiltration systems by resistances in series model. Desalination 129:7–14.
Treybal, R. E. 1981. Chapter 12: Drying in Mass Transfer Operations. 3rd ed. McGraw-Hill Book Co., New York, NY.
van der Ven, C., S. Muresan, H. Gruppen, D. B. A. de Bont, K. B. Merck, and A. G. J. Voragen. 2002. FTIR spectra of whey and casein hydrolysates in relation to their functional properties. J. Agric. Food Chem. 50:6943–6950.
Walstra, P., T. J. Geurts, and A. Noomen. 1999. Dairy Technology: Principles of Milk Properties and Processes. Marcel Dekker Inc., New York, NY
Xiao, Y., A. Rathore, J. P. O’Connell, and E. J. Fernandez. 2007. Gen-eralizing a two-conformation model for describing salt and tem-perature effects on protein retention and stability in hydrophobic interaction chromatography. J. Chromatogr. A 1157:197–206.
Yee, K. W. K., D. E. Wiley, and J. Bao. 2009. A unified model of the time dependence of flux decline for the long-term ultrafiltration of whey. J. Membr. Sci. 332:69–80.
Zamora, M. C., J. Chirife, and D. Roldán. 2006. On the nature of the relationship between water activity and % moisture in honey. Food Contr. 17:642–647.
Zhang, J., N. Dow, M. Duke, E. Ostarcevic, J.-D. Li, and S. Gray. 2010. Identification of material and physical features of membrane distillation membranes for high performance desalination. J. Membr. Sci. 349:295–303.
Zhang, J., J.-D. Li, and S. Gray. 2011. Effect of applied pressure on performance of PTFE membrane in DCMD. J. Membr. Sci. 369:514–525.