76
Performance Assessment Report Tajikistan Munawer Khwaja, Tomas Sudintas, Hassan Aliev and Ashok Sinha January 2020

Performance Assessment Report
TajikistanMunawer Khwaja, Tomas Sudintas, Hassan
Aliev and Ashok Sinha
January 2020

Tajikistan
Performance Assessment Report
Munawer Khwaja, Tomas Sudintas, Hassan Aliev and Ashok Sinha
January 2020

2
Contents Page
ABBREVIATIONS AND ACRONYMS ............................................................................4
PREFACE ............................................................................................................................5
EXECUTIVE SUMMARY .................................................................................................6
I. INTRODUCTION ..........................................................................................................13 A. Country Profile ..................................................................................................14 B. Data Tables ........................................................................................................14 C. Economic Situation ...........................................................................................14 D. Main Taxes ........................................................................................................16 E. Institutional Framework ....................................................................................17 F. Current Status of Tax Administration Reform ...................................................17 G. International Information Exchange .................................................................18
II. ASSESSMENT OF PERFORMANCE OUTCOME AREAS ......................................19 A. POA 1: Integrity of the Registered Taxpayer Base...........................................19 B. POA 2: Effective Risk Management .................................................................20 C. POA 3: Supporting Voluntary Compliance ......................................................25 D. POA 4: Timely Filing of Tax Declarations .......................................................29 E. POA 5: Timely Payment of Taxes.....................................................................31 F. POA 6: Accurate Reporting in Declarations ......................................................34 G. POA 7: Effective Tax Dispute Resolution ........................................................39 H. POA 8: Efficient Revenue Management ...........................................................41 I. POA 9: Accountability and Transparency ..........................................................44
Tables Table 1. Tajikistan: Summary of TADAT Performance Assessment ...................................8 Table 2. P1-1 Assessment ..................................................................................................19 Table 3. P1-2 Assessment ..................................................................................................20 Table 4. P2-3 Assessment ..................................................................................................22 Table 5. P2-4 Assessment ..................................................................................................23 Table 6. P2-5 Assessment ..................................................................................................23 Table 7. P2-6 Assessment ..................................................................................................24 Table 8. P2-7 Assessment ..................................................................................................25 Table 9. P3-8 Assessment ..................................................................................................26 Table 10. P3-9 Assessment ................................................................................................27 Table 11. P3-10 Assessment ...............................................................................................28 Table 12. P3-11 Assessment ...............................................................................................28 Table 13. P4-12 Assessment ..............................................................................................30 Table 14. P4-13 Assessment ..............................................................................................30 Table 15. P4-14 Assessment ..............................................................................................31 Table 16. P5-15 Assessment ..............................................................................................32 Table 17. P5-16 Assessment ..............................................................................................32

3
Table 18. P5-17 Assessment ..............................................................................................33 Table 19. P5-18 Assessment ..............................................................................................34 Table 20. P6-19 Assessment ..............................................................................................35 Table 21. P6-20 Assessment ..............................................................................................37 Table 22. P6-21 Assessment ..............................................................................................38 Table 23. P6-22 Assessment ..............................................................................................39 Table 24. P7-23 Assessment ..............................................................................................39 Table 25. P7-24 Assessment ..............................................................................................41 Table 26. P7-25 Assessment ..............................................................................................41 Table 27. P8-26 Assessment ..............................................................................................42 Table 28. P8-27 Assessment ..............................................................................................43 Table 29. P8-28 Assessment ..............................................................................................43 Table 30. P9-29 Assessment ..............................................................................................44 Table 31. P9-30 Assessment ..............................................................................................45 Table 32. P9-31 Assessment ..............................................................................................46 Table 33. P9-32 Assessment ..............................................................................................47 Figure 1. Tajikistan: Distribution of Performance Scores .............................................................12 Annexes I. TADAT Framework .......................................................................................................48 II. Tajikistan: Country Snapshot ........................................................................................50 III. Data Tables ..................................................................................................................51 IV. Organizational Chart ....................................................................................................64 V. Sources of Evidence ......................................................................................................65

4
ABBREVIATIONS AND ACRONYMS
CIT
DB
DRAPPDT
FAQ
GDP
IAD
ICT
ITMIS
Corporate Income Tax Doing Business Report
Department of Revenue Accounting & Payments and Processing of Tax Declarations
Frequently Asked Questions
Gross Domestic Project
Internal Audit Department
Information and Communication Technology
Integrated Tax Management System MoF
OECD
PAR
PAYE
Ministry of Finance
Organization for Economic Cooperation and Development
Performance Assessment Report
Pay As You Earn
PIT Personal Income Tax
POA Performance Outcome Area
SSC
SOE
TADAT
Social Security Contributions
State Owned Enterprises
Tax Administration Diagnostic Assessment Tool
TARP
TC
TFMIS
TIN
VAT
Tax Administration Reform Project
Tax Committee
Tajikistan Financial Management Information System
Taxpayer Identification Number
Value Added Tax
.

5
PREFACE
An assessment of the system of tax administration of the Republic of Tajikistan was undertaken during the period 16 to 29 December 2019 using the Tax Administration Diagnostic Assessment Tool (TADAT). TADAT provides an assessment baseline of tax administration performance that can be used to determine reform priorities, and, with subsequent repeat assessments, highlight reform achievements. The assessment was supported by the World Bank and the World Bank funded Tajikistan Tax Administration Reform Project (TARP). The assessment team was led by Munawer Khwaja and the following TADAT assessors: Hassan Aliev, Tomas Sudintas and Ashok Sinha all certified assessors. (all trained TADAT assessors). The team thanks Nasiba Saidova of the World Bank Country Office for her valuable assistance to the assessment team. The TADAT assessment team met the Mr. Nusratullo Davlatzoda, Chairman of the Tax Committee (TC) of Tajikistan, Mr. Ayubjon.M. Solehzoda, First Deputy Chairman, Narzullo Malikov, Deputy Chairman and other members of the senior and middle management of the TC. The team also visited the Large Taxpayer Office in Dushanbe, the local tax office in Wahdat rayon and the Chamber of Commerce and Industries for obtaining additional confirmation of evidence. The team expresses its sincere thanks to Mr. Davlatzoda, Mr. Solehzoda and the entire TC team that participated in the assessment, for their open and intensive engagement during discussions of the assessment and for their hospitality, collaboration and active participation during the assessment. The team is particularly grateful to Ms. Manizha Sayfiddinova, Head of the International Tax Cooperation Department, for the extensive coordination support provided throughout the assessment process. The assessment team would also like to thank Mr. Odinamohammad Nazrizoda, Project Coordinator of TARP and Mr. Jahonbek Mirzoev, Project Consultant of TARP. A draft performance assessment report (PAR) was presented to the Mr. Davlatov, Chairman of the TC at the end of the visit. Presentation of the report was also made to the representatives of relevant Ministries. Responses from the authorities have been incorporated in this final report which has been cleared by the TADAT Secretariat.

6
EXECUTIVE SUMMARY
The TC of Tajikistan has made significant progress in modernizing its administration in the last five years. Supported by the World Bank financed Tax Administration Reform Project (TARP), the major drive has been for the TC to become more efficient and effective in collecting revenue, enhance the level of voluntary compliance and improve the quality of taxpayer services. The development of the Integrated Tax Management Information System (ITMIS) has helped digitalize the registration process, tax declaration submission, electronic payment of taxes, electronic invoicing for VAT, generation of pre-filled returns and cross-matching of third-party information. The system has also allowed secure access to businesses and individuals to their taxpayer accounts. Internal and external audit mechanisms are well developed.
However, the TC has not yet leveraged the full potential of available data to systematically identify, quantify and mitigate compliance risks. A structured compliance risk management program is not yet in place. Also, the dispute resolution system is not well developed. There are tax policy constraints that restrict the payment of VAT refunds to just a handful of large exporters. The results of the TADAT assessment for Tajikistan follow, including the identification of the main strengths and weaknesses.
Strengths Weaknesses
• The taxpayer registration process and database
meet the standards of international good practice and accuracy is ensured.
• The internal and third-party data collection and processing allows comprehensive statistical analysis.
• The TC provides adequate and current information to taxpayers to meet their obligations.
• All tax declarations and payments are made electronically and in a timely manner.
• The TC revenue accounting system is robust and interfaces with the MOF’s financial management system.
• The internal and external audit functions are regular and well defined.
• The TC provides adequate support to the MOF in providing inputs to revenue forecasting, monitoring revenue collection, and tax expenditures.
• Taxpayer perception surveys are conducted regularly and follow up actions undertaken.
• Effective management of tax compliance and institutional risks lack international good practice.
• No tax gap analysis is currently undertaken.
• The TC does not have methodologies for auditing key taxpayer segments and economic sectors.
• The VAT refund and credit system is inadequate and is not based on risk assessment.
• The dispute resolution system is weak and rarely used by taxpayers.
• The taxpayer perception surveys and external audit reports of operational and financial performance are not made public.
• The TC does not have a proper mechanism for binding rulings or cooperative compliance arrangements.

7
Table 1 provides a summary of performance scores, and Figure 1 a graphical snapshot of the distribution of scores. The scoring is structured around the TADAT framework’s nine performance outcome areas (POAs) and 32 high level indicators critical to tax administration performance. An ‘ABCD’ scale is used to score each indicator, with ‘A’ representing the highest level of performance and ‘D’ the lowest.

8
Table 1. Tajikistan: Summary of TADAT Performance Assessment
Indicator Scores 2019 Summary Explanation of Assessment
POA 1: Integrity of the Registered Taxpayer Base P1-1. Accurate and reliable taxpayer information.
A
The registered taxpayer database meets the standards of international good practice. Documented procedures are applied routinely to ensure the accuracy of the taxpayer database. Reports certify to the confidence in the accuracy of the registration database.
P1-2. Knowledge of the potential taxpayer base. A
Actions are undertaken to identify businesses that fail to register using third-party sources and field inspections.
POA 2: Effective Risk Management P2-3. Identification, assessment, ranking, and quantification of compliance risks.
C
The TC has regular access to and conducts regular analysis of a large variety of data from internal and external sources. The data analysis is not geared to a systematic tax compliance risk management process—only a few elements of risk management are used. However, a comprehensive and structured risk assessment process is not developed yet.
P2-4. Mitigation of risks through a compliance improvement plan. C
The TC has documented annual plans which contain compliance improvement activities, but there are no consolidated operational planning documents to improve taxpayer compliance.
P2-5. Monitoring and evaluation of compliance risk mitigation activities. D
The process used to monitor and evaluate compliance risk mitigation is limited by the absence of a structured compliance risk assessment plan and evaluation criteria.
P2-6. Management of operational risks.
D
The TC has no comprehensive and periodic process to identify, assess, mitigate and evaluate operational risks. The comprehensive business continuity management program is not developed yet except for the information technology continuity program which is tested and audited.
P2-7. Management of human capital risks. D
There is no formal process to identify, assess, prioritize and mitigate human capital risks. The evaluation of human capital risks across the whole tax administration is not performed yet.
POA 3: Supporting Voluntary Compliance P3-8. Scope, currency, and accessibility of information. B
Information is made available to the public in respect of all core taxes, main areas of taxpayer obligations and all taxpayer segments through website and other delivery channels.

9
Indicator Scores 2019 Summary Explanation of Assessment
The TC has documented procedures and a dedicated department - Taxpayer Service Department - which provide specific and general dissemination of updates to information. A broad range of proactive taxpayer education programs is regularly conducted.
P3-9. Time taken to respond to information requests. A All telephone enquiries by taxpayers and
intermediaries are handled promptly.
P3-10. Scope of initiatives to reduce taxpayer compliance costs. B
The TC has established a simplified system of reporting and record keeping for small taxpayers. However, declarations are not examined routinely for removing parts that are not relevant.
P3-11. Obtaining taxpayer feedback on products and services. A Feedback from taxpayers is obtained routinely using
a variety of methods.
POA 4: Timely Filing of Tax Declarations P4-12. On-time filing rate. A Taxpayers file their declarations in a timely manner
for all core taxes.
P4-13. Management of non-filers. C
Ad hoc follow up actions are taken on non-filers and there are two documented procedures for such actions.
P4-14. Use of electronic filing facilities. A All tax declarations of core taxes are required to be
filed electronically.
POA 5: Timely Payment of Taxes P5-15. Use of electronic payment methods.
A All tax payments of core taxes are required to be made electronically.
P5-16. Use of efficient collection systems.
A Tax withholding at source and advance payments are routinely used.
P5-17. Timeliness of payments. A VAT payments are largely paid in a timely manner.
P5-18. Stock and flow of tax arrears. A The level of tax arrears of the TC is relatively low.
POA 6: Accurate Reporting in Declarations P6-19. Scope of verification actions taken to detect and deter inaccurate reporting.
D
The audit program is comprehensive and centralized; however, audit impact evaluations are ad hoc. The unified practice is assured by using advanced IT software and auditing manuals. However, there is no clear methodology to audit key economic industries. The audit outputs and quality are monitored on a regular basis using key performance indicators. Nevertheless, predefined quality auditing checklists are not used and audited taxpayers are not surveyed.

10
Indicator Scores 2019 Summary Explanation of Assessment
P6-20. Use of large-scale data-matching systems to detect inaccurate reporting.
B A wide range of automated crosschecking is conducted regularly to improve the accuracy of tax reporting.
P6-21. Initiatives undertaken to encourage accurate reporting. D
The public and private rulings instruments and cooperative compliance approaches are not applied yet.
P6-22. Monitoring the tax gap to assess inaccuracy of reporting levels.
D Methodologies to comprehensively estimate revenue losses from inaccurate reporting are not developed.
POA 7: Effective Tax Dispute Resolution P7-23. Existence of an independent, workable, and graduated dispute resolution process.
B
The first level administrative review process within the TC is multi-layered and the second level Appeal Board is not an external body. However, the administrative appeal process is very seldom used by taxpayers. The administrative review mechanism is physically and organizationally independent of the audit department. Information on taxpayer dispute rights and the dispute resolution process is publicly available and taxpayers are explicitly made aware of them.
P7-24. Time taken to resolve disputes. A The TC disposes of administrative review of appeals
filed by taxpayers in a timely manner.
P7-25. Degree to which dispute outcomes are acted upon.
A The TC responds regularly to dispute outcomes.
POA 8: Efficient Revenue Management P8-26. Contribution to government tax revenue forecasting process. A
The TC participates actively in the government’s budget exercise by providing inputs for revenue forecasting.
P8-27. Adequacy of the tax revenue accounting system.
A
TC’s automated Integrated Tax Management Information System (ITMIS) meets government IT and accounting standards, and interfaces with the MoF’s Tajik Financial Management Information System (TFMIS).
P8-28. Adequacy of tax refund processing. C+
There is no risk-based verification of VAT refund and fast track procedures. However, all refund claims of qualified exporters are paid promptly.
POA 9: Accountability and Transparency P9-29. Internal assurance mechanisms.
C+
The internal assurance mechanism ensures that all internal controls and TC procedures are complied with by the tax officials. However, the TC has a weak staff integrity assurance mechanism which does not meet standards of good international practice.
11
Indicator Scores 2019 Summary Explanation of Assessment
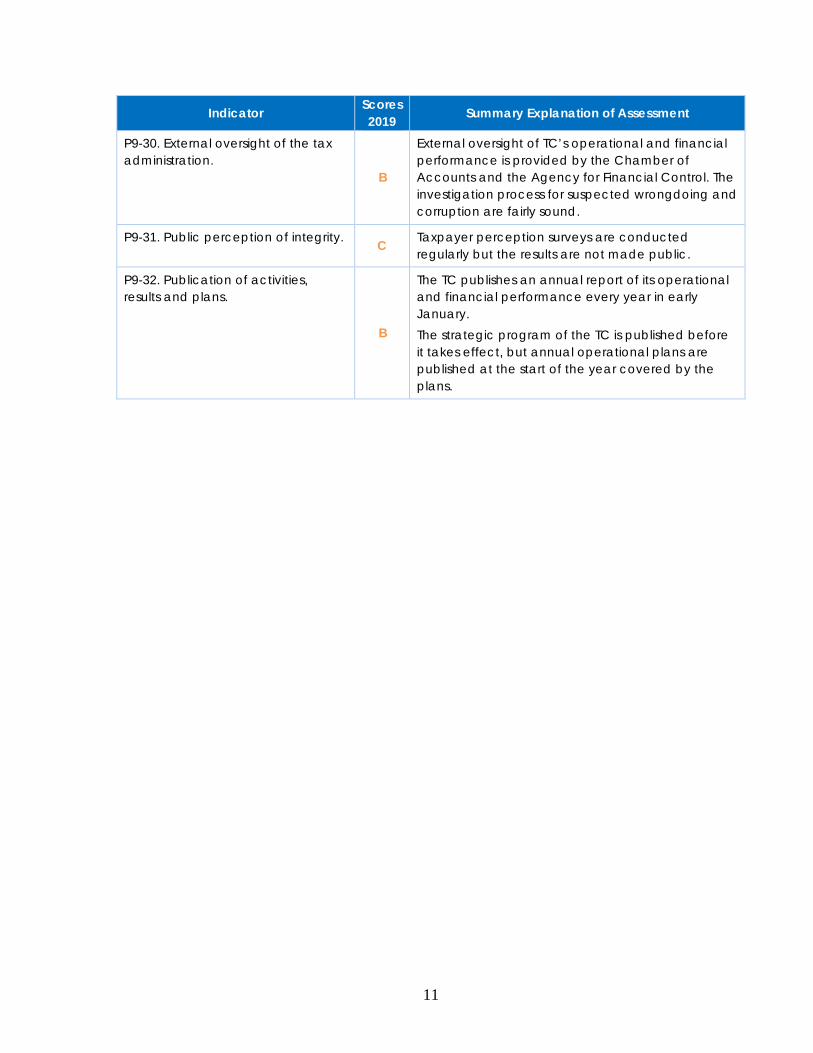
P9-30. External oversight of the tax administration.
B
External oversight of TC’s operational and financial performance is provided by the Chamber of Accounts and the Agency for Financial Control. The investigation process for suspected wrongdoing and corruption are fairly sound.
P9-31. Public perception of integrity. C Taxpayer perception surveys are conducted regularly but the results are not made public.
P9-32. Publication of activities, results and plans.
B
The TC publishes an annual report of its operational and financial performance every year in early January. The strategic program of the TC is published before it takes effect, but annual operational plans are published at the start of the year covered by the plans.

12
Indicator ScoreP1-1 AP1-2 AP2-3 CP2-4 CP2-5 DP2-6 DP2-7 DP3-8 BP3-9 AP3-10 BP3-11 AP4-12 AP4-13 CP4-14 AP5-15 AP5-16 AP5-17 AP5-18 AP6-19 DP6-20 BP6-21 DP6-22 DP7-23 BP7-24 AP7-25 AP8-26 AP8-27 AP8-28 C+P9-29 C+P9-30 BP9-31 CP9-32 B
Figure 1. Tajikistan: Distribution of Performance Scores

13
I. INTRODUCTION
This report documents the results of the TADAT assessment conducted in Tajikistan during the period 16th to 29th December 2019 and subsequently reviewed by the TADAT Secretariat. The report is structured around the TADAT framework of nine POAs and 32 high level indicators critical to tax administration performance that is linked to the POAs. Fifty-five measurement dimensions are taken into account in arriving at each indicator score. A four-point ‘ABCD’ scale is used to score each dimension and indicator: ‘A’ denotes performance that meets or exceeds international good practice. In this regard, for
TADAT purposes, a good practice is taken to be a tested and proven approach applied by a majority of leading tax administrations. It should be noted, however, that for a process to be considered ‘good practice’, it does not need to be at the forefront or vanguard of technological and other developments. Given the dynamic nature of tax administration, the good practices described throughout the field guide can be expected to evolve over time as technology advances and innovative approaches are tested and gain wide acceptance.
‘B’ represents sound performance (i.e. a healthy level of performance but a rung below international good practice).
‘C’ means weak performance relative to international good practice.
‘D’ denotes inadequate performance and is applied when the requirements for a ‘C’ rating or higher are not met. Furthermore, a ‘D’ score is given in certain situations where there is insufficient information available to assessors to determine and score the level of performance. For example, where a tax administration is unable to produce basic numerical data for purposes of assessing operational performance (e.g., in areas of filing, payment, and refund processing) a ‘D’ score is given. The underlying rationale is that the inability of the tax administration to provide the required data is indicative of deficiencies in its management information systems and performance monitoring practices.
For further details on the TADAT framework, see Attachment I. 1. Some points to note about the TADAT diagnostic approach are:
TADAT assesses the performance outcomes achieved in the administration of the major direct and indirect taxes critical to central government revenues, specifically corporate income tax (CIT), personal income tax (PIT), value added tax (VAT) , domestic excise tax (with a focus is on those registered domestic excise taxpayers who trade in the category of goods/services that contribute 70 percent of the total domestic excise revenue by value), and Pay As You Earn (PAYE) amounts withheld by employers (which, strictly speaking, are remittances of PIT).. By assessing outcomes in relation to administration of these core taxes, a picture can be developed of the relative strengths and weaknesses of a country’s tax administration.

14
TADAT assessments are evidence based (see Attachment V for the sources of evidence applicable to the assessment of [Insert country name]).
TADAT is not designed to assess special tax regimes, such as those applying in the natural resource sector. Nor does it assess customs administration.
TADAT provides an assessment within the existing revenue policy framework in a country, with assessments highlighting performance issues that may be best dealt with by a mix of administrative and policy responses.
2. The aim of TADAT is to provide an objective assessment of the health of key components of the system of tax administration, the extent of reform required, and the relative priorities for attention. TADAT assessments are particularly helpful in:
Identifying the relative strengths and weaknesses in tax administration.
Facilitating a shared view among all stakeholders (country authorities, international organizations, donor countries, and technical assistance providers).
Setting the reform agenda (objectives, priorities, reform initiatives, and implementation sequencing).
Facilitating management and coordination of external support for reforms and achieving faster and more efficient implementation.
Monitoring and evaluating reform progress by way of subsequent repeat assessments.
I. COUNTRY BACKGROUND INFORMATION
A. Country Profile
General background information on Tajikistan and the environment in which its tax system operates are provided in the country snapshot in Attachment II.
B. Data Tables
Numerical data gathered from the authorities and used in this TADAT performance assessment is contained in the tables comprising Attachment III.
C. Economic Situation
Tajikistan has enjoyed strong growth and poverty reduction since 2000 thanks to favorable external conditions. The Tajik economy expanded by 8.8 percent on average during 2000-08 which helped to register significant poverty reduction. Growth was facilitated by a large inflow

15
of remittances and official donor funding. As a percentage of GDP, remittances from Tajik working migrants is around 40 percent of GDP, one of the highest in the world. The high growth sustained throughout almost two decades helped to increase average incomes of population from $162 in 2000 to above $800 in 2017 and reduce poverty from above 80 percent to 29.5 percent of total population during the same period.
However, growth and poverty reduction have decelerated as the external environment deteriorated and past temporary growth propellers reached their limits. Despite the impressive achievements of the last two decades, Tajikistan remains a low-income and the poorest country in Central Asia. Growth becomes less inclusive and leads to fewer job creation. The Tajik economy was affected by the global financial crisis of 2008-09 and the resource price shock of 2014 which slowed the average growth to 6.6 percent during 2009-17. The external shocks affected the Tajik economy through a sharp (35 percent) decline in remittances during 2015-16 which was cushioned by countercyclical fiscal policy to sustain growth albeit at the cost of deteriorating the country’s debt profile.
Growth prospects in Tajikistan are overshadowed by the volatility, high concentration and unpredictable nature of remittances about 90 percent of which come from Russia. Household consumption, one of the main drivers of growth, has been largely supported by remittances which may not be sustainable at the same rate moving forward. At only 17 percent of GDP in 2017, Tajikistan’s export basket is the smallest in the region. The large share of commodity exports in total exports is another source of vulnerability and uncertainty as fluctuations of metal and cotton prices in international market immediately get reflected in the country’s export performance and external balance. There has been a rapid buildup of macro-fiscal pressures. Tajikistan countered the two large external shocks of 2008-09 and 2014 with expansionary fiscal policy. This propped up growth but pushed the fiscal deficit to above 7 percent of GDP and doubled the level of public and publicly guaranteed debt between 2014 and 2017. The country’s risk of debt distress is assessed to be high (53 percent of GDP in 2018). Fiscal space is, therefore, extremely limited and not in a position to play a countercyclical role in the event of external shocks.
The current rate of investment is low and has averaged 16 percent of GDP over the 2007-17 period, which is low compared with other countries in the same income group (around 30 percent investment to GDP ratio). Besides the level, the structure of total investments is also a concern in Tajikistan. Compared with its peers, Tajikistan has a large share of public investments hence a relatively large public capital stock as a share of GDP. The domestic private sector has a very modest presence, contributing only 15 percent of total investments (3-4 percent of GDP), accounting for about 30 percent of industrial output, and only about 13 percent of formal employment.1 At the same time, state-owned enterprises (SOEs), which often crowd out formal private sector activity, are generally operationally inefficient and
1 Strokova and Ajwad (2017).

16
financially in the red. These outcomes can be explained by an underdeveloped, though improved, business environment, reflected in Tajikistan’s DB ranking of 106th among 190 countries in the 2020 Doing Business (DB) indicators2 and 79th out of 137 countries in the World Economic Forum’s 2017-18 Global Competitiveness Index. Revenue performance has improved gradually, rising from 13 per cent of GDP in 2000 to 24 percent in 2018; Economic growth, as well as tax policy and administration changes including the enactment of a new Tax Code in 2013, supported this gradual improvement in tax effort. At 24 percent of GDP, Tajikistan’s total tax effort is in the range recorded by lower-middle-income countries. However, it is insufficient to support Tajikistan’s robust development agenda of poverty reduction, social service delivery, and infrastructure upgrade and expansion.
D. Main Taxes
The new Tax Code enacted in Tajikistan in 2013 introduced improvements to the tax system including reduction in the number of taxes from 14 to 10.3 Under the new Tax Code, the core taxes are as follows: (i) corporate income tax (CIT); (ii) personal income tax (PIT); (iii) payroll-related tax (personal income and social tax); (iv) value added tax (VAT); and (v) excise taxes. Other sources of tax revenues include: (i) primary (aluminum and cotton) sales tax; (ii) road users’ tax; (iii) tax on natural resources; (iv) property and land taxes; (v) tax withheld at the source of payment from incomes of non-residents. The country also employs special tax regimes for small and micro enterprises (simplified) and for the agriculture sector (unified tax). The VAT is the largest contributor to tax revenues at 8.7 percent of GDP. The TC collects domestic VAT (3.2 percent of GDP) while the Customs Service collects VAT on export (5.5 percent of GDP).4 VAT generates 35.8 percent of total revenue collections (including social security contributions). CIT generates 2.4 percent of GDP (about 10.1 percent of total tax collections).5 PIT,6 including that withhold at source, contributes 2.6 percent of GDP (10.7 percent of total tax revenues), while excise duties, on both domestic and imported products, contribute 0.6 percent of GDP (2.6 percent of total revenues). Social security contributions (SSC) account for 2.5
2 Tajikistan scores relatively well in enforcing contracts (ranked 76th) but lags behind on paying taxes (139th) and access to electricity (163rd). Tajikistan made starting a business easier (36th) by integrating social protection registration into the company incorporation process. It also strengthened access to credit (11th) by launching a unified, modern notice-based collateral registry. 3 World Bank. Tajikistan Country Economic Memorandum: Nurturing Tajikistan’s Growth Potential. May 2019 4 VAT standard rate is 18 percent with reduced rates for certain activities and a zero rate for exports for businesses that export more than 70 percent of their gross turnover. 5 CIT rate: 13 percent for industrial and 23 percent for other taxpayers. 6 PIT has progressive rates ranging from 8 percent to 13 percent. There is final withholding on interest and dividend at 12 percent.
(continued)

17
percent of GDP or 10.4 percent of total revenues.7 Enterprises with a gross turnover of less than one million somoni fall under the simplified regime.8
E. Institutional Framework
The TC of Tajikistan is responsible for tax administration. The TC is directly under the Government and not under the Ministry of Finance. Main legal authorities are derived from the Tax Code of 17th September 2012 and the Regulation of the TC dated 31st August 2012 as amended in 2013 and 2016. The TC is headed by a Chairman appointed by the President. The leadership team also includes the First Deputy Chairman and four Deputy Chairmen. The headquarters is based in Dushanbe, with three oblast-level tax offices, (one in the city of Dushanbe and one in each of the oblasts), a Large Taxpayer Office, and 68 rayon-level tax offices (inspectorates). The TC has a staff of 2,300 including support staff, of with tax officials are 1,840. About 185 employees work at the headquarters and rest work in field tax offices. Administration and collection of customs revenues is the responsibility of the State Customs Service reporting to the Government. An organizational chart of the TC is provided in Attachment IV.
F. Current Status of Tax Administration Reform
In 2010, the Government of Tajikistan adopted a Tax Administration Reform Program for 2010-2015 (extended to 2019), whose key reform objective is to support the tax administration to become more efficient and effective—in collecting revenue, enhancing the level of voluntary compliance, and improving the quality of taxpayer services. More specifically, the program aims to: (i) reduce the administrative cost of collecting revenue; (ii) fight tax evasion and reduce the size of the shadow economy; (iii) reduce contact between tax officials and taxpayers and in the process reduce avenues for corruption and create conditions for increased level of voluntary compliance; and (iv) provide good quality taxpayer services that would help reduce the compliance burden for taxpayers, thus improving the business environment and competitiveness. The World Bank has financed a Tax Administration Reform Project which is helping in implementing the above program. The recently published Doing Business 2020 Report showed Tajikistan among the top 20 reformers in 2019 with significant tax administration improvements in Tajikistan. The paying taxes rating is up by 34 points since 2016– from 173 to 139, mainly due to the introduction of an easy-to-use electronic filing and payment system for corporate income tax, VAT and labor taxes. The number of e-services provided by the TC to taxpayers is growing. Currently, thirty-six services are provided electronically to taxpayers, including, e-filing, VAT invoices, Tax Code Android (compressed, executable application file containing the code and resources necessary to activate a single Android program on the Linux-based mobile phone platform), call center, and tax calculator on three taxes. Recently, the TC introduced an e-request facility for taxpayers to request
7 For SSC, employers pay 25 percent of the wage bill and employees pay 1percent. 8 Enterprises under the simplified regime pay a tax of 5 percent for production and 6 percent for trade and other activities.

18
their letter for tax clearance certification of no arrears and the confirmation that they are registered with the TC. In addition, all patent applications are now processed by the central system—all local offices have been linked into the network and scanners (for copies of their personal identification documents) have been installed. The work on the Human Resource Management Information System or HRMIS system has been completed and it was launched on September 1, 2017. A Call Center was established in 2015 and it is linked to two other satellite contact centers based in the regions. The three centers back-up each other and handle each other’s workload if an overflow situation occurs.
G. International Information Exchange
Tajikistan has bilateral tax agreements with a number of countries and is expanding its international multilateral cooperation for international information exchange. Tajikistan has double taxation treaties with 36 countries, including Germany, Belarus, the Russian Federation, Ukraine, Kazakhstan, Uzbekistan, India, United Arab Emirate, and China. Bilateral treaties on indirect taxes are signed with Kazakhstan and Belarus. Tajikistan has also signed bilateral agreements on mutual assistance and cooperation on tax compliance issues with Armenia, Azerbaijan, Georgia, Kazakhstan, Kyrgyzstan, Moldova, the Russian Federation, Tajikistan Turkmenistan, Ukraine, and Uzbekistan.9 Tajikistan is not a member of the Organization for Economic Cooperation Development’s (OECD) Global Forum on Transparency and Exchange of Information for Tax Purposes. Tajikistan is one of 34 members of Belt and Road Initiative Tax Administration Cooperation Memorandum.
9 http://www.nalog.gov.by/ru/mezdunarodnoe_sotrudnichestvo_ru/

19
II. ASSESSMENT OF PERFORMANCE OUTCOME AREAS
A. POA 1: Integrity of the Registered Taxpayer Base
A fundamental initial step in administering taxes is taxpayer registration and numbering. Tax administrations must compile and maintain a complete database of businesses and individuals that are required by law to register; these will include taxpayers in their own right, as well as others such as employers with PAYE withholding responsibilities. Registration and numbering of each taxpayer underpins key administrative processes associated with filing, payment, assessment, and collection. Two performance indicators are used to assess POA 1: P1-1—Accurate and reliable taxpayer information.
P1-2—Knowledge of the potential taxpayer base.
P1-1: Accurate and reliable taxpayer information For this indicator two measurement dimensions assess: (1) the adequacy of information held in the tax administration’s registration database and the extent to which it supports effective interactions with taxpayers and tax intermediaries (i.e. tax advisors and accountants); and (2) the accuracy of information held in the database. Assessed scores are shown in Table 2 followed by an explanation of reasons underlying the assessment. Table 2. P1-1 Assessment
Measurement dimensions Scoring Method
Score 2019
P1-1-1. The adequacy of information held in respect of registered taxpayers and the extent to which the registration database supports effective interactions with taxpayers and tax intermediaries. M1
A A
P1-1-2. The accuracy of information held in the registration database. A
The registered taxpayer database meets the standards of international good practice. The database is centralized and computerized and interfaces with other subsystems for tax filing, payment and audit. All individuals above the age of 16 years must obtain a taxpayer identification number (TIN) and are required to register a business only when they start an economic activity. This business registration is provided by the one-stop-shop of the TC. Each registered taxpayer has a unique 9-digit TIN that includes a check digit. The database contains all relevant information which allows frontline staff with a whole-of-taxpayer view of a taxpayer’s details including identity of related parties and associated entities across all taxes and generates management information by entity type, economic sectors and tax types. The system enables quick identification and tracking of inactive taxpayers and which allows for deregistration of taxpayers

20
who have stopped economic activities. Dormant taxpayers are highlighted and followed up without the need for deactivation. The registration database and linked subsystems are used to generate pre-filled tax declarations. The subsystem provides secure online access to taxpayers to register businesses and update information. There is audit trail of user access to the system. Documented procedures are applied routinely to ensure the accuracy of the taxpayer database. The accuracy of information for taxpayers is authenticated by automated cross-checking of information from other databases such as property registry, motor vehicle office, social security and bank information. The system identifies duplicate as well as bogus registrations because of the unique TIN provided to every resident who is above 16 years of age. The TC conducted a cleanup operation in 2018 where 29,000 duplicate registrations belonging to a legacy registration system of 1999 to 2018 where deleted. The system tracks non-filers and if it is found that they have ceased economic activities, they are required to apply for deregistration through a stepped process of suspension before they are finally deregistered. A government resolution issued in 2017 requires taxpayers’ registration to be suspended if inactive for more than six months; and to be excluded from the taxpayer register if delinquent for more than 12 months based on the findings of the TC’s exclusion commission. The annual reports for 2017 and 2018 indicated a good level of confidence in the accuracy of the taxpayer database. P1-2: Knowledge of the potential taxpayer base This indicator measures the extent of tax administration efforts to detect unregistered businesses and individuals. The assessed score is shown in Table 3 followed by an explanation of reasons underlying the assessment. Table 3. P1-2 Assessment
Measurement dimension Scoring Method
Score 2019
P1-2. The extent of initiatives to detect businesses and individuals who are required to register but fail to do so. M1 A
Actions are undertaken to identify businesses that fail to register. The TC issues orders every six months directing the field offices to conduct field inspections of specific sectors to detect new taxpayers Third party information from a variety of sources are also used to detect unregistered businesses. Quarterly/monthly reports indicate how many new taxpayers were added to the register as a result of these actions. In addition, the annual report mentions the action taken by the TC to detect new taxpayers. The TC’s journal Boju Khiroj also reports from time to time efforts made by the TC on detecting new taxpayers.
B. POA 2: Effective Risk Management
Tax administrations face numerous risks that have the potential to adversely affect revenue and/or

21
tax administration operations. For convenience, these risks can be classified as: Compliance risks—where revenue may be lost if businesses and individuals fail to meet the
four main taxpayer obligations (i.e. registration in the tax system; filing of tax declarations; payment of taxes on time; and complete and accurate reporting of information in declarations); and
Institutional risks—where tax administration functions may be interrupted if certain external or internal events occur, such as natural disasters, sabotage, loss or destruction of physical assets, failure of IT system hardware or software, strike action by employees, and administrative breaches (e.g., leakage of confidential taxpayer information which results in loss of community confidence and trust in the tax administration). For TADAT purposes, institutional risk is divided into two components. These are:
o Operational risk—refers to disruptive actions that destroy or affect part or all of the administration’s assets and resources, such as buildings, IT, and other equipment, data and records; and
o Human capital risk—refers to interruptions that affect the tax administration arising out of capability, capacity, compliance, cost and connection (engagement) gaps of and by its employees.
Risk management is essential to effective tax administration and involves a structured approach to identifying, assessing, prioritizing, and mitigating risks. It is an integral part of multi-year strategic and annual operational planning. Five performance indicators are used to assess POA 2: P2-3—Identification, assessment, ranking, and quantification of compliance risks.
P2-4—Mitigation of risks through a compliance improvement plan.
P2-5—Monitoring and evaluation of compliance risk mitigation activities.
P2-6—Management of operational (i.e. systems and processes) risks.
P2-7—Management of human capital risks.
P2-3: Identification, assessment, ranking, and quantification of compliance risks For this indicator two measurement dimensions assess: (1) the scope of intelligence gathering and research to identify risks to the tax system; and (2) the process used to assess, rank, and quantify compliance risks. Assessed scores are shown in Table 4 followed by an explanation of reasons underlying the assessment.

22
Table 4. P2-3 Assessment
Measurement dimensions Scoring Method
Score 2019
P2-3-1. The extent of intelligence gathering and research to identify compliance risks in respect of the main tax obligations.
M1 A
C P2-3-2. The process used to assess, rank, and quantify taxpayer compliance risks. C
The TC has regular access to and conducts regular analysis of a large variety of data from internal and external sources. External data sources include the National Bank and the commercial banks, the Customs, the Social Protection Fund, the Property Register, the Public Procurement Agency, the online transactional data from taxpayers’ cash registers, invoicing systems and gasoline stations. The data exchange processes are automated. At the TC, the data is stored in a centralized data warehouse that is used for analytics. Internal and external data sources allow statistical analysis and crosschecking of data for all taxpayer segments, by all tax types, and core tax obligations. A wide range of automated and parametrized statistical reports are available for the TC staff in the ITMIS. The TC performs regular environmental scan analysis and interpretation of external and internal data, including specific surveys on taxpayers’ perception; however, tax gap analysis is not conducted yet. The data analysis is not geared to systematic tax compliance risk management. The TC does not have a separate unit with responsibilities for tax compliance analysis and compliance risk information gathering. Analytical research tasks and risk knowledge accumulation are distributed to organizational departments based on their core functions; however, consolidated and systematic analysis of compliance risks is not conducted and not focused on key segments. There is a Data Center with a statistical analysis unit, which regularly performs quantitative analysis by using internal and external data with a breakdown by core taxes, key taxpayer segments, main tax obligations. Analysis does not systematically measure trends and performance indicators for different taxpayer segments, industries and tax obligations. Audit results are analyzed on a periodic basis, but aggregate analysis of audit outcomes is not systematic. Elements of risk management are used; however, a comprehensive and structured risk assessment process is not developed yet. The TC does not have in place a comprehensive compliance risk management methodology, regulations or process that meet the contemporary international good practice and allows to feed the multi-year strategic planning process. The TC does not have a separate unit for compliance risk management. Risk management is assigned to the organizational units of the TC responsible for registration, filing, payment, reporting, and auditing. The TC Development Program, annual plans of the TC on budget revenue collection and annual plans of the TC departments call for activities to increase taxpayer compliance and mitigate risks. However, it does not have focus on all core taxes, main tax obligations, key taxpayer segments, and industries of economic importance.

23
P2-4: Mitigation of risks through a compliance improvement plan
This indicator examines the extent to which the tax administration has formulated a compliance improvement plan to address identified risks. The assessed score is shown in Table 5 followed by an explanation of reasons underlying the assessment.
Table 5. P2-4 Assessment
Measurement dimension Scoring Method
Score 2019
P2-4. The degree to which the tax administration mitigates assessed risks to the tax system through a compliance improvement plan. M1 C
The TC has documented annual plans which contains compliance improvement activities, but there are no consolidated operational planning documents to improve taxpayer compliance. The tax compliance multi-year priorities are described in multi-year Development Program of tax administration and annual operation plans on budget collection but there is no consolidated operational plan at the TC. The quarterly and annual operational planning documents are developed at the level of each of the organizational department responsible for core functions of tax administrations. Activities within these documents are focused on implementation of assigned functions, improvement in TC’s performance and improving taxpayer compliance. However, operational documents do not clearly structure the compliance improvement activities around core taxes, main obligations and key taxpayer segments. The organizational departments of the TC are assigned with appropriate functional tasks and reports the progress on a monthly basis. The Collegium monitors the implementation of strategic and operational tasks on the quarterly basis. P2-5: Monitoring and evaluation of compliance risk mitigation activities This indicator looks at the process used to monitor and evaluate compliance mitigation activities. The assessed score is shown in Table 6 followed by an explanation of reasons underlying the assessment. Table 6. P2-5 Assessment
Measurement dimension Scoring Method
Score 2019
P2-5. The process used to monitor and evaluate the impact of compliance risk mitigation activities. M1 D
The process used to monitor and evaluate compliance risk mitigation is limited by the absence of a structured compliance risk assessment plan and evaluation criteria. The progress and implementation of tasks set by the TC Development Program, the annual plans on budget revenue collection and the operational plans of the organizational departments are monitored regularly by the Collegium of the TC. However, these documents do not clearly

24
identify compliance risks of the taxpayers and there no clear evaluation criteria defined to evaluate targeted outputs and outcomes. Implementation of the TC Development Program and the operational plans of the organizational departments are monitored by the by the Collegium of the TC on a quarterly basis.10
P2-6: Management of operational risks
This indicator examines how the tax administration manages operational risks other than those related to human resources. The assessed score is shown in Table 7 followed by an explanation of reasons underlying the assessment.
Table 7. P2-6 Assessment
Measurement dimensions Scoring Method
Score 2019
P2-6-1. The process used to identify, assess and mitigate operational risks. M1
D D P2-6-2. The extent to which the effectiveness of the business continuity
program is tested, monitored and evaluated. D
The TC has no comprehensive and periodic process to identify, assess, mitigate and evaluate operational risks. The mitigation of operational risks is assigned to organizational departments of the TC based on their core functions. The TC has no dedicated unit with assigned function to manage or coordinate the process within the TC. The TC has no register of operational risks and no dedicated risk management program to manage priority risks. However, separate regulatory documents to mitigates risks of emergency situations, interferences in operation of the ICT platform, data security, ICT platform operational continuity, are in place. The assessment and mitigation of operational risks via business impact analysis and business continuity program is not conducted. However, for ICT systems is done and update on ad hoc basis. The staff training program is conducted regularly on operational risk management roles and responsibilities but limited only for emergency cases and ICT continuity program. The comprehensive business continuity management program is not developed yet, however IT continuity program is tested and audited. The TC has not yet developed the business
10 In its post-assessment comments, the TC highlighted that, in accordance with articles 43 and 44 of the Tax Code, risk criteria are approved by the order of the Chairman No. 127 of 20.04.2016 "on assessing risk criteria" and Order No. 126 of 20.04.2016 "on the average tax burden". These criteria are implemented in the ITMIS software product. These actions are not disputed in the PAR and are adequately reflected in the scoring of indicators P2-3 and P2-4. However, these actions are not adequate for P2-5 which requires processes for monitoring and evaluating the impact of compliance risk mitigation activities. As mentioned above, there are no clear evaluation criteria defined to evaluate targeted outputs and outcomes.

25
continuity management program. The testing and auditing of business continuity limited to exercising emergency situations and conducting auditing by internal auditors of the TC. The business continuity plan, recovery time and response points objectives of the ICT platform are tested and audited by external auditors and certified. The updates to the emergency situation instructions and ICT business continuity program are not regular.
P2-7: Management of human capital risks
This indicator examines how the tax administration manages human capital risks. The assessed score is shown in Table 8 followed by an explanation of reasons underlying the assessment.
Table 8. P2-7 Assessment
Measurement dimensions Scoring Method
Score 2019
P2-7-1. The extent to which the tax administration has in place the capacity and structures to manage human capital risks.
M1 D
D P2-7-2. The degree to which the tax administration evaluates the status of human capital risks and related mitigation interventions. D
There is no formal process in place to identify, assess, prioritize and mitigate human capital risks. The human resource policy making function within the tax administration (headquarters and regional tax offices) is assigned to the HR and Special Work Department at the TC headquarters. The independent evaluation of human capital risks across the whole tax administration is not performed yet. There is no human capital risk management process and no evaluation/prioritization of human capital risks is done by the TC or by competent independent persons.
C. POA 3: Supporting Voluntary Compliance
To promote voluntary compliance and public confidence in the tax system, tax administrations must adopt a service-oriented attitude toward taxpayers, ensuring that taxpayers have the information and support they need to meet their obligations and claim their entitlements under the law. Because few taxpayers use the law itself as a primary source of information, assistance from the tax administration plays a crucial role in bridging the knowledge gap. Taxpayers expect that the tax administration will provide summarized, understandable information on which they can rely. Efforts to reduce taxpayer costs of compliance are also important. Small businesses, for example, gain from simplified record keeping and reporting requirements. Likewise, individuals with relatively simple tax obligations (e.g., employees, retirees, and passive investors) benefit from simplified filing arrangements and systems that eliminate the need to file.

26
Four performance indicators are used to assess POA 3: P3-8—Scope, currency, and accessibility of information.
P3-9—Time taken to respond to information requests.
P3-10—Scope of initiatives to reduce taxpayer compliance costs.
P3-11—Obtaining taxpayer feedback on products and services.
P3-8: Scope, currency, and accessibility of information
For this indicator four measurement dimensions assess: (1) whether taxpayers have the information they need to meet their obligations; (2) whether the information available to taxpayers reflects the current law and administrative policy; (3) how easy it is for taxpayers to obtain information. Assessed scores are shown in Table 9 followed by an explanation of reasons underlying the assessment. Table 9. P3-8 Assessment
Measurement dimensions Scoring Method
Score 2019
P3-8-1. The range of information available to taxpayers to explain, in clear terms, what their obligations and entitlements are in respect of each core tax.
M1
B
B P3-8-2. The degree to which information is current in terms of the law and administrative policy.
A
P3-8-3. The ease by which taxpayers obtain information from the tax administration.
A
Information is made available to the public in respect of all core taxes, main areas of taxpayer obligations and all taxpayer segments through website and other delivery channels. Information is mainly disseminated through various meetings and seminars conducted by the TC. The website information lacks simplified explanations on laws and regulations. However, the TC publishes a weekly journal Boju Khiroj which provides information in simplified language on a wide range of tax-related topics regularly. There are 55,000 taxpayers who subscribe to this weekly at a nominal yearly subscription of 65 somoni (about USD 7). Information is tailored to the needs of all segments of taxpayers, tax intermediaries and disadvantaged groups, such as farmers and unskilled patent holders. The TC has documented procedures and a dedicated department - Taxpayer Service Department - which provide specific and general dissemination of updates to information. In addition, the weekly journal provides information to taxpayers. Taxpayers are also informed through proactive engagement before the law takes effect. During 2018, for targeted

27
communication, the TC conducted 2,500 seminars, 677 TV and radio bulletins and regular internet feeds to keep taxpayers updated with general and specific information. A broad range of proactive taxpayer education programs is regularly conducted. During 2019, so far, 20 universities and schools have been covered to impart education on taxation and citizens’ responsibilities. On 21st December 2019, a competition was organized for university students to award those who have the best knowledge of tax laws and procedures. Information is available regarding core taxes and all taxpayer segments through a number of channels like websites, regular seminars and meeting with business associations at the headquarters and local offices. The TC website www.andoz.tj runs 24 hours and throughout the year with dedicated staff regularly updating the information regarding changes in tax laws and administrative procedure. All information is available to the taxpayers free of cost except for the 65 somoni (USD 7) annual subscription to the TC’s weekly journal Boju Khiroj. There are 37 e-Terminals with dedicated fiber optics lines in remote tax offices where internet access is weak—this enables taxpayers meet their tax declaration and payment obligations electronically. P3-9: The time taken to respond to requests for information. This indicator examines how quickly the tax administration responds to requests by taxpayers and tax intermediaries for information (for this dimension, waiting time for telephone enquiry calls is used as a proxy for measuring a tax administration’s performamnce in information requests generally). Assessed scores are shown in Table 10 followed by an explanation of reasons underlying the assessment. Table 10. P3-9 Assessment
Measurement dimension Scoring Method
Score 2019
P3-9: The time taken to respond to taxpayers and tax intermediaries’ requests for information. M1 A
All telephone enquiries by taxpayers are handled promptly. Three dedicated call centers in Dushanbe and two other locations have an automated recording and monitoring system through which calls are recorded and answered by operators. Logs of all responses by operators are kept on a daily basis and consolidated into weekly and monthly reports. These reports show that 100 percent of taxpayer enquiries were answered in less than six minutes. TC instructions laying out the methodology for the call center require calls to be answered within three minutes. See Table 3 in Attachment III.
28
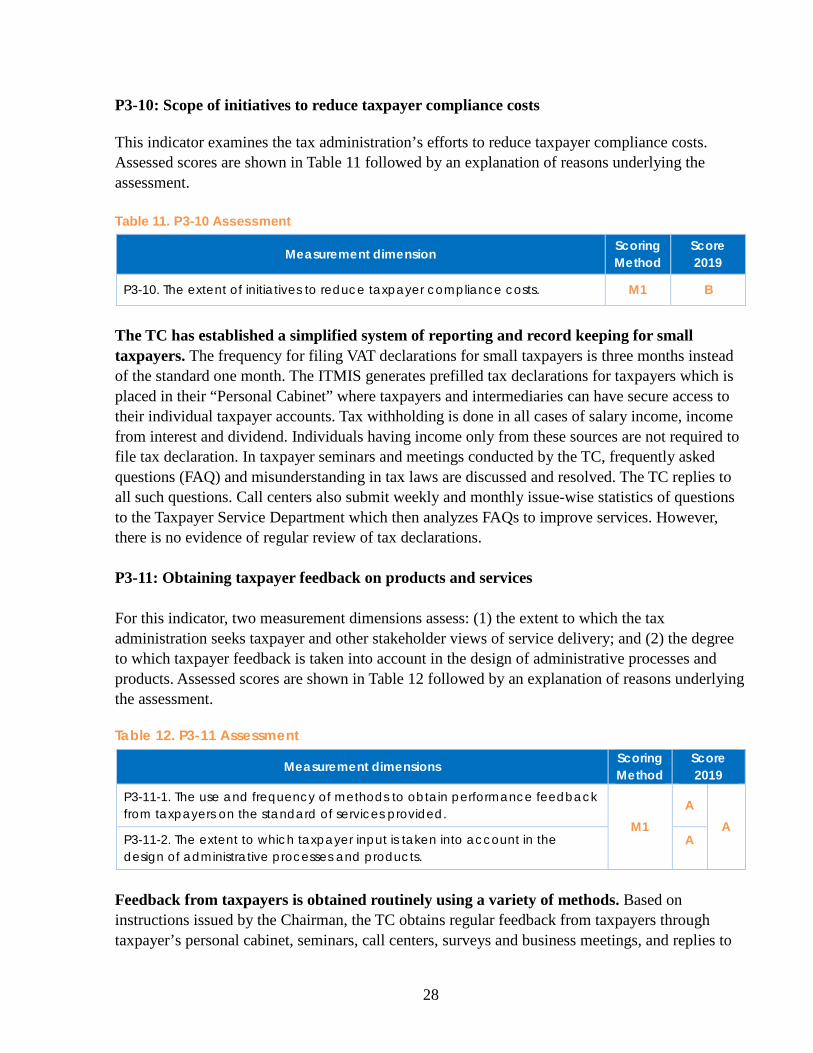
P3-10: Scope of initiatives to reduce taxpayer compliance costs This indicator examines the tax administration’s efforts to reduce taxpayer compliance costs. Assessed scores are shown in Table 11 followed by an explanation of reasons underlying the assessment. Table 11. P3-10 Assessment
Measurement dimension Scoring Method
Score 2019
P3-10. The extent of initiatives to reduce taxpayer compliance costs. M1 B
The TC has established a simplified system of reporting and record keeping for small taxpayers. The frequency for filing VAT declarations for small taxpayers is three months instead of the standard one month. The ITMIS generates prefilled tax declarations for taxpayers which is placed in their “Personal Cabinet” where taxpayers and intermediaries can have secure access to their individual taxpayer accounts. Tax withholding is done in all cases of salary income, income from interest and dividend. Individuals having income only from these sources are not required to file tax declaration. In taxpayer seminars and meetings conducted by the TC, frequently asked questions (FAQ) and misunderstanding in tax laws are discussed and resolved. The TC replies to all such questions. Call centers also submit weekly and monthly issue-wise statistics of questions to the Taxpayer Service Department which then analyzes FAQs to improve services. However, there is no evidence of regular review of tax declarations. P3-11: Obtaining taxpayer feedback on products and services For this indicator, two measurement dimensions assess: (1) the extent to which the tax administration seeks taxpayer and other stakeholder views of service delivery; and (2) the degree to which taxpayer feedback is taken into account in the design of administrative processes and products. Assessed scores are shown in Table 12 followed by an explanation of reasons underlying the assessment.
Table 12. P3-11 Assessment
Measurement dimensions Scoring Method
Score 2019
P3-11-1. The use and frequency of methods to obtain performance feedback from taxpayers on the standard of services provided.
M1 A
A P3-11-2. The extent to which taxpayer input is taken into account in the design of administrative processes and products.
A
Feedback from taxpayers is obtained routinely using a variety of methods. Based on instructions issued by the Chairman, the TC obtains regular feedback from taxpayers through taxpayer’s personal cabinet, seminars, call centers, surveys and business meetings, and replies to

29
all relevant questions. As part of the World Bank TARP, perception surveys have been regularly conducted by an independent expert survey agency Crowe Howarth. The last two perception surveys were conducted in 2017 and 2019. The surveys were based on statistically valid samples and tested. The TC regularly consults with taxpayer groups and intermediaries to identify deficiencies. Letter dated 23rd September 2019 from the Head of the Legal Department to the Chairman TC demonstrates that out of 80 suggestions by taxpayers, 27 were recommended for resolution and consideration. By decision No. 6 dated 13th June 2019, the TC Chairman responded to taxpayers’ suggestion regarding e-token, accepting their request to make them free of charge. The TC’s website has a section where taxpayers can report suggestions for improving IT processes, forms and products.
D. POA 4: Timely Filing of Tax Declarations
Filing of tax declarations (also known as tax returns) remains a principal means by which a taxpayer’s tax liability is established and becomes due and payable. As noted in POA 3, however, there is a trend towards streamlining preparation and filing of declarations of taxpayers with relatively uncomplicated tax affairs (e.g., through pre-filling tax declarations). Moreover, several countries treat income tax withheld at source as a final tax, thereby eliminating the need for large numbers of PIT taxpayers to file annual income tax declarations. There is also a strong trend towards electronic filing of declarations for all core taxes. Declarations may be filed by taxpayers themselves or via tax intermediaries.
It is important that all taxpayers who are required to file do so, including those who are unable to pay the tax owing at the time a declaration is due (for these taxpayers, the first priority of the tax administration is to obtain a declaration from the taxpayer to confirm the amount owed, and then secure payment through the enforcement and other measures covered in POA 5). Three performance indicators are used to assess POA 4: P4-12—On-time filing rate.
P4-13—Management of non-filers
P4-14—Use of electronic filing facilities.
P4-12: On-time filing rate A single performance indicator, with four measurement dimensions, is used to assess the on-time filing rate for CIT, PIT, VAT and domestic excise tax, and PAYE withholding declarations. A high on-time filing rate is indicative of effective compliance management including, for example, provision of convenient means to file declarations (especially electronic filing facilities), simplified declarations forms, and enforcement action against those who fail to file on time.

30
Assessed scores are shown in Table 13 followed by an explanation of reasons underlying the assessment. Table 13. P4-12 Assessment
Measurement dimensions Scoring Method
Score 2019
P4-12-1. The number of CIT declarations filed by the statutory due date as a percentage of the number of declarations expected from registered CIT taxpayers.
M2
A
A
P4-12-2. The number of PIT declarations filed by the statutory due date as a percentage of the number of declarations expected from registered PIT taxpayers.
A
P4-12-3. The number of VAT declarations filed by the statutory due date as a percentage of the number of declarations expected from registered VAT taxpayers.
A
P4-12-4. The number of domestic excise tax declarations filed by the statutory due date as a percentage of the number of declarations expected from registered domestic excise taxpayers.
B
P4-12-5. The number of PAYE withholding declarations filed by employers by the statutory due date as a percentage of the number of PAYE declarations expected from registered employers.
A
Taxpayers file their declarations in a timely manner. The ITMIS does a real time tracking of all declarations that are filed and follows up immediately with a notice to taxpayers when there is a delay. As a result, 91.5 percent of all CIT taxpayers, and 100 percent of large taxpayers submit their declarations on time. 93.3 percent of PIT declarations are filed on time. 95.9 percent of all VAT taxpayers and all large taxpayers file their declarations timely. 96.6. percent of all excise taxpayers and 96.7 percent of large excise taxpayers file their declarations in a timely manner. 95.8 percent of all PAYE declarations are filed on time. Tables 4 to 10 in Attachment III. P4-13: Management of non-filers
This indicator measures the extent to taxpayers who have failed to file declarations when due are managed. The assessed score is shown in Table 14 followed by an explanation of reasons underlying the assessment. Table 14. P4-13 Assessment
Measurement dimension Scoring Method
Score 2019
P4-13. Action taken to follow up non-filers. M1 C
Follow up actions are taken on non-filers on an ad hoc basis and there are no documented procedures. The IT system has an automated process to identify non-filers soon after the due

31
dates. The system automatically generates a statutory penalty of 0.05 per cent per day of the total tax amount (based on pre-filled information). Dedicated staff of the Tax Organization Department of the TC are responsible for follow up actions on non-filers. There are two documented procedures in place for filing enforcement in the form of Chairman’s orders No. 9 dated 10.01.2013 and No. 316 dated 12.07.2017. Communication goes to taxpayer’s personal cabinet on an ad hoc basis.. Government resolution stipulate that if a taxpayer is delinquent for more than 12 months, he/she will be excluded from the taxpayer register, after the TC’s exclusion commission has given its finding on the nature and cause of delinquency.11 P4-14: Use of electronic filing facilities
This indicator measures the extent to which declarations, for all core taxes, are filed electronically. Assessed scores are shown in Table 15 followed by an explanation of reasons underlying the assessment. Table 15. P4-14 Assessment
Measurement dimension Scoring Method
Score 2019
P4-14. The extent to which tax declarations are filed electronically. M1 A
All tax declarations are filed electronically. There is a mandatory requirement for all tax declarations for the core taxes to be submitted electronically. Because of the low internet penetration in remote areas of Tajikistan, the TC has provided e-terminals in many tax offices with dedicated fiber optic lines12. Table 11 in Attachment III.
E. POA 5: Timely Payment of Taxes
Taxpayers are expected to pay taxes on time. Tax laws and administrative procedures specify payment requirements, including deadlines (due dates) for payment, who is required to pay, and payment methods. Depending on the system in place, payments due will be either self-assessed or administratively assessed. Failure by a taxpayer to pay on time results in imposition of interest and penalties and, for some taxpayers, legal debt recovery action. The aim of the tax administration should be to achieve high rates of voluntary on-time payment and low incidence of tax arrears. Four performance indicators are used to assess POA 5:
11 Initially a ‘D’ score was given for P4-13 on action taken to follow up on non-filers. However, the score has now been upgraded to ‘C’ in view of the post-assessment comments by the TC which highlighted two documented procedures shown as evidence by which tax authorities are obliged to identify and take appropriate measures regarding persons who do not submit declarations based on data available to the TC and received from third party, as well as from control work (field visits, time-recording of audit process, etc.).
12 Tax Code of Tajikistan, Art. 50-51

32
P5-15—Use of electronic payment methods.
P5-16—Use of efficient collection systems.
P5-17—Timeliness of payments
P5-18—Stock and flow of tax arrears.
P5-15: Use of electronic payment methods This indicator examines the degree to which core taxes are paid by electronic means without the direct intervention of bank staff or tax administration, including through electronic funds transfer (where money is electronically transferred via the Internet from a taxpayer’s bank account to the Government’s account), credit cards, and debit cards. Assessed scores are shown in Table 16 followed by an explanation of reasons underlying the assessment. Table 16. P5-15 Assessment
Measurement dimension Scoring Method
Score 201_
P5-15. The extent to which core taxes are paid electronically. M1 A
All core taxes are required to be paid electronically. Data submitted by the TC using ITMIS database indicates that all the core taxes were paid 100 percent using electronic payment methods. Statistics for three calendar year in 2016, 2017 and 2018 were furnished. See Table 11, Attachment III. P5-16: Use of efficient collection systems
This indicator assesses the extent to which acknowledged efficient collection systems—especially withholding at source and advance payment systems—are used. Assessed scores are shown in Table 17 followed by an explanation of reasons underlying the assessment. Table 17. P5-16 Assessment
Measurement dimension Scoring Method
Score 2019
P5-16. The extent to which withholding at source and advance payment systems are used. M1 A
Tax withholding at source and advance payments are routinely used. Chapter 11 of the Tax Code lays down the provisions for payment, collection and refund of taxes including deadlines for payment, and penalties and interest in case of late payment. Withholding at source for employment income, interest income and dividend income are in place. The withholding on interest and dividend incomes are final and no declaration is required from the taxpayer receiving the income. Articles 157-158 lay down that advance tax is required to be paid for CIT by the 15th of the month

33
following the month in which the income was earned. This also applies to rental income received by individuals. Although advance tax is paid monthly, declaration for CIT is required to be filed annually. All information regarding payment schedules is available on the TC website. There is no need for mandatory reporting since the tax withholding is final. P5-17: Timeliness of payments This indicator assesses the extent to which payments are made on time (by number and by value). For TADAT measurement purposes, VAT payment performance is used as a proxy for on-time payment performance of core taxes generally. A high on-time payment percentage is indicative of sound compliance management including, for example, provision of convenient payment methods and effective follow-up of overdue amounts. Assessed scores are shown in Table 18 followed by an explanation of reasons underlying the assessment. Table 18. P5-17 Assessment
Measurement dimensions Scoring Method
Score 2019
P5-17-1. The number of VAT payments made by the statutory due date in percent of the total number of payments due.
M1 A
A P5-17-2. The value of VAT payments made by the statutory due date in percent of the total value of VAT payments due. A
VAT payments are largely made in a timely manner. Due dates for payment are indicated in the Tax Code. For PIT, withholding tax and PIT, these are provided in Article 158, while for VAT it is in Articles 181-189. Interest for late payment is charged at the rate of 0.05 percent per day. In terms of number of VAT payments, 90.4 percent of all taxpayers and 100 percent of large taxpayers made their payments by the statutory due date in 2018, according to the ITMIS database. Likewise, in terms of value of payments, 90.5 percent of payments by all VAT payers and 100 percent of payment by large taxpayers are made on time. See Table 12 in Attachment III.
P5-18: Stock and flow of tax arrears This indicator examines the extent of accumulated tax arrears. Two measurement dimensions are used to gauge the size of the administration’s tax arrears inventory: (1) the ratio of end-year tax arrears to the denominator of annual tax collections; and (2) the more refined ratio of end-year ‘collectible tax arrears’ to annual collections.13 A third measurement dimension looks at the extent of unpaid tax liabilities that are more than a year overdue (a high percentage may indicate poor 13 For purposes of this ratio, ’collectible’ tax arrears is defined as total domestic tax arrears excluding: (a) amounts formally disputed by the taxpayer and for which collection action has been suspended pending the outcome, (b) amounts that are not legally recoverable (e.g., debt foregone through bankruptcy), and (c) arrears otherwise uncollectible (e.g., the debtor has no funds or other assets).

34
debt collection practices and performance given that the rate of recovery of tax arrears tends to decline as arrears get older). Assessed scores are shown in Table 19 followed by an explanation of reasons underlying the assessment. Table 19. P5-18 Assessment
Measurement dimensions Scoring Method
Score 2019
P5-18-1. The value of total core tax arrears at fiscal year-end as a percentage of total core tax revenue collections for the fiscal year.
M2
A
A P5-18-2. The value of collectible core tax arrears at fiscal year-end as a percentage of total core tax revenue collections for the fiscal year.
A
P5-18-3. The value of core tax arrears more than 12 months old as a percentage of the value of all core tax arrears.
B
The level of tax arrears of the TC is relatively low. There is a dedicated department - Tax Arrears and Collection Enforcement Department - to deal with tax collection, debts and arrears. Chapter 12 of the Tax Code lays down the measures for ensuring enforced collection of arrears. Through public seminars, business meetings and TV channels, instructions are issued to taxpayers from time to time and taxpayers are made aware of payment requirements and due dates of payments. The three-year average of core tax arrears as a percentage of total core tax revenues collected is 8.2 percent. The three-year average of collectible core tax arrears as a percentage of total core tax revenues collected is 3.1 percent. The three-year average of old core tax arrears as a percentage of total core tax arrears is 31.8 percent. See Table 13 in Attachment III.
F. POA 6: Accurate Reporting in Declarations
Tax systems rely heavily on complete and accurate reporting of information by taxpayers in tax declarations. Tax administrations therefore need to regularly monitor tax revenue losses from inaccurate reporting, especially by business taxpayers, and take a range of actions to ensure compliance. These actions fall into two broad groups: verification activities (e.g., tax audits, investigations, and income matching against third party information sources) and proactive initiatives (e.g., taxpayer assistance and education as covered in POA 3, and cooperative compliance approaches). If well designed and managed, tax audit programs can have far wider impact than simply raising additional revenue from discrepancies detected by tax audits. Detecting and penalizing serious offenders serve to remind all taxpayers of the consequences of inaccurate reporting. Also prominent in modern tax administration is high-volume automated crosschecking of amounts reported in tax declarations with third-party information. Because of the high cost and relative low coverage rates associated with traditional audit methods, tax administrations are increasingly using

35
technology to screen large numbers of taxpayer records to detect discrepancies and encourage correct reporting. Proactive initiatives also play an important role in addressing risks of inaccurate reporting. These include adoption of cooperative compliance approaches to build collaborative and trust-based relationships with taxpayers (especially large taxpayers) and intermediaries to resolve tax issues and bring certainty to companies’ tax positions in advance of a tax declaration being filed, or before a transaction is actually entered into. A system of binding tax rulings can play an important role here. Finally, on the issue of monitoring the extent of inaccurate reporting across the taxpayer population generally, a variety of approaches are being used, including: use of tax compliance gap estimating models, both for direct and indirect taxes; advanced analytics using large data sets (e.g., predictive models, clustering techniques, and scoring models) to determine the likelihood of taxpayers making full and accurate disclosures of income; and surveys to monitor taxpayer attitudes towards accurate reporting of income. Against this background, four performance indicators are used to assess POA 6: P6-19—Scope of verification actions taken to detect and deter inaccurate reporting.
P6-20—Use of large-scale data-matching systems to detect inaccurate reporting.
P6-21—Initiatives undertaken to encourage accurate reporting.
P6-22—Monitoring the tax gap to assess inaccuracy of reporting levels.
P6-19: Scope of verification actions taken to detect and deter inaccurate reporting For this indicator, four measurement dimensions provide an indication of the nature and scope of the tax administration’s verification program. Assessed scores are shown in Table 20 followed by an explanation of reasons underlying the assessment.
Table 20. P6-19 Assessment
Measurement dimensions Scoring Method
Score 2019
P6-19-1. The nature and scope of the tax audit program in place to detect and deter inaccurate reporting.
M1
B
D
P6-19-2. The extent to which the audit program is systematized around uniform practices. C
P6-19-3. The degree to which the quality of taxpayer audits is monitored. D
P6-19-4. The degree to which the tax administration monitors the effectiveness of the taxpayer audit function. D

36
The audit program is comprehensive and centralized; however, audit impact evaluations are ad hoc. The audit program of the TC is developed on twice per year basis. The audit program covers all type of inspections (documental audit, cameral control, raid control) and targeted at all core taxes, key taxpayer segments and economic sectors. The audit program is developed centrally by using a range of predefined automated risk assessment criteria that are applied by the IT system. Article 23 of the Tax Code defines the procedures of an audit. The procedural steps of an audit are documented by the auditors within the ICT system across all tax offices. An audit manual is available to the auditors. Article 24 of the Tax Code defines the application of indirect audit methods and, in addition, the separate regulation on the application of indirect auditing techniques is available for the auditors. The Tax Audit Department (TAD) at the TC is in charge of audit policy-making across the tax administration and evaluates, ad hoc, the tax audit impact on compliance by the targeted segments.
The unified practice is assured by using the advanced IT software and auditing manuals, however there are no methodology to audit the key economic industries. The regular audit manual is available and defines main duties and responsibilities of an auditor to carry the regular audit. The auditors are supported with the ICT tool that systematically maintain the audit procedural steps in line to the provisions of the Tax Code and audit manual. The auditing manual, audit document templates, and the ICT Audit Management submodule guide an auditor to conduct the audit in line with main audit stages:(a) preparing an audit case plan; (b) creating a taxpayer profile; (c) advising the taxpayer as to the nature and scope of the audit;(d) examining records of taxpayers and determining any changes to the scope or periods covered by the audit; (e) advising taxpayers of the audit findings and any resulting additional tax and penalties; (f) informing taxpayers about dispute resolution rights and procedures; (g) managing audit files; (h) using templates for working papers, notices to taxpayers, and other required documentation; (i) adhering to procedures and criteria that need to be applied in the settlement of audit cases.
The department of Tax Audit at the TC regularly issue the review documents with the good and bad practice in auditing particular business industries, however the comprehensive auditing manuals for key business industries is not in place yet.
The audit quality is monitored on a regular basis, but the predefined quality auditing checklists are not used. The TAD and the Internal Audit Department of the TC regularly inspect and evaluate the quality of the audit function. There are internal regulation of the TC and the evaluation criteria for selecting cases to quality checks. The audit quality check itself is carried out without using the predefined quality checklist, however all quality checks and internal audits are documented. The TAD issues regular reports on the quality audit findings, overview the good and bad practice to the audit function units across the whole ta administration to improve the quality of audit program.
The audit outputs and key performance indicators are monitored regularly. However, the surveys of audited taxpayers are not conducted. The TAD reports to the Collegium on the quarterly basis—the report consolidates all the audit function’s results and provides an overview

37
of against the key audit performance indicators. However, audit duration indicators are not monitored. The consolidated report also includes quantitative analysis, overview of identified tax violations, new compliance risks and proposals to improve tax legislation. There are as yet no formal procedures or initiatives to survey the audited taxpayers on the competence and professionalism of the TC audit staff.14
P6-20: Use of large-scale data-matching systems to detect inaccurate reporting. For this indicator, one measurement dimension provides an indication of the extent to which the tax administration leverages technology to screen large numbers of taxpayer records against third-party information to detect discrepancies and encourage correct reporting. Assessed scores are shown in Table 21 followed by an explanation of reasons underlying the assessment. Table 21. P6-20 Assessment
Measurement dimension Scoring Method
Score 2019
P6-20. The extent of large-scale automated crosschecking to verify information reported in tax declarations. M1 B
A wide range of automated crosschecking is conducted regularly to improve the accuracy of tax reporting. The TC has launched the new tax administration information system which has built in a wide range of automated large-scale data crosschecking procedures. The procedures are centralized, applied regularly and allow crosschecking the data across all taxpayers and related segments. The large-scale crosschecking focuses on, but is not limited to the following internal and external data: (i) VAT declarations against invoicing and corporate income tax data; (ii) banks/financial institutions data against the turnover in tax returns; (iii) employers data of social contributions against withholding income tax reporting; (iv) customs transactions against VAT returns data; (v) immovable property register against real estate tax reporting and payment; (vi) the Public Procurement Agency data against the turnover reported in tax returns; and (vii) Social Security Agency data against withholding income tax reporting. Online (internet-based) vendors payment data against the reported turnover in tax returns is obtained from the National Bank of
14 In its post-assessment comments, the TC highlighted that internal audit of local tax offices is carried out based on approved plans of complex and centralized audit. The results of the audit, as well as key performance indicators of tax audits are regularly monitored by the TC management. The PAR paragraphs for P6-19-3 and P6-19-4 does not dispute these facts, and these are already acknowledged therein. However, ‘D’ scores were given both for P6-19-3 and P6-19-4 for the following reasons:
• even for a ‘C’ score, P6-19-3 requires quality reviews to be conducted according to a pre-defined checklist; there was no checklist available;
• even for a ‘C’ score, P6-19-4 requires indicators for monitoring the duration of audit; these were not monitored by the TC.

38
Tajikistan on a regular basis. However, data from stock exchanges and shareholder registries of listed companies is not crosschecked. P6-21: Initiatives undertaken to encourage accurate reporting This indicator assesses the nature and scope of cooperative compliance and other proactive initiatives undertaken to encourage accurate reporting. Assessed scores are shown in Table 22 followed by an explanation of reasons underlying the assessment.
Table 22. P6-21 Assessment
Measurement dimension Scoring Method
Score 2019
P6-21. The nature and scope of proactive initiatives undertaken to encourage accurate reporting. M1 D
The public and private ruling instruments and cooperative compliance approaches are not applied yet. Article 46 of the Tax Code defines the right of a taxpayer to receive the private ruling. However, the Tax Code does not state clearly if the private ruling is binding for the taxpayer and the tax authority. The Tax Code does not define the instrument of public ruling for the taxpayers. Currently, the TC does not have either the methodology for cooperative compliance. The Tax Code and other regulatory documents of the TC do not define the cooperative compliance approach. However, the draft Tax Code is under development where the provisions for application the horizontal monitoring are planned to be inserted.15 P6-22: Monitoring the tax gap to assess inaccuracy of reporting levels This indicator examines the soundness of methods used by the tax administration to monitor the extent of inaccurate reporting in declarations. The assessed score is shown in Table 23 followed by an explanation of reasons underlying the assessment.
15 In its post-assessment comments, the TC stated that according to article 18 of the Tax Code, a taxpayer has the right to receive information from tax authorities about current taxes and changes in the tax legislation, as well as explanations of procedures and receiving the results of tax control and challenging them. The assessment team examined article 18 and noted that this provision contains general rights and responsibilities of taxpayers and are not specific to binding public or private rulings. Article 46 of the Tax Code, discussed in the preceding paragraph, is more relevant to the rights of taxpayers to seek interpretations concerning fulfillment of tax obligation. However, this article does specify whether the interpretations are binding or not for both parties – taxpayer and tax administration. Moreover, no documentary examples of binding public or private rulings were presented as evidence during the assessment.

39
Table 23. P6-22 Assessment
Measurement dimensions Scoring Method
Score 201_
P6-22. The soundness of tax gap analysis method/s used by the tax administration to monitor the extent of inaccurate reporting. M1
D
Methodologies to comprehensively estimate revenue losses from inaccurate reporting are not developed. However, limited initiatives of estimating tax gap are taken. The TC does not monitor the extent of inaccurate reporting using well established methodologies and VAT gap estimates have not yet been conducted. However, there are evidences of ad hoc and limited-in-scope analysis of revenue loss due to non-reporting/ incorrect reporting/ underreporting.
G. POA 7: Effective Tax Dispute Resolution
This POA deals with the process by which a taxpayer seeks an independent review, on grounds of facts or interpretation of the law, of a tax assessment resulting from an audit. Above all, a tax dispute process must safeguard a taxpayer’s right to challenge a tax assessment and get a fair hearing. The process should be based on a legal framework, be known and understood by taxpayers, be easily accessible, guarantee transparent independent decision-making, and resolve disputed matters in a timely manner. Three performance indicators are used to assess POA 7: P7-23—Existence of an independent, workable, and graduated dispute resolution process.
P7-24—Time taken to resolve disputes.
P7-25—Degree to which dispute outcomes are acted upon.
P7-23: Existence of an independent, workable, and graduated resolution process For this indicator three measurement dimensions assess: (1) the extent to which a dispute may be escalated to an independent external tribunal or court where a taxpayer is dissatisfied with the result of the tax administration’s review process; (2) the extent to which the tax administration’s review process is truly independent; and (3) the extent to which taxpayers are informed of their rights and avenues of review. Assessed scores are shown in Table 24 followed by an explanation of reasons underlying the assessment. Table 24. P7-23 Assessment
Measurement dimensions Scoring Method
Score 201_
P7-23-1. The extent to which an appropriately graduated mechanism of administrative and judicial review is available to, and used by, taxpayers.
M2 D B

40
P7-23-2. Whether the administrative review mechanism is independent of the audit process. A
P7-23-3. Whether information on the dispute process is published, and whether taxpayers are explicitly made aware of it.
A
The first level administrative review process within the TC is multi-layered and the second level Appeal Board is not an external body. Chapter 14, article 81 of the Tax Code deals with the rules and procedures for dispute resolution. Any taxpayer, who is dissatisfied with the tax audit has three parallel options: either appeal to TC Chairman electronically, or to appeal directly to the Appeal Board, or to the Economic Court. If the taxpayer takes the route of filing appeal before TC, then, on receipt of appeal application the TC Chairman assigns it to Legal department which specializes in examining taxpayers’ disputes. The head of the Legal Department assigns the case to one of the appeal officers. The appeal officers submit their recommendations to the TC Chairman who is the final authority. If the taxpayer is not satisfied with the decision of the TC, then the taxpayer can appeal before the Appeal Board. The Appeal Board is not an entirely external appellate body. It consists of 11 part-time members with other regular assignments within the TC, who are appointed by the TC Chairman. TC Order No. 77 dated 11 March 2015 deals with the process of setting up of the Appeal Board. If taxpayer is not satisfied with the order of the Appeal Board, the taxpayer can go to the Economic Court which is independent of the TC.
The administrative appeal process is very seldom used by taxpayers. According to Table 12 in Attachment III, only 18 administrative appeals were filed in the most recent 12 months. This is in sharp contrast to 1,852 audits conducted during that period of which there were adjustments in more than 90 percent of the cases. This is despite the fact that the appeal has to be decided within 30 days of filing online. The administrative review mechanism is physically and organizationally independent of the audit department. The appeal unit within the Legal Department reports directly to Head of the Legal Department which is directly under the Chairman TC. The administrative review processes are documented in TC Order No. 295 dated 26.06.2019 Information on taxpayer dispute rights and the dispute resolution process is publicly available and taxpayers are explicitly made aware of them. Chapter 14 of the Tax Code laying down with the rules and procedures for dispute resolution is available on the TC’s website. Information on appeal rights and associated dispute resolution procedures are specifically included in audit finalization letters, notices of assessment and notification of administrative review outcomes. The audit manual mentions the responsibility of tax auditors to inform taxpayers facing audit about the right to challenge the audit.

41
P7-24: Time taken to resolve disputes This indicator assesses how responsive the tax administration is in completing administrative reviews. Assessed scores are shown in Table 25 followed by an explanation of reasons underlying the assessment.
Table 25. P7-24 Assessment
Measurement dimensions Scoring Method
Score 2019
P7-24. The time taken to complete administrative reviews. M1 A
The TC disposes of administrative review of appeals filed by taxpayers in a timely manner. Chapter 14, article 81 of the Tax Code prescribes the time limit and the procedure for dispute resolution. It requires the appeal officers to complete the appeal process within 30 days. In reality, the administrative review during the most recent 12 months was completed in 100 percent of the cases within 30 days of filing of appeal by the taxpayer. However, the number of appeals filed is very small compared to the number of audits conducted (18 requests for administrative review out of more than 1000 audits)—see Table 14 in Attachment III.
P7-25: Degree to which dispute outcomes are acted upon This indicator looks at the extent to which dispute outcomes are taken into account in determining policy, legislation, and administrative procedure. The assessed score is shown in Table 26 followed by an explanation of reasons underlying the assessment.
Table 26. P7-25 Assessment
Measurement dimension Scoring Method
Score 201_
P7-25. The extent to which the tax administration responds to dispute outcomes. M1 A
The TC responds regularly to dispute outcomes. The information submitted by the Legal Department of the TC indicates that there is regular monitoring and analysis of all dispute outcomes. The head of the Legal Department prepares “decision impact statements” routinely and submits them to the Chairman TC. For instance, by Letter No. 1911 dated 13th June 2019, the Head of the Legal Department proposed amendments to the Law on State Judicial Examination so that a tax expert panel for disputes is established for matters that are in the Economic Court.
H. POA 8: Efficient Revenue Management
This POA focuses on three key activities performed by tax administrations in relation to revenue management:

42
Providing input to government budgeting processes of tax revenue forecasting and tax revenue estimating. (As a general rule, primary responsibility for advising government on tax revenue forecasts and estimates rests with the Ministry of Finance. The tax administration provides data and analytical input to the forecasting and estimating processes. Ministries of Finance often set operational revenue collection targets for the tax administration based on forecasts of revenue for different taxes.)16
Maintaining a system of revenue accounts.
Paying tax refunds.
Three performance indicators are used to assess POA 8: P8-26—Contribution to government tax revenue forecasting process.
P8-27—Adequacy of the tax revenue accounting system.
P8-28—Adequacy of tax refund processing.
P8-26: Contribution to government tax revenue forecasting process This indicator assesses the extent of tax administration input to government tax revenue forecasting and estimating. The assessed score is shown in Table 27 followed by an explanation of reasons underlying the assessment.
Table 27. P8-26 Assessment
Measurement dimensions Scoring Method
Score 2019
P8-26. The extent of tax administration input to government tax revenue forecasting and estimating. M1 A
The TC participates actively in the government’s budget exercise in providing inputs for revenue forecasting. The TC’s Department of Revenue Accounting and Payments and Processing of Tax Declaration (DRAPPTD) gathers data on tax revenue collection and economic conditions and provide input to the Ministry of Finance (MoF) budget process of tax revenue forecasting based on the Budget Forecasting Methodology of the MoF. The Department also monitors tax revenue collection against budgeted revenue forecasts and report findings to MoF on a daily, weekly and monthly basis for all core taxes with reasons for significant variations. Government instructions and circulars guide this process. VAT refund levels are forecast and provided to MoF for budgeting. The TC prepares an annual report on the cost to revenue of tax expenditures. In accordance with Tax Code Article 124, the stock of tax losses and credit/refunds carried forward
16 It is common for Ministries of Finance to review budget revenue forecasts and related tax collection targets during the fiscal year (particularly mid-year) to take account of changes in forecasting assumptions, especially changes in the macroeconomic environment.

43
by taxpayers that may be offset against future tax liabilities is monitored in ITMIS and estimates are provided to MoF annually. P8-27: Adequacy of the tax revenue accounting system This indicator examines the adequacy of the tax revenue accounting system. Assessed scores are shown in Table 28 followed by an explanation of reasons underlying the assessment.
Table 28. P8-27 Assessment
Measurement dimension Scoring Method
Score 2019
P8-27. Adequacy of the tax administration’s revenue accounting system. M1 A
TC’s automated ITMIS meets government IT and accounting standards, and interfaces with the MoF’s Tajik Financial Management Information System (TFMIS). The Revenue Accounting submodule of ITMIS allows all tax liabilities and related payments to be posted to taxpayers’ ledger accounts within one business day of their occurrence. Regular external audit by the Chamber of Accounts once a year and internal audit by the TC’s Internal Audit Department once in two years are conducted to ensure that the accounting system aligns with the Central Treasury revenue accounting system and correctly calculates liabilities, penalties and interests. Also, the TC signed a 5-year contract for 2016–2021 with the Agency on State Secrets on IT systems audit to make sure that the ITMIS responds to the established government information security standards. A new 5 -year contract on IT audit of ITMIS was signed for 2020 -2025. Tax Code Art. 19 and 69 lays down the procedure for reconciliation of all amounts paid under different taxes, through which offset can be made. Since the development of ITMIS, suspense accounts were eliminated since the system does not accept a wrong payment where either TIN is missing, or a wrong TIN has been keyed in by a particular taxpayer. All taxpayers have secure online access to their taxpayer account in ITMIS. P8-28: Adequacy of tax refund processing
For this indicator, two measurement dimensions assess the tax administration’s system of processing VAT refund claims. Assessed scores are shown in Table 29 followed by an explanation of reasons underlying the assessment.
Table 29. P8-28 Assessment
Measurement dimensions Scoring Method
Score 2019_
P8-28-1. Adequacy of the VAT refund system. M2
D C+
P8-28-2. The time taken to pay (or offset) VAT refunds. A

44
There is no risk-based verification of VAT refunds and fast track procedures. Taxpayers have to submit an application in a specified form for claiming refund. Tax Code Article 29 requires mandatory thematic audits for all refund claims. Tax Code Art 191-193 and MoF tax policy regulations on VAT refunds allows only diplomatic corps and exporters whose export turnover is not less than 70 percent of their gross income to claim VAT refunds. Other exporters and non-exporters are allowed to carry forward their input credit to set off against tax liabilities but not paid refund. Payment of interest at 0.05 percent per day is provided by Tax Code Article 69 on delayed refunds. All refund claims of qualified exporters are paid promptly. There are only seven exporters with exports exceeding 70 percent of gross turnover. All refund claims by these exporters are processed within 30 days. Monthly and annual reconciliation accounts of these exporters are maintained. See Table 15 in Attachment III.
I. POA 9: Accountability and Transparency
Accountability and transparency are central pillars of good governance. Their institutionalization reflects the principle that tax administrations should be answerable for the way they use public resources and exercise authority. To enhance community confidence and trust, tax administrations should be openly accountable for their actions within a framework of responsibility to the minister, government, legislature, and the general public. Four performance indicators are used to assess POA 9: P9-29—Internal assurance mechanisms.
P9-30—External oversight of the tax administration.
P9-31—Public perception of integrity.
P9-32—Publication of activities, results, and plans.
P9-29: Internal assurance mechanisms For this indicator, two measurement dimensions assess the internal assurance mechanisms in place to protect the tax administration from loss, error, and fraud. Assessed scores are shown in Table 30 followed by an explanation of reasons underlying the assessment. Table 30. P9-29 Assessment
Measurement dimensions Scoring Method
Score 2019
P9-29-1. Assurance provided by internal audit. M2
B C+
P9-29-2. Staff integrity assurance mechanisms. C

45
The internal assurance mechanism ensures that all internal controls and TC procedures are complied with by tax officials. The TC has an Internal Audit Department (IAD) that reports directly to the Chairman and not to an audit committee. The IAD is staffed with a director and 10 internal auditors. Two semi-annual plans are prepared under the order of the Chairman of the TC laying down the headquarter functions and local offices that will be audited during that period. The IAD conducts a wide range of operational and financial audits to ensure that tax officials are compliant with the Tax Code and all TC manuals, procedures, directions and orders. IAD provides effective surveillance of IT system controls to ensure confidentiality of the database and audit trail of user access with system-generated reporting of any unauthorized use. There is regular training of internal auditors in audit methodologies and to keep them updated with circulars, notifications and orders pf the TC. In addition, each internal auditor is provided a laptop which contains a repository/database of all internal control policies, processes and procedures as laid out in TC orders and notifications. External review of the IAD is conducted by the Chamber of Accounts every two years.
The TC has a weak staff integrity assurance mechanism which does not meet good international practice standards. There is an internal affairs unit within the Legal Department to provide assurance of staff integrity and it reports to the head of the department. There is no separate Internal Affairs Department directly under the Chairman. The unit has adequate powers to investigate cases of misdemeanor and exercises these powers. It collaborates with the external anti-corruption agency on matters of ethics and integrity policies. Integrity statistics are maintained and communicated to the senior management, but not published. There are two Codes of Ethics that are implemented by the TC, one that responds to the standards set at the national public service level and the other specifically for ensuring ethical behavior within the TC. Staff are regularly trained on the Code of Ethics and other ethics policies that are updated from time-to-time.
P9-30: External oversight of the tax administration Two measurement dimensions of this indicator assess: (1) the extent of independent external oversight of the tax administration’s operations and financial performance; and (2) the investigation process for suspected wrongdoing and maladministration. Assessed scores are shown in Table 31 followed by an explanation of reasons underlying the assessment. Table 31. P9-30 Assessment
Measurement dimensions Scoring Method
Score 2019
P9-30-1. The extent of independent external oversight of the tax administration’s operations and financial performance.
M2 B
B P9-30-2. The investigation process for suspected wrongdoing and maladministration. B

46
External oversight of TC’s operational and financial performance is provided by the Chamber of Accounts and the Agency for Financial Control. The Chamber of Accounts focusses on external audit of the TC’s main functions and operations while the Agency for Financial Control ensures that all financial rules and controls are followed. Both the agencies publish their annual plans on their respective websites.17 The findings of both these agencies are responded to by the TC. However, these are confidential and not publicly reported. The reports were viewed by the assessment team confidentially. The investigation process for suspected wrongdoing and corruption is fairly sound. The Ombudsman, as an institution, is set up as an independent body and it routinely investigates complaints from taxpayers on treatment received from governmental agencies, including the tax administration. On an ad-hoc basis, matters identified by the Ombudsman and recommended actions to fix them, are reported to the TC and government. Under the provisions of article 7 of the Law on Anticorruption Assessment of Legal Acts (No. 925 dated of December 28, 2012), the TC has to send all drafts of the legal acts to the Anticorruption agency for review. The legal act on internal investigations set the provisions and criteria under which the TC has to report on cases to Anti-corruption agency. There is regular and systematic monitoring and reporting to senior management of actions taken in response to recommendations of the tax ombudsman and anti-corruption agency via the action plan of the measures set by the Chairman of the TC. P9-31: Public perception of integrity
This indicator examines measures taken to gauge public confidence in the tax administration. The assessed score is shown in Table 32 followed by an explanation of reasons underlying the assessment.
Table 32. P9-31 Assessment
Measurement dimension Scoring Method
Score 2019
P9-31. The mechanism for monitoring public confidence in the tax administration. M1 C
Taxpayer perception surveys are conducted regularly but the results are not made public. Under the World Bank TARP project, taxpayer perception surveys to monitor public confidence in the TC have been conducted in 2015, 2016, 2017 and 2019 by an independent expert survey firm (Crowe Howarth) based on a statistically valid sample. However, the results of the survey are not made public. The survey reports were shown to the assessment team and are also available with the World Bank Tajikistan country office. An action plan to follow up on the findings of the perception surveys is prepared under the leadership of the First Deputy Chairman.
17 www.sai.tj
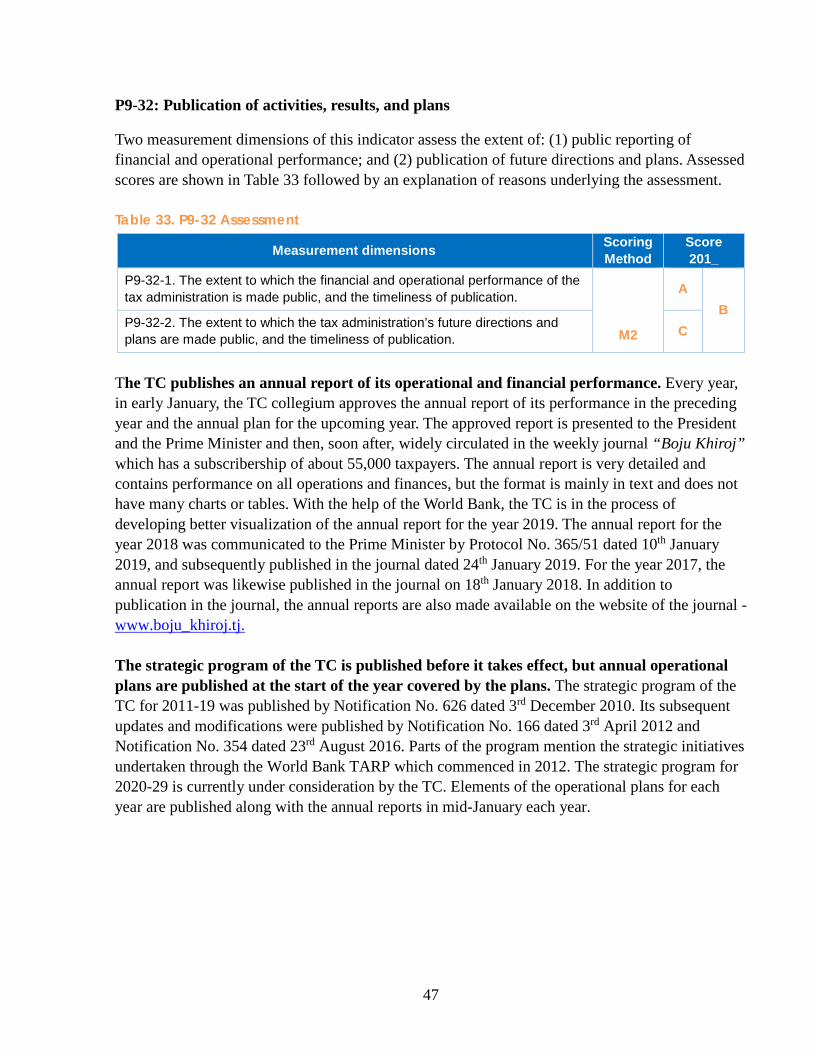
47
P9-32: Publication of activities, results, and plans
Two measurement dimensions of this indicator assess the extent of: (1) public reporting of financial and operational performance; and (2) publication of future directions and plans. Assessed scores are shown in Table 33 followed by an explanation of reasons underlying the assessment. Table 33. P9-32 Assessment
Measurement dimensions Scoring Method
Score 201_
P9-32-1. The extent to which the financial and operational performance of the tax administration is made public, and the timeliness of publication.
M2
A B
P9-32-2. The extent to which the tax administration’s future directions and plans are made public, and the timeliness of publication. C
The TC publishes an annual report of its operational and financial performance. Every year, in early January, the TC collegium approves the annual report of its performance in the preceding year and the annual plan for the upcoming year. The approved report is presented to the President and the Prime Minister and then, soon after, widely circulated in the weekly journal “Boju Khiroj” which has a subscribership of about 55,000 taxpayers. The annual report is very detailed and contains performance on all operations and finances, but the format is mainly in text and does not have many charts or tables. With the help of the World Bank, the TC is in the process of developing better visualization of the annual report for the year 2019. The annual report for the year 2018 was communicated to the Prime Minister by Protocol No. 365/51 dated 10th January 2019, and subsequently published in the journal dated 24th January 2019. For the year 2017, the annual report was likewise published in the journal on 18th January 2018. In addition to publication in the journal, the annual reports are also made available on the website of the journal - www.boju_khiroj.tj. The strategic program of the TC is published before it takes effect, but annual operational plans are published at the start of the year covered by the plans. The strategic program of the TC for 2011-19 was published by Notification No. 626 dated 3rd December 2010. Its subsequent updates and modifications were published by Notification No. 166 dated 3rd April 2012 and Notification No. 354 dated 23rd August 2016. Parts of the program mention the strategic initiatives undertaken through the World Bank TARP which commenced in 2012. The strategic program for 2020-29 is currently under consideration by the TC. Elements of the operational plans for each year are published along with the annual reports in mid-January each year.

48
Attachment I. TADAT Framework Performance outcome areas TADAT assesses the performance of a country’s tax administration system by reference to nine outcome areas:
1. Integrity of the registered taxpayer base: Registration of taxpayers and maintenance of a complete and accurate taxpayer database is fundamental to effective tax administration.
2. Effective risk management: Performance improves when risks to revenue and tax administration operations are identified and systematically managed.
3. Supporting voluntary compliance: Usually, most taxpayers will meet their tax obligations if they are given the necessary information and support to enable them to comply voluntarily.
4. On-time filing of declarations: Timely filing is essential because the filing of a tax declaration is a principal means by which a taxpayer’s tax liability is established and becomes due and payable.
5. On-time payment of taxes: Non-payment and late payment of taxes can have a detrimental effect on government budgets and cash management. Collection of tax arrears is costly and time consuming.
6. Accurate reporting in declarations: Tax systems rely heavily on complete and accurate reporting of
information in tax declarations. Audit and other verification activities, and proactive initiatives of taxpayer assistance, promote accurate reporting and mitigate tax fraud.
7. Effective Tax Dispute Resolution: Independent, accessible, and efficient review mechanisms
safeguard a taxpayer’s right to challenge a tax assessment and get a fair hearing in a timely manner. 8. Efficient revenue management: Tax revenue collections must be fully accounted for, monitored
against budget expectations, and analyzed to inform government revenue forecasting. Legitimate tax refunds to individuals and businesses must be paid promptly.
9. Accountability and transparency: As public institutions, tax administrations are answerable for the
way they use public resources and exercise authority. Community confidence and trust are enhanced when there is open accountability for administrative actions within a framework of responsibility to the minister, legislature, and general community.

49
Indicators and associated measurement dimensions A set of 32 high-level indicators critical to tax administration performance are linked to the performance outcome areas. It is these indicators that are scored and reported on. A total of 55 measurement dimensions are taken into account in arriving at the indicator scores. Each indicator has between one and five measurement dimensions.
Repeated assessments will provide information on the extent to which a country’s tax administration is improving.
Scoring methodology
The assessment of indicators follows the same approach followed in the Public Expenditure and Financial Accountability (PEFA) diagnostic tool so as to aid comparability where both tools are used.
Each of TADAT’s 55 measurement dimensions is assessed separately. The overall score for an indicator is based on the assessment of the individual dimensions of the indicator. Combining the scores for dimensions into an overall score for an indicator is done using one of two methods: Method 1 (M1) or Method 2 (M2). For both M1 and M2, the four-point ‘ABCD’ scale is used to score each dimension and indicator.
Method M1 is used for all single dimensional indicators and for multi-dimensional indicators where poor performance on one dimension of the indicator is likely to undermine the impact of good performance on other dimensions of the same indicator (in other words, by the weakest link in the connected dimensions of the indicator).
Method M2 is based on averaging the scores for individual dimensions of an indicator. It is used for selected multi-dimensional indicators where a low score on one dimension of the indicator does not necessarily undermine the impact of higher scores on other dimensions for the same indicator.

50
Attachment II. Tajikistan: Country Snapshot
Geography Tajikistan, located in the Central Asia region, is almost all mountains (93%), dominated by the Alay Range in the north and the Pamir Mountains to the southeast. Tajikistan borders with Afghanistan, Uzbekistan, Kyrgyz Republic and China. Land area is 141,510 km square.
Population
9.2 million (2019)] census. (Source: State Statistics Agency, Republic of Tajikistan)
Adult literacy rate
99.8 percent of persons aged 15 and over can read and write. (Source: https://countrymeters.info/ru/Tajikistan)
Gross Domestic Product 2018 nominal GDP:US$7.5 billion (Source: WB)
Per capita GDP
US$ 822. (Source: WB)
Main industries Aluminum production, energy, food processing, textile
Communications
- Internet users per 100 people: 33 - Mobile ‘phone subscribers per 100 people: 49 (Source: Communication Agency, Republic of Tajikistan)
Main taxes CIT, VAT, personal income tax, social taxes
Tax-to-GDP 18.2 percent in 2018, excluding Customs tax collections (24.1 percent including customs) (Source: Tax Committee under the Government of Tajikistan)
Number of taxpayers CIT (4,519); payroll-the number of employers (4,912), PIT (15,179); VAT (4,561), and domestic excise tax (211)
Main collection agency Tax Committee under the Government of the Republic of Tajikistan
Number of staff in the main collection agency
1,840
Financial Year Calendar year.

51
Attachment III. Data Tables A. Tax Revenue Collections
Table 1. Tax Revenue Collections, 2016-181 [2016] [2017] [2018]
In million somoni National budgeted tax revenue forecast2 13,206 14,438 16,556 Total tax revenue collections 12,636 14,525 16,584 Corporate Income Tax (CIT) 1,033 1,505 1,667 Personal Income Tax (PIT) 1,348 1,565 1,767
- Value-Added Tax (VAT)—gross domestic collections 1,792 1,948 2,179 - Value-Added Tax (VAT)—collected on imports 2,959 3,411 3,761 - Value-Added Tax (VAT)—refunds paid 17.1 17.8 23.9
Excises on domestic transactions 152 168 159 Excises—collected on imports 187 222 267 Social contribution collections 1,378 1,566 1,727 Other domestic taxes3 3,786 4,141 5,058
In percent of total tax revenue collections Total tax revenue collections 100.0 100.0 100.0 Corporate Income Tax (CIT) 8.2 10.4 10.1 Personal Income Tax (PIT) 10.7 10.8 10.7 - Value-Added Tax (VAT)—gross domestic collections 14.2 13.4 13.1
- Value-Added Tax (VAT)—collected on imports 23.4 23.5 22.7 - Value-Added Tax (VAT)—refunds paid
0.1
0.1
0.1 Excises—collected on domestic transactions 1.2 1.2 1.0
Excises—collected on imports 1.5 1.5 1.6 Social contribution collections 10.9 10.8 10.4 Other domestic taxes 30.0 28.5 30.5
In percent of GDP Total tax revenue collections 23.2 23.8 24.1 Corporate Income Tax (CIT) 1.9 2.5 2.4 Personal Income Tax (PIT) 2.5 2.6 2.6 - Value-Added Tax (VAT)—gross domestic collections 3.3 3.2 3.2 - Value-Added Tax (VAT)—collected on imports 5.4 5.6 5.5
- Value-Added Tax (VAT)—refunds paid 0.0 0.0 0.0 Excises—collected on domestic transactions
0.3
0.3
0.2 Excises—collected on imports 0.3 0.4 0.4
Social contribution collections 2.5 2.6 2.5 Other domestic taxes 7.0 6.8 7.3 Nominal GDP in million TJ somoni 54,471.1 61,093.6 68,844.9 Explanatory notes: 1 This table gathers data for three fiscal years (e.g. 2016 -18) in respect of all domestic tax revenues collected by the tax administration at the national level, plus VAT and Excise tax collected on imports by the customs and/or other agency. 2 This forecast is normally set by the Ministry of Finance (or equivalent) with input from the tax administration and, for purposes of this table, should only cover the taxes listed in the table. The final budgeted forecast, as adjusted through any mid-year review process, should be used. 3 ’Other domestic taxes collected at the national level by the tax administration include, for example, property taxes, financial transaction taxes, and environment taxes.

52
B. Movements in the Taxpayer RegisterTable 2. Movements in the Taxpayer Register, 2016-18
(Ref: POA1) Registered taxpayers1
[A]
Taxpayers otherwise not
required to file2 [B]
Taxpayers Expected to File [C] = [(A) – (B)]3
Memorandum items4
[D]
New Registrations [D1]
Taxpayers deregistered during
year [D2] [2016]
Corporate income tax 4,168 4,168 382 13 Personal income tax 12,551 12,551 2,418 110 PAYE withholding (# of employers) 3,001 3,001 1,520 137 Value Added Tax 2,650 2,650 500 154 Domestic excise tax5 238 238 20 108 Other taxpayers 1,249,284 0 1,249,284 47,814 30,175
[2017] Corporate income tax 4,537 4,537 25 43 Personal income tax 14,859 14,859 355 35 PAYE withholding (# of employers) 4,384 4,384 1,383 115 Value Added Tax 4,033 4,033 1,383 115 Domestic excise tax5 150 150 61 Other taxpayers 1,266,923 1,266,923 48,487 30,971
[2018] Corporate income tax 4,519 0 4,519 52 21 Personal income tax 15,179 15,179 2,686 2,266 PAYE withholding (# of employers) 4,912 4,912 528 34 Value Added Tax 4,561 4,561 528 34 Domestic excise tax5 211 211 2 4 Other taxpayers 1,284,439 0 1,284,439 38,392 25,210 Explanatory Notes: 1 A registered taxpayer who is in the tax administration’s taxpayer database. 2 Taxpayers not required to file declarations’ means taxpayers who are registered but are currently not required to file by law or regulation and are explicitly flagged in the automated tax administration system. 3 Expected filing calculations to be used in Indicator P4-12. 4 Taxpayer register activity information. 5 For purposes of a TADAT assessment, the focus is on those registered domestic excise taxpayers who trade in goods/services that contribute 70 percent of the total domestic excise revenue by value.

53
C. Telephone Enquiries(Ref: POA 3)
Table 3. Telephone Enquiry Call Waiting Time (for the most recent 12-month period)
Month Total number of telephone enquiry calls received
Telephone enquiry calls answered within 6 minutes’ waiting time
Number In percent of total calls
January 2,844 2,844 100 February 4,426 4,426 100 March 3,038 3,038 100 April 3,646 3,646 100 May 3,235 3,235 100 June 2,409 2,409 100 July 3,171 3,171 100 August 2,121 2,121 100 September 1,920 1,920 100 October 2,325 2,325 100 November 2,377 2,377 100 December 1,924 1,924 100 12-month total 33,436 33,436 100
D. Filing of Tax Declarations(Ref: POA 4)
Table 4. On-time Filing of CIT Declarations for 2018 Number of declarations
filed on-time1 Number of declarations
expected to be filed2 On-time filing rate3
(In percent) All CIT taxpayers 4,134 4,519 91.5 Large taxpayers only 305 305 100.0
Explanatory notes:
1 ‘On-time’ filing means declarations (also known as ‘returns’) filed by the statutory due date for filing (plus any ‘days of grace’ applied by the tax administration as a matter of administrative policy).
2 ‘Expected declarations’ means the number of CIT declarations that the tax administration expected to receive from registered CIT taxpayers that were required by law to file declarations.
3 The ‘on-time filing rate’ is the number of declarations filed by the statutory due date as a percentage of the total number of declarations expected from registered taxpayers, i.e. expressed as a ratio:
𝑁𝑁𝑁𝑁𝑁𝑁𝑁𝑁𝑁𝑁𝑁𝑁 𝑜𝑜𝑜𝑜 𝐶𝐶𝐶𝐶𝐶𝐶 𝑑𝑑𝑁𝑁𝑑𝑑𝑑𝑑𝑑𝑑𝑁𝑁𝑑𝑑𝑑𝑑𝑑𝑑𝑜𝑜𝑑𝑑𝑑𝑑 𝑜𝑜𝑑𝑑𝑑𝑑𝑁𝑁𝑑𝑑 𝑁𝑁𝑏𝑏 𝑑𝑑ℎ𝑁𝑁 𝑑𝑑𝑁𝑁𝑁𝑁 𝑑𝑑𝑑𝑑𝑑𝑑𝑁𝑁 𝑁𝑁𝑁𝑁𝑁𝑁𝑁𝑁𝑁𝑁𝑁𝑁 𝑜𝑜𝑜𝑜𝑑𝑑𝑁𝑁𝑑𝑑𝑑𝑑𝑑𝑑𝑁𝑁𝑑𝑑𝑑𝑑𝑑𝑑𝑜𝑜𝑑𝑑𝑑𝑑 𝑁𝑁𝑒𝑒𝑒𝑒𝑁𝑁𝑑𝑑𝑑𝑑𝑁𝑁𝑑𝑑 𝑜𝑜𝑁𝑁𝑜𝑜𝑁𝑁 𝑑𝑑𝑑𝑑𝑑𝑑𝑑𝑑𝑎𝑎𝑁𝑁 𝐶𝐶𝐶𝐶𝐶𝐶 𝑑𝑑𝑑𝑑𝑒𝑒𝑒𝑒𝑑𝑑𝑏𝑏𝑁𝑁𝑁𝑁𝑑𝑑 𝑒𝑒 100

54
Table 5. On-time Filing of PIT Declarations for 2018 Number of declarations filed on-
time1 Number of declarations expected to be
filed2 On-time filing rate3
(In percent) 14,167 15,179 93.3
Explanatory notes:
1 ‘On-time’ filing means declarations (also known as ‘returns’) filed by the statutory due date for filing (plus any ‘days of grace’ applied by the tax administration as a matter of administrative policy).
2 ‘Expected declarations’ means the number of PIT declarations that the tax administration expected to receive from registered PIT taxpayers that were required by law to file declarations.
3 The ‘on-time filing rate’ is the number of declarations filed by the statutory due date as a percentage of the total number of declarations expected from registered taxpayers, i.e. expressed as a ratio:
𝑁𝑁𝑁𝑁𝑁𝑁𝑁𝑁𝑁𝑁𝑁𝑁 𝑜𝑜𝑜𝑜 𝑃𝑃𝐶𝐶𝐶𝐶 𝑑𝑑𝑁𝑁𝑑𝑑𝑑𝑑𝑑𝑑𝑁𝑁𝑑𝑑𝑑𝑑𝑑𝑑𝑜𝑜𝑑𝑑𝑑𝑑 𝑜𝑜𝑑𝑑𝑑𝑑𝑁𝑁𝑑𝑑 𝑁𝑁𝑏𝑏 𝑑𝑑ℎ𝑁𝑁 𝑑𝑑𝑁𝑁𝑁𝑁 𝑑𝑑𝑑𝑑𝑑𝑑𝑁𝑁 𝑁𝑁𝑁𝑁𝑁𝑁𝑁𝑁𝑁𝑁𝑁𝑁 𝑜𝑜𝑜𝑜 𝑃𝑃𝐶𝐶𝐶𝐶 𝑑𝑑𝑁𝑁𝑑𝑑𝑑𝑑𝑑𝑑𝑁𝑁𝑑𝑑𝑑𝑑𝑑𝑑𝑜𝑜𝑑𝑑𝑑𝑑 𝑁𝑁𝑒𝑒𝑒𝑒𝑁𝑁𝑑𝑑𝑑𝑑𝑁𝑁𝑑𝑑 𝑜𝑜𝑁𝑁𝑜𝑜𝑁𝑁 𝑑𝑑𝑑𝑑𝑑𝑑𝑑𝑑𝑎𝑎𝑁𝑁 𝑃𝑃𝐶𝐶𝐶𝐶 𝑑𝑑𝑑𝑑𝑒𝑒𝑒𝑒𝑑𝑑𝑏𝑏𝑁𝑁𝑁𝑁𝑑𝑑 𝑒𝑒 100
Table 6. On-time Filing of VAT Declarations—All VAT taxpayers 2018
Month Number of declarations filed on-time1
Number of declarations expected to be filed2
On-time filing rate3 (In percent)
January 3,761 4,079 92.2 February 3,870 4,152 93.2 March 4,181 4,189 99.8 April 4,182 4,232 98.8 May 4,193 4,287 97.8 June 4,169 4,310 96.7 July 4,179 4,348 96.1 August 4,192 4,397 95.3 September 4,174 4,426 94.3 October 4,282 4,461 96.0 November 4,287 4,496 95.4 December 4,357 4,561 95.5 12-month total 49,827 51,938 95.9
Explanatory notes:
1 ‘On-time’ filing means declarations filed by the statutory due date for filing (plus any ‘days of grace’ applied by the tax administration as a matter of administrative policy).
2 ‘Expected declarations’ means the number of VAT declarations that the tax administration expected to receive from registered VAT taxpayers that were required by law to file declarations.
3 The ‘on-time filing rate’ is the number of VAT declarations filed by the statutory due date as a percentage of the total number of declarations expected from registered VAT taxpayers, i.e. expressed as a ratio:
𝑁𝑁𝑁𝑁𝑁𝑁𝑁𝑁𝑁𝑁𝑁𝑁 𝑜𝑜𝑜𝑜 𝑉𝑉𝑉𝑉𝐶𝐶 𝑑𝑑𝑁𝑁𝑑𝑑𝑑𝑑𝑑𝑑𝑁𝑁𝑑𝑑𝑑𝑑𝑑𝑑𝑜𝑜𝑑𝑑𝑑𝑑 𝑜𝑜𝑑𝑑𝑑𝑑𝑁𝑁𝑑𝑑 𝑁𝑁𝑏𝑏 𝑑𝑑ℎ𝑁𝑁 𝑑𝑑𝑁𝑁𝑁𝑁 𝑑𝑑𝑑𝑑𝑑𝑑𝑁𝑁 𝑁𝑁𝑁𝑁𝑁𝑁𝑁𝑁𝑁𝑁𝑁𝑁 𝑜𝑜𝑜𝑜 𝑑𝑑𝑁𝑁𝑑𝑑𝑑𝑑𝑑𝑑𝑁𝑁𝑑𝑑𝑑𝑑𝑑𝑑𝑜𝑜𝑑𝑑𝑑𝑑 𝑁𝑁𝑒𝑒𝑒𝑒𝑁𝑁𝑑𝑑𝑑𝑑𝑁𝑁𝑑𝑑 𝑜𝑜𝑁𝑁𝑜𝑜𝑁𝑁 𝑑𝑑𝑑𝑑𝑑𝑑𝑑𝑑𝑎𝑎𝑁𝑁 𝑉𝑉𝑉𝑉𝐶𝐶 𝑑𝑑𝑑𝑑𝑒𝑒𝑒𝑒𝑑𝑑𝑏𝑏𝑁𝑁𝑁𝑁𝑑𝑑
𝑒𝑒 100

55
Table 7. On-time Filing of VAT Declarations—Large taxpayers only (2018)
Month Number of declarations filed on-time1
Number of declarations expected to be filed2
On-time filing rate3 (In percent)
January 284 284 100.0 February 284 284 100.0 March 286 286 100.0 April 286 286 100.0 May 289 289 100.0 June 290 290 100.0 July 292 292 100.0 August 293 293 100.0 September 295 295 100.0 October 295 295 100.0 November 295 295 100.0 December 295 295 100.0 12-month total 3,484 3,484 100.0
Explanatory notes:
1 ‘On-time’ filing means declarations filed by the statutory due date for filing (plus any ‘days of grace’ applied by the tax administration as a matter of administrative policy).
2 ‘Expected declarations’ means the number of VAT declarations that the tax administration expected to receive from large taxpayers that were required by law to file VAT declarations.
3 The ‘on-time filing rate’ is the number of VAT declarations filed by large taxpayers by the statutory due date as a percentage of the total number of VAT declarations expected from large taxpayers, i.e. expressed as a ratio:
𝑁𝑁𝑁𝑁𝑁𝑁𝑁𝑁𝑁𝑁𝑁𝑁 𝑜𝑜𝑜𝑜 𝑉𝑉𝑉𝑉𝐶𝐶 𝑑𝑑𝑁𝑁𝑑𝑑𝑑𝑑𝑑𝑑𝑁𝑁𝑑𝑑𝑑𝑑𝑑𝑑𝑜𝑜𝑑𝑑𝑑𝑑 𝑜𝑜𝑑𝑑𝑑𝑑𝑁𝑁𝑑𝑑 𝑁𝑁𝑏𝑏 𝑑𝑑ℎ𝑁𝑁 𝑑𝑑𝑁𝑁𝑁𝑁 𝑑𝑑𝑑𝑑𝑑𝑑𝑁𝑁 𝑁𝑁𝑏𝑏 𝑑𝑑𝑑𝑑𝑁𝑁𝑙𝑙𝑁𝑁 𝑑𝑑𝑑𝑑𝑒𝑒𝑒𝑒𝑑𝑑𝑏𝑏𝑁𝑁𝑁𝑁𝑑𝑑𝑁𝑁𝑁𝑁𝑁𝑁𝑁𝑁𝑁𝑁𝑁𝑁 𝑜𝑜𝑜𝑜 𝑉𝑉𝑉𝑉𝐶𝐶 𝑑𝑑𝑁𝑁𝑑𝑑𝑑𝑑𝑑𝑑𝑁𝑁𝑑𝑑𝑑𝑑𝑑𝑑𝑜𝑜𝑑𝑑𝑑𝑑 𝑁𝑁𝑒𝑒𝑒𝑒𝑁𝑁𝑑𝑑𝑑𝑑𝑁𝑁𝑑𝑑 𝑜𝑜𝑁𝑁𝑜𝑜𝑁𝑁 𝑑𝑑𝑑𝑑𝑑𝑑𝑑𝑑𝑎𝑎𝑁𝑁 𝑑𝑑𝑑𝑑𝑁𝑁𝑙𝑙𝑁𝑁 𝑑𝑑𝑑𝑑𝑒𝑒𝑒𝑒𝑑𝑑𝑏𝑏𝑁𝑁𝑁𝑁𝑑𝑑 𝑒𝑒 100

56
Table 8. On-time Filing of Domestic Excise Tax Declarations 2018
Month Number of declarations filed on-time1
Number of declarations expected to be filed2
On-time filing rate3 (In percent)
January 143 150 95.3 February 179 188 95.2 March 180 188 95.7 April 186 192 96.9 May 187 195 95.9 June 189 200 94.5 July 197 204 96.6 August 200 207 96.6 September 204 207 98.6 October 207 210 98.6 November 205 211 97.2 December 205 211 97.2
12-month total 2,282 2,363 96.6
Explanatory notes:
1 ‘On-time’ filing means declarations filed by the statutory due date for filing (plus any ‘days of grace’ applied by the tax administration as a matter of administrative policy) by registered domestic excise tax taxpayers who contribute up to 70 percent, by value, of the total domestic excise tax revenue.
2 ‘Expected declarations’ means the number of excise tax declarations that the tax administration expected to receive from registered domestic excise tax taxpayers (the focus is on those registered domestic excise taxpayers who trade in the categories of goods/services that contribute 70 percent of the total domestic excise revenue by value) that are required by law to file excise tax declarations.
3 The ‘on-time filing rate’ is the number of excise tax declarations filed by taxpayers by the statutory due date as a percentage of the total number of excise duties declarations expected from registered domestic excise tax taxpayers who trade in the categories of goods/services that contribute 70 percent of the total domestic excise revenue by value, i.e. expressed as a ratio:
𝑁𝑁𝑁𝑁𝑁𝑁𝑁𝑁𝑁𝑁𝑁𝑁 𝑜𝑜𝑜𝑜 𝑑𝑑𝑜𝑜𝑁𝑁𝑁𝑁𝑑𝑑𝑑𝑑𝑑𝑑𝑑𝑑 𝑁𝑁𝑒𝑒𝑑𝑑𝑑𝑑𝑑𝑑𝑁𝑁 𝑑𝑑𝑑𝑑𝑒𝑒 𝑑𝑑𝑁𝑁𝑑𝑑𝑑𝑑𝑑𝑑𝑁𝑁𝑑𝑑𝑑𝑑𝑑𝑑𝑜𝑜𝑑𝑑𝑑𝑑 𝑜𝑜𝑑𝑑𝑑𝑑𝑁𝑁𝑑𝑑 𝑁𝑁𝑏𝑏 𝑑𝑑ℎ𝑁𝑁 𝑑𝑑𝑁𝑁𝑁𝑁 𝑑𝑑𝑑𝑑𝑑𝑑𝑁𝑁 𝑁𝑁𝑜𝑜. 𝑜𝑜𝑜𝑜 𝑑𝑑𝑜𝑜𝑁𝑁𝑁𝑁𝑑𝑑𝑑𝑑𝑑𝑑𝑑𝑑 𝑁𝑁𝑒𝑒𝑑𝑑𝑑𝑑𝑑𝑑𝑁𝑁 𝑑𝑑𝑑𝑑𝑒𝑒 𝑑𝑑𝑁𝑁𝑑𝑑𝑑𝑑𝑑𝑑𝑁𝑁𝑑𝑑𝑑𝑑𝑑𝑑𝑜𝑜𝑑𝑑𝑑𝑑 𝑁𝑁𝑒𝑒𝑒𝑒𝑁𝑁𝑑𝑑𝑑𝑑𝑁𝑁𝑑𝑑 𝑜𝑜𝑁𝑁𝑜𝑜𝑁𝑁 𝑑𝑑𝑑𝑑𝑑𝑑𝑑𝑑𝑎𝑎𝑁𝑁 𝑑𝑑𝑜𝑜𝑁𝑁𝑁𝑁𝑑𝑑𝑑𝑑𝑑𝑑𝑑𝑑 𝑁𝑁𝑒𝑒𝑑𝑑𝑑𝑑𝑑𝑑𝑁𝑁 𝑑𝑑𝑑𝑑𝑒𝑒 𝑑𝑑𝑑𝑑𝑒𝑒𝑒𝑒𝑑𝑑𝑏𝑏𝑁𝑁𝑁𝑁𝑑𝑑 𝑒𝑒 100

57
Table 9. On-time Filing of Domestic Excise Tax Declarations—Large taxpayers only 2018
Month Number of declarations filed on-time1
Number of declarations expected to be filed2
On-time filing rate3 (In percent)
January 15 15 100.0 February 14 15 93.3 March 15 15 100.0 April 15 15 100.0 May 15 15 100.0 June 14 15 93.3 July 14 15 93.3 August 13 15 86.7 September 14 15 93.3 October 15 15 100.0 November 15 15 100.0 December 15 15 100.0 12-month total 174 180 96.7
Explanatory notes:
1 ‘On-time’ filing means declarations filed by the statutory due date for filing (plus any ‘days of grace’ applied by the tax administration as a matter of administrative policy) by large taxpayers registered for domestic excise tax.
2 ‘Expected declarations’ means the number of excise tax declarations that the tax administration expected to receive from ALL large taxpayers registered for domestic excise tax and are required by law to file excise tax declarations.
3 The ‘on-time filing rate’ is the number of excise tax declarations filed by large taxpayers by the statutory due date as a percentage of the total number of excise duties declarations expected from large taxpayers registered for domestic excise tax taxpayers, i.e. expressed as a ratio:
𝑁𝑁𝑁𝑁𝑁𝑁𝑁𝑁𝑁𝑁𝑁𝑁 𝑜𝑜𝑜𝑜𝑑𝑑𝑜𝑜𝑁𝑁𝑁𝑁𝑑𝑑𝑑𝑑𝑑𝑑𝑑𝑑 𝑁𝑁𝑒𝑒𝑑𝑑𝑑𝑑𝑑𝑑𝑁𝑁 𝑑𝑑𝑑𝑑𝑒𝑒 𝑑𝑑𝑁𝑁𝑑𝑑𝑑𝑑𝑑𝑑𝑁𝑁𝑑𝑑𝑑𝑑𝑑𝑑𝑜𝑜𝑑𝑑𝑑𝑑 𝑜𝑜𝑁𝑁𝑜𝑜𝑁𝑁 𝑑𝑑𝑑𝑑𝑁𝑁𝑙𝑙𝑁𝑁 𝑑𝑑𝑑𝑑𝑒𝑒𝑒𝑒𝑑𝑑𝑏𝑏𝑁𝑁𝑁𝑁𝑑𝑑 𝑜𝑜𝑑𝑑𝑑𝑑𝑁𝑁𝑑𝑑 𝑁𝑁𝑏𝑏 𝑑𝑑ℎ𝑁𝑁 𝑑𝑑𝑁𝑁𝑁𝑁 𝑑𝑑𝑑𝑑𝑑𝑑𝑁𝑁
𝑁𝑁𝑜𝑜. 𝑜𝑜𝑜𝑜 𝑑𝑑𝑜𝑜𝑁𝑁𝑁𝑁𝑑𝑑𝑑𝑑𝑑𝑑𝑑𝑑 𝑁𝑁𝑒𝑒𝑑𝑑𝑑𝑑𝑑𝑑𝑁𝑁 𝑑𝑑𝑑𝑑𝑒𝑒 𝑑𝑑𝑁𝑁𝑑𝑑𝑑𝑑𝑑𝑑𝑁𝑁𝑑𝑑𝑑𝑑𝑑𝑑𝑜𝑜𝑑𝑑𝑑𝑑 𝑁𝑁𝑒𝑒𝑒𝑒𝑁𝑁𝑑𝑑𝑑𝑑𝑁𝑁𝑑𝑑 𝑜𝑜𝑁𝑁𝑜𝑜𝑁𝑁 𝑑𝑑𝑑𝑑𝑑𝑑𝑑𝑑𝑎𝑎𝑁𝑁 𝑑𝑑𝑑𝑑𝑁𝑁𝑙𝑙𝑁𝑁 𝑑𝑑𝑑𝑑𝑒𝑒𝑒𝑒𝑑𝑑𝑏𝑏𝑁𝑁𝑁𝑁𝑑𝑑 𝑁𝑁𝑁𝑁𝑙𝑙𝑑𝑑𝑑𝑑𝑑𝑑𝑁𝑁𝑁𝑁𝑁𝑁𝑑𝑑 𝑜𝑜𝑜𝑜𝑁𝑁 𝑑𝑑𝑜𝑜𝑁𝑁𝑁𝑁𝑑𝑑𝑑𝑑𝑑𝑑𝑑𝑑 𝑁𝑁𝑒𝑒𝑑𝑑𝑑𝑑𝑑𝑑𝑁𝑁 𝑑𝑑𝑑𝑑𝑒𝑒
𝑒𝑒 100

58
Table 10. On-time Filing of PAYE Withholding Declarations (filed by employers) 2018
Month Number of declarations filed on-time1
Number of declarations expected to be filed2
On-time filing rate3 (In percent)
January 4,205 4,430 94.9 February 4,008 4,503 89.0 March 4,412 4,540 97.2 April 4,302 4,583 93.9 May 4,420 4,638 95.3 June 4,475 4,661 96.0 July 4,516 4,699 96.1 August 4,586 4,748 96.6 September 4,641 4,777 97.2 October 4,754 4,812 98.8 November 4,738 4,847 97.8 December 4,746 4,912 96.6 12-month total 53,803 56,150 95.8
Explanatory notes:
1 ‘On-time’ filing means declarations filed by the statutory due date for filing (plus any ‘days of grace’ applied by the tax administration as a matter of administrative policy).
2 ‘Expected declarations’ means the number of PAYE withholding declarations that the tax administration expected to receive from registered employers with PAYE withholding obligations that were required by law to file declarations. 3 The ‘on-time filing rate’ is the number of PAYE withholding declarations filed by employers by the statutory due date as a percentage of the total number of PAYE withholding declarations expected from registered employers, i.e. expressed as a ratio:
𝑁𝑁𝑁𝑁𝑁𝑁𝑁𝑁𝑁𝑁𝑁𝑁 𝑜𝑜𝑜𝑜 𝑃𝑃𝑉𝑉𝑃𝑃𝑃𝑃 𝑤𝑤𝑑𝑑𝑑𝑑ℎℎ𝑜𝑜𝑑𝑑𝑑𝑑𝑑𝑑𝑑𝑑𝑙𝑙 𝑑𝑑𝑁𝑁𝑑𝑑𝑑𝑑𝑑𝑑𝑁𝑁𝑑𝑑𝑑𝑑𝑑𝑑𝑜𝑜𝑑𝑑𝑑𝑑 𝑜𝑜𝑑𝑑𝑑𝑑𝑁𝑁𝑑𝑑 𝑁𝑁𝑏𝑏 𝑑𝑑ℎ𝑁𝑁 𝑑𝑑𝑁𝑁𝑁𝑁 𝑑𝑑𝑑𝑑𝑑𝑑𝑁𝑁 𝑁𝑁𝑁𝑁𝑁𝑁𝑁𝑁𝑁𝑁𝑁𝑁 𝑜𝑜𝑜𝑜 𝑃𝑃𝑉𝑉𝑃𝑃𝑃𝑃 𝑤𝑤𝑑𝑑𝑑𝑑ℎ𝑜𝑜𝑑𝑑𝑑𝑑𝑑𝑑𝑑𝑑𝑙𝑙 𝑑𝑑𝑁𝑁𝑑𝑑𝑑𝑑𝑑𝑑𝑁𝑁𝑑𝑑𝑑𝑑𝑑𝑑𝑜𝑜𝑑𝑑𝑑𝑑 𝑁𝑁𝑒𝑒𝑒𝑒𝑁𝑁𝑑𝑑𝑑𝑑𝑁𝑁𝑑𝑑 𝑜𝑜𝑁𝑁𝑜𝑜𝑁𝑁 𝑁𝑁𝑁𝑁𝑙𝑙𝑑𝑑𝑑𝑑𝑑𝑑𝑁𝑁𝑁𝑁𝑁𝑁𝑑𝑑 𝑁𝑁𝑁𝑁𝑒𝑒𝑑𝑑𝑜𝑜𝑏𝑏𝑁𝑁𝑁𝑁𝑑𝑑
𝑒𝑒 100

59
E. Electronic Services(Ref: POAs 4 and 5)
Table 11. Use of Electronic Services, 2016-181
[2016] [2017] [2018] Electronic filing2
(In percent of all declarations filed for each tax type) CIT 100.0 100.0 100.0 PIT 100.0 100.0 100.0 PAYE (Withholding) 100.0 100.0 100.0 VAT 100.0 100.0 100.0 Domestic excise tax (for all registered taxpayers) 100.0 100.0 100.0
Large taxpayers (all core taxes) 100.0 100.0 100.0 Electronic payments3
(In percent of total number of payments received for each tax type)
CIT 100.0 100.0 100.0 PIT 100.0 100.0 100.0 PAYE (Withholding) 100.0 100.0 100.0 VAT 100.0 100.0 100.0 Domestic excise tax (for all registered taxpayers) 100.0 100.0 100.0
Large taxpayers (all core taxes) 100.0 100.0 100.0 Electronic payments
(In percent of total value of payments received for each tax type)
CIT 100.0 100.0 100.0 PIT 100.0 100.0 100.0 PAYE (Withholding) 100.0 100.0 100.0 VAT 100.0 100.0 100.0 Domestic excise tax (for all registered taxpayers) 100.0 100.0 100.0
Large taxpayers (all core taxes) 100.0 100.0 100.0
Explanatory notes:
1 Data in this table will provide an indicator of the extent to which the tax administration is using modern technology to transform operations, namely in areas of filing and payment.
2 For purposes of this table, electronic filing involves facilities that enable taxpayers to complete tax declarations online and file those declarations via the Internet.
3 An electronic payment is a payment made from one bank account to another via electronic means without the direct intervention of bank staff instead of using cash or check, in person or by mail. Methods of electronic payment include credit cards, debit cards, and electronic funds transfer (where money is electronically transferred via the Internet from a taxpayer’s bank account to the Treasury account). Electronic payments may be made, for example, by mobile telephone where technology is used to turn mobile phones into an Internet terminal from which payments can be made.

60
F. Payments (Ref: POA 5)
Table 12. VAT Payments Made During 2018
VAT payments made on-time1 VAT payments due2 On-time payment rate3
(In percent) All VAT payers
Large VAT payers
All VAT payers
Large VAT payers
All VAT payers
Large VAT payers
Number of payments 49,457 3,484 54,657 3,484 90.5 100.0 Value of payments (million TJS) 1,926.7 1,645.0 2,129.0 1,645.8 90.4 100.0
Explanatory notes:
1 ‘On-time’ payment means paid on or before the statutory due date for payment (plus any ‘days of grace’ applied by the tax administration as a matter of administrative policy).
2 ‘Payments due’ include all payments due, whether self-assessed or administratively assessed (including as a result of an audit).
3 The ‘on-time payment rate’ is the number (or value) of VAT payments made by the statutory due date in percent of the total number (or value) of VAT payments due, i.e. expressed as ratios:
• The on-time payment rate by number is: 𝑁𝑁𝑁𝑁𝑁𝑁𝑁𝑁𝑁𝑁𝑁𝑁 𝑜𝑜𝑜𝑜 𝑉𝑉𝑉𝑉𝑉𝑉 𝑝𝑝𝑝𝑝𝑝𝑝𝑁𝑁𝑁𝑁𝑝𝑝𝑝𝑝𝑝𝑝 𝑁𝑁𝑝𝑝𝑚𝑚𝑁𝑁 𝑁𝑁𝑝𝑝 𝑝𝑝ℎ𝑁𝑁 𝑚𝑚𝑁𝑁𝑁𝑁 𝑚𝑚𝑝𝑝𝑝𝑝𝑁𝑁 𝑉𝑉𝑜𝑜𝑝𝑝𝑝𝑝𝑇𝑇 𝑝𝑝𝑁𝑁𝑁𝑁𝑁𝑁𝑁𝑁𝑁𝑁 𝑜𝑜𝑜𝑜 𝑉𝑉𝑉𝑉𝑉𝑉 𝑝𝑝𝑝𝑝𝑝𝑝𝑁𝑁𝑁𝑁𝑝𝑝𝑝𝑝𝑝𝑝 𝑚𝑚𝑁𝑁𝑁𝑁
𝑒𝑒 100
• The on-time payment rate by value is: 𝑉𝑉𝑝𝑝𝑇𝑇𝑁𝑁𝑁𝑁 𝑜𝑜𝑜𝑜 𝑉𝑉𝑉𝑉𝑉𝑉 𝑝𝑝𝑝𝑝𝑝𝑝𝑁𝑁𝑁𝑁𝑝𝑝𝑝𝑝𝑝𝑝 𝑁𝑁𝑝𝑝𝑚𝑚𝑁𝑁 𝑁𝑁𝑝𝑝 𝑝𝑝ℎ𝑁𝑁 𝑚𝑚𝑁𝑁𝑁𝑁 𝑚𝑚𝑝𝑝𝑝𝑝𝑁𝑁
𝑉𝑉𝑜𝑜𝑝𝑝𝑝𝑝𝑇𝑇 𝑣𝑣𝑝𝑝𝑇𝑇𝑁𝑁𝑁𝑁 𝑜𝑜𝑜𝑜 𝑉𝑉𝑉𝑉𝑉𝑉 𝑝𝑝𝑝𝑝𝑝𝑝𝑁𝑁𝑁𝑁𝑝𝑝𝑝𝑝𝑝𝑝 𝑚𝑚𝑁𝑁𝑁𝑁 𝑒𝑒 100

61
G. Domestic Tax Arrears(Ref: POA 5)
Table 13. Value of Tax Arrears, 2016-181
[2016] [2017] [2018] In million TJS
Total core tax revenue collections (from Table 1) (A) 4,325.0 3,836.0 5,772.0
Total core tax arrears at end of fiscal year2 (B) 436.0 348.7 308.7 199.0 115.1 92.4 105.5 102.5 128.7
In percent Ratio of (B) to (A)4 10.1 9.1 5.3 Ratio of (C) to (A)5 4.6 3.0 1.6 Ratio of (D) to (B)6 24.2 29.4 41.7
Explanatory notes:
1 Data in this table will be used in assessing the value of core tax arrears relative to annual collections and examining the extent to which unpaid tax liabilities are significantly overdue (i.e. older than 12 months).
2 ‘Total core tax arrears’ include tax, penalties, and accumulated interest.
3 ’Collectible’ core tax arrears is defined as the total amount of domestic tax, including interest and penalties, that is overdue for payment and which is not subject to collection impediments. Collectible core tax arrears therefore generally exclude: (a) amounts formally disputed by the taxpayer and for which collection action has been suspended pending the outcome, (b) amounts that are not legally recoverable (e.g., debt foregone through bankruptcy), and (c) arrears otherwise uncollectible (e.g., the debtor has no funds or other assets).
4 i.e. 𝑉𝑉𝑝𝑝𝑇𝑇𝑁𝑁𝑁𝑁 𝑜𝑜𝑜𝑜 𝑝𝑝𝑜𝑜𝑝𝑝𝑝𝑝𝑇𝑇 𝑐𝑐𝑜𝑜𝑁𝑁𝑁𝑁 𝑝𝑝𝑝𝑝𝑡𝑡 𝑝𝑝𝑁𝑁𝑁𝑁𝑁𝑁𝑝𝑝𝑁𝑁𝑝𝑝 𝑝𝑝𝑝𝑝 𝑁𝑁𝑝𝑝𝑚𝑚 𝑜𝑜𝑜𝑜 𝑜𝑜𝑓𝑓𝑝𝑝𝑐𝑐𝑝𝑝𝑇𝑇 𝑝𝑝𝑁𝑁𝑝𝑝𝑁𝑁 (𝐵𝐵)
𝑉𝑉𝑜𝑜𝑝𝑝𝑝𝑝𝑇𝑇 𝑐𝑐𝑜𝑜𝑁𝑁𝑁𝑁 𝑝𝑝𝑝𝑝𝑡𝑡 𝑐𝑐𝑜𝑜𝑇𝑇𝑇𝑇𝑁𝑁𝑐𝑐𝑝𝑝𝑁𝑁𝑚𝑚 𝑜𝑜𝑜𝑜𝑁𝑁 𝑜𝑜𝑓𝑓𝑝𝑝𝑐𝑐𝑝𝑝𝑇𝑇 𝑝𝑝𝑁𝑁𝑝𝑝𝑁𝑁 (𝑉𝑉) 𝑒𝑒 100
5 i.e. 𝑉𝑉𝑝𝑝𝑇𝑇𝑁𝑁𝑁𝑁 𝑜𝑜𝑜𝑜 𝑐𝑐𝑜𝑜𝑇𝑇𝑇𝑇𝑁𝑁𝑐𝑐𝑝𝑝𝑓𝑓𝑁𝑁𝑇𝑇𝑁𝑁 𝑐𝑐𝑜𝑜𝑁𝑁𝑁𝑁 𝑝𝑝𝑝𝑝𝑡𝑡 𝑝𝑝𝑁𝑁𝑁𝑁𝑁𝑁𝑝𝑝𝑁𝑁𝑝𝑝 𝑝𝑝𝑝𝑝 𝑁𝑁𝑝𝑝𝑚𝑚 𝑜𝑜𝑜𝑜 𝑜𝑜𝑓𝑓𝑝𝑝𝑐𝑐𝑝𝑝𝑇𝑇 𝑝𝑝𝑁𝑁𝑝𝑝𝑁𝑁 (𝐶𝐶)
𝑉𝑉𝑜𝑜𝑝𝑝𝑝𝑝𝑇𝑇 𝑐𝑐𝑜𝑜𝑁𝑁𝑁𝑁 𝑝𝑝𝑝𝑝𝑡𝑡 𝑐𝑐𝑜𝑜𝑇𝑇𝑇𝑇𝑁𝑁𝑐𝑐𝑝𝑝𝑁𝑁𝑚𝑚 𝑜𝑜𝑜𝑜𝑁𝑁 𝑜𝑜𝑓𝑓𝑝𝑝𝑐𝑐𝑝𝑝𝑇𝑇 𝑝𝑝𝑁𝑁𝑝𝑝𝑁𝑁 (𝑉𝑉) 𝑒𝑒 100
6 i.e. 𝑉𝑉𝑝𝑝𝑇𝑇𝑁𝑁𝑁𝑁 𝑜𝑜𝑜𝑜 𝑐𝑐𝑜𝑜𝑁𝑁𝑁𝑁 𝑝𝑝𝑝𝑝𝑡𝑡 𝑝𝑝𝑁𝑁𝑁𝑁𝑁𝑁𝑝𝑝𝑁𝑁𝑝𝑝 >12 𝑁𝑁𝑜𝑜𝑝𝑝𝑝𝑝ℎ𝑝𝑝′ 𝑜𝑜𝑇𝑇𝑚𝑚 𝑝𝑝𝑝𝑝 𝑁𝑁𝑝𝑝𝑚𝑚 𝑜𝑜𝑜𝑜 𝑝𝑝𝑁𝑁𝑝𝑝𝑁𝑁 (𝐷𝐷)𝑉𝑉𝑝𝑝𝑇𝑇𝑁𝑁𝑁𝑁 𝑜𝑜𝑜𝑜 𝑝𝑝𝑜𝑜𝑝𝑝𝑝𝑝𝑇𝑇 𝑐𝑐𝑜𝑜𝑁𝑁𝑁𝑁 𝑝𝑝𝑝𝑝𝑡𝑡 𝑝𝑝𝑁𝑁𝑁𝑁𝑁𝑁𝑝𝑝𝑁𝑁𝑝𝑝 𝑝𝑝𝑝𝑝 𝑁𝑁𝑝𝑝𝑚𝑚 𝑜𝑜𝑜𝑜 𝑜𝑜𝑓𝑓𝑝𝑝𝑐𝑐𝑝𝑝𝑇𝑇 𝑝𝑝𝑁𝑁𝑝𝑝𝑁𝑁 (𝐵𝐵)
𝑒𝑒 100

62
H. Tax Dispute Resolution(Ref: POA 7)
Table 14. Finalization of Administrative Reviews 2018
Month
Number of administrative review cases Finalized within 30 days Finalized within 60 days Finalized within 90 days
Stock at beginning of month
[A]
Received during the
month [B]
Finalized during
the month
[C]
Stock at end of month [A + B -
C]
Number In percent of total Number In percent
of total Number In percent of total
January 0 2 2 0 2 100 February 0 1 1 0 1 100 March 0 2 2 0 2 100 April 0 6 6 0 6 100 May 0 2 2 0 3 100 June 0 2 1 1 1 50 July 1 2 3 0 6 67 1 33 August 0 2 2 0 2 100 September 0 4 4 0 4 100 October 0 2 1 1 1 50 November 1 2 3 0 2 67 1 33 December 0 1 1 0 1 100
12-month total 0 29 29 0 27 93.1 2 6.9

63
I. Payment of VAT Refunds(Ref: POA 8)
Table 15. VAT Refunds 2018
Number of cases Value in million TJS Total VAT refund claims received (A) 133 26.6 Total VAT refunds paid1 130 23.9
Of which: paid within 30 days (B)2 130 23.9 Of which: paid outside 30 days 0 0.0
Total VAT refund claims declined3 3 2.7 Of which: declined within 30 days (C) 0 0 Of which: declined outside 30 days
Total VAT refund claims not processed4 0 0 Of which: no decision taken to decline refund Of which: approved but not yet paid or offset
In percent Ratio of (B+C) to (A)5 97.7 89.9
Explanatory note: 1 Include all refunds paid, as well as refunds offset against other tax liabilities.
2 TADAT measures performance against a 30-day standard.
3 Include cases where a formal decision has been taken to decline (refuse) the taxpayer’s claim for refund (e.g., where the legal requirements for refund have not been met).
4 Include all cases where refund processing is incomplete—i.e. where (a) the formal decision has not been taken to decline the refund claim; or (b) the refund has been approved but not paid or offset.
5 i.e. 𝑉𝑉𝑉𝑉𝑉𝑉 𝑁𝑁𝑁𝑁𝑜𝑜𝑁𝑁𝑝𝑝𝑚𝑚𝑝𝑝 𝑝𝑝𝑝𝑝𝑓𝑓𝑚𝑚 𝑤𝑤𝑓𝑓𝑝𝑝ℎ𝑓𝑓𝑝𝑝 30 𝑚𝑚𝑝𝑝𝑝𝑝𝑝𝑝 (𝐵𝐵)+𝑉𝑉𝑉𝑉𝑉𝑉 𝑁𝑁𝑁𝑁𝑜𝑜𝑁𝑁𝑝𝑝𝑚𝑚𝑝𝑝 𝑚𝑚𝑁𝑁𝑐𝑐𝑇𝑇𝑓𝑓𝑝𝑝𝑁𝑁𝑚𝑚 𝑤𝑤𝑓𝑓𝑝𝑝ℎ𝑓𝑓𝑝𝑝 30 𝑚𝑚𝑝𝑝𝑝𝑝𝑝𝑝 (𝐶𝐶)𝑉𝑉𝑜𝑜𝑝𝑝𝑝𝑝𝑇𝑇 𝑉𝑉𝑉𝑉𝑉𝑉 𝑁𝑁𝑁𝑁𝑜𝑜𝑁𝑁𝑝𝑝𝑚𝑚 𝑐𝑐𝑇𝑇𝑝𝑝𝑓𝑓𝑁𝑁𝑝𝑝 𝑁𝑁𝑁𝑁𝑐𝑐𝑁𝑁𝑓𝑓𝑣𝑣𝑁𝑁𝑚𝑚 (𝑉𝑉)
𝑒𝑒 100

64
Attachment IV. Organizational Chart

65
Attachment V. Sources of Evidence
Indicators Sources of Evidence P1-1. Accurate and reliable taxpayer information.
• Discussions with the TC officials of the RegistrationDepartment
• Government Order no. 533 dated 21st November 2017 onthe procedure for deregistration
• Government Instruction No. 175 dated 1st April 2017updating the earlier Instruction No. 493 dated 2nd
November 2013 on the procedure for registration oftaxpayers
• Government Resolution No. 323 dated 3rd August 2013 on“Rules of registration and assignment of TIN”
• Sample application for registration of legal entityconfirmed by TC Chairman Order No. 6-f dated 8th July2016
• Sample application for registration of individualenterpreneur confirmed by TC Chairman Order No. 6-fdated 8th July 2016
• Sample application for registration of representative officeof foreign legal entity confirmed by TC Chairman OrderNo. 6-f dated 8th July 2016
• TC Chairman Order No, 342 dated 29th November 2019on “Approval of the regulations of the RegistrationDepartment of the TC”Report on 12-month time-lapse surveys in cities and rayonsin 2017
P1-2. Knowledge of the potential taxpayer base.
• Discussions with the TC officials of the RegistrationDepartment
• TC Chairman Order No. 33 dated 23rd January 2018 on“Unified Plans for Operational Inspections in the first halfof 2018”
• TC Chairman Order No. 319 dated 7th August 2018 on“Unified Plans for Operational Inspections in the secondhalf of 2018”
• TC Chairman Order No. 385 dated 13th August 2019 layingout the program for inspection of new premises for eachoblast and local tax office
• Agreement No. 30 dated 17th September 2019 on theexchange of information online between the TC and theState Committee of Land Administration and Geodesy

66
Indicators Sources of Evidence • Agreement No. 30 1 dated 24th November 2014 on online
data exchange between the TC and the Ministry of InternalAffairs
• Joint Resolution No. 49 and 7f dated 19th September 2016on the development of a computer program for the stateregistration of immovable property at the State Committeeof Land Administration and Geodesy for online dataexchange with the TC
• Article in Boju Khiroj dated 14th June 2018 showing resultsof TC efforts of verification activities
• Report of the TC Chairman No. 564/5.1 dated 15th January2019 to the President of the Republic regarding the resultsof the performance of the TC showing action taken fordetecting new taxpayers.
• Statistical report on detection of new taxpayers throughinspection, by location and type of tax
P2-3. Identification, assessment, ranking, and quantification of compliance risks.
• List of the TC agreements with the 3rd parties on electronicdata exchange
• Analytical report on VAT return data, dated May 27, 2019.• VAT return data indicators by business industries for 2018
and 2019 (months 1-10)• Table of financial statement and profit tax indicators for
2018• Analytical report of mismatches in issue of tax invoices and
balances of virtual data warehouse, dated 2019• Analytical report of construction industry, dated April 5,
2019• Analytical report of companies operating in free economic
zones, dated 2019• Analytical reports on mismatch of VAT return and the
Customs data, dated 2019 and October 31, 2017• Taxpayer inspection results of 2019 (months 1-10)• Data table report of measuring the outcomes from tax
inspection by tax offices for 2019 and 2018• Taxpayer Perception Survey Final Report for 2017
conducted by Crowe Howarth under the TARP project• Taxpayer Perception Survey Final Report for 2019 conduct
by Crowe Howarth under the TARP project

67
Indicators Sources of Evidence P2-4. Mitigation of risks through a compliance improvement plan.
• Decree of the Government of the RT No.626 datedDecember 3, 201o as amended by Decree No.354 datedAugust 23, 2016, on Tax administration developmentprogram for year 2011-2019
• Order of the Chairman of the TC No.26 dated January 24,2019, on Action plan to execute the State budget for 2019
• Order of the Chairman of the TC No. 126 of 20.04.2016 "onthe average tax burden
• Order of the Chairman of the TC No.127 dated 20.04.2016on assessing risk criteria
• Order of the Chairman of the TC No.128 dated March 20,2018, on Action plan to execute the State budget for 2018
• Action plan of the Tax Audit Department of the TC for year2019, Q4, dated October 3, 2019
• Action plan of the Tax Audit Department of the TC for year2018, Q4, dated October 1, 2018
P2-5. Monitoring and evaluation of compliance risk mitigation activities.
• Letter of the TC No.440/9.1 dated January 11, 2019 on theresults of year 2018 in implementation the Taxadministration development program for year 2011-2019
• Letter of the TC No. 14638/5.1 dated October 16, 2018 onimplementation of budget revenue plan of year 2018
• Letter of the TC No. 14258/5.1 dated October 9, 2018 onimplementation of budget revenue plan of year 2018
• Letter of the TC No.67/1.2 dated January 3, 2018 on theresults of year 2017 in implementation the Taxadministration development program for year 2011-2019
• Report of the Tax Audit Department of the TC on theactivities of first half of year 2019
• Report of the Tax Audit Department of the TC on theactivities of year 2018
P2-6. Management of operational (i.e. systems and processes) risks.
• Activity plan to manage risks of emergency situations andcivil defense for year 2019
• Activity plan to manage risks of emergency situations andcivil defense for year 2018
• Report on implementation of activity plan to manage risksof emergency situations and civil defense for first half ofyear 2019

68
Indicators Sources of Evidence • Regulation of the Chairman of the TC No 29 dated October
12, 2016 on data backup and recovery• Training program of IT specialists for 2019 and 2020• Certificates of ICT specialists• Certificates of the TC IT systems dated 2016• Certificates of the TC servers and network infrastructure
dated 2016Agreement on certification of the TC IT systems andinfrastructure, dated December 19, 2019
P2-7. Management of human capital risks.
• No P2-7 related evidences provided by the TC at the time ofon site assessment
P3-8. Scope, currency, and accessibility of information.
• Decree of chairman TC- Decree no. 456 dated 31st August2012 as amended by Decree No. 316 dated 12.07.2017 onsetting standards of taxpayer services
• List of seminars conducted with subjects discussed.• Statistics on types of subscription to the weekly journal
“Boju Khiroj”.• Taxpayer service statistics on new brochures issued by the
Taxpayer Service Department.• Numbers and location of e- terminals and billboards.• Statistics on format of information received by taxpayers
through different medium.• Example of brochure issued by TC on property tax –
several other brochures for taxpayers were presented.• Report on 12 month time-lapse surveys in cities and rayons
in 2017• Order no. 415 dated 4.09.2019 of the Chairman regarding
program for conducting taxpayer seminars.Action plan for Taxpayer Service Department for the 2ndhalf of 2019
P3-9. Time taken to respond to information requests.
• Annex III, Table 3-table• TC instruction on methodology for call center.• Log of calls received per day by each operator with time
taken.• Statistics on month by month responses to calls made to the
contact centers for 11 months of 2019• Statistics on month by month responses to calls made to the
contact centers for 12 months of 2018

69
Indicators Sources of Evidence • List of subjects discussed in telephone calls and SMS
messages
P3-10. Scope of initiatives to reduce taxpayer compliance costs.
• Feedback from taxpayers on common misunderstanding andother activities of tax administration and follow up action byTC (Order No. 1-161 dated 9.09.2019)
• Statistics on format of information received by taxpayersthrough different medium.
P3-11. Obtaining taxpayer feedback on products and services.
• Questionnaire on feedback from taxpayers on frequency oftax audit.
• Instruction No. 14607 dated 20.09.2019 from Chairman TCto regional offices regarding obtaining feedback from fieldoffices.
• List of taxpayer surveys done by the TC by number oftaxpayers surveyed and by topics (inspections, Tax Code,quality of electronic service)
• Taxpayer Perception Survey Final Report for 2017conducted by Crowe Howarth under the TARP project
• Taxpayer Perception Survey Final Report for 2019 conductby Crowe Howarth under the TARP project
• Letter dated 23rd September 2019 from the Head of LegalDepartment to the TC Chairman proposing acceptance of27 out of 80 suggestions by taxpayers during consultationwith them.
P4-12. On-time filing rate. • Attachment III, Tables 4-10
P4-13 Management of non-filers.
• Monthly report for November 2019 regarding monitoring ofnon-filers by location and type of tax
• Order of the Chairman of the TC No. No. 9 dated10.01.2013, on “Procedure for accepting tax returns by taxauthorities”
• Order of the Chairman of the TC No. 316 dated 12.07.2017on “Unified state standard for servicing taxpayers"
P4-14. Use of electronic filing facilities.
• Attachment III, Table 11
P5-15. Use of electronic payment methods.
• Attachment III, Table 11
P5-16. Use of efficient collection systems.
• Chapter 11 of the Tax Code, Articles 158, 181-189
P5-17. Timeliness of payments.
• Attachment III, Table 12

70
Indicators Sources of Evidence P5-18. Stock and flow of tax arrears.
• Attachment III, Table 13• Chapter 12 of the Tax Code
P6-19. Scope of verification actions taken to detect and deter inaccurate reporting.
• Tax Code of the RT• Field audit plan for first half of year 2018• Field audit plan for second half of year 2018• Audit plan for second half of year 2018,• Audit plan for second half year 2019• Screen shots of IT system of the TC for cameral control• Screen shots of IT system of the TC for risk assessment• Screen shots of IT system of the TC for the audit planning• Screen shots of IT system of the TC for the audit planning
and documenting in LTO• Screen shots of IT systems of the TC on taxpayer profile• Regulation of the Chairman of the TC No. 127, dated April
20, 2016 on risk criteria to use in audit case selection• Instruction on conducting the tax audit• Instruction on conducting cameral control• Instruction on conducting the chronometrical inspection• Regulation of the Government of the TR No. 390, dated
July 2, 2009 on application of alternative methods intaxation
• Accumulated results of taxpayers inspection conducted bythe TC in 2019 (months 1-10)
• Data table report of measuring the outcomes from taxinspection by tax offices for 2019 and 2018
• Letter of the TC No. 17966/13.2 dated November 25, 2019on recommendations of tax auditing grain industry
• Letter of the TC No.13570/13.3-9 dated September 26,2018 on recommendation of auditing the incorrectapplication of tax regimes
• Letter of the TC No. 11282/13.1-8 dated August 23, 2017on recommendations of tax auditing salary accounting
• Order of the Chairman of the TC No. 280 s/x datedFebruary 16, 2018 on internal audit
• Report on the internal inspection on assigned by the Orderof the Chairman of the TC No. 280 s/x dated February 16,2018

71
Indicators Sources of Evidence • Letter of the TC No.4384 dated April 16, 2018 on the
findings and discrepancies identified during the internalaudit
• Letter of the TC No. 14284/12.4 dated September 16, 2019on re-conducting cameral control as the result of qualitychecks
• Letter of the TC No. 16691/9.1 dated October 30, 2019 onproposals to amend tax legislation and Tax code in regardto minimum salary, limitation of interest rates in estimatingprofit tax expenditures
• Report of the Tax Audit Department of the TC on theactivities for first half of year 2019
• Report of the Tax Audit Department of the TC on theactivities of year 2018
• Number of re-assignments on tax audit for year 2018-2019
P6-20. Use of large-scale data-matching systems to detect inaccurate reporting.
• Agreement No. 30 dated 17th September 2019 on theexchange of information online between the TC and theState Committee of Land Administration and Geodesy
• Agreement No. 30 1 dated 24th November 2014 on onlinedata exchange between the TC and the Ministry of InternalAffairs
• VAT return data matching against data from Agency ofStatistics on application of VAT rate for companiesconstructing real estate
• VAT return, Profit tax return data matching against datafrom cash registers of companies
• VAT return, Profit tax return data matching against datafrom gas stations
• Withholding income tax estimation matching against datafrom the Social Pension Fund
• Internet vendors payment data from National Bankmatching the registration and turnover reporting in VAT,profit tax return
• Real estate tax payment data matching against Real EstateRegister data
• VAT return data matching against the Customsimport/export turnover
• VAT sales/purchases matching against invoiceissued/received by other taxpayers

72
Indicators Sources of Evidence VAT turnover matching against transactional data of Public Procurement Agency
P6-21. Initiatives undertaken to encourage accurate reporting.
• Tax Code of the RT• Discussions with the officials of the Audit Department
P6-22. Monitoring the tax gap to assess inaccuracy of reporting levels.
• No P6-22 related evidences provided by the TC at the timeof on site assessment
P7-23. Existence of an independent, workable, and graduated dispute resolution process.
• Discussions with official of the Legal Department• Tax Code Chapter 14• TC Order No. 77 dated 11 March 2015 regarding the
process of setting up of the Appeal Board• Large Taxpayer Office – Results of Audits for January-
November 2019 with names of taxpayers and amounts ofadjustments, payments and fines.
• TC Order No. 295 dated 26.06.2019 dealing with theprocess of appeal
• Audit manual as updated on 20.04.2016 - section 1.8
P7-24. Time taken to resolve disputes.
• Attachment III, Table 12• Discussions with official of the Legal Department• Screenshot of ITMIS
P7-25. Degree to which dispute outcomes are acted upon.
• Letter No. 1911 dated 13th June 2019 from the Head of theLegal Department proposing amendment to the Law onState Judicial Examination for establishing tax expert panelfor disputes before the Economic Court.
• Draft amendment proposal vide Letter No. 19081/11.1dated 20th December 2019 from the Chairman TC to theGovernment of Tajikistan explaining the agreement andconcurrent between concerned ministries and agencies onthe Law on State Judicial Examination for establishing taxexpert panel for disputes before the Economic Court.
P8-26. Contribution to government tax revenue forecasting process.
• Discussions with the officials of DRAPPTD• Ministry of Finance “Methodology on Budget Forecasting”
2007 – Order No. 37 dated 9th September 2007.• Budget document of 2018

73
Indicators Sources of Evidence P8-27. Adequacy of the tax revenue accounting system.
• Discussions with the officials of DRAPPTD• Tax Code Articles 191-193.• Joint MOF and TC Instructions on Recording Accounting
Transactions into Tax Accounting System 2007 as updatedfrom time to time
• TC Chairman Order No. 33 dated 23rd January 20i8 layingout the program for internal audit of different TCdepartments and field offices during the year 2018
• Audit Report of the Chamber of Accounts No. 1/3-125dated 2nd May 2019 for the period 2018 (for view)
P8-28. Adequacy of tax refund processing.
• Discussions with the officials of DRAPPTD• Tax Code Articles 29 and 6,• Sample VAT Refund Order No. 11811/13-2 dated 27th
August 2019• Monthly Refund Reconciliation Statement of a sample
qualified exporter.
P9-29. Internal assurance mechanisms.
• Discussions with Internal Audit Department• Discussions with the Legal Department• TC Chairman Order No. 33 dated 23rd January 20i8 laying
out the program for internal audit of different TCdepartments and field offices during the year 2018
• Order No. 351 dated 23rd July 2019 laying out the six-month calendar of internal audit plan for the secondsemester of 2019
• Instruction No. 437 dated 18th September 2019 of the TCChairman on updates to internal audit methodology
• Training program in Hissar tax office on documentationsystem for internal auditors
• Sample training materials for auditors’ training• Internal auditors training program in Khatlon Oblast dated
16th April 2019• Internal audit report dated September 20, 2019 on financial
and operational performance of the tax office in Konibodamin Soghd oblast (confidential - for view)
• Internal audit report on revenue accounting system(confidential - for view)

74
Indicators Sources of Evidence P9-30. External oversight of the tax administration.
• Audit Report of the Chamber of Accounts No. 1/3-125dated 2nd May 2019 for the period 2018 (for view)
• Response of the Ministry of Finance No. 12864 dated 8th
December 2015 to the Audit Report (confidential -for view)• Response of the Ministry of Finance No. 132 M dated 20th
December 2017 to the Audit Report (confidential - forview)
P9-31. Public perception of integrity.
• Taxpayer Perception Survey Final Report for 2016 conductby Crowe Howarth under the TARP project
• Taxpayer Perception Survey Final Report for 2017conducted by Crowe Howarth under the TARP project
• Taxpayer Perception Survey Final Report for 2019 conductby Crowe Howarth under the TARP project
• Action Plan TJTARP/CQS-03 (02) issued by the FirstDeputy Chairman on follow up on the key findings of theTaxpayer Perception Survey Final Report for 2017
P9-32. Publication of activities, results and plans.
• Annual Report for 2018 and annual plan for 2019published in Boju Khorij dated 24th January 2019
• Annual Report for 2017 and annual plan for 2018published in Boju Khorij dated 18th January 2019
• Memo No. 365/5.1 dated 10th January 2019 of TCaddressed to the Prime Minister submitting the annualreport of performance for the year 2018
• Memo No. 564/5.1 dated 15th January 2019 of TCaddressed to the President submitting the annual report ofperformance for the year 2018
• Memo No. 15841/5 dated 14th October 2019 of TCaddressed to the Prime Minister providing report ofperformance for the first nine months of 2019
• Notification No. 354 dated 23rd August 2016 containingupdate to the Strategic Program of the TC 2011-2019originally notified by Notification No. 626 dated 3rd
December 2010 and amended by Notification No. 166dated 3rd April 2012

http://www.TADAT.org [email protected] +1.202.623.0429


![PROJECT PERFORMANCE ASSESSMENT REPORT ZIMBA]BWE …ieg.worldbankgroup.org/sites/default/files/Data/reports/ppar_25479.pdf · SUBJECT: Project Performance Assessment Report on Zimbabwe](https://static.documents.pub/doc/80x56/5e7e840738b8fc2c614b5938/project-performance-assessment-report-zimbabwe-ieg-subject-project-performance.jpg)


