22
PERFORMANCE AUDIT ____________ Red Lion Area School District York County, Pennsylvania ____________ December 2017

PERFORMANCE AUDIT ____________
Red Lion Area School District
York County, Pennsylvania ____________
December 2017

Dr. Scott A. Deisley, Superintendent Red Lion Area School District Red Lion Area Education Center 696 Delta Road Red Lion, Pennsylvania 17356
Mrs. Christine Crone, Board President Red Lion Area School District Red Lion Area Education Center 696 Delta Road Red Lion, Pennsylvania 17356
Dear Dr. Deisley and Mrs. Crone: We have conducted a performance audit of the Red Lion Area School District (District) for the period July 1, 2012, through June 30, 2016, except as otherwise indicated in the audit scope, objective, and methodology section of the report. We evaluated the District’s performance in the following areas as further described in the appendix of this report:
• Transportation Operations • Procurement Cards • Administrator Contract Buyout • Bus Driver Requirements • School Safety
The audit was conducted pursuant to Sections 402 and 403 of The Fiscal Code (72 P.S.
§§ 402 and 403), and in accordance with the Government Auditing Standards issued by the Comptroller General of the United States. Those standards require that we plan and perform the audit to obtain sufficient, appropriate evidence to provide a reasonable basis for our findings and conclusions based on our audit objectives. We believe that the evidence obtained provides a reasonable basis for our findings and conclusions based on our audit objectives. Our audit found that the District performed adequately in the areas listed above, except as noted in the following finding:
• The District Inaccurately Reported Transportation Data to the Pennsylvania Department of Education Resulting in an Underpayment to the District of $456,211

Dr. Scott A. Deisley Mrs. Christine Crone Page 2
We appreciate the District’s cooperation during the course of the audit. Sincerely,
Eugene A. DePasquale November 29, 2017 Auditor General cc: RED LION AREA SCHOOL DISTRICT Board of School Directors
Table of Contents Page Background Information ............................................................................................................. 1 Finding(s) .................................................................................................................................... 8
Finding – The District Inaccurately Reported Transportation Data to the Pennsylvania Department of Education Resulting in an Underpayment to the District of $456,211 .............................................................................. 8
Status of Prior Audit Findings and Observations ....................................................................... 12 Appendix: Audit Scope, Objectives, and Methodology ............................................................. 14 Distribution List .......................................................................................................................... 18

Red Lion Area School District Performance Audit 1
Background Information
School Characteristics 2015-16 School YearA
County York Total Square Miles 144
Resident PopulationB 38,264 Number of School
Buildings 91
Total Teachers 363 Total Full or Part-Time Support Staff 270
Total Administrators 22 Total Enrollment for Most Recent School
Year 5,282
Intermediate Unit Number 12
District Vo-Tech School
York County School of Technology
A - Source: Information provided by the District administration and is unaudited. B - Source: United States Census http://www.census.gov/2010census.
Mission StatementA
To prepare all students to reach their greatest potential, thus becoming responsible and productive citizens.
Financial Information
The following pages contain financial information about the Red Lion Area School District (District) obtained from annual financial data reported to the Pennsylvania Department of Education (PDE) and available on PDE’s public website. This information was not audited and is presented for informational purposes only.
Note: General Fund Balance is comprised of the District’s Committed, Assigned and Unassigned Fund Balances.
Note: Total Debt is comprised of Short-Term Borrowing, General Obligation Bonds, Authority Building Obligations, Other Long-Term Debt, Other Post-Employment Benefits and Compensated Absences.
1 One of the District’s schools (Windsor Manor Elementary) only serves grades K-1. Academic data is not collected for this school.
13.8 14.8 14.9 16.118.6
$0
$5
$10
$15
$20
2012 2013 2014 2015 2016
Mill
ions
General Fund BalanceFor Year End June 30
General Fund Balance
84.2 78.5 73.3 67.2
159.2
$0
$50
$100
$150
$200
2012 2013 2014 2015 2016
MIL
LIO
NS
TOTAL DEBTF O R Y E A R E N D J U N E 3 0
Debt

Red Lion Area School District Performance Audit 2
Financial Information Continued
78.4
79.9
81.1 84
.2 95.1
76.3
78.8
80.8
83.0 92
.7
$0$10$20$30$40$50$60$70$80$90
$100
2012 2013 2014 2015 2016
MIL
LIO
NS
Total Revenue and Expenditures
For Year End June 30
Total Revenue Total Expenditures
1.61
1.78
1.681.66
1.86
$1.45
$1.50
$1.55
$1.60
$1.65
$1.70
$1.75
$1.80
$1.85
$1.90
2012 2013 2014 2015 2016
Mill
ions
Total Charter Tuition Payments
For Year End June 30
Total Charter Tuition Payments
2012 2013 2014 2015 2016$0
$10
$20
$30
$40
$50
$60
50.7
52.2
52.4
54.1
53.3
26.6
26.8
27.9
29.2
30.8
1.0
0.8
0.7
1.0
1.0
0.2
0.0
0.0
0.0
10.0
MIL
LIO
NS
Revenue By SourceFor Year End June 30
Local Revenue State Revenue Federal Revenue Other Revenue

Red Lion Area School District Performance Audit 3
Academic Information The graphs on the following pages present School Performance Profile (SPP) scores, Pennsylvania System of School Assessment (PSSA), Keystone Exam results, and 4-Year Cohort Graduation Rates for the District obtained from PDE’s data files for the 2014-15 and 2015-16 school years.2 These scores are provided in the District’s audit report for informational purposes only, and they were not audited by our Department. Please note that if one of the District’s schools did not receive a score in a particular category and year presented below, the school will not be listed in the corresponding chart.3 Finally, benchmarks noted in the following graphs represent the statewide average of all public school buildings in the Commonwealth that received a score in the category and year noted.4 What is a SPP score? A SPP score serves as a benchmark for schools to reflect on successes, achievements, and yearly growth. PDE issues a SPP score using a 0-100 scale for all school buildings in the Commonwealth annually, which is calculated based on standardized testing (i.e. PSSA and Keystone exams), student improvement, advance course offerings, and attendance and graduation rates. Generally speaking, a SPP score of 70 or above is considered to be a passing rate. PDE started issuing a SPP score for all public school buildings beginning with the 2012-13 school year. For the 2014-15 school year, PDE only issued SPP scores for high schools taking the Keystone Exams as scores for elementary and middle scores were put on hold due to changes with PSSA testing.5 PDE resumed issuing a SPP score for all schools for the 2015-16 school year. What is the PSSA? The PSSA is an annual, standardized test given across the Commonwealth to students in grades 3 through 8 in core subject areas, including English and Math. The PSSAs help Pennsylvania meet federal and state requirements and inform instructional practices, as well as provide educators, stakeholders, and policymakers with important information about the state’s students and schools. The 2014-15 school year marked the first year that PSSA testing was aligned to the more rigorous PA Core Standards.6 The state uses a grading system with scoring ranges that place an individual student’s performance into one of four performance levels: Below Basic, Basic, Proficient, and Advanced. The state’s goal is for students to score Proficient or Advanced on the exam in each subject area. 2 PDE is the sole source of academic data presented in this report. All academic data was obtained from PDE’s publically available website. 3 PDE’s data does not provide any further information regarding the reason a score was not published for a specific school. However, readers can refer to PDE’s website for general information regarding the issuance of academic scores. 4 Statewide averages were calculated by our Department based on individual school building scores for all public schools in the Commonwealth, including district schools, charters schools, and cyber charter schools. 5 According to PDE, SPP scores for elementary and middle schools were put on hold for the 2014-15 school year due to the state’s major overhaul of PSSA exams to align with state Common Core standards and an unprecedented drop in public schools’ PSSA scores that year. Since PSSA scores are an important factor in the SPP calculation, the state decided not to use PSSA scores to calculate a SPP score for elementary and middle schools for the 2014-15 school year. Only high schools using the Keystone Exam as the standardized testing component received a SPP score. 6 PDE has determined that PSSA scores issued beginning with the 2014-15 school year and after are not comparable to prior years due to restructuring of the exam. (Also, see footnote 4).

Red Lion Area School District Performance Audit 4
What is the Keystone Exam? The Keystone Exam measures student proficiency at the end of specific courses, such as Algebra I, Literature, and Biology. The Keystone Exam was intended to be a graduation requirement starting with the class of 2017, but that requirement has been put on hold until at least 2020. In the meantime, the exam is still given as a standardized assessment and results are included in the calculation of SPP scores. The Keystone Exam is scored using the same four performance levels as the PSSAs, and the goal is to score Proficient or Advanced for each course requiring the test. What is a 4-Year Cohort Graduation Rate? PDE collects enrollment and graduate data for all Pennsylvania public schools, which is used to calculate graduation rates. Cohort graduation rates are a calculation of the percentage of students who have graduated with a regular high school diploma within a designated number of years since the student first entered high school. The rate is determined for a cohort of students who have all entered high school for the first time during the same school year. Data specific to the 4-year cohort graduation rate is presented in the graph.7
7 PDE also calculates 5-year and 6-year cohort graduation rates. Please visit PDE’s website for additional information: http://www.education.pa.gov/Data-and-Statistics/Pages/Cohort-Graduation-Rate-.aspx.

Red Lion Area School District Performance Audit 5
2014-15 Academic Data School Scores Compared to Statewide Averages
Red Lion Area Senior High School, 74
0 10 20 30 40 50 60 70 80 90 100
2014-15 SPP Scores
Statewide Average - 70.8
Red Lion Area Senior High School, 76.1
Red Lion Area Senior High School, 74.9
0 10 20 30 40 50 60 70 80 90 100
Math
English
2014-15 Keystone % Advanced or Proficient
Statewide English Avgerage - 70.7 Statewide Math Average - 62.4
Red Lion Area School District Average, 68.4
Red Lion Area School District Average, 52.0
Clearview Elementary School, 64.5
Clearview Elementary School, 48.3
Larry J. Macaluso Elementary School, 68.8
Larry J. Macaluso Elementary School, 55.6
Locust Grove Elementary School, 74.2
Locust Grove Elementary School, 58.5
Mazie Gable Elementary School, 54.8
Mazie Gable Elementary School, 43.6
North Hopewell-Winterstown Elementary School, 76.1
North Hopewell-Winterstown Elementary School, 57.5
Pleasant View Elementary School, 71.8
Pleasant View Elementary School, 57.4
Red Lion Area Junior High School, 68.4
Red Lion Area Junior High School, 43.4
0 10 20 30 40 50 60 70 80 90 100
English
Math
2014-15 PSSA % Advanced or Proficient
Statewide English Average - 60.0 Statewide Math Average - 41.2

Red Lion Area School District Performance Audit 6
2015-16 Academic Data School Scores Compared to Statewide Averages
Red Lion Area Senior High School, 88.8Red Lion Area Junior High School, 64.5Pleasant View Elementary School, 72.6North Hopewell-Winterstown Elementary School, 78.0Mazie Gable Elementary School, 76.8Locust Grove Elementary School, 72.5Larry J. Macaluso Elementary School, 80.2Clearview Elementary School, 70.1Red Lion Are a School District Average, 75.4
0 10 20 30 40 50 60 70 80 90 100
2015-16 SPP Scores
Statewide Average - 69.5
Red Lion Area Senior High School, 79.6
Red Lion Area Senior High School, 84.4
0 10 20 30 40 50 60 70 80 90 100
Math
English
2015-16 Keystone % Advanced or Proficient
Statewide English Average - 74.6 Statewide Math Average - 65.4
Red Lion Area School District Average, 68.3
Red Lion Area School District Average, 55.6
Clearview Elementary School, 67.2
Clearview Elementary School, 49.5
Larry J. Macaluso Elementary School, 69.6
Larry J. Macaluso Elementary School, 60.8
Locust Grove Elementary School, 69.3
Locust Grove Elementary School, 58.2
Mazie Gable Elementary School, 58.8
Mazie Gable Elementary School, 49.6
North Hopewell-Winterstown Elementary School, 73.6
North Hopewell-Winterstown Elementary School, 67.3
Pleasant View Elementary School, 68.9
Pleasant View Elementary School, 60.9
Red Lion Area Junior High School, 70.6
Red Lion Area Junior High School, 42.6
0 10 20 30 40 50 60 70 80 90 100
English
Math
2015-16 PSSA % Advanced or Proficient
Statewide English Average - 60.1 Statewide Math Average - 44.3

Red Lion Area School District Performance Audit 7
4-Year Cohort Graduation Rate
86.5 91
.0
88.4
88.8
0
20
40
60
80
100
2014-15 2015-16
4-Year Cohort Graduation Rate
District Graduation Rate Statewide Average

Red Lion Area School District Performance Audit 8
Finding(s) Finding The District Inaccurately Reported Transportation
Data to the Pennsylvania Department of Education Resulting in an Underpayment to the District of $456,211 The Red Lion Area School District (District) was underpaid $456,211 in transportation reimbursement from PDE. This underpayment was due to the District improperly reporting several required transportation components to PDE during the 2015-16 school year. The District incorrectly reported the number of days vehicles were used to transport students to and from school, the approved daily miles of these vehicles, the number of students assigned to ride in each vehicle, and total transportation contractor costs. Student transportation reimbursement is based on several components that are reported by the District to PDE for use in calculating the District’s annual reimbursement amount. These components include, but are not limited to, the following: • Total number of days each vehicle is used to transport
students to and from school. • Miles with and miles without students for each vehicle. • Students assigned to each vehicle. • Total eligible contractor costs. Since the above listed components are integral to the calculation of the District’s transportation reimbursement, it is essential for the District to properly record, calculate, and report this information to PDE. PDE provides instructions to help districts report this information accurately. Some of these instructions are cited in our criteria box to the left of this finding. During the 2015-16 school year, the District used two transportation contractors to transport students to and from school. The most significant error we identified during the 2015-16 school year was that the District incorrectly reported the number of days students were transported for its secondary contractor. The District computed the number
Criteria relevant to the finding: Student Transportation Subsidy: The Public School Code (PSC) provides that school districts receive a transportation subsidy for most students who are provided transportation. Section 2541 of the PSC, 24 P.S. § 25-2541, specifies the transportation formula and criteria. Total Students Transported: Section 2541 (a) of the PSC, 24 P.S. § 25-2541(a), states, in part: “School districts shall be paid by the Commonwealth for every school year on account of pupil transportation which, and the means and contracts providing for which, have been approved by the Department of Education, in the cases hereinafter enumerated, an amount to be determined by multiplying the cost of approved reimbursable pupils transportation incurred by the district by the district’s aid ratio. In determining the formula for the cost of approved reimbursable transportation, the Secretary of Education may prescribe the methods of determining approved mileages and the utilized passenger capacity of s for reimbursement purposes . . .” Sworn Statement and Annual Filing Requirements Section 2543 of the PSC, 24 P.S. § 25-2543, sets forth the requirement for school districts to annually file a sworn statement of student transportation data for the prior and current school year with the Pennsylvania Department of Education (PDE) in order to be eligible for the transportation subsidies.
Red Lion Area School District Performance Audit 9
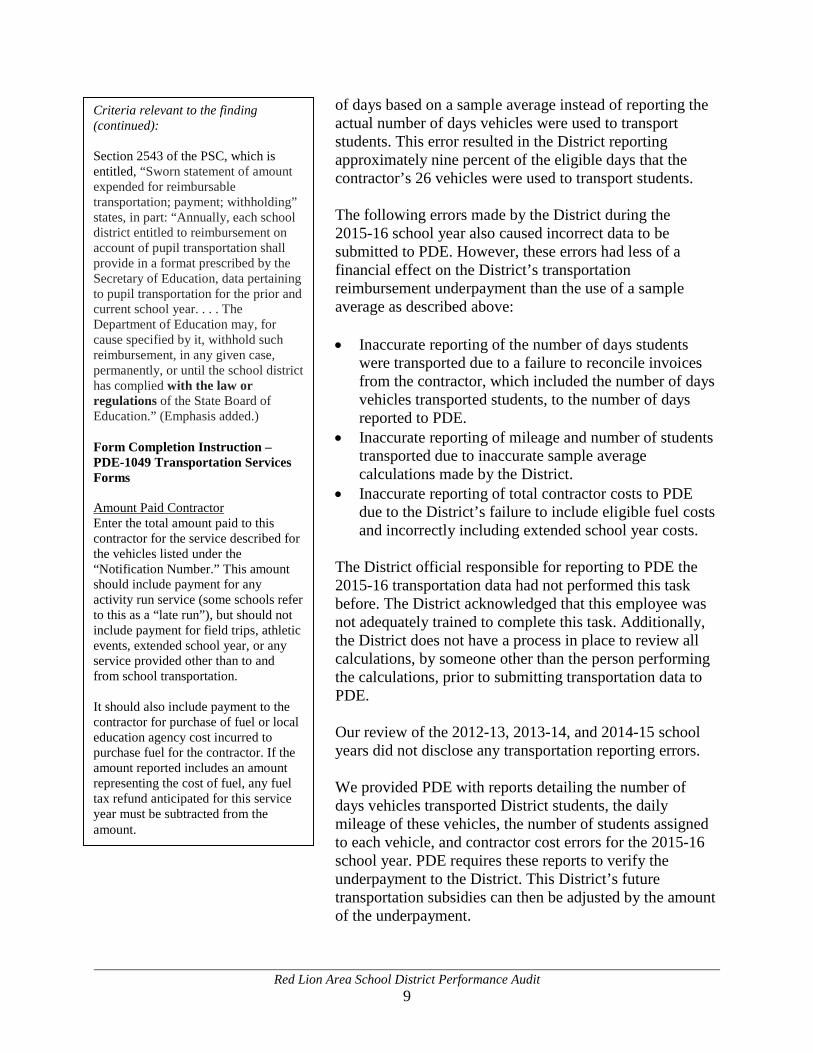
of days based on a sample average instead of reporting the actual number of days vehicles were used to transport students. This error resulted in the District reporting approximately nine percent of the eligible days that the contractor’s 26 vehicles were used to transport students. The following errors made by the District during the 2015-16 school year also caused incorrect data to be submitted to PDE. However, these errors had less of a financial effect on the District’s transportation reimbursement underpayment than the use of a sample average as described above: • Inaccurate reporting of the number of days students
were transported due to a failure to reconcile invoices from the contractor, which included the number of days vehicles transported students, to the number of days reported to PDE.
• Inaccurate reporting of mileage and number of students transported due to inaccurate sample average calculations made by the District.
• Inaccurate reporting of total contractor costs to PDE due to the District’s failure to include eligible fuel costs and incorrectly including extended school year costs.
The District official responsible for reporting to PDE the 2015-16 transportation data had not performed this task before. The District acknowledged that this employee was not adequately trained to complete this task. Additionally, the District does not have a process in place to review all calculations, by someone other than the person performing the calculations, prior to submitting transportation data to PDE. Our review of the 2012-13, 2013-14, and 2014-15 school years did not disclose any transportation reporting errors. We provided PDE with reports detailing the number of days vehicles transported District students, the daily mileage of these vehicles, the number of students assigned to each vehicle, and contractor cost errors for the 2015-16 school year. PDE requires these reports to verify the underpayment to the District. This District’s future transportation subsidies can then be adjusted by the amount of the underpayment.
Criteria relevant to the finding (continued): Section 2543 of the PSC, which is entitled, “Sworn statement of amount expended for reimbursable transportation; payment; withholding” states, in part: “Annually, each school district entitled to reimbursement on account of pupil transportation shall provide in a format prescribed by the Secretary of Education, data pertaining to pupil transportation for the prior and current school year. . . . The Department of Education may, for cause specified by it, withhold such reimbursement, in any given case, permanently, or until the school district has complied with the law or regulations of the State Board of Education.” (Emphasis added.) Form Completion Instruction – PDE-1049 Transportation Services Forms Amount Paid Contractor Enter the total amount paid to this contractor for the service described for the vehicles listed under the “Notification Number.” This amount should include payment for any activity run service (some schools refer to this as a “late run”), but should not include payment for field trips, athletic events, extended school year, or any service provided other than to and from school transportation. It should also include payment to the contractor for purchase of fuel or local education agency cost incurred to purchase fuel for the contractor. If the amount reported includes an amount representing the cost of fuel, any fuel tax refund anticipated for this service year must be subtracted from the amount.

Red Lion Area School District Performance Audit 10
Recommendations The Red Lion Area School District should: 1. Calculate the total number of days each vehicle was
used to provide District students transportation to and from school.
2. Calculate bus mileage and student counts based on the actual number of monthly readings.
3. Ensure all eligible costs are included when reporting to PDE total contractor costs.
4. Implement a procedure to have a District official other than the person who prepares the data review transportation data prior to submission to PDE.
The Pennsylvania Department of Education should: 5. Increase the District’s future transportation
reimbursements by $456,211. Management Response Management stated the following, responding to individual issues noted in this finding: • Inaccurate reporting of the number of days students
were transported due to a failure to reconcile invoices from the contractor, stating number of days vehicles transported students, to the number of days reported to PDE.
A spreadsheet has been created to show each billed day from the contractor. The spreadsheet reflects the number of days vehicles transported students so the information can be reconciled to the number of days reported to the PDE. A second person will be responsible to double check the information on the spreadsheet on a monthly basis.
• Inaccurate reporting of mileage and number of students
transported due to inaccurate sample average calculations made by the District.
Criteria relevant to the finding (continued): Pupils Assigned Report the greatest number of pupils assigned to ride this vehicle at any one time during the day. Report the number of pupils assigned to the nearest tenth. The number cannot exceed the seating capacity. If the number of pupils assigned changed during the year, calculate a weighted average or a sample average. Daily Miles With Report the number of miles per day, to the nearest tenth, that the vehicle traveled with pupils. If this figure changed during the year, calculate a weighted average or sample average. Daily Miles Without Report the number of miles per day, to the nearest tenth, that the vehicle traveled without pupils. If this figure changed during the year, calculate a weighted average or sample average. Number of Days Report the number of days (a whole number) this vehicle provided to and from school transportation. Count any part of a day as one day. Depending upon the service the vehicle provided, this number could exceed or be less than the number of days the district was in session; however, summer school or “Extended School Year” (Armstrong v. Kline) transportation may not be included in this number. “Early Intervention” program transportation may be included. If the district received a waiver of instructional days due to a natural or other disaster (such as a hurricane), the waiver does not extend to transportation services. Only days on which transportation was actually provided may be reported.

Red Lion Area School District Performance Audit 11
The Director of Transportation has received training on how to interpret data on the spreadsheet to ensure the averages reflect the correct number of months billed. The transportation department secretary will review the data on a monthly basis to verify accuracy. Additionally, the Director of Transportation will take advantage of future professional development opportunities.
• Inaccurate reporting of total contractor costs to the PDE
due to the District’s failure to include eligible fuel costs and incorrectly including extended school year costs.
A spreadsheet has been created to show each billed month and eligible fuel costs, excluding extended school year costs. This spreadsheet will be used in reporting to the PDE.
Auditor Conclusion We are pleased that the District has developed procedures to verify the accuracy of transportation data prior to its submission to PDE. We will evaluate the effectiveness of these procedures and any other corrective action implemented by the District during our next audit of the District.

Red Lion Area School District Performance Audit 12
Status of Prior Audit Findings and Observations
ur prior audit of the Red Lion Area School District (District) released on January 14, 2013, resulted in two findings, as shown below. As part of our current audit, we determined the
status of corrective action taken by the District to implement our prior audit recommendations. We reviewed the District’s written response provided to the Pennsylvania Department of Education (PDE), interviewed District personnel, and performed audit procedures as detailed in each status section below.
Auditor General Performance Audit Report Released on January 14, 2013
Prior Finding No. 1: Health Services Reimbursement Underpayment of $38,218
Prior Finding Summary: During our prior audit of the District, we found that the District did not
correctly report average daily membership (ADM). As a result, the District was underpaid $38,218 in health services reimbursement.
Prior Recommendations: We recommended that the District should:
1. Develop and implement written procedures and guidelines for the
collection, verification, and reporting of ADMs for health services reimbursement.
2. Reconcile final health services voucher received from the Pennsylvania Department of Health (PDH) to total ADMs reported by the District.
3. Review applications submitted subsequent to our current audit
period, and if errors are noted, submit revised reports to PDH. We also recommended that PDH should: 4. Adjust the District’s allocations to resolve the underpayment of
$38,218.
Current Status: Our review found that the District implemented our recommendations. In 2014, the District established written procedures to collect, verify, and report accurate information for health services reimbursement. At the same time, health services applications for the 2010-11 through 2012-13 school years were reviewed for accuracy and corrected, as needed. The District also reconciles the vouchers received from PDH to its annual report of health services data to ensure the accuracy of the data processed by PDH. Additionally, on June 8, 2015, the District received $38,218 to resolve the underpayment.
O

Red Lion Area School District Performance Audit 13
Prior Finding No. 2: Internal Control Weaknesses Regarding the Reporting of Membership Data
Prior Finding Summary: During our prior audit of the District, we found that the 2008-09 and 2009-10 membership data reported to the Pennsylvania Information Management System was not reconciled to the District’s detailed student membership reports. Numerous discrepancies were found in both years; however, no adjustments could be made. We also found that the District did not receive an accurate agency placement letter for one nonresident student placed in a private home (foster children) and educated by the District during the 2009-10 school year.
Prior Recommendations: We recommended that the District should:
1. Develop and implement procedures to ensure supporting
documentation for child accounting data, which supports membership data reported to PDE, is retained in a manner that it can be retrieved and will be available for audit.
2. Develop and implement written procedures for collecting and maintain membership data.
3. Develop and implement written procedures to reconcile student
detail reports to final PDE reports.
4. Obtain accurate agency placement letters, which include foster family, natural parents’ district of residence and whether a stipend was received, for all students reported as foster children.
Current Status: Our review found that the District implemented our recommendations.
The District’s current child accounting coordinator, who began employment in this capacity in April 2012, instituted written policies for collecting and maintaining child accounting data, beginning with the 2012-13 school year. Child accounting data is reconciled to PDE reports and is maintained at the District. The District also maintains agency placement letters for foster children.

Red Lion Area School District Performance Audit 14
Appendix: Audit Scope, Objectives, and Methodology School performance audits allow the Pennsylvania Department of the Auditor General to determine whether state funds, including school subsidies, are being used according to the purposes and guidelines that govern the use of those funds. Additionally, our audits examine the appropriateness of certain administrative and operational practices at each local education agency (LEA). The results of these audits are shared with LEA management, the Governor, the Pennsylvania Department of Education (PDE), and other concerned entities. Our audit, conducted under authority of Sections 402 and 403 of The Fiscal Code,8 is not a substitute for the local annual financial audit required by the Public School Code of 1949, as amended. We conducted our audit in accordance with Government Auditing Standards issued by the Comptroller General of the United States. Those standards require that we plan and perform the audit to obtain sufficient, appropriate evidence to provide a reasonable basis for our findings and conclusions based on our audit objectives. We believe that the evidence obtained provides a reasonable basis for our findings and conclusions based on our audit. Scope Overall, our audit covered the period July 1, 2012, through June 30, 2016. In addition, the scope of each individual audit objective is detailed on the next page. The Red Lion Area School District’s (District) management is responsible for establishing and maintaining effective internal controls9 to provide reasonable assurance that the District is in compliance with certain relevant state laws, regulations, contracts, and administrative procedures (relevant requirements). In conducting our audit, we obtained an understanding of the District’s internal controls, including any information technology controls, which we consider to be significant within the context of our audit objectives. We assessed whether those controls were properly designed and implemented. Any deficiencies in internal controls that were identified during the conduct of our audit and determined to be significant within the context of our audit objectives are included in this report.
8 72 P.S. §§ 402 and 403. 9 Internal controls are processes designed by management to provide reasonable assurance of achieving objectives in areas such as: effectiveness and efficiency of operations; relevance and reliability of operational and financial information; and compliance with certain relevant state laws, regulations, contracts, and administrative procedures.

Red Lion Area School District Performance Audit 15
Objectives/Methodology In order to properly plan our audit and to guide us in selecting objectives, we reviewed pertinent laws and regulations, board meeting minutes, academic performance data, annual financial reports, annual budgets, new or amended policies and procedures, and the independent audit report of the District’s basic financial statements for the fiscal years July 1, 2012, through June 30, 2016. We also determined if the District had key personnel or software vendor changes since the prior audit. Performance audits draw conclusions based on an evaluation of sufficient, appropriate evidence. Evidence is measured against criteria, such as laws, regulations, third-party studies, and best business practices. Our audit focused on the District’s efficiency and effectiveness in the following areas:
• Transportation Operations • Procurement Cards • Administrator Contract Buyout • Bus Driver Requirements • School Safety
As we conducted our audit procedures, we sought to determine answers to the following questions, which served as our audit objectives: Did the District ensure compliance with applicable laws and regulations governing
transportation operations, and did the District receive the correct transportation reimbursement from the Commonwealth?10
o To address this objective, we interviewed District personnel to get an understanding of the District procedures concerning reporting transportation data to PDE. Then we reviewed calculations for mileage, student counts, and total days students were transported for all 110 contracted vehicles used to transport District students during the 2015-16 school year.
o Based on the errors we identified in the 2015-16 school year, we reviewed all the calculations for mileage and total students transported for each vehicle used to transport District students during the 2012-13, 2013-14, and 2014-15 school years.11 Our review of this objective resulted in the finding in this report.
Did the District have board-approved policies and procedures over its procurement cards, and did the District follow these policies and procedures?
o To address this objective, we obtained the District policies and procedures
governing the use of District issued procurement cards. We then interviewed District personnel and received a walkthrough of the District procurement card
10 See 24 P.S. §§ 13-1301, 13-1302, 13-1305, 13-1306; 22 Pa. Code Chapter 11. 11 There were 79 total vehicles in 2012-13, 97 total vehicles in 2013-14, and 114 total vehicles in 2014-15.

Red Lion Area School District Performance Audit 16
approval process. We obtained a list of employees who were issued a procurement card during the period August 1, 2015, through July 31, 2016. Of these 41 employees, we selected 5 for detailed testing. Four of these five card holders were selected because they had the highest monetary amount of purchases during the time period. We selected the fifth card holder for detailed testing due to purchases that were determined as higher risk transactions (out of state travel and repeat transaction to the same vendor). These 5 employees had 556 total transactions during the time period, and we reviewed in detail 46 of these transactions determined to be of higher risk. During our review of these transactions, we found that the transactions were made in accordance with the District’s policies and procedures and all transactions were reviewed and approved by the appropriate District official.
Did the District pursue a contract buy-out with an administrator and if so, what was the total cost of the buy-out, what were the reasons for the termination/settlement, and did the employment contract(s) comply with the Public School Code12 and Public School Employees’ Retirement System guidelines?
o To address this objective, we reviewed the contracts, board meeting minutes,
payroll records, and leave records for all three individually contracted administrators who separated from employment with the District from July 1, 2012, through June 30, 2016. Our review of this objective did not disclose any reportable issues.
Did the District ensure that bus drivers transporting District students had the required
driver’s license, physical exam, training, background checks, and clearances as outlined in applicable laws?13 Also, did the District have written policies and procedures governing the hiring of new bus drivers that would, when followed, provide reasonable assurance of compliance with applicable laws?
o To address this objective, we randomly selected 10 of the 108 bus drivers hired by the District’s bus contractors between September 21, 2011, and September 27, 2017, and reviewed documentation to ensure the District complied with the requirements for bus drivers. We also determined if the District had written policies and procedures governing the hiring of bus drivers and if those procedures, when followed, ensure compliance with bus driver hiring requirements. Our review of this objective did not disclose any reportable issues.
12 24 P.S. § 10-1073(e)(2)(v). 13 24 P.S. § 1-111, 23 Pa.C.S. § 6344(a.1), 24 P.S. § 2070.1a et seq., 75 Pa.C.S. §§ 1508.1 and 1509, and 22 Pa. Code Chapter 8.

Red Lion Area School District Performance Audit 17
Did the District take actions to ensure it provided a safe school environment?14
o To address this objective, we interviewed District personnel and reviewed a variety of documentation including, but not limited to, emergency plans, training documents, anti-bullying policies, and risk and vulnerability assessments. Due to the sensitive nature of school safety, the results of our review of this objective area are not described in our audit report. The results of our review of school safety are shared with District officials and, if deemed necessary, PDE.
14 24 P.S. § 13-1301-A et seq.

Red Lion Area School District Performance Audit 18
Distribution List This report was initially distributed to the Superintendent of the District, the Board of School Directors, and the following stakeholders: The Honorable Tom W. Wolf Governor Commonwealth of Pennsylvania Harrisburg, PA 17120 The Honorable Pedro A. Rivera Secretary of Education 1010 Harristown Building #2 333 Market Street Harrisburg, PA 17126 The Honorable Joe Torsella State Treasurer Room 129 - Finance Building Harrisburg, PA 17120 Mrs. Danielle Mariano Director Bureau of Budget and Fiscal Management Pennsylvania Department of Education 4th Floor, 333 Market Street Harrisburg, PA 17126 Dr. David Wazeter Research Manager Pennsylvania State Education Association 400 North Third Street - Box 1724 Harrisburg, PA 17105 Mr. Nathan Mains Executive Director Pennsylvania School Boards Association 400 Bent Creek Boulevard Mechanicsburg, PA 17050 This report is a matter of public record and is available online at www.PaAuditor.gov. Media questions about the report can be directed to the Pennsylvania Department of the Auditor General, Office of Communications, 229 Finance Building, Harrisburg, PA 17120; via email to: [email protected].


