47
Performance-Based Financing in Rwanda Agnes Soucat, Adviser HNP Africa Region
| Date post: | 11-Jan-2016 |
| Category: |
Documents |
| Upload: | grace-barker |
| View: | 236 times |
| Download: | 7 times |
Performance-Based Financing in Rwanda
Agnes Soucat, Adviser HNP Africa Region

Background (1)• Shortage of human resources for health
services• No cash resources in health facilities• Low levels of productivity and motivation
among medical personnel • Low user satisfaction & poor quality of service
lead to low use.• High levels of child and maternal mortality
2
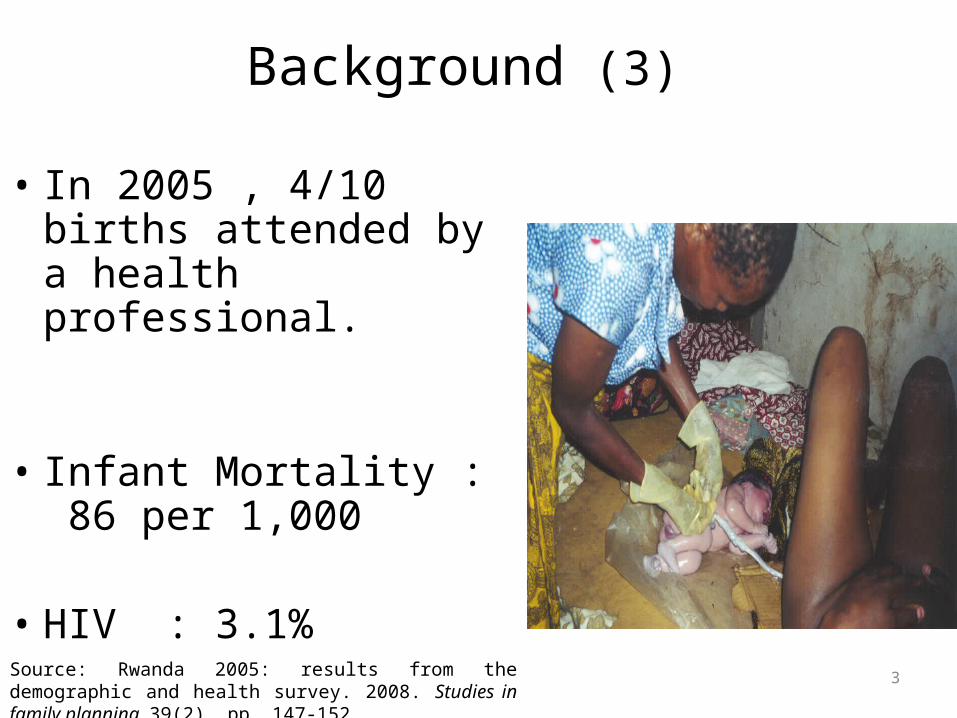
Background (3)
• In 2005 , 4/10 births attended by a health professional.
• Infant Mortality : 86 per 1,000
• HIV : 3.1% Source: Rwanda 2005: results from the demographic and health survey. 2008. Studies in family planning, 39(2), pp. 147-152.
3
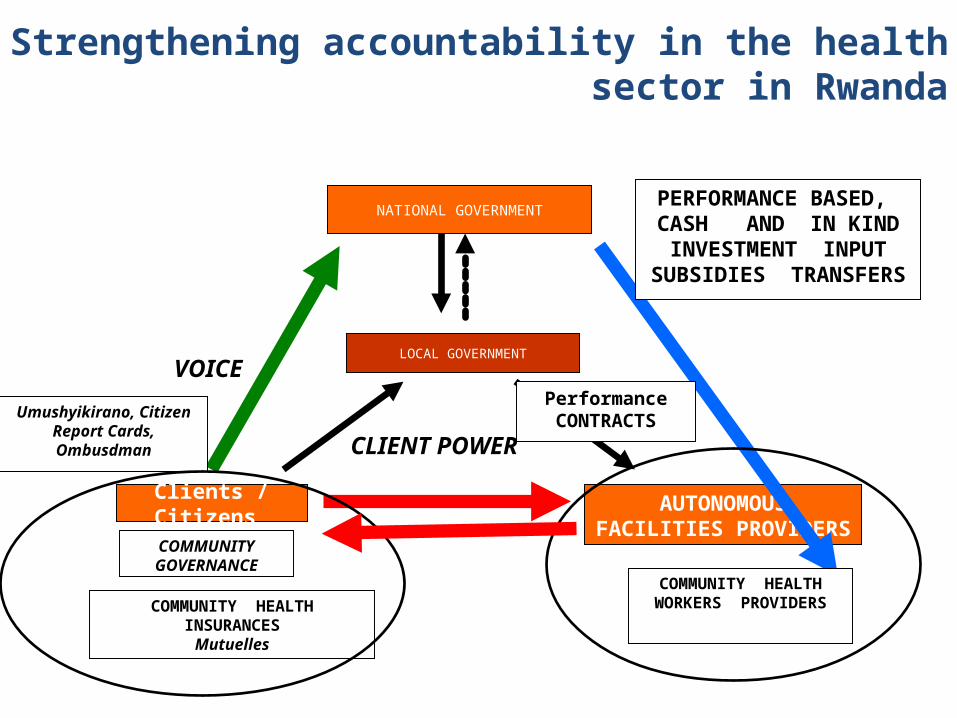
NATIONAL GOVERNMENT
LOCAL GOVERNMENT
AUTONOMOUS FACILITIES PROVIDERS
Clients / Citizens
VOICE
CLIENT POWER
Performance CONTRACTS
COMMUNITY HEALTH WORKERS
PROVIDERSCOMMUNITY HEALTH
INSURANCESMutuelles
COMMUNITYGOVERNANCE
Umushyikirano, Citizen Report
Cards, Ombusdman
PERFORMANCE BASED, CASH AND
IN KIND INVESTMENT INPUT
SUBSIDIES TRANSFERS
Strengthening accountability in the health sector in Rwanda
Rwanda has undertook major reforms to strengthen accountability of all institutional and individual actors for MDGs related results...
- Decentralisation of health services with strong governance structures based community participation.
- Imihigo: Performance contracts between President of Republic and mayor of Districts;
- PBF: Performance Based Financing;- CBHI: Community Health Insurance;- Autonomy of health facilities, including hiring and
firing of health personnel;
..through a shift of paradigm..
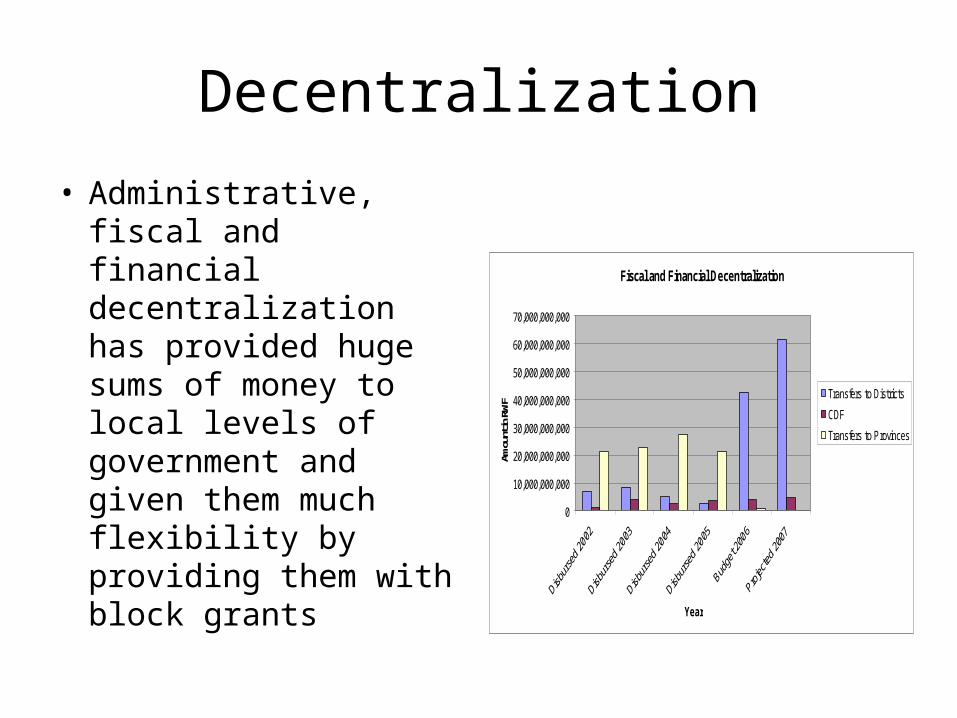
Decentralization
• Administrative, fiscal and financial decentralization has provided huge sums of money to local levels of government and given them much flexibility by providing them with block grants
Fiscal and Financial Decentralization
0
10,000,000,000
20,000,000,000
30,000,000,000
40,000,000,000
50,000,000,000
60,000,000,000
70,000,000,000
Year
Amou
nt in
RW
F
Transfers to Districts
CDF
Transfers to Provinces
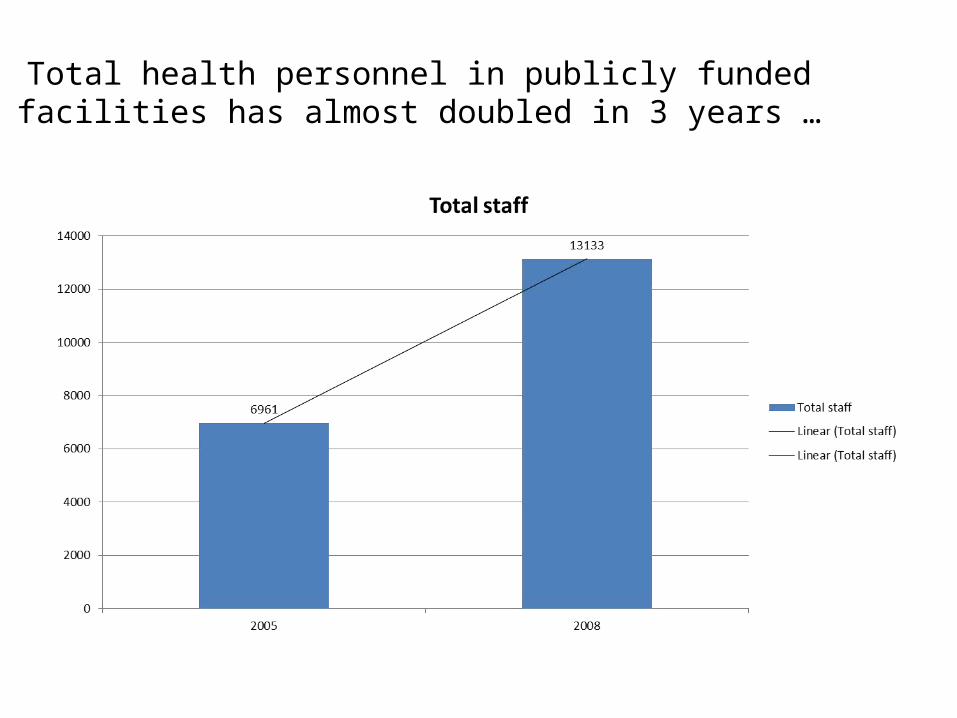
Total health personnel in publicly funded facilities has almost doubled in 3 years …
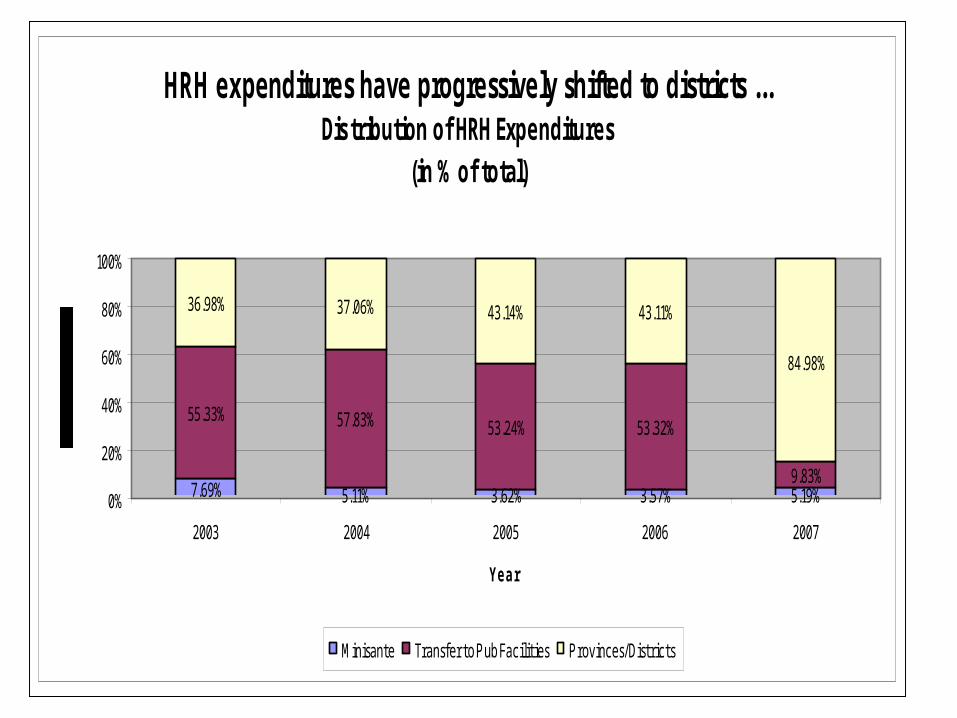
HRH expenditures have progressively shifted to districts ...Distribution of HRH Expenditures
(in % of total)
7.69% 5.11% 3.62% 3.57% 5.19%
55.33% 57.83% 53.24% 53.32%
9.83%
36.98% 37.06% 43.14% 43.11%
84.98%
0%
20%
40%
60%
80%
100%
2003 2004 2005 2006 2007
Year
Minisante Transfer to Pub Facilities Provinces/Districts
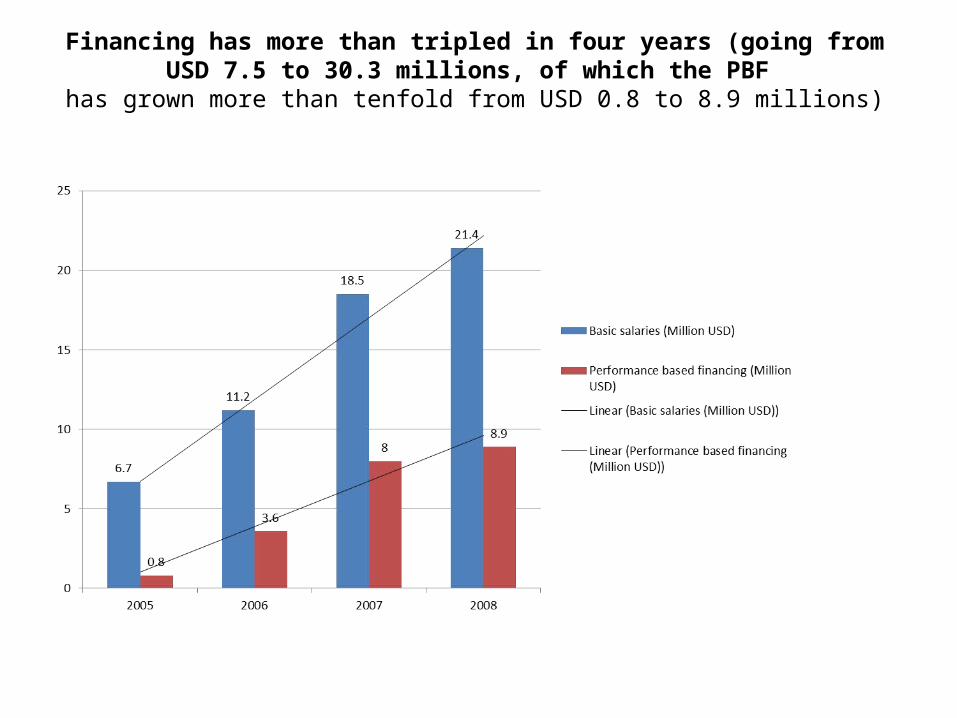
Financing has more than tripled in four years (going from USD 7.5 to 30.3 millions, of which the PBF
has grown more than tenfold from USD 0.8 to 8.9 millions)
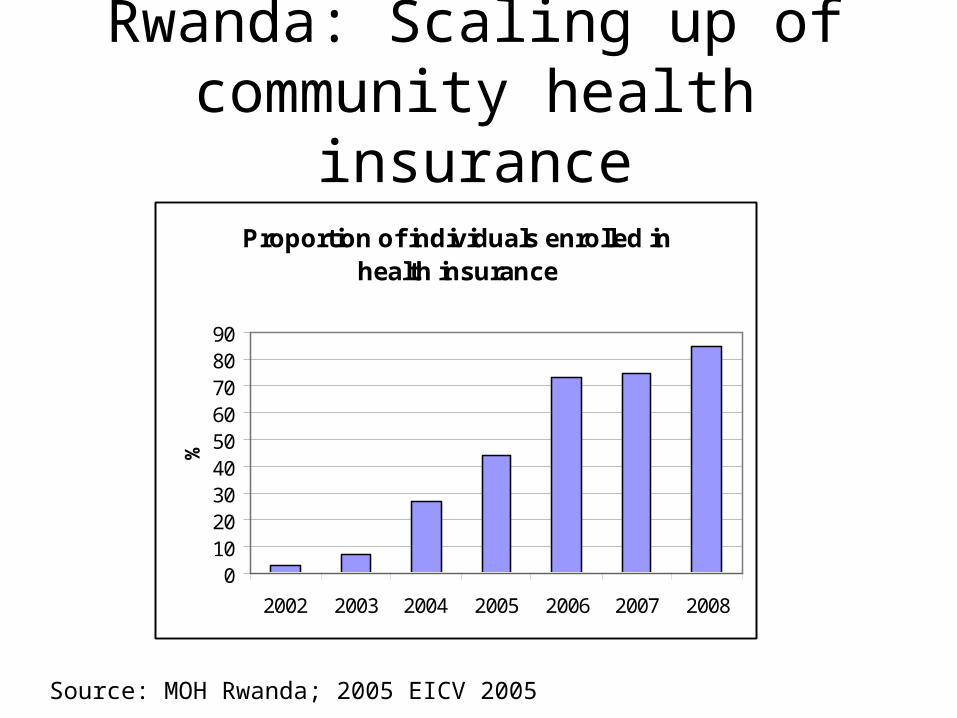
Rwanda: Scaling up of community health insurance
Proportion of individuals enrolled in health insurance
0102030405060708090
2002 2003 2004 2005 2006 2007 2008
%
Source: MOH Rwanda; 2005 EICV 2005
Results show Rwanda is now back on track towards the health MDGs…
• Health outcomes– Neonatal, infant and child mortality– Malaria incidence and mortality– HIV– Improved financial access– Reduction of catastrophic expenditures
• High Impact Interventions– ITNs– Family planning– Assisted Deliveries– Quality of care
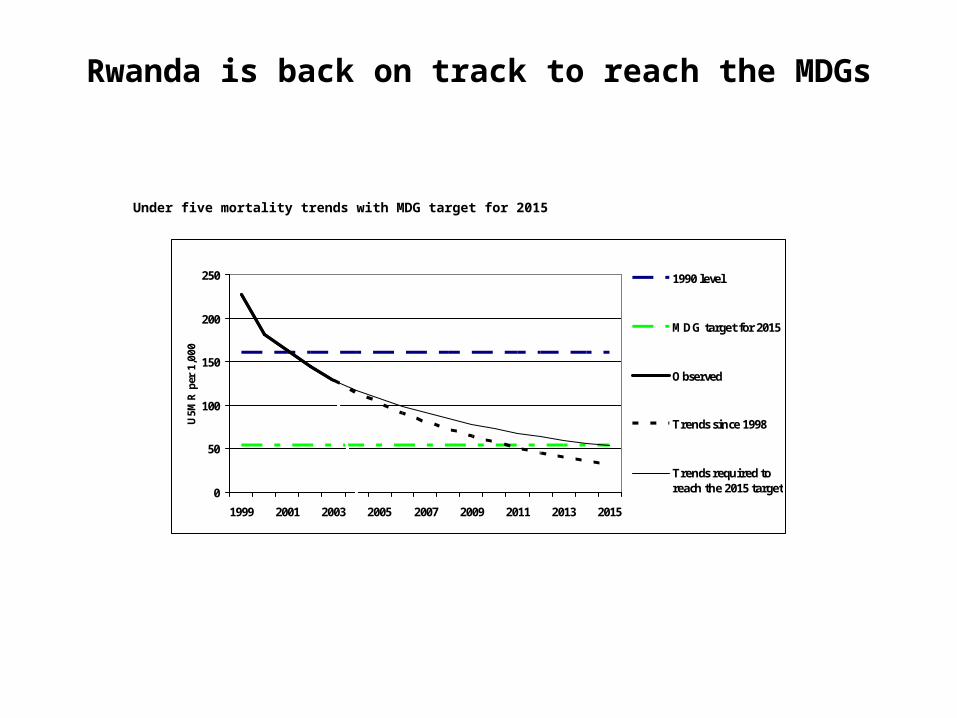
Rwanda is back on track to reach the MDGs
Under five mortality trends with MDG target for 2015
0
50
100
150
200
250
1999 2001 2003 2005 2007 2009 2011 2013 2015
U5M
R p
er 1
,000
1990 level
MDG target for 2015
Observed
Trends since 1998
Trends required toreach the 2015 target
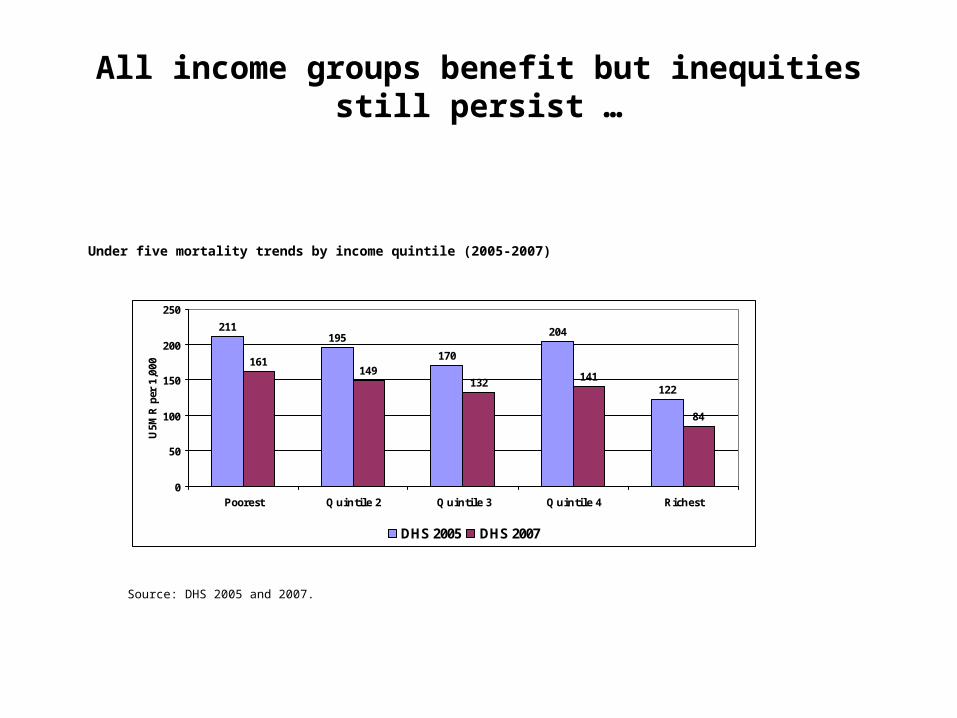
All income groups benefit but inequities still persist …
Under five mortality trends by income quintile (2005-2007)
211195
170
204
122
161149
132 141
84
0
50
100
150
200
250
Poorest Q uintile 2 Q uintile 3 Q uintile 4 Richest
U5M
R p
er 1
,000
DHS 2005 DHS 2007
Source: DHS 2005 and 2007.
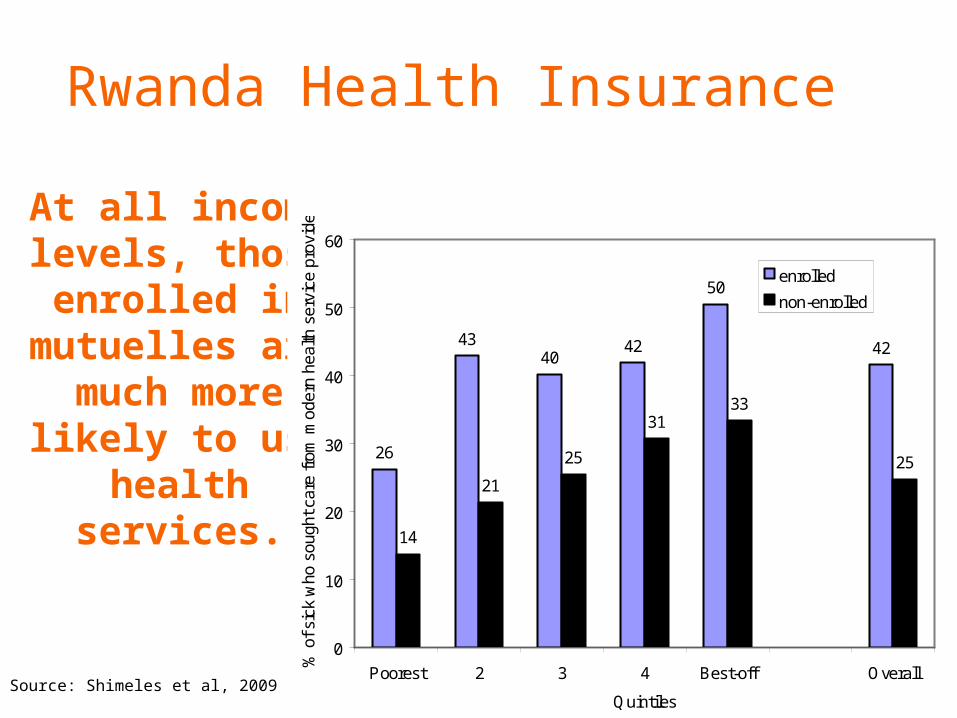
At all income levels, those enrolled in
mutuelles are much more likely
to use health services.
26
4340
42
50
42
14
21
25
3133
25
0
10
20
30
40
50
60
Poorest 2 3 4 Best-off Overall
Quintiles
% o
f sic
k w
ho s
ough
t car
e fr
om m
oder
n he
alth
ser
vice
pro
vide
r
enrolled
non-enrolled
Source: Shimeles et al, 2009
Rwanda Health Insurance
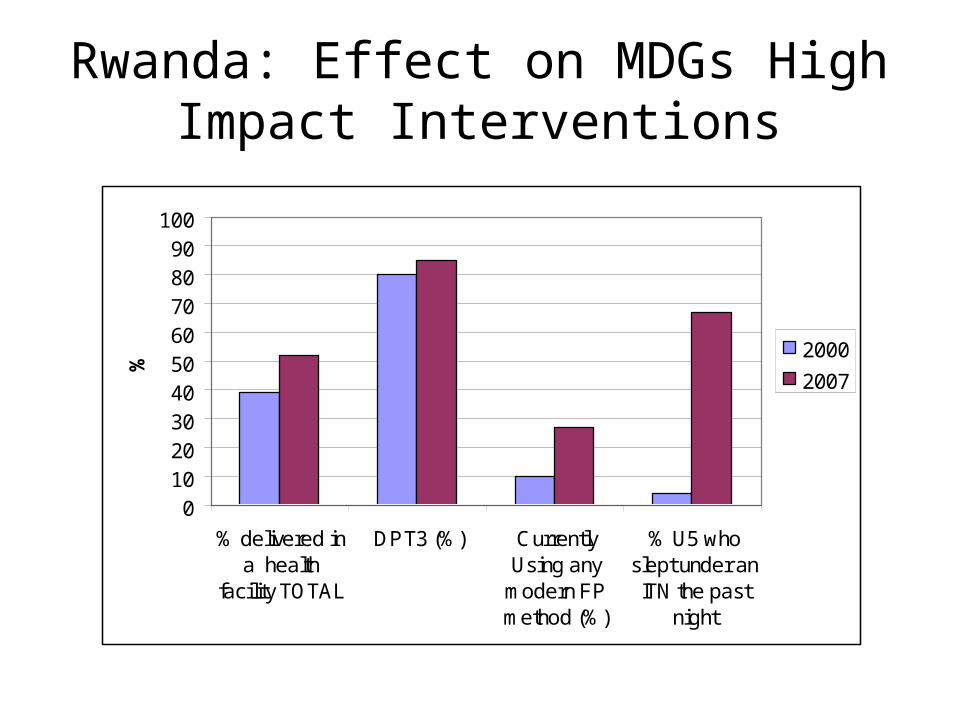
Rwanda: Effect on MDGs High Impact Interventions
0102030405060708090
100
% delivered ina health
facility TOTAL
DPT3 (%) CurrentlyUsing any
modern FPmethod (%)
% U5 whoslept under anITN the past
night
%
2000
2007
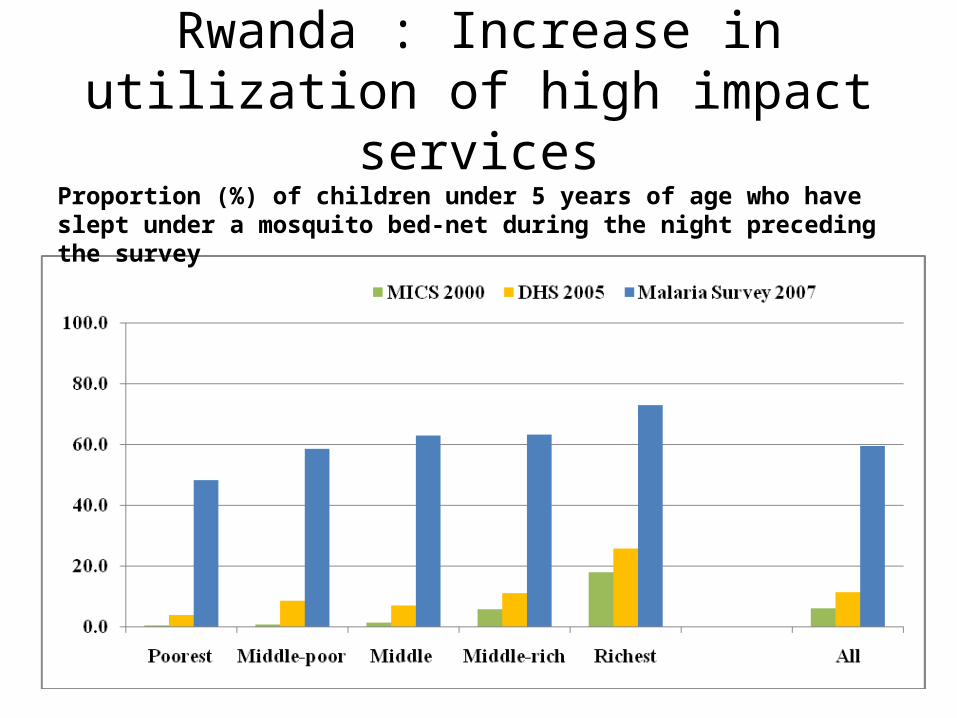
Rwanda : Increase in utilization of high impact services
Proportion (%) of children under 5 years of age who have slept under a mosquito bed-net during the night preceding the survey
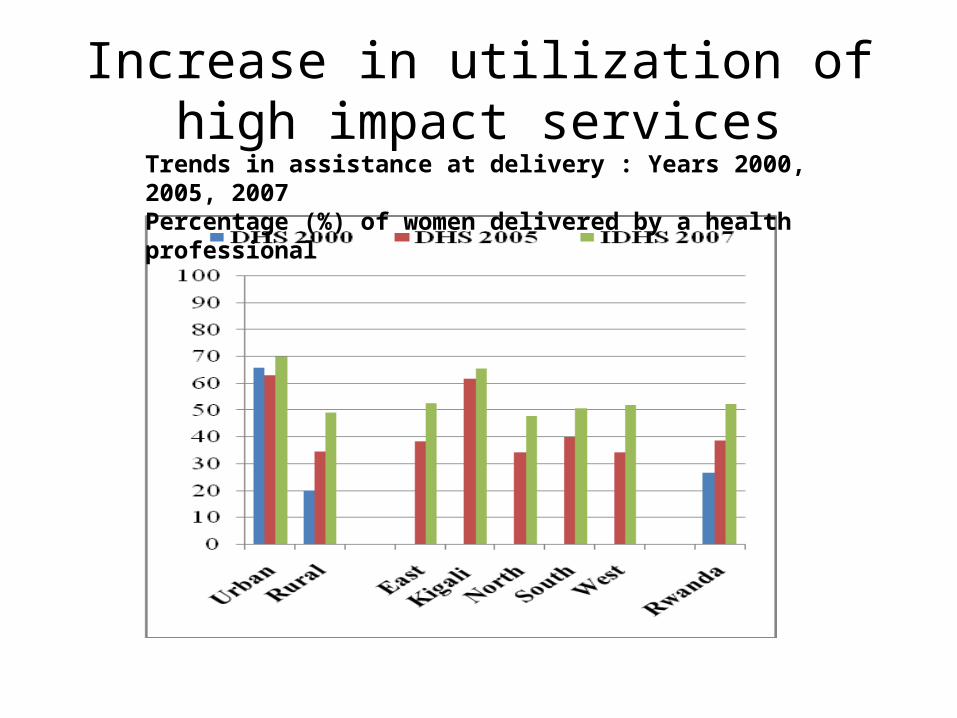
Increase in utilization of high impact services
Trends in assistance at delivery : Years 2000, 2005, 2007Percentage (%) of women delivered by a health professional
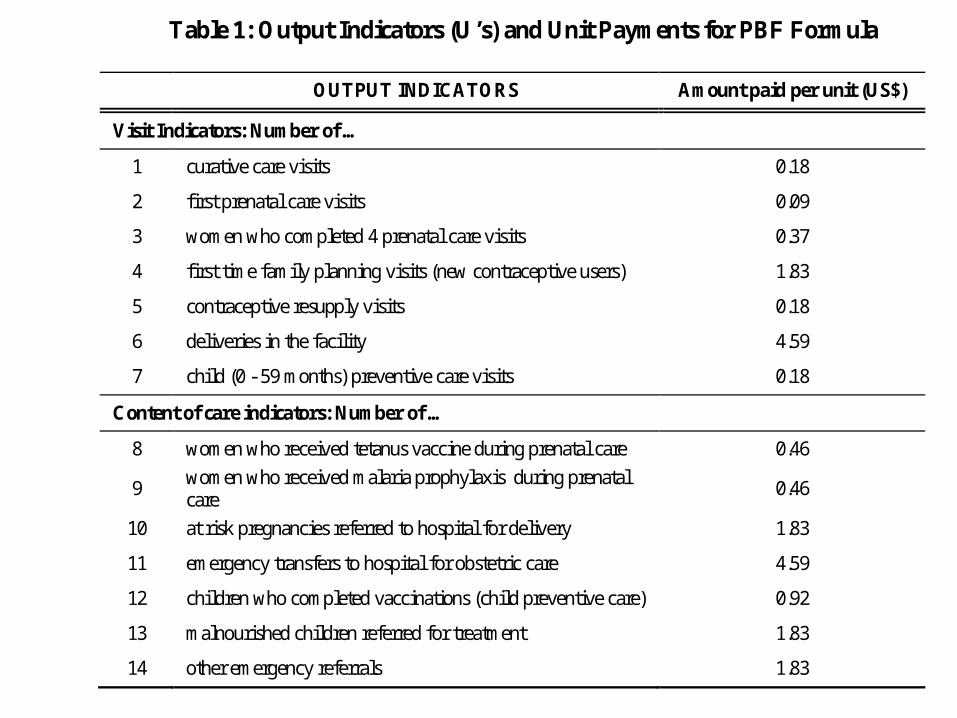
Table 1: Output Indicators (U’s) and Unit Payments for PBF Formula
OUTPUT INDICATORS Amount paid per unit (US$)
Visit Indicators: Number of …
1 curative care visits 0.18
2 first prenatal care visits 0.09
3 women who completed 4 prenatal care visits 0.37
4 first time family planning visits (new contraceptive users) 1.83
5 contraceptive resupply visits 0.18
6 deliveries in the facility 4.59
7 child (0 - 59 months) preventive care visits 0.18
Content of care indicators: Number of …
8 women who received tetanus vaccine during prenatal care 0.46
9 women who received malaria prophylaxis during prenatal care
0.46
10 at risk pregnancies referred to hospital for delivery 1.83
11 emergency transfers to hospital for obstetric care 4.59
12 children who completed vaccinations (child preventive care) 0.92
13 malnourished children referred for treatment 1.83
14 other emergency referrals 1.83
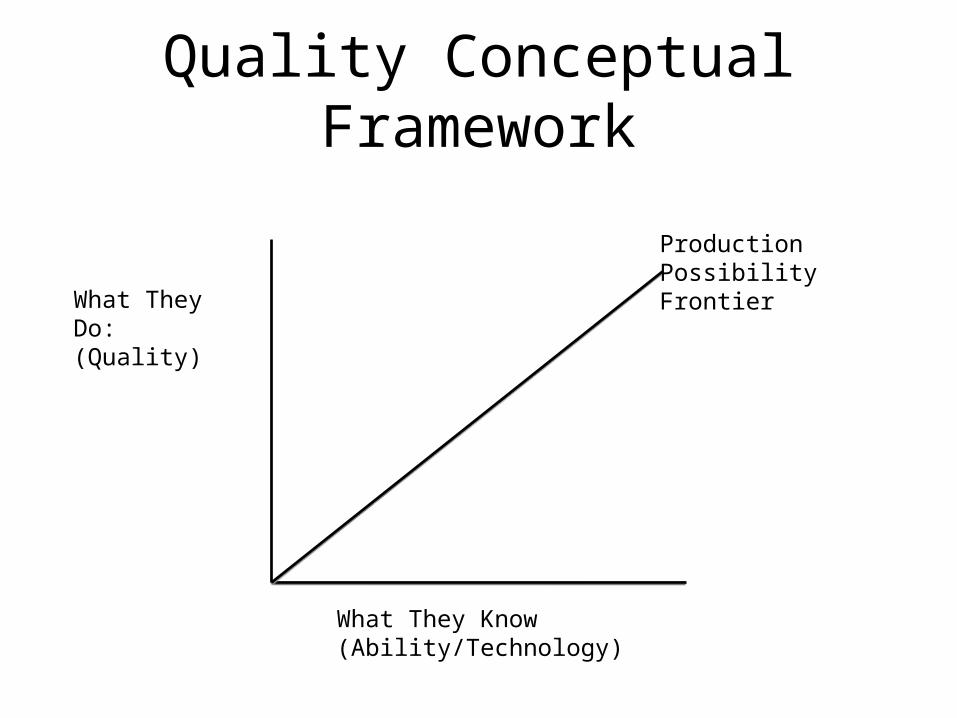
Quality Conceptual Framework
What They Know (Ability/Technology)
What They Do: (Quality)
Production Possibility Frontier
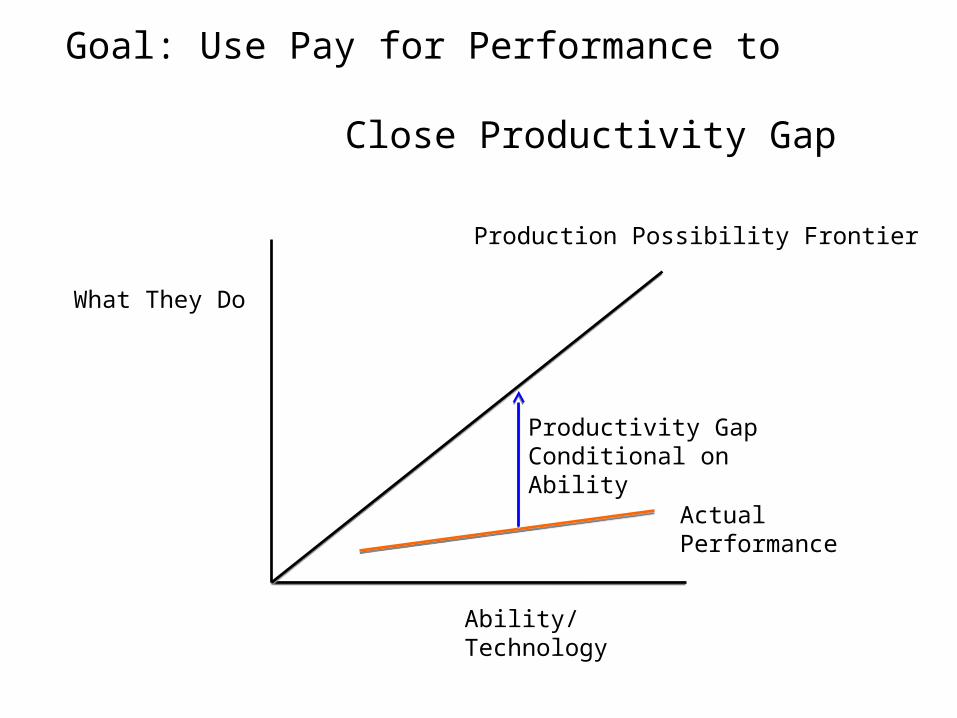
Goal: Use Pay for Performance to
Close Productivity Gap
Ability/Technology
What They Do
Production Possibility Frontier
Productivity Gap Conditional on Ability
Actual Performance
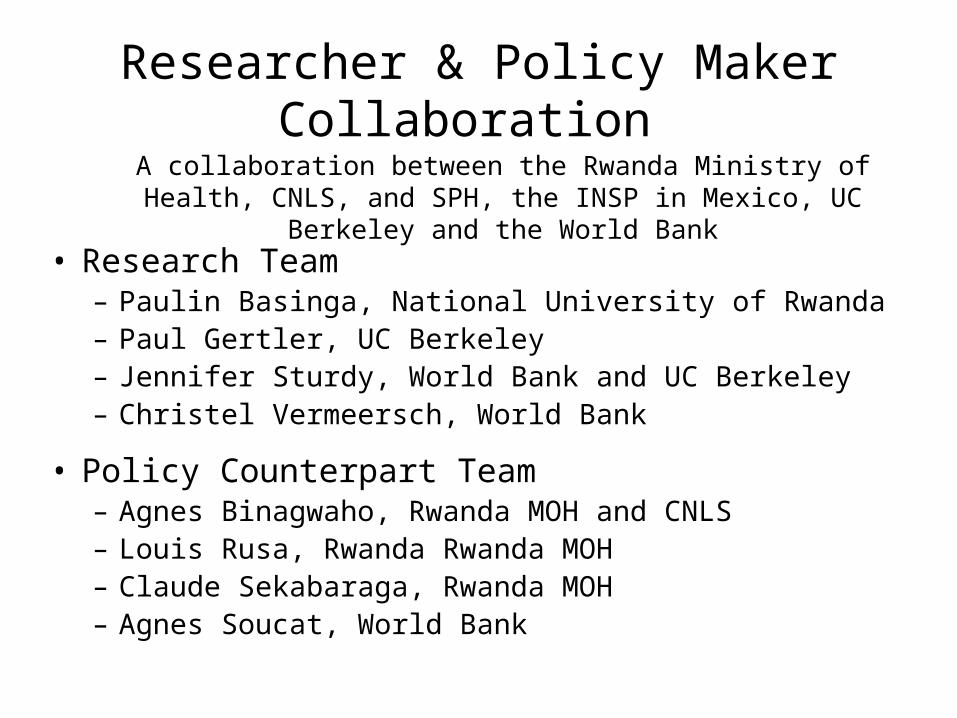
Researcher & Policy Maker Collaboration
• Research Team– Paulin Basinga, National University of Rwanda– Paul Gertler, UC Berkeley– Jennifer Sturdy, World Bank and UC Berkeley– Christel Vermeersch, World Bank
• Policy Counterpart Team– Agnes Binagwaho, Rwanda MOH and CNLS– Louis Rusa, Rwanda Rwanda MOH– Claude Sekabaraga, Rwanda MOH– Agnes Soucat, World Bank
A collaboration between the Rwanda Ministry of Health, CNLS, and SPH, the INSP in Mexico, UC Berkeley and the
World Bank
Evaluation Questions: Did PBF…
– Increase the quantity of contracted maternal health services delivered?
– Improve the quality of contracted maternal health services provided?
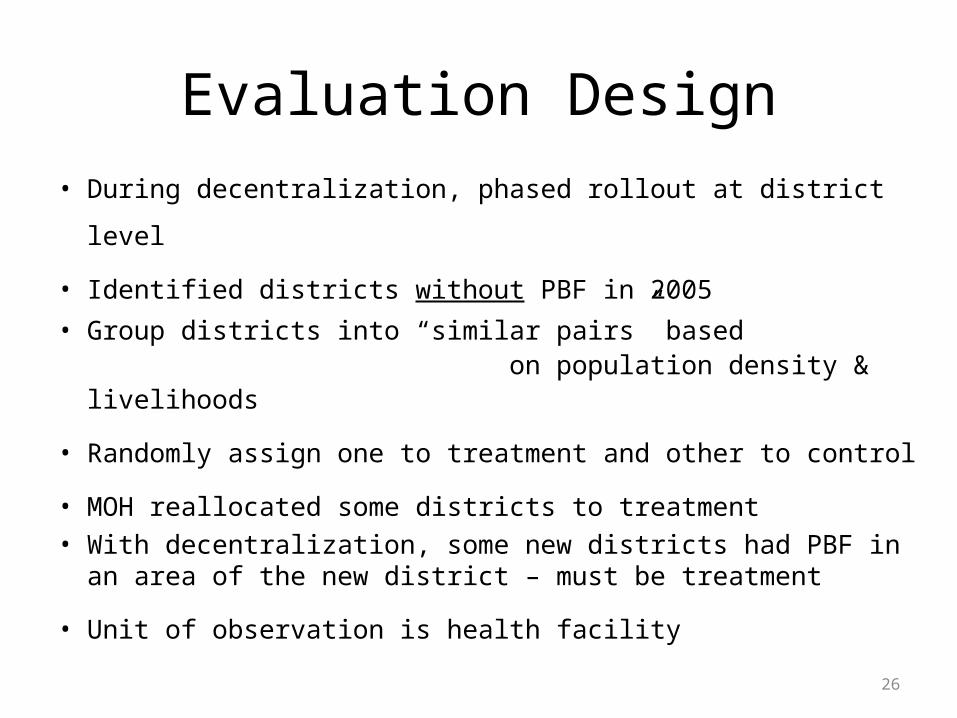
Evaluation Design
• During decentralization, phased rollout at district level
• Identified districts without PBF in 2005• Group districts into “similar pairs” based
on population density & livelihoods
• Randomly assign one to treatment and other to control
• MOH reallocated some districts to treatment• With decentralization, some new districts had PBF in an area of
the new district – must be treatment
• Unit of observation is health facility26
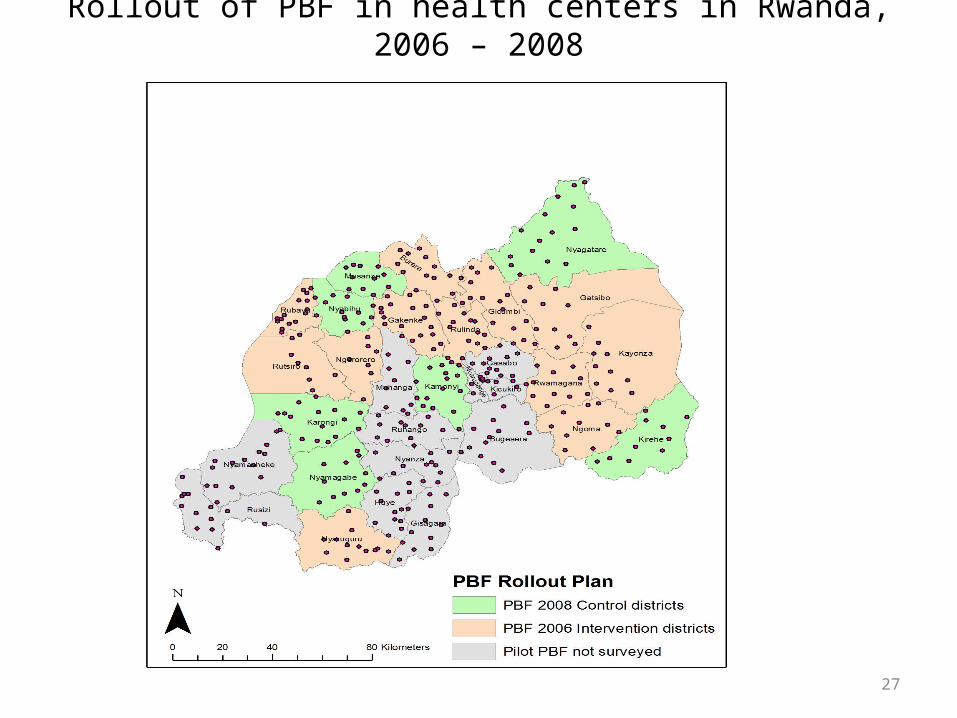
Rollout of PBF in health centers in Rwanda, 2006 – 2008
27
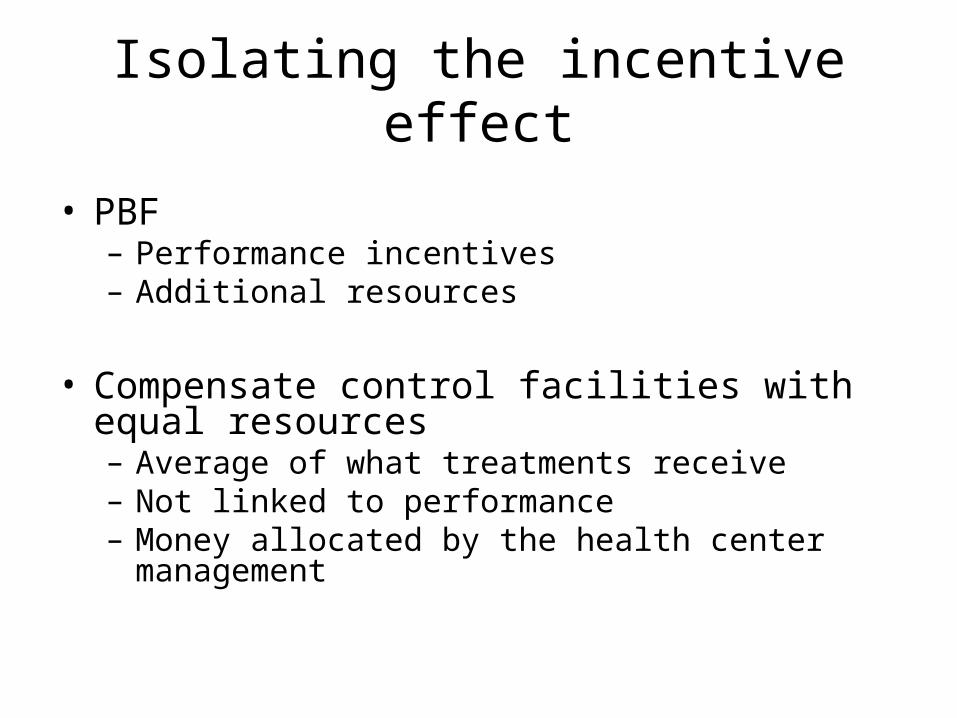
Isolating the incentive effect
• PBF – Performance incentives– Additional resources
• Compensate control facilities with equal resources– Average of what treatments receive– Not linked to performance– Money allocated by the health center management
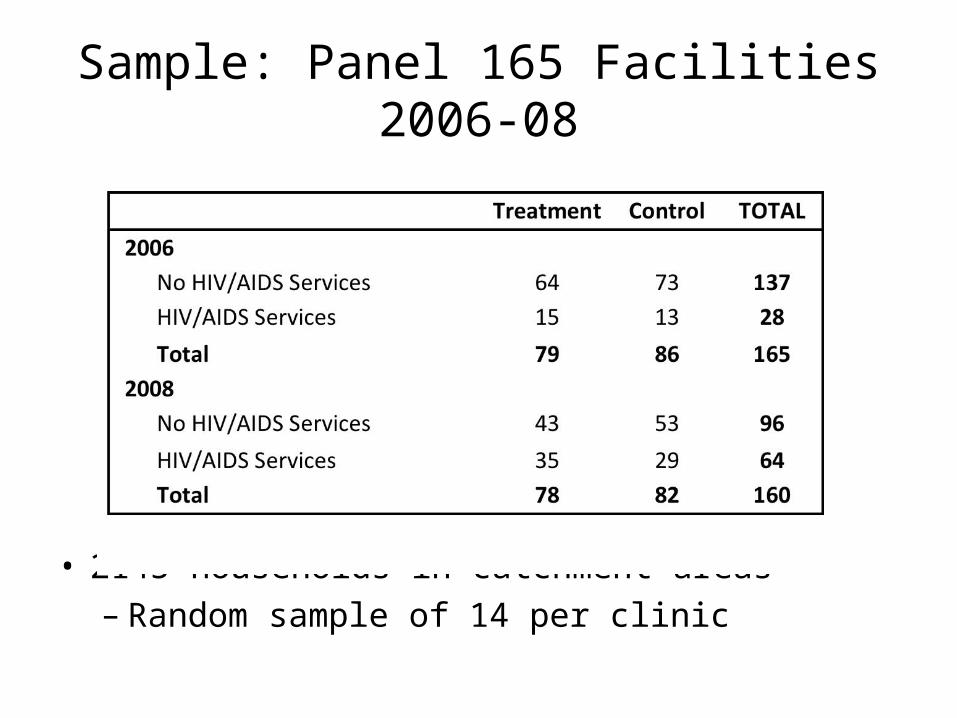
Sample: Panel 165 Facilities 2006-08
• 2145 households in catchment areas– Random sample of 14 per clinic
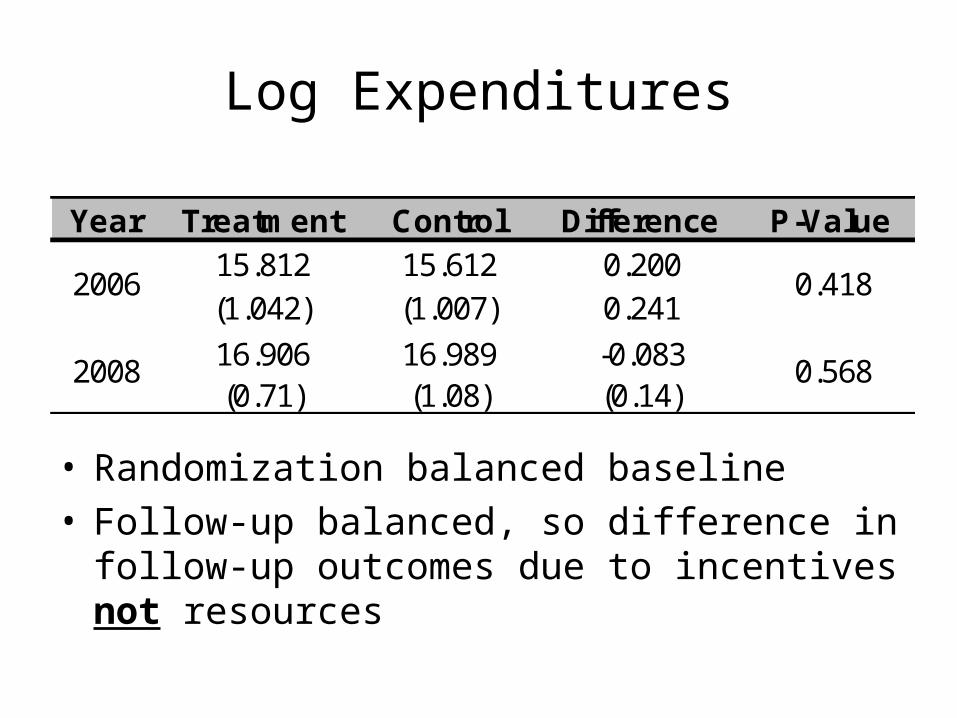
Log Expenditures
• Randomization balanced baseline • Follow-up balanced, so difference in follow-up
outcomes due to incentives not resources
Year Treatment Control Difference P-Value15.812 15.612 0.200(1.042) (1.007) 0.241
16.906 16.989 -0.083(0.71) (1.08) (0.14)
2006 0.418
2008 0.568
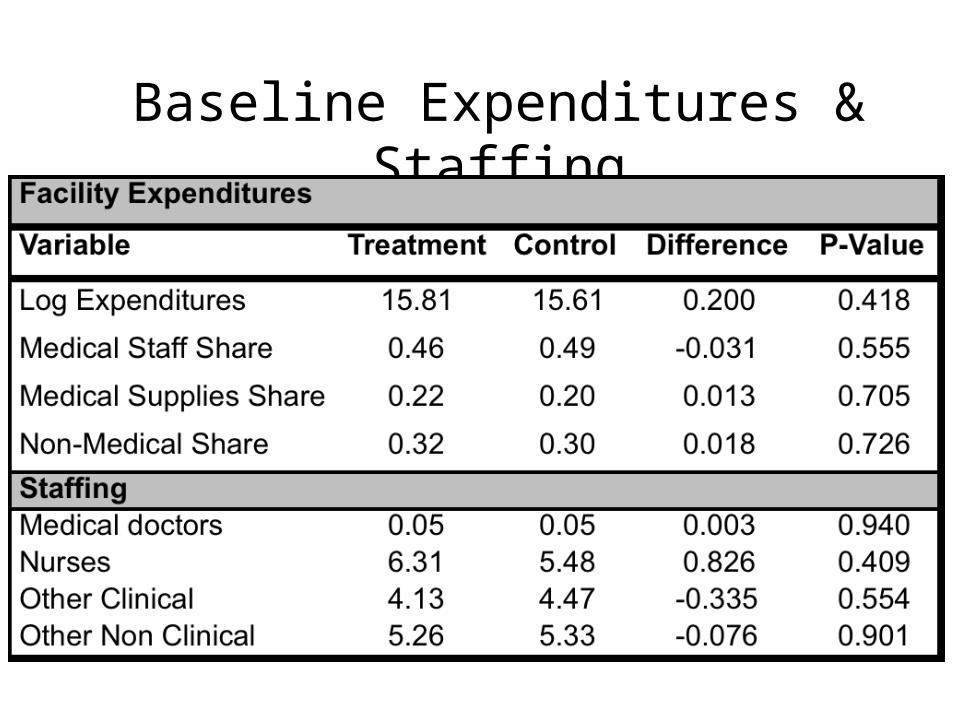
Baseline Expenditures & Staffing
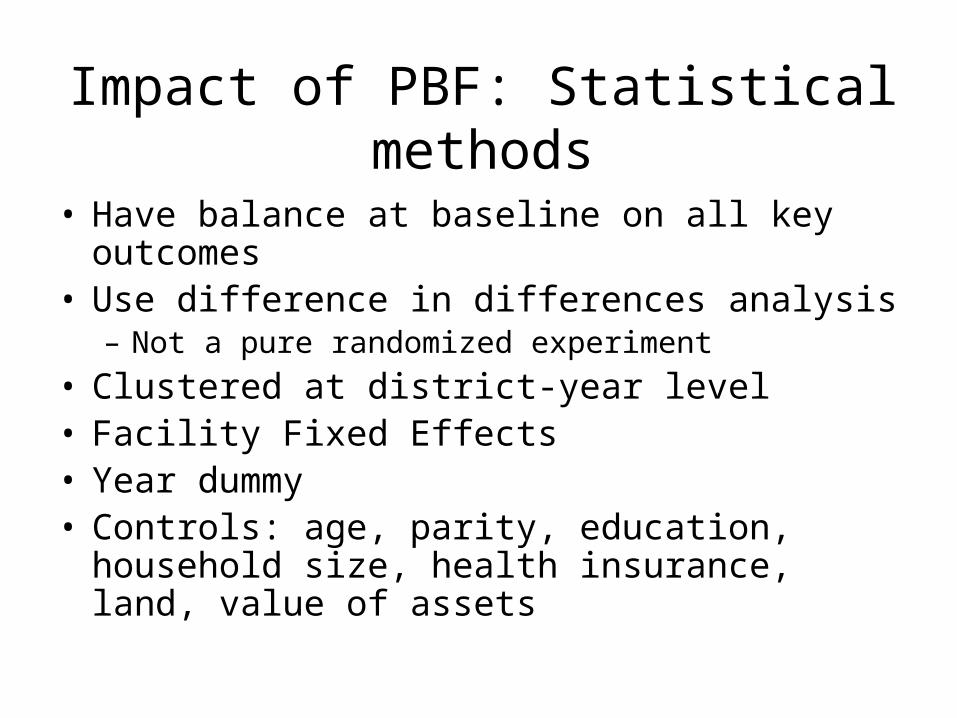
Impact of PBF: Statistical methods
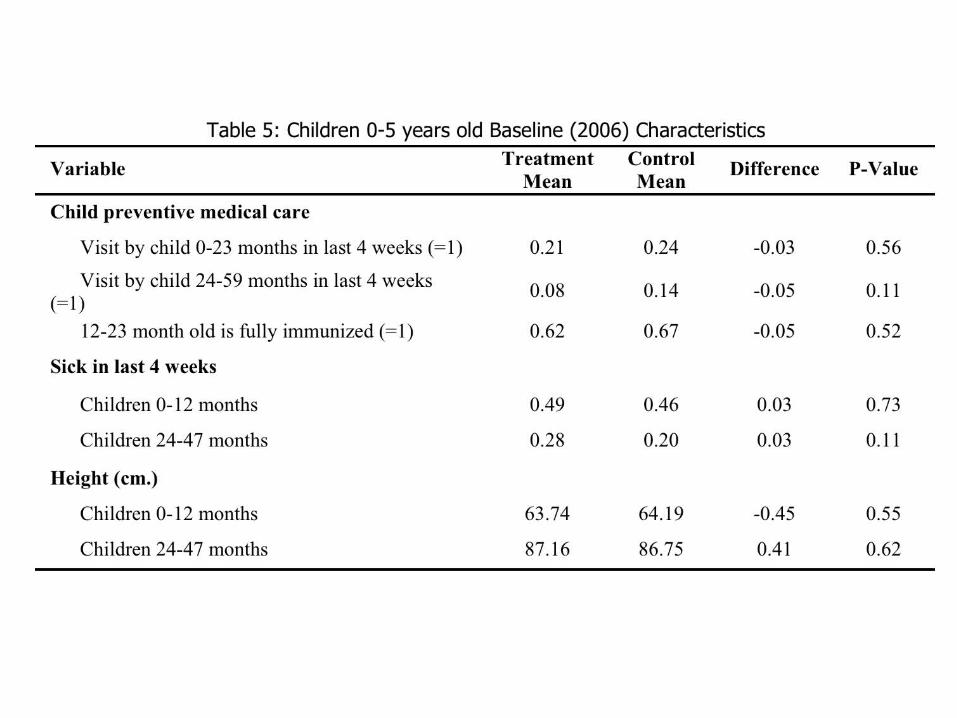
• Have balance at baseline on all key outcomes• Use difference in differences analysis
– Not a pure randomized experiment
• Clustered at district-year level• Facility Fixed Effects• Year dummy• Controls: age, parity, education, household size,
health insurance, land, value of assets
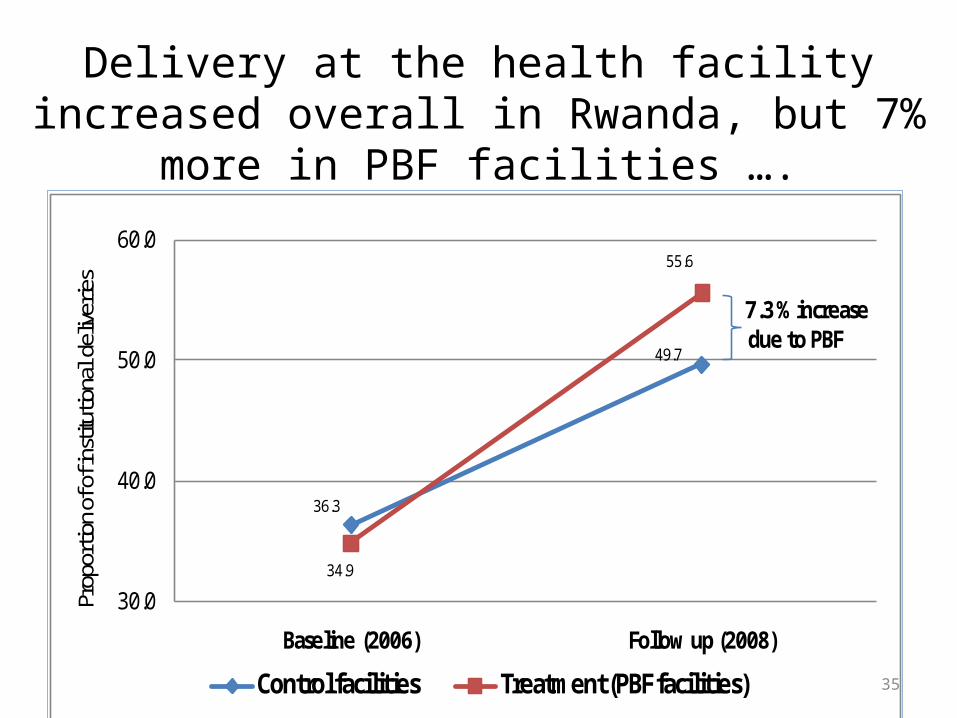
36.3
49.7
34.9
55.6
30.0
40.0
50.0
60.0
Baseline (2006) Follow up (2008)
Prop
ortio
n of o
f ins
tituti
onal
deliv
erie
s
Control facilities Treatment (PBF facilities)
7.3 % increasedue to PBF
35
Delivery at the health facility increased overall in Rwanda, but 7% more in PBF facilities ….
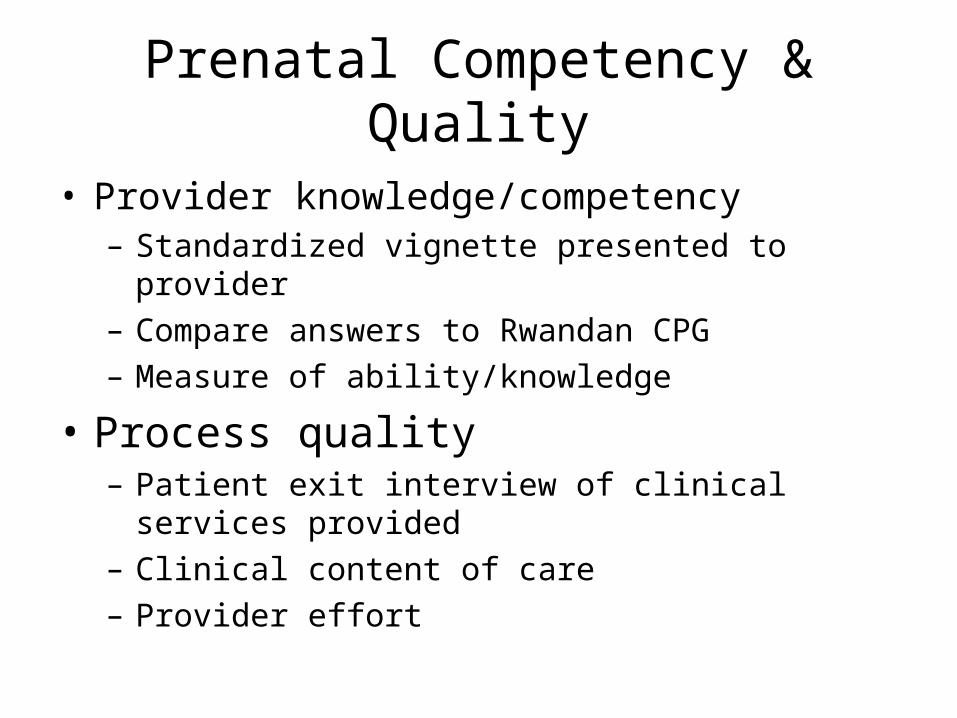
Prenatal Competency & Quality
• Provider knowledge/competency– Standardized vignette presented to provider– Compare answers to Rwandan CPG– Measure of ability/knowledge
• Process quality – Patient exit interview of clinical services provided– Clinical content of care– Provider effort
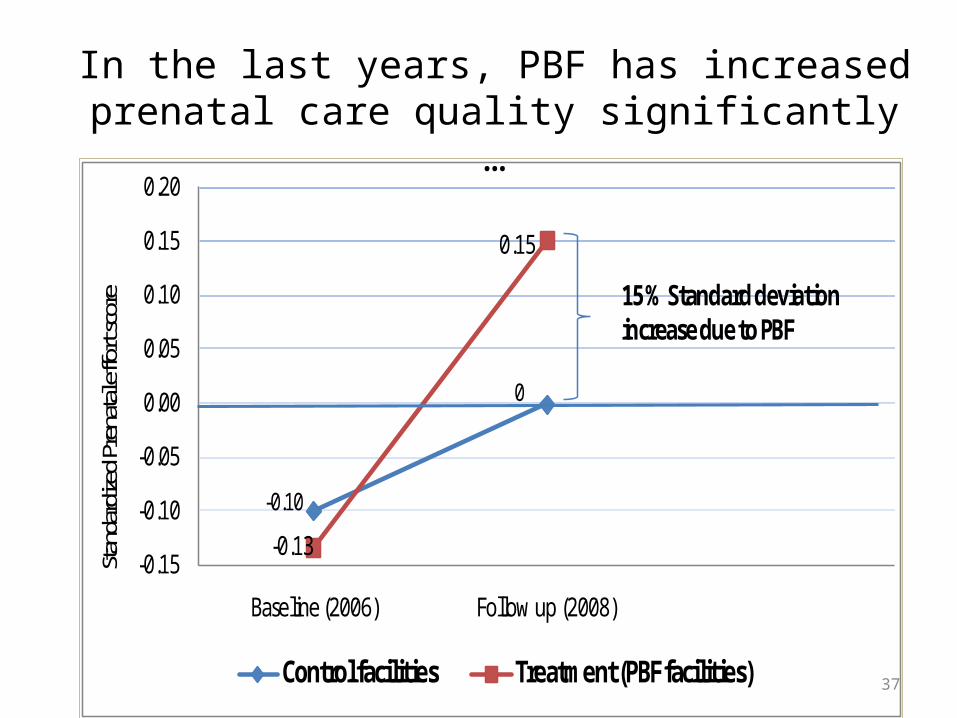
-0.10
0
-0.13
0.15
-0.15
-0.10
-0.05
0.00
0.05
0.10
0.15
0.20
Baseline (2006) Follow up (2008)
Stand
ardiz
ed Pr
enata
l effo
rt sc
ore
Control facilities Treatment (PBF facilities)
15 % Standard deviation increase due to PBF
37
In the last years, PBF has increased prenatal care quality significantly …
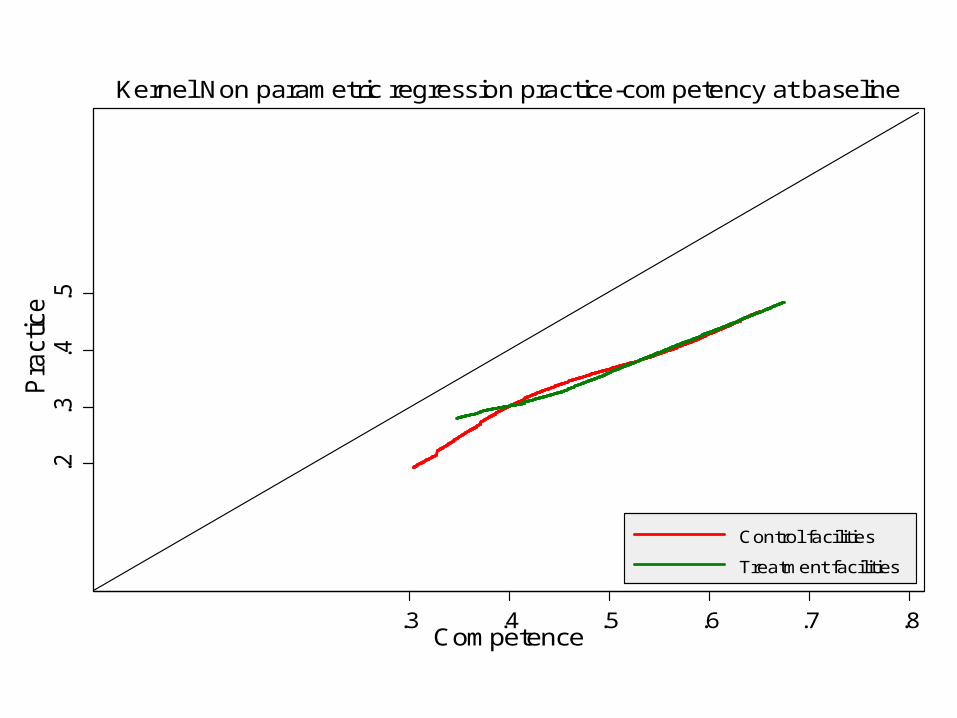
.2.3
.4.5
Pra
ctic
e
.3 .4 .5 .6 .7 .8Competence
Control facilities
Treatment facilities
Kernel Non parametric regression practice-competency at baseline
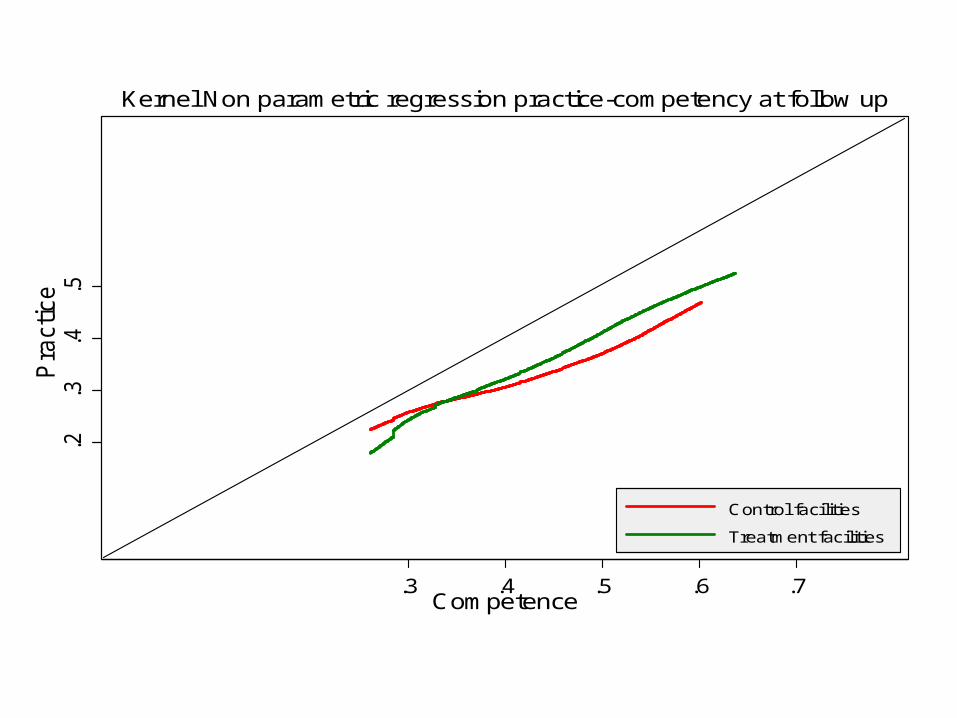
.2.3
.4.5
Pra
ctice
.3 .4 .5 .6 .7Competence
Control facilities
Treatment facilities
Kernel Non parametric regression practice-competency at follow up
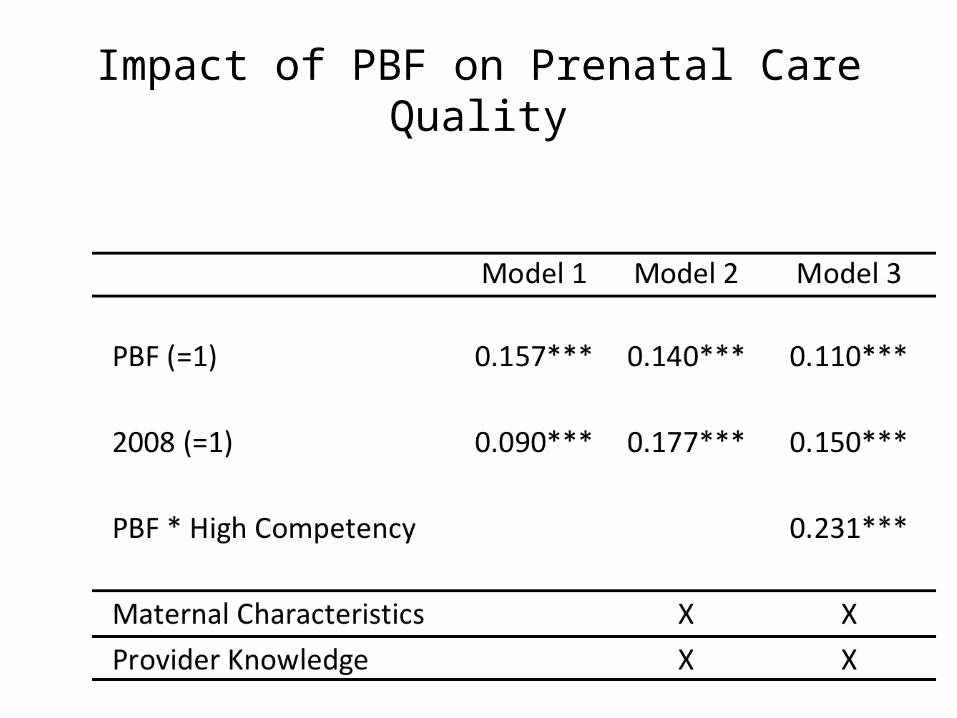
Impact of PBF on Prenatal Care Quality
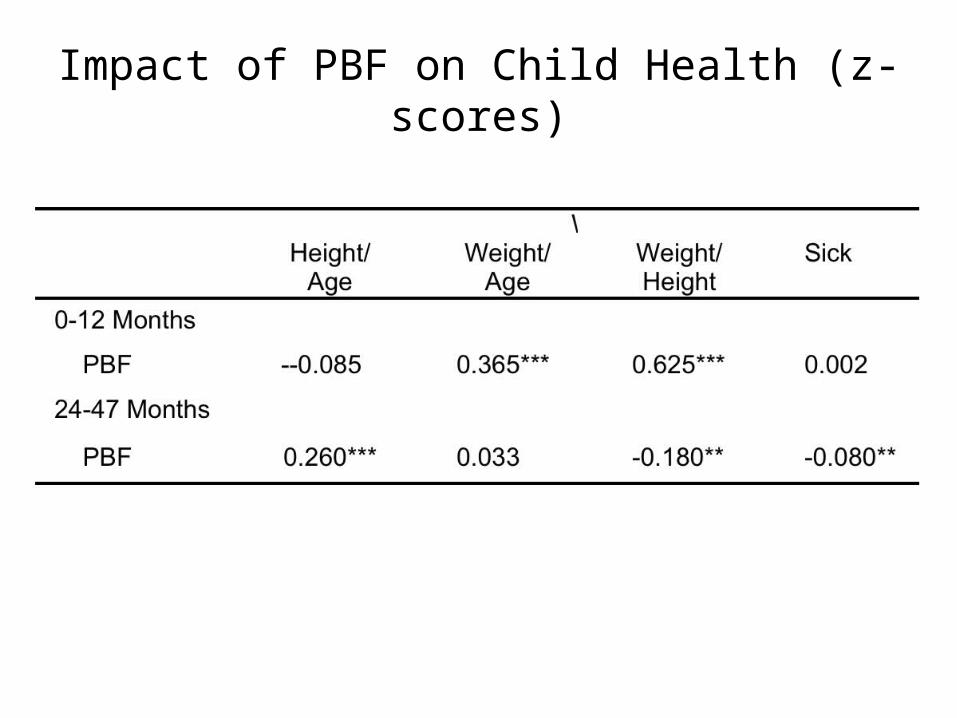
Impact of PBF on Child Health (z-scores)
Results Summary
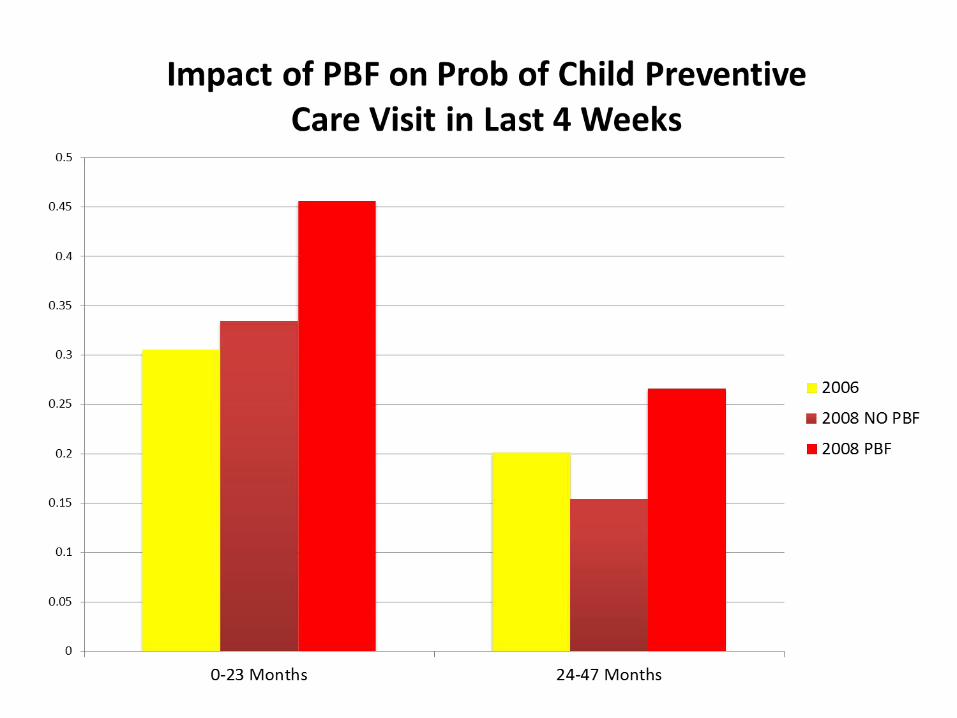
• Balanced at baseline• Expenditures same, so isolate incentives• Impact on utilization
– Delivery & Child prevention, but not prenatal
• Impact on prenatal quality– Bigger for better doctors
• Reduced child morbidity & Taller children• Effect sizes bigger than
most other interventions
Discussion• PBF Effect seen despite many other national level
intervention: possible bigger effect in other countries
• Increase in utilization in country with national campaigns:– Mutuelle– Imihigo– HIV services– Safe motherhood and PCIME
• Possible spill over effect to child health
45
Discussions/ Policy implications
• You get what you pay for !
• Returns to effort important– Bigger effects in things more in provider’s control– Patient or community health workers for prenatal
care/Immunization• Provide incentives directly to pregnant women? (conditional
cash transfer program).• Financial incentive to community health workers • Low quality of care : additional training coupled with PBF
• Need to get prices “right”• Evaluation feedback useful
46
Limitations• The original randomized designed was
changed due to the political decentralization process: But sample well balanced!
• Trend analysis with HMIS data ongoing• No measure of all paid and some non paid
indicators : HMIS analysis• Cost effectiveness analysis
47
Acknowledgments
• Funding by:– World Bank– Government of Rwanda (PHRD grant)– Bank-Netherlands Partnership Program (BNPP)– ESRC/DFID– GDN


