32
Performance-based Standards (PbS) for Youth Correction and Detention Facilities: A System for Continuous Improvement NDTAC Webinar Thurs, July 21, 2005
| Date post: | 18-Dec-2015 |
| Category: |
Documents |
| Upload: | posy-jones |
| View: | 220 times |
| Download: | 0 times |

Performance-based Standards (PbS) for Youth Correction and Detention Facilities:
A System for Continuous ImprovementNDTAC Webinar
Thurs, July 21, 2005

PbS: Measuring performance to improve
Ned Loughran, Executive Director, Council of Juvenile Correctional Administrators (CJCA)
CJCA National non-profit organization dedicated to improvement
of youth correctional services, incorporated in 1994 Unites nation’s youth correctional CEOs to promote
leadership for juvenile justice Projects: New Directors Seminar, MacArthur Foundation
Model Systems Project, OJJDP Mental Health Model Committed to expanding the adoption of PbS as a best
practice to improve conditions of confinement

Presentation Overview
How PbS was developed The scope of PbS: Standards and Outcomes How PbS works Examples
www.pbstandards.org for more information

History of Juvenile Justice
First court 100 years ago Goal to treat children differently from adults to
recognize differences in development, capabilities Pendulum swing: punishment, rehabilitation Most recently: transfer laws, building new facilities Influx of youths with mental health problems, rise in
female offender population

The cycle of juvenile institutions
Since the opening of the first facility in 1846, the institution has been the program of choice for juvenile offenders
Institutions have cyclical lives: initial calm; overcrowding due to crackdown on crime; deterioration and violence; media event; government investigation; Blue Ribbon Commission; reforms and back to calm.
PbS is a cycle that breaks the cycle.

Before PbS
We’ve counted facilities and youths: Census of Juveniles in Residential Placement
counts facilities and number of youths within the facilities annually
Most recent report: 2,980 facilities (1,197 public, 1,774 private, and 9 tribal facilities) that held 104,413 residents (82%) that met all the inclusion criteria for the census: Younger than 21. Charged with an offense or court-adjudicated for an
offense. In residential placement because of that offense.

We didn’t measure performance
What went on behind razor wire fences was ignored, unknown and largely avoided; public perception formed by press, horrific incident, “super predators” label
Existing standards and accreditation were: Process and policy-based; didn’t measure
performance Pass / fail Three-year cycle Not about improvement
Data usually meant someone was about sue! Recidivism not accurate measure of effectiveness

1994 Conditions of Confinement Study
About 1,000 secure facilities and found “substantial and widespread deficiencies:” High rates of youths and staff getting hurt High rates of suicidal behavior Few timely or professional health screenings High levels of staff turnover Adherence to existing standards did not mean
“better” facility

1995: PbS launched to address COC problems
OJJDP selected the Council of Juvenile Correctional Administrators (CJCA) to direct and develop the project
Guiding principals – First key to sustaining success: Set standards at highest level of performance, not
minimums Facilities should be places we’d feel comfortable
sending our own children Gradually transfer knowledge, skills and ownership of
PbS from project to field Field driven to be meaningful and useful: feedback Start with all stakeholders, related agencies at the table Create meaningful and user-friendly performance
measures

Development Process
Inclusive, comprehensive and a loop for feedback Advisory Board of representatives from 10 major
organizations set the framework, goals and standards
Working group on each function area: Safety, Order, Security, Health/Mental Health, Programming, Justice, and Reintegration; comprised of experts, practitioners, researchers – developed outcome measures to indicate performance related to standards
Pilot, revise, field test – feedback loop

Struggle: Performance outcomes vs. process indicators
Difficult to avoid process creep You are what you count Count only what you report Report everything back to users Some things cannot be translated into numbers –
you need people Processes, policies are a foundation but do not
demonstrate effectiveness Outcomes are measures, outcomes don’t “measure”
they are the consequence of activities

Performance outcomes - examples
Rates of injuries as indication of level of safety Percentage of youths improving math and reading
scores from pre-test to post-test indicating effectiveness of education program
Number of instances youths placed in isolation and average duration to describe behavior management system and sense of order
Interview youths and staff to ask about perception of safety reported as percentages who report fear describe quality of life for youths and staff

Keys to successful development of national standards and performance outcomes:
Include all major stakeholders from the beginning -Guiding principals established and adopted from the outset; keep advisors informed.
Listen to the users/ field – Build structure to collect continual feedback from field and use it to make revisions; when they see you’re listening, encouraged to adopt.
Take advantage of technology – Worth any early resistance, fear and training investment.
Provide in-person technical assistance as much as possible – PbS site consultants and two full-time staff answering calls, emails; no one implementing is alone, stuck
Work to meet needs of users/ field – not just drop standards on them and leave.

The innovation of PbS:
For the first time, staff, managers and directors know from data what is going on in facilities and how they perform compared with national standards and other facilities
PbS provides the facilities and agencies with a picture of their performance in the context of improvement, with: Tools, easy-to-read bar graph reports to identify the
good and not-so-good; A roadmap of practices and ways to improve and Monitoring over time to demonstrate accountability and
effectiveness through changing performance outcomes

Project Elements
• A set of seven goals and 27 standards to assess:• Safety• Order• Security• Health and mental health• Programming • Justice • Reintegration
Performance toward meeting each standard is measured using one or more outcome measures, which are compared over time and to other participating facilities.

Example: Safety
Goal: To engage in management practices that promote the safety and well-being of staff and youths.
Standards: Protect youth and staff from intentional and accidental
injuries Promote management practices and behavior that
minimize harm resulting form the use of restraints, isolation and environmental risks;
Protect youth and staff from fear. Outcome Measures: Number of injuries to youths; number of
injuries to youths by other youths; incidents of suicidal behavior with and without injury by youths; percent of youths and staff reporting that they fear for their safety.

Outcome report: Injuries to youths by other youths
Injuries over time per 100 youth- days:
Facility high of 5 in October 2003;
3 in October 2004
All well below field average

Example: Order Goal: To establish clear expectations of behavior and an
accompanying system of accountability for youths and staff that promote mutual respect, self discipline and order.
Standards: Maximize responsible behavior by youth and staff and
conformance to facility rules; Minimize the facility’s use of restrictive and coercive means of
responding to disorder; Maximize opportunities for youths to participate in activities
and programs. Outcome Measures: Incidents of youth misconduct; use of
physical restraint; use of mechanical restraint; use of isolation or room confinement and; average duration of isolation or room confinement.

Outcome report: Physical restraint use
Physical restraints over time per 100 youth- days:
Facility high of 12 in October 2000;
2 in October 2004
All well below field average

Measuring performance
PbS outcome measures adhere to definition of performance outcomes as rates, frequencies, numbers that show change in status, occurrence or prevalence
PbS outcomes are measured twice a year to reflect change from one data collection period to the next
PbS reports performance to users in many ways: performance over time, in comparison to the field average of other participating facilities, performance on outcomes targeted for improvement and outcomes critical to safe and effective operations

Demonstrating performance: The PbS continuous improvement cycle:

Data Collection
PbS Sustained Improvement
Administrative Form 1 per site, 46 questions
Incident Reports All incident reports for data
collection period
Youth Record 30 random YR, 93 questions
Youth Climate Survey 30 random youths, 38 questions
Staff Climate Survey 30 random staff, 38 questions
Youth Exit Interview All youths released since last data
collection, 24 questions Ongoing data entry

Site Reports
Divided Between Areas: Safety, Order, Security,
Health/ Mental Health, Programming, Reintegration
Corrections: 105 outcomes
Detention: 59 outcomes
Field Averages
PbS Sustained Improvement

Components of a Sites FIP FIP Status Targeted Outcome
Measures What is the
problem? Action Steps Progress Notes Ongoing Review
Facility Improvement Plans
PbS Sustained Improvement
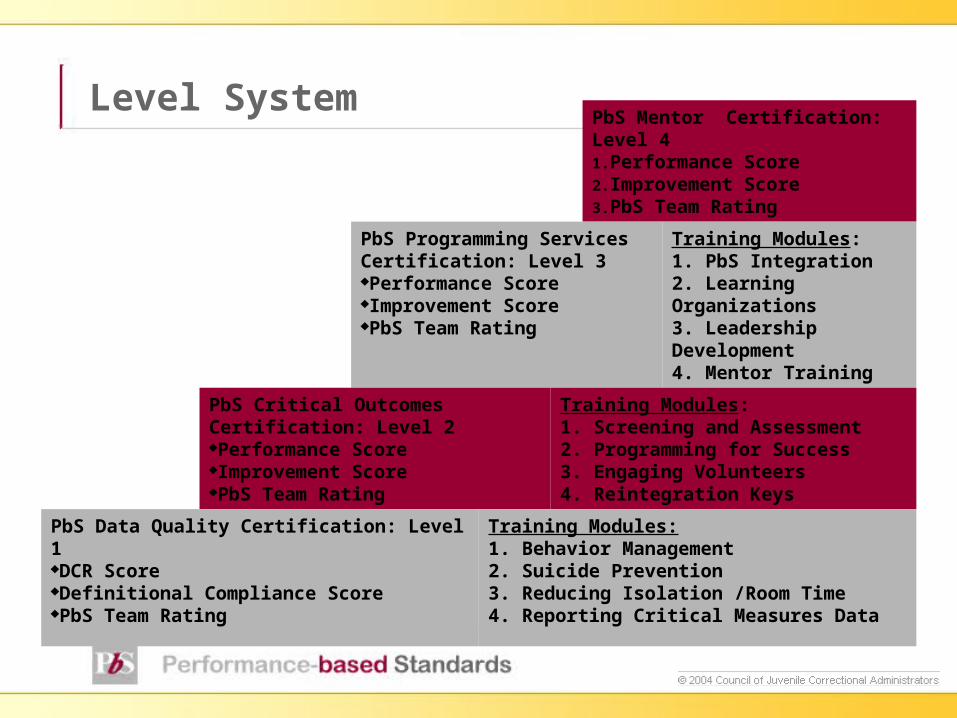
Level SystemPbS Mentor Certification: Level 41.Performance Score2.Improvement Score3.PbS Team Rating
PbS Programming Services Certification: Level 3Performance ScoreImprovement ScorePbS Team Rating
Training Modules:1. PbS Integration2. Learning Organizations3. Leadership Development4. Mentor Training
PbS Critical Outcomes Certification: Level 2Performance ScoreImprovement ScorePbS Team Rating
Training Modules:1. Screening and Assessment2. Programming for Success3. Engaging Volunteers4. Reintegration Keys
PbS Data Quality Certification: Level 1DCR ScoreDefinitional Compliance ScorePbS Team Rating
Training Modules:1. Behavior Management 2. Suicide Prevention3. Reducing Isolation /Room Time4. Reporting Critical Measures Data

Critical Outcome Measures
31 Outcome Measures distributed over areas of Safety Security, Order and Health and Mental Health
Deal with issues of staff and youth injuries, suicidal behavior, abuse, neglect, restraints, assaults, fear for safety, confinement, contraband, health and mental health screenings
Available as a report for each site
Area Critical Outcome Measures
Safety 12 Safety:1,2,3,4,5,6,7,10,11,12,13, 14
Order 9 Order:1,3,4,7,8,9,10,11,12
Security 3 Security:1,3,4
Health 7 Health:1,3,4,5,6,7,8
Totals 31

Example: Overuse of isolation in NJ
New juvenile agency based on adult model New director looking to improve performance PbS report gave him the data and information on
what needs to be improved Average time in isolation “off the page” Decided to institute change, worked with unions,
rewrote regulations, designed staff training Outcome measure: average time spent in isolation Changes over time:
257 hours October 2002 to 29.2 hours October 2004; working to eliminate

Order 9: Average Duration of ConfinementCorrections compared to Detention Field Average
AAverage duration of isolation, room confinement and SMU unit use per 100 youth-days

Order 9: Average Duration of ConfinementNew Jersey Training School
Average duration of isolation, room confinement and SMU unit use per 100 youth-daysFacility high of 100.9 hours in October 2002October 2004 average 26.5 hours

Order 9: Average Duration of Confinement New Jersey Juvenile Medium Secure Facility
Average duration of isolation, room confinement and SMU unit use per 100 youth-daysFacility high of 257 hours in October 2002October 2004 average 26.5 hours

Order 9: Average Duration of Confinement New Jersey Female Secure and Intake Facility
Average duration of isolation, room confinement and SMU unit use per 100 youth-daysFacility high of 61.9 hours in October 2002October 2004 average 26.5 hours


