24
PERFORMANCE CHARACTERIZATION OF MICROSOFT SQL SERVER ON VMWARE vSPHERE 6.5 PERFORMANCE STUDY – OCTOBER 2017
PERFORMANCE CHARACTERIZATION OF MICROSOFT SQL SERVER ON VMWARE vSPHERE 6.5
PERFORMANCE STUDY – OCTOBER 2017

PERFORMANCE CHARACTERIZATION OF MICROSOFT SQL SERVER
ON VMWARE VSPHERE 6.5
P E R F O R M A N C E S T U D Y | 2
Table of Contents
Executive Summary ..........................................................................................................................................................................3 Introduction ........................................................................................................................................................................................3 Test Environment ..............................................................................................................................................................................3
Testbed Configuration................................................................................................................................................................................... 4 Host Processor Architecture / VM vCPU Sizing ................................................................................................................................ 4 Cores per Socket ............................................................................................................................................................................................. 5 OS and SQL Server Installation/Tuning ................................................................................................................................................. 5 DVD Store 3 Benchmark .............................................................................................................................................................................. 6
Generational Performance/Power Comparison ....................................................................................................................... 6 Host Power Management Policies ............................................................................................................................................... 8 VMFS vs. RDM .................................................................................................................................................................................. 10 Latency Sensitivity .......................................................................................................................................................................... 11 Best Practices .................................................................................................................................................................................. 13 Conclusion ........................................................................................................................................................................................ 16 Appendix A ....................................................................................................................................................................................... 17 References ....................................................................................................................................................................................... 22
PERFORMANCE CHARACTERIZATION OF MICROSOFT SQL SERVER
ON VMWARE VSPHERE 6.5
P E R F O R M A N C E S T U D Y | 3
Executive Summary VMware vSphere® 6.5 continues to increase the maximum sizes supported for both physical hosts (576 logical CPUs and 12TB of RAM) and virtual machines (128 virtual CPUs and 6TB of RAM) [1]. In this paper, an online transaction processing (OLTP) benchmark, DVD Store 3, was used to characterize performance and power across five generations of 4-socket Intel EX servers hosting “monster”-sized Microsoft SQL Server® 2016 database VMs. The results show vSphere is capable of fully utilizing current generation server and storage technology, achieving great database performance.
Introduction VMware vSphere provides an ideal platform for business-critical applications, including databases, ERP systems, email servers, and emerging technologies such as Hadoop. A full discussion of the benefits is included in the whitepaper “Virtualizing Business-Critical Applications on vSphere [2].”
A business-critical application that is often run on vSphere today is Microsoft SQL Server, which is “one of the most widely deployed database platforms in the world, with many organizations having dozens or even hundreds of instances deployed in their environments [2].” Consolidating these deployments onto modern multi-socket, multi-core, multi-threaded server hardware as virtual machines on vSphere is an effective solution.
Achieving optimal SQL Server performance on vSphere has been a constant focus for VMware. Performance whitepapers with SQL Server using vSphere 5.5 and 6.0 were published and showed excellent performance up to the maximum VM size supported at the time [3]. This study right-sizes the VMs as in the past with a similar benchmarking methodology, but with an updated hypervisor (vSphere 6.5), benchmark (DVD Store 3), and CPUs (Intel® Xeon® Scalable processors with 28 cores per socket, codenamed Skylake).
The new tests show large SQL Server databases continue to run extremely efficiently, achieving great performance on vSphere 6.5. Following VMware and SQL Server best practices were all that was necessary to achieve this scalability.
In addition to performance, power consumption was measured on each ESXi host. This allowed for a comparison of Host Power Management (HPM) policies within vSphere, performance per watt of each host, and power draw under stress versus idle.
Additionally, this new study compares a virtual file–based disk (VMDK) on VMware’s native Virtual Machine File System (VMFS 5) to a physical Raw Device Mapping (RDM). This test was conducted for two reasons: first, it has been several years since they were compared; and second, customer feedback at VMworld indicates this is still a debate that comes up in IT shops, particularly with regard to deploying database workloads such as SQL Server and Oracle.
Finally, experiments were conducted with the advanced Latency Sensitivity setting offered by vSphere.
Test Environment A benchmark testbed was assembled with sufficient compute, storage, and networking hardware to test the performance of large SQL Server database VMs. Large databases were created within these “monster VMs,” and the open-source DVD Store 3 workload was used to measure the aggregate throughput, which was measured in orders per minute (OPM).
PERFORMANCE CHARACTERIZATION OF MICROSOFT SQL SERVER
ON VMWARE VSPHERE 6.5
P E R F O R M A N C E S T U D Y | 4
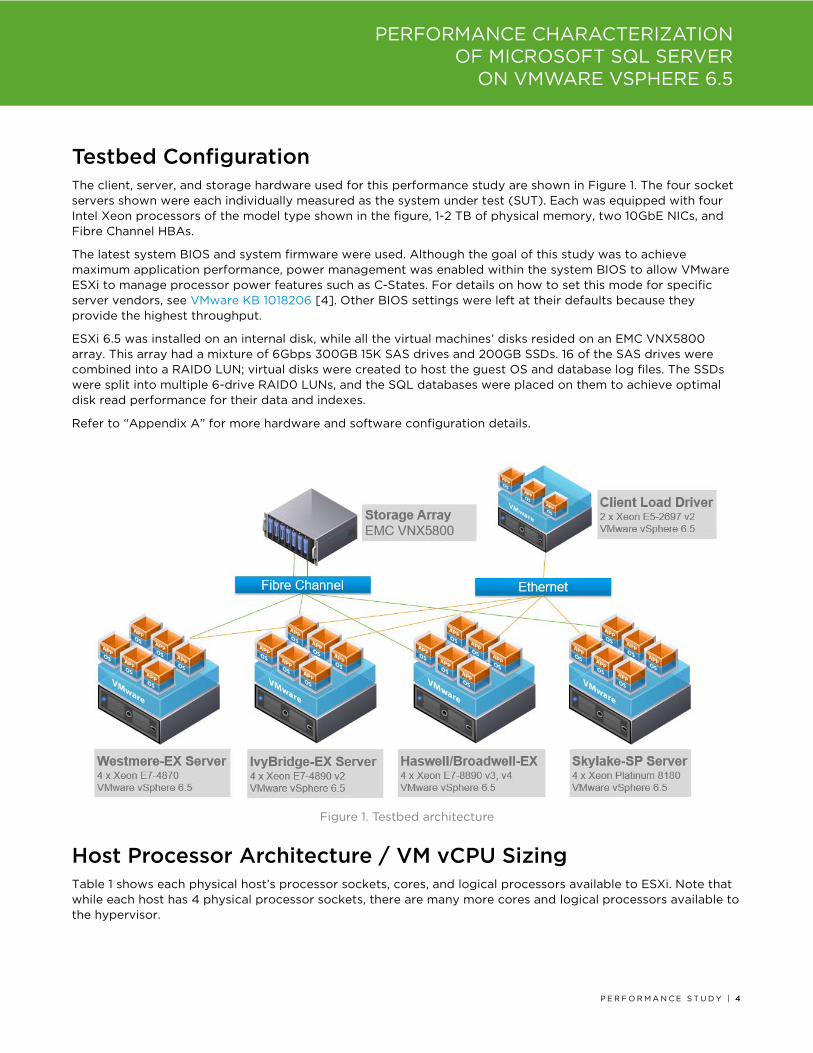
Testbed Configuration The client, server, and storage hardware used for this performance study are shown in Figure 1. The four socket servers shown were each individually measured as the system under test (SUT). Each was equipped with four Intel Xeon processors of the model type shown in the figure, 1-2 TB of physical memory, two 10GbE NICs, and Fibre Channel HBAs.
The latest system BIOS and system firmware were used. Although the goal of this study was to achieve maximum application performance, power management was enabled within the system BIOS to allow VMware ESXi to manage processor power features such as C-States. For details on how to set this mode for specific server vendors, see VMware KB 1018206 [4]. Other BIOS settings were left at their defaults because they provide the highest throughput.
ESXi 6.5 was installed on an internal disk, while all the virtual machines’ disks resided on an EMC VNX5800 array. This array had a mixture of 6Gbps 300GB 15K SAS drives and 200GB SSDs. 16 of the SAS drives were combined into a RAID0 LUN; virtual disks were created to host the guest OS and database log files. The SSDs were split into multiple 6-drive RAID0 LUNs, and the SQL databases were placed on them to achieve optimal disk read performance for their data and indexes.
Refer to “Appendix A” for more hardware and software configuration details.
Figure 1. Testbed architecture
Host Processor Architecture / VM vCPU Sizing Table 1 shows each physical host’s processor sockets, cores, and logical processors available to ESXi. Note that while each host has 4 physical processor sockets, there are many more cores and logical processors available to the hypervisor.

PERFORMANCE CHARACTERIZATION OF MICROSOFT SQL SERVER
ON VMWARE VSPHERE 6.5
P E R F O R M A N C E S T U D Y | 5
PROCESSORS CODENAME PHYSICAL SOCKETS
PHYSICAL CORES PER SOCKET
TOTAL PHYSICAL CORES / VM VCPU
TOTAL LOGICAL
PROCESSORS
Intel Xeon E7-4870 Westmere-EX 4 10 40 80
Intel Xeon E7-4890 v2 Ivy Bridge-EX 4 15 60 120
Intel Xeon E7-8890 v3 Haswell-EX 4 18 72 144
Intel Xeon E7-8890 v4 Broadwell-EX 4 24 96 192
Intel Xeon Platinum 8180 Skylake-SP 4 28 112 224
Table 1. Host processor architecture/VM sizing
For sizing monster SQL VMs, the recommended best practice is to base the number of virtual CPUs (vCPUs) on the total number of physical cores, not logical processors. There are several reasons:
1. While Hyper-Threading provides twice the logical processors, this does not equate to twice the performance of physical cores.
2. It allows the Hyper-Threads to serve as a resource buffer for tasks such as hypervisor scheduling, I/O, and so forth.
3. Past performance studies showed that SQL Server throughput was lower if the vCPUs were higher than the number of the physical cores of the processor architecture.
Cores per Socket In addition to specifying the right number of vCPUs, it is just as important to set the Cores per Socket setting. An example of what this looks like in the vSphere Web Client is shown below in Figure 2.
Figure 2. Virtual CPUs and Cores per Socket
In this example, we have created a 96 vCPU VM with 24 virtual Cores per Socket, to align with the physical Broadwell-EX architecture specified in Table 1. Aligning these values is crucial so the proper virtual NUMA topology is presented to Windows and SQL. For more information, see Frank Denneman’s blog article on Cores per Socket and vNUMA in vSphere 6.5 [5] and Mark Achtemichuk’s blog about rightsizing vCPUs and vNUMA [6].
OS and SQL Server Installation/Tuning ESXi 6.5 was installed on each physical host. Microsoft Windows® Server 2012 R2 was used as the guest operating system for the virtual machines and was updated using Windows Update. The operating system, SQL Server log files, and backups were stored on a 500GB virtual disk. Each virtual machine used virtual hardware
PERFORMANCE CHARACTERIZATION OF MICROSOFT SQL SERVER
ON VMWARE VSPHERE 6.5
P E R F O R M A N C E S T U D Y | 6
version 11, the latest version of VMware Tools installed, and each virtual hard disk was connected to a separate VMware Paravirtual SCSI (PVSCSI) adapter to ensure optimal throughput and lower CPU utilization [7]. The VMXNET3 virtual network adapters were used for the virtual machines as they were designed for optimal performance [8]. SQL Server 2016 Enterprise Edition was installed for each database instance, with the following features: Database Engine Services, Full-Text Search, Client Tools Connectivity, Client Tools Backwards Compatibility, Management Tools – Complete. The Database Engine was configured with Mixed Mode Authentication. The database was split across two 200GB virtual hard disks and was created based on the sqlserverds3_create_all_large2.sql script provided with the DVD Store 3 kit.
DVD Store 3 Benchmark Performance tests in this paper were undertaken using the DVD Store 3 benchmark [9]. DVD Store 3 is an open-source tool that simulates an online store that sells DVDs. It is based on DVD Store 2 and has all of the same operations, but adds customer reviews and premium memberships. These change the performance profile and make it a distinctly different workload. Due to this reason, results are not comparable to DVD Store 2. DVD Store is a key application workload in the VMmark benchmark [10]. For the tests in this study, the Web layer was bypassed so it was not a potential bottleneck, and the client load drivers could stress the database tier directly.
DVD Store 3 allows databases of any size to be created, but still supports the three standard database sizes from the previous version: small, medium, and large, as shown in Table 2.
DATABASE SIZE CUSTOMERS ORDERS PRODUCTS
Small 10 MB 20,000 1,000/month 10,000
Medium 1 GB 2,000,000 100,000/month 100,000
Large 100 GB 200,000,000 10,000,000/month 1,000,000
Table 2. DVD Store 3 database sizes
Given the goal of these tests was to stress large VMs, the large 100GB database size was selected. This size has 200 million customers, an order history of 10 million DVDs per month, and a catalog of 1 million DVDs.
Repeatability was ensured by restoring a backup of each database instance before each run. Steady state was achieved by ensuring throughput gradually increased during the 5-minute warmup period and reached/maintained steady state during each 10-minute run time. The number of driver threads, which generate DVD Store user activity, were adjusted as needed to saturate each host.
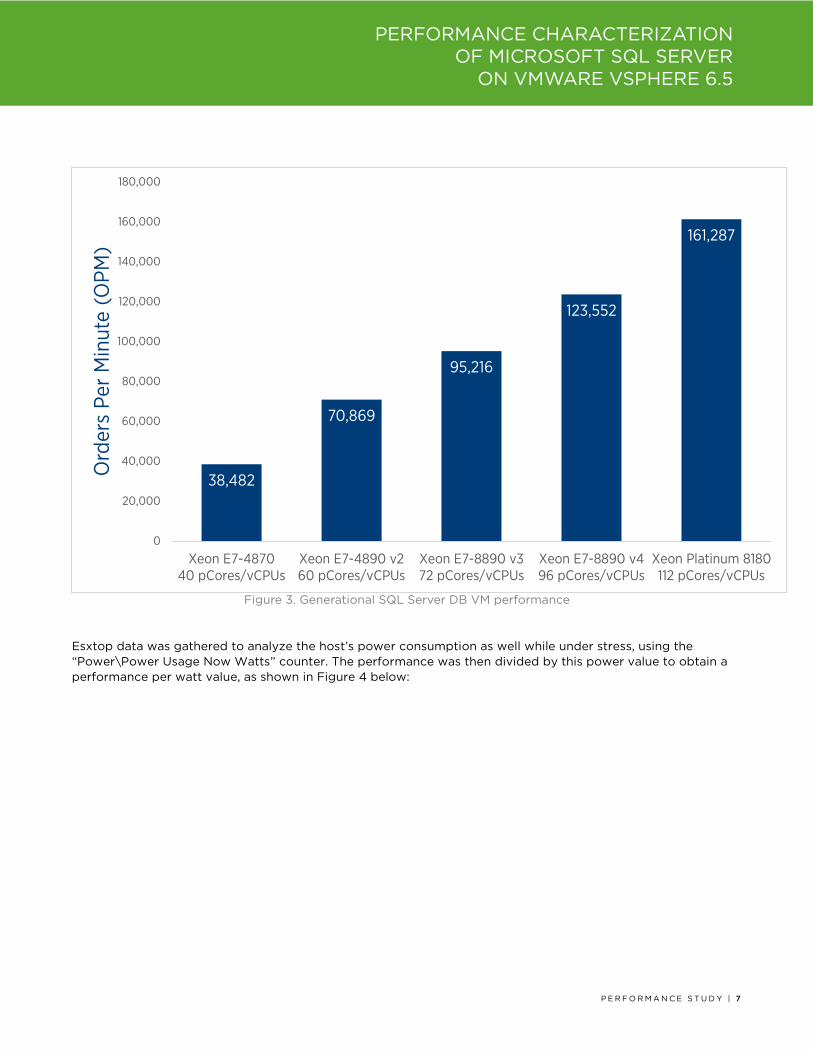
Generational Performance/Power Comparison The first test performed was a maximum throughput measurement across five generations of Intel 4-socket processors. The intent was to measure the generational performance improvement, given the increase in core counts, cache, and other processor improvements.
As shown in Figure 3 below, the database throughput increased considerably with each hardware generation. The newest generation Skylake-SP processors achieved 4.2x more OPM than the first generation Westmere-EX processors.
PERFORMANCE CHARACTERIZATION OF MICROSOFT SQL SERVER
ON VMWARE VSPHERE 6.5
P E R F O R M A N C E S T U D Y | 7
Figure 3. Generational SQL Server DB VM performance
Esxtop data was gathered to analyze the host’s power consumption as well while under stress, using the “Power\Power Usage Now Watts” counter. The performance was then divided by this power value to obtain a performance per watt value, as shown in Figure 4 below:
38,482
70,869
95,216
123,552
161,287
0
20,000
40,000
60,000
80,000
100,000
120,000
140,000
160,000
180,000
Xeon E7-487040 pCores/vCPUs
Xeon E7-4890 v260 pCores/vCPUs
Xeon E7-8890 v372 pCores/vCPUs
Xeon E7-8890 v496 pCores/vCPUs
Xeon Platinum 8180112 pCores/vCPUs
Ord
ers
Per
Min
ute
(OPM
)
PERFORMANCE CHARACTERIZATION OF MICROSOFT SQL SERVER
ON VMWARE VSPHERE 6.5
P E R F O R M A N C E S T U D Y | 8
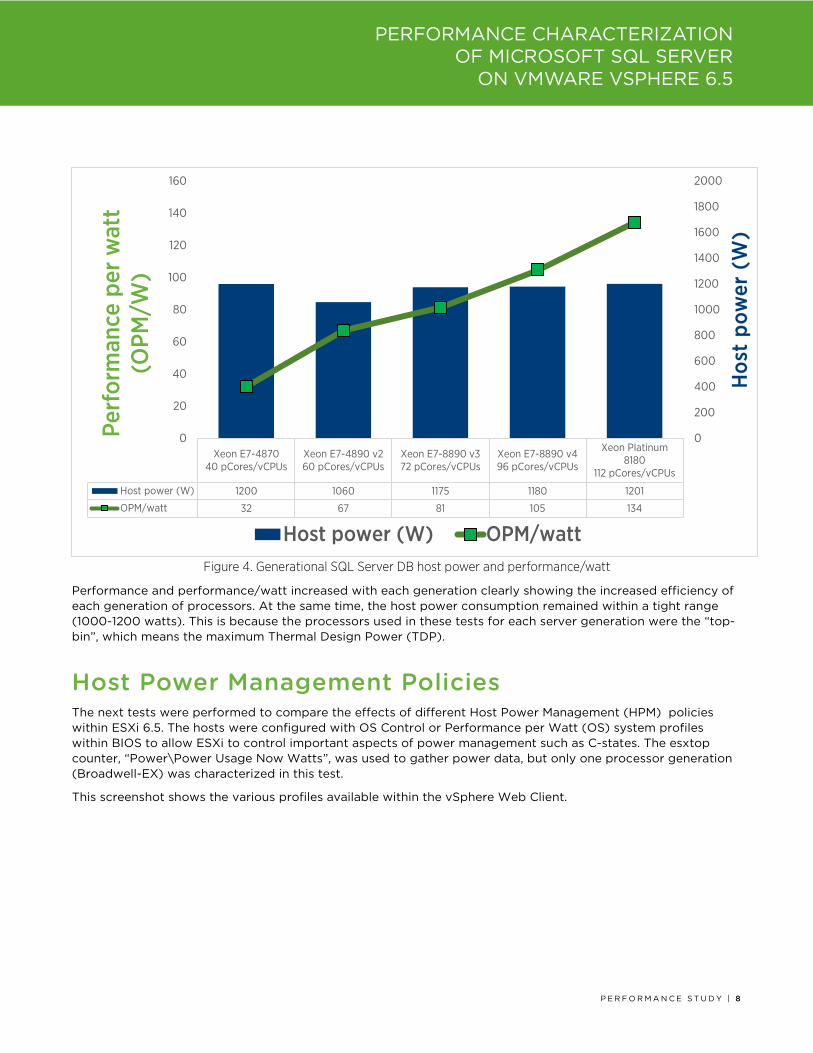
Figure 4. Generational SQL Server DB host power and performance/watt
Performance and performance/watt increased with each generation clearly showing the increased efficiency of each generation of processors. At the same time, the host power consumption remained within a tight range (1000-1200 watts). This is because the processors used in these tests for each server generation were the “top-bin”, which means the maximum Thermal Design Power (TDP).
Host Power Management Policies The next tests were performed to compare the effects of different Host Power Management (HPM) policies within ESXi 6.5. The hosts were configured with OS Control or Performance per Watt (OS) system profiles within BIOS to allow ESXi to control important aspects of power management such as C-states. The esxtop counter, “Power\Power Usage Now Watts”, was used to gather power data, but only one processor generation (Broadwell-EX) was characterized in this test.
This screenshot shows the various profiles available within the vSphere Web Client.
Xeon E7-487040 pCores/vCPUs
Xeon E7-4890 v260 pCores/vCPUs
Xeon E7-8890 v372 pCores/vCPUs
Xeon E7-8890 v496 pCores/vCPUs
Xeon Platinum8180
112 pCores/vCPUs
Host power (W) 1200 1060 1175 1180 1201
OPM/watt 32 67 81 105 134
0
20
40
60
80
100
120
140
160
0
200
400
600
800
1000
1200
1400
1600
1800
2000
Perf
orm
ance
per
wat
t (O
PM/W
)
Hos
t po
wer
(W
)
Host power (W) OPM/watt
PERFORMANCE CHARACTERIZATION OF MICROSOFT SQL SERVER
ON VMWARE VSPHERE 6.5
P E R F O R M A N C E S T U D Y | 9
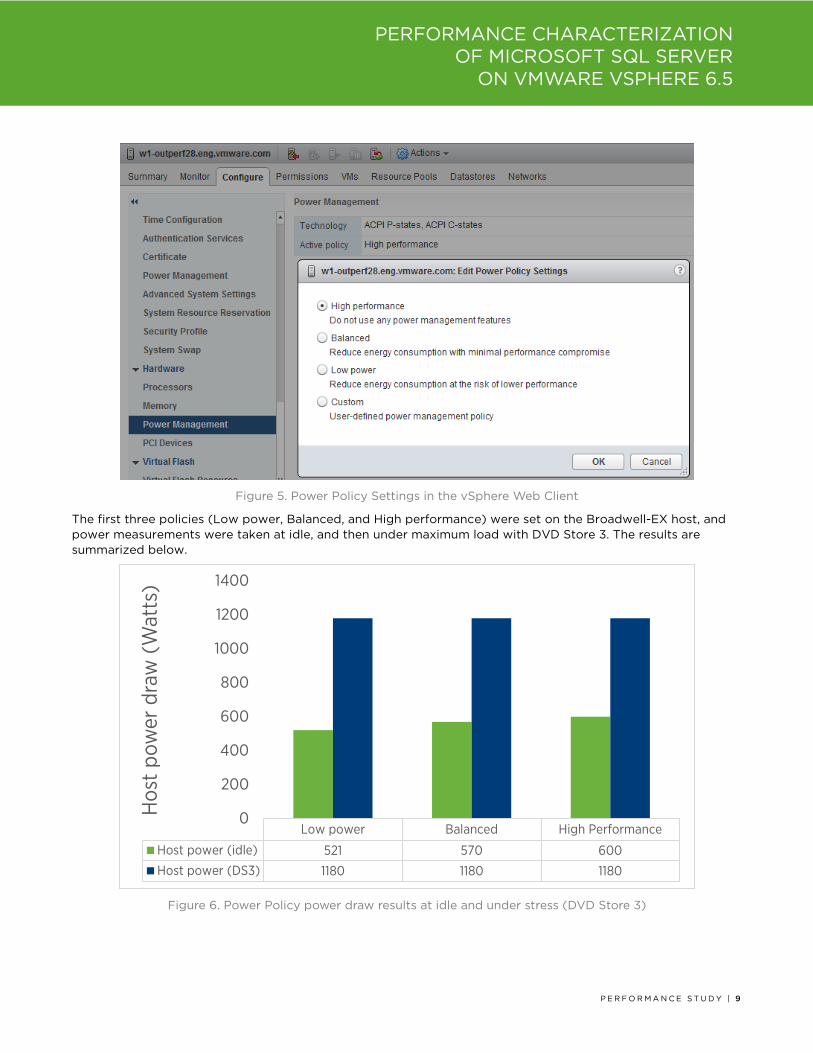
Figure 5. Power Policy Settings in the vSphere Web Client
The first three policies (Low power, Balanced, and High performance) were set on the Broadwell-EX host, and power measurements were taken at idle, and then under maximum load with DVD Store 3. The results are summarized below.
Figure 6. Power Policy power draw results at idle and under stress (DVD Store 3)
Low power Balanced High Performance
Host power (idle) 521 570 600
Host power (DS3) 1180 1180 1180
0
200
400
600
800
1000
1200
1400
Hos
t po
wer
dra
w (
Wat
ts)
PERFORMANCE CHARACTERIZATION OF MICROSOFT SQL SERVER
ON VMWARE VSPHERE 6.5
P E R F O R M A N C E S T U D Y | 1 0
The graph shows that power draw while DVD Store 3 was stressing the ESXi host was identical (1180 W) for all Power Profiles tested. There was, however, some slight but noticeable differences at idle (note that the VMs were powered on, but not being loaded). The “Low power” profile had the lowest idle power at 521 W, with “Balanced” next at 570 W, while “High Performance” was the highest at 600 W. These results make sense, given High Performance disables power management, Balanced has some, while Low Power is the most aggressive for reducing host power.
VMFS vs. RDM There have been numerous performance characterizations comparing VMware’s virtual disk format (VMDK) on Virtual Machine File System (VMFS) to Raw Device Mapping (RDM). Some are a decade old now, dating all the way back to ESX 3.0 [11] and ESX 3.5 [12], and in 2013 we revisited the topic using vSphere 5.1 [13]. While all of this data shows that VMFS performs just as well as RDM, this question is still posed, specifically with regards to SQL Server, both on the Web [14] and by customers at VMworld. This testbed was utilized to revisit this comparison with vSphere/ESXi 6.5 to measure the performance delta between the two choices.
VMware has consistently recommended using VMFS for VMs, including database workloads, since the I/O performance is just as good as using RDM. There are also obvious advantages to using VMFS over RDM: VMFS was designed specifically for virtualization, and allows the storage to host multiple VMs with easy management through vCenter Server. While VMFS-3 only supported virtual disks up to 2 TB, vSphere 5.5 introduced VMFS-5 which expanded the maximum virtual disk size to 62 TB [1]. This maximum also extends across VMware’s software-defined storage (SDS) product line, including vSAN and Virtual Volumes. With the increasing shift towards SDS, the need for storage array level administration (one of the few remaining use cases for RDM) continues to shrink.
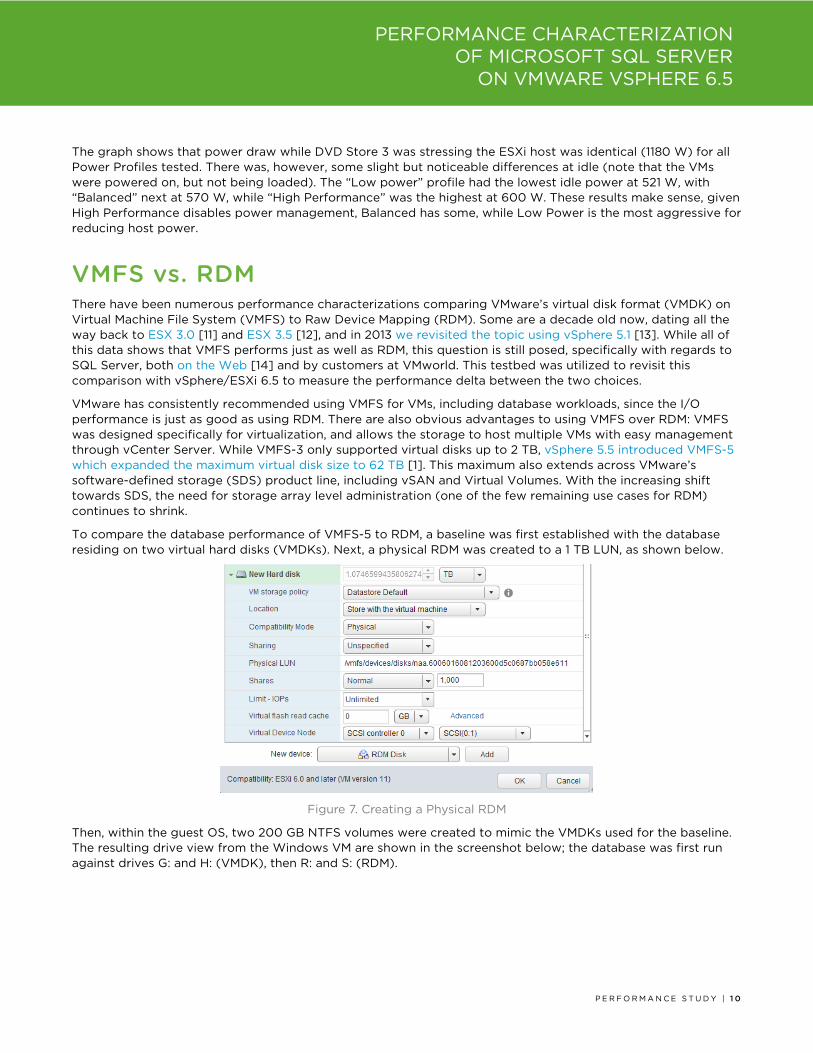
To compare the database performance of VMFS-5 to RDM, a baseline was first established with the database residing on two virtual hard disks (VMDKs). Next, a physical RDM was created to a 1 TB LUN, as shown below.
Figure 7. Creating a Physical RDM
Then, within the guest OS, two 200 GB NTFS volumes were created to mimic the VMDKs used for the baseline. The resulting drive view from the Windows VM are shown in the screenshot below; the database was first run against drives G: and H: (VMDK), then R: and S: (RDM).

PERFORMANCE CHARACTERIZATION OF MICROSOFT SQL SERVER
ON VMWARE VSPHERE 6.5
P E R F O R M A N C E S T U D Y | 1 1
Figure 8. VMFS and RDM volumes (as seen by Windows)
The results from DVD Store 3 running on the same host reveals that, as expected, the performance is virtually identical; in fact, just like the vSphere 5.1 case, the VMFS case slightly (1%) outperformed RDM.
Figure 9. VMFS vs. RDM: DVD Store 3 Performance Comparison
Latency Sensitivity ESXi is optimized for high throughput, by default, to minimize virtualization overhead for a wide range of applications, including business-critical applications such as databases. Latency, on the other hand, measures the time it takes to transfer data from one endpoint to another and is typically measured in milliseconds. Latency-sensitive applications typically include VoIP services or high-frequency trading, where low response times are critical. Transactional database applications are high throughput and are not usually considered sensitive to latency.
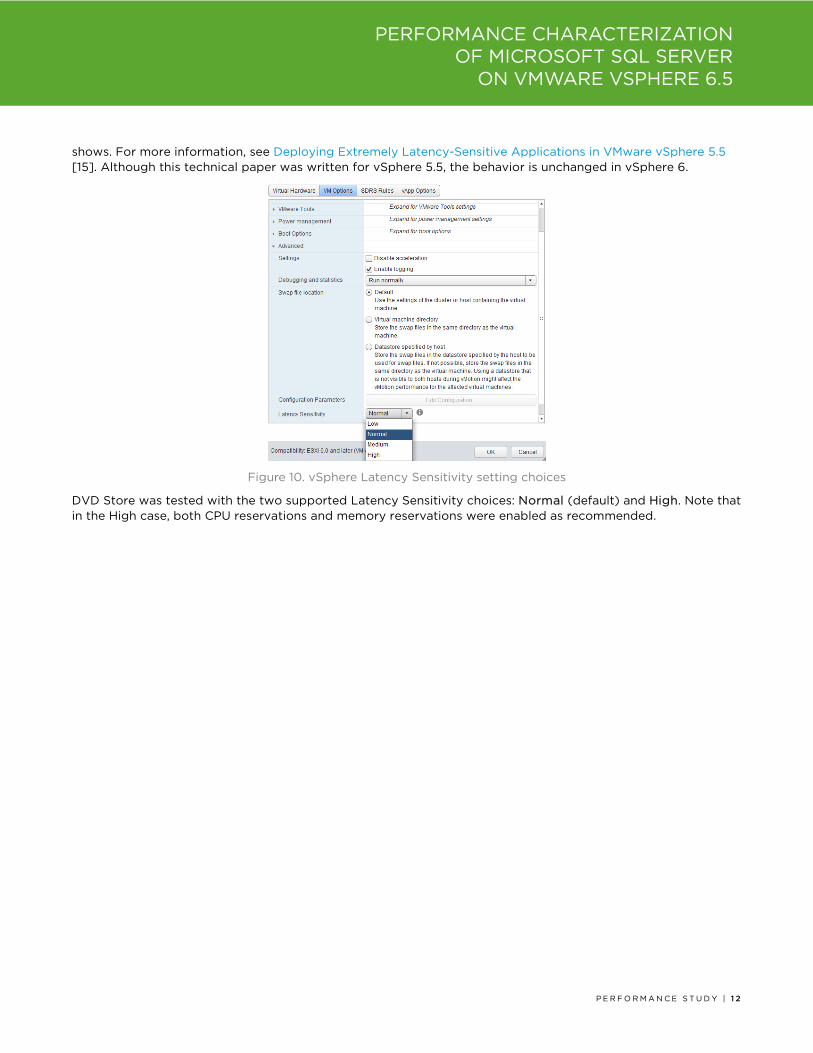
vSphere includes an advanced setting to support virtual machines with strict latency requirements to lower response time and reduce jitter. This is set through the vSphere Web Client on a per-VM basis, as Figure 10
124,257 122,865
0
20,000
40,000
60,000
80,000
100,000
120,000
140,000
VMFS 5 RDM
Ord
ers
Per
Min
ute
(OPM
)
PERFORMANCE CHARACTERIZATION OF MICROSOFT SQL SERVER
ON VMWARE VSPHERE 6.5
P E R F O R M A N C E S T U D Y | 1 2
shows. For more information, see Deploying Extremely Latency-Sensitive Applications in VMware vSphere 5.5 [15]. Although this technical paper was written for vSphere 5.5, the behavior is unchanged in vSphere 6.
Figure 10. vSphere Latency Sensitivity setting choices
DVD Store was tested with the two supported Latency Sensitivity choices: Normal (default) and High. Note that in the High case, both CPU reservations and memory reservations were enabled as recommended.
PERFORMANCE CHARACTERIZATION OF MICROSOFT SQL SERVER
ON VMWARE VSPHERE 6.5
P E R F O R M A N C E S T U D Y | 1 3
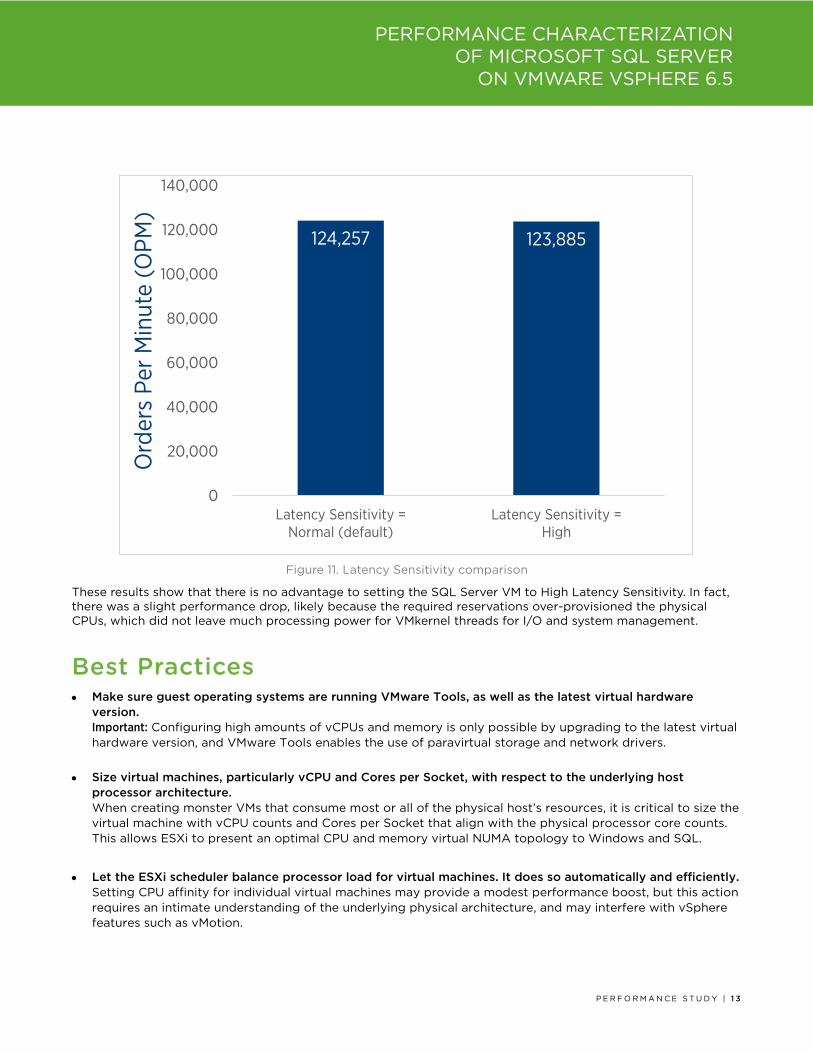
Figure 11. Latency Sensitivity comparison
These results show that there is no advantage to setting the SQL Server VM to High Latency Sensitivity. In fact, there was a slight performance drop, likely because the required reservations over-provisioned the physical CPUs, which did not leave much processing power for VMkernel threads for I/O and system management.
Best Practices • Make sure guest operating systems are running VMware Tools, as well as the latest virtual hardware
version. Important: Configuring high amounts of vCPUs and memory is only possible by upgrading to the latest virtual hardware version, and VMware Tools enables the use of paravirtual storage and network drivers.
• Size virtual machines, particularly vCPU and Cores per Socket, with respect to the underlying host processor architecture. When creating monster VMs that consume most or all of the physical host’s resources, it is critical to size the virtual machine with vCPU counts and Cores per Socket that align with the physical processor core counts. This allows ESXi to present an optimal CPU and memory virtual NUMA topology to Windows and SQL.
• Let the ESXi scheduler balance processor load for virtual machines. It does so automatically and efficiently. Setting CPU affinity for individual virtual machines may provide a modest performance boost, but this action requires an intimate understanding of the underlying physical architecture, and may interfere with vSphere features such as vMotion.
124,257 123,885
0
20,000
40,000
60,000
80,000
100,000
120,000
140,000
Latency Sensitivity =Normal (default)
Latency Sensitivity =High
Ord
ers
Per
Min
ute
(OPM
)
PERFORMANCE CHARACTERIZATION OF MICROSOFT SQL SERVER
ON VMWARE VSPHERE 6.5
P E R F O R M A N C E S T U D Y | 1 4
• Tune SQL Server to handle large databases, and size the VMs with sufficient resources. SQL Server 2016 automatically detects vNUMA and enables Soft NUMA for large VMs, but this requires giving the VMs sufficient resources (namely virtual CPUs and memory).
For tuning SQL Server, here are some great resources:
– The SQL Server on VMware Best Practices Guide [16] has a wealth of recommendations and guidance for running SQL Server in a vSphere-based environment.
– Performance Tuning Guidelines for Windows Server 2012 R2 [17] is a Microsoft document with a specific set of tuning recommendations for OLTP workloads [18]. This document includes tuning guidelines that are applicable to virtualized configurations. The tunings were found to have a noticeable benefit for the DVD Store workload and are summarized below:
• Set the power plan to High Performance.
• Enable SQL Server to use large pages by enabling the Lock pages in memory user right assignment for the account that will run the SQL Server in Group Policy.
• Enable the TCP/IP protocol to allow communication with client systems. In Server Configuration Manager, navigate to SQL Server Network Configuration > Protocols for MSSQL Server, right-click TCP/IP, and click Enable.
– Five SQL Server Settings to Change [19]
– Top 10 Keys to Deploying SQL Server on VMware [20]
– Benchmark Your SQL Server Instance with DVD Store [21]
Other common SQL tunings, their values for these tests, and references to more information are noted below:
– Max degree of parallelism (MAXDOP) [22] is an advanced configuration option that controls the number of processors used to execute a query in a parallel plan. Setting this value to 1 disables parallel plans altogether, which is not recommended in a large virtual machine because it could result in unused virtual CPUs and wasted resources. Microsoft has guidelines for setting this value, depending on whether the host has NUMA and (or) Hyper-Threading; refer to the aforementioned hyperlink for details. Note that while there are numerous recommendations online, many predate virtualization and modern server hardware [23].
– Cost threshold for parallelism [24] is an option that specifies the threshold at which parallel plans are used for queries. The value is specified in seconds, and the default is 5, which means a parallel plan for queries is used if SQL estimates it would take longer than 5 seconds if run serially. This value started to show very high response times with large virtual machines with 8 or more virtual CPUs, particularly for the DVD Store “login” query. Increasing this value to 50 [19] resolved this performance bottleneck and this value was used for all testing.
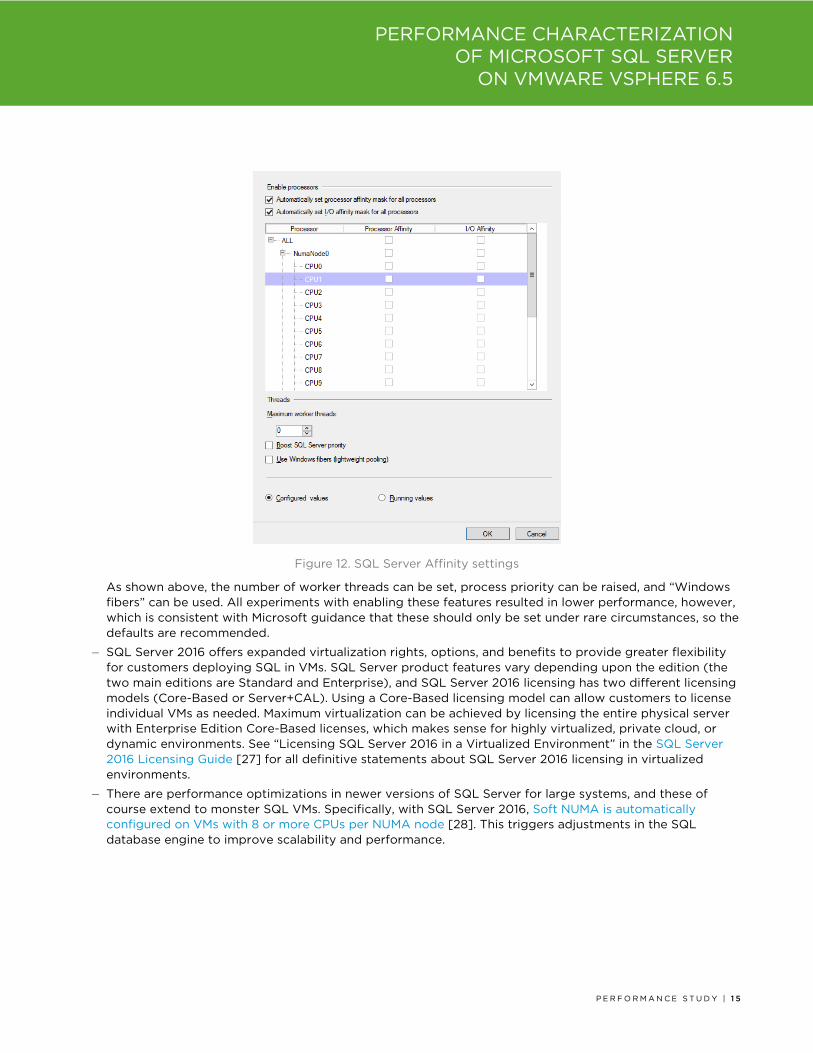
– Processor affinity [25] and I/O affinity [26] masks allow database administrators to assign SQL CPU and I/O to specific vCPUs and (or) vNUMA nodes, as shown in Figure 12.
PERFORMANCE CHARACTERIZATION OF MICROSOFT SQL SERVER
ON VMWARE VSPHERE 6.5
P E R F O R M A N C E S T U D Y | 1 5
Figure 12. SQL Server Affinity settings
As shown above, the number of worker threads can be set, process priority can be raised, and “Windows fibers” can be used. All experiments with enabling these features resulted in lower performance, however, which is consistent with Microsoft guidance that these should only be set under rare circumstances, so the defaults are recommended.
– SQL Server 2016 offers expanded virtualization rights, options, and benefits to provide greater flexibility for customers deploying SQL in VMs. SQL Server product features vary depending upon the edition (the two main editions are Standard and Enterprise), and SQL Server 2016 licensing has two different licensing models (Core-Based or Server+CAL). Using a Core-Based licensing model can allow customers to license individual VMs as needed. Maximum virtualization can be achieved by licensing the entire physical server with Enterprise Edition Core-Based licenses, which makes sense for highly virtualized, private cloud, or dynamic environments. See “Licensing SQL Server 2016 in a Virtualized Environment” in the SQL Server 2016 Licensing Guide [27] for all definitive statements about SQL Server 2016 licensing in virtualized environments.
– There are performance optimizations in newer versions of SQL Server for large systems, and these of course extend to monster SQL VMs. Specifically, with SQL Server 2016, Soft NUMA is automatically configured on VMs with 8 or more CPUs per NUMA node [28]. This triggers adjustments in the SQL database engine to improve scalability and performance.

PERFORMANCE CHARACTERIZATION OF MICROSOFT SQL SERVER
ON VMWARE VSPHERE 6.5
P E R F O R M A N C E S T U D Y | 1 6
• There is no performance advantage to using RDM instead of VMFS. DVD Store 3 on SQL Server showed that VMFS-5 performs just as well (if not better) than Raw Device Mappings. VMFS is also much easier to configure and manage through vSphere.
• SQL workloads are not highly sensitive to latency. Latency Sensitivity is an advanced setting designed for high performance computing applications like VoIP or financial trading workloads. This setting does not benefit DVD Store, an OLTP workload designed to achieve maximum throughput. For more information, see VMware vSphere 6.5 Documentation Center: Latency Sensitivity [29].
Conclusion SQL Server workloads achieve excellent performance with vSphere 6.5 on top of today’s massively multi-core, large memory server hardware. Some key best practices based on these results include: rightsizing a virtual machine’s vCPUs and Cores per Socket is essential to achieving maximum throughput; VMFS performs just as well as RDM, even for high I/O OLTP workloads; and this workload should not be considered a candidate for high Latency Sensitivity. This paper shows that DVD Store 3 was able to scale SQL Server database performance across five processor generations of 4-socket servers.
PERFORMANCE CHARACTERIZATION OF MICROSOFT SQL SERVER
ON VMWARE VSPHERE 6.5
P E R F O R M A N C E S T U D Y | 1 7
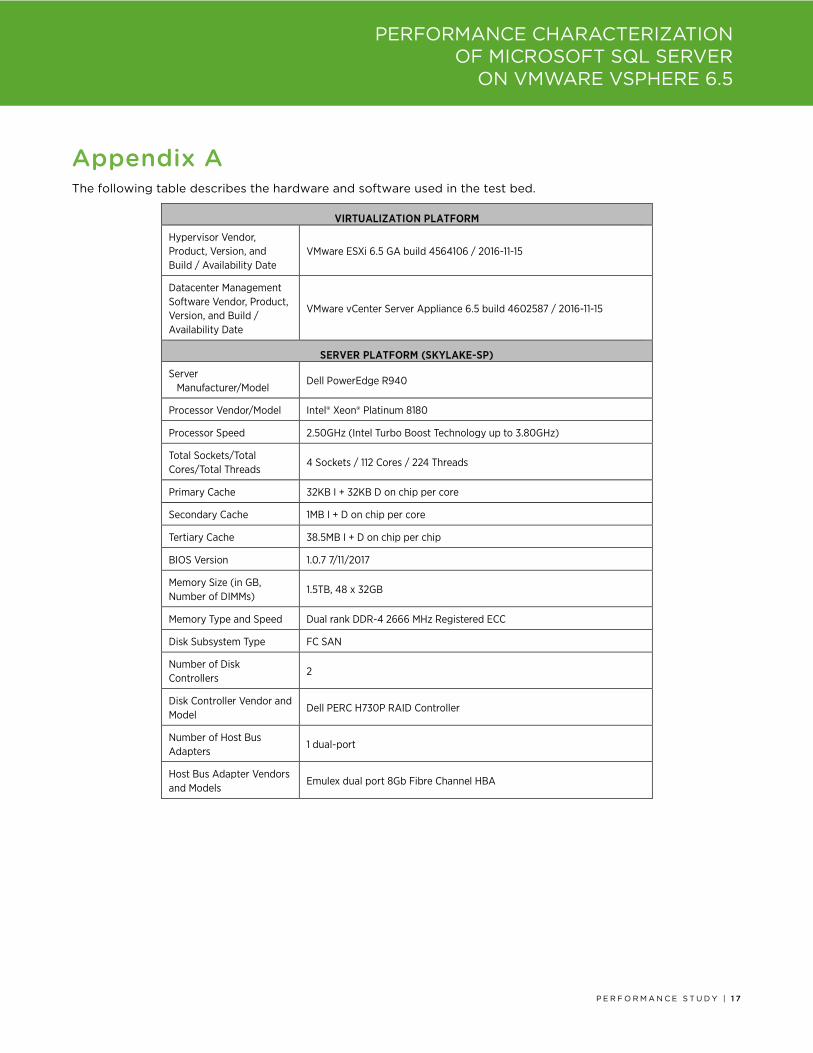
Appendix A The following table describes the hardware and software used in the test bed.
VIRTUALIZATION PLATFORM
Hypervisor Vendor, Product, Version, and Build / Availability Date
VMware ESXi 6.5 GA build 4564106 / 2016-11-15
Datacenter Management Software Vendor, Product, Version, and Build / Availability Date
VMware vCenter Server Appliance 6.5 build 4602587 / 2016-11-15
SERVER PLATFORM (SKYLAKE-SP)
Server Manufacturer/Model
Dell PowerEdge R940
Processor Vendor/Model Intel® Xeon® Platinum 8180
Processor Speed 2.50GHz (Intel Turbo Boost Technology up to 3.80GHz)
Total Sockets/Total Cores/Total Threads
4 Sockets / 112 Cores / 224 Threads
Primary Cache 32KB I + 32KB D on chip per core
Secondary Cache 1MB I + D on chip per core
Tertiary Cache 38.5MB I + D on chip per chip
BIOS Version 1.0.7 7/11/2017
Memory Size (in GB, Number of DIMMs)
1.5TB, 48 x 32GB
Memory Type and Speed Dual rank DDR-4 2666 MHz Registered ECC
Disk Subsystem Type FC SAN
Number of Disk Controllers
2
Disk Controller Vendor and Model
Dell PERC H730P RAID Controller
Number of Host Bus Adapters
1 dual-port
Host Bus Adapter Vendors and Models
Emulex dual port 8Gb Fibre Channel HBA
PERFORMANCE CHARACTERIZATION OF MICROSOFT SQL SERVER
ON VMWARE VSPHERE 6.5
P E R F O R M A N C E S T U D Y | 1 8
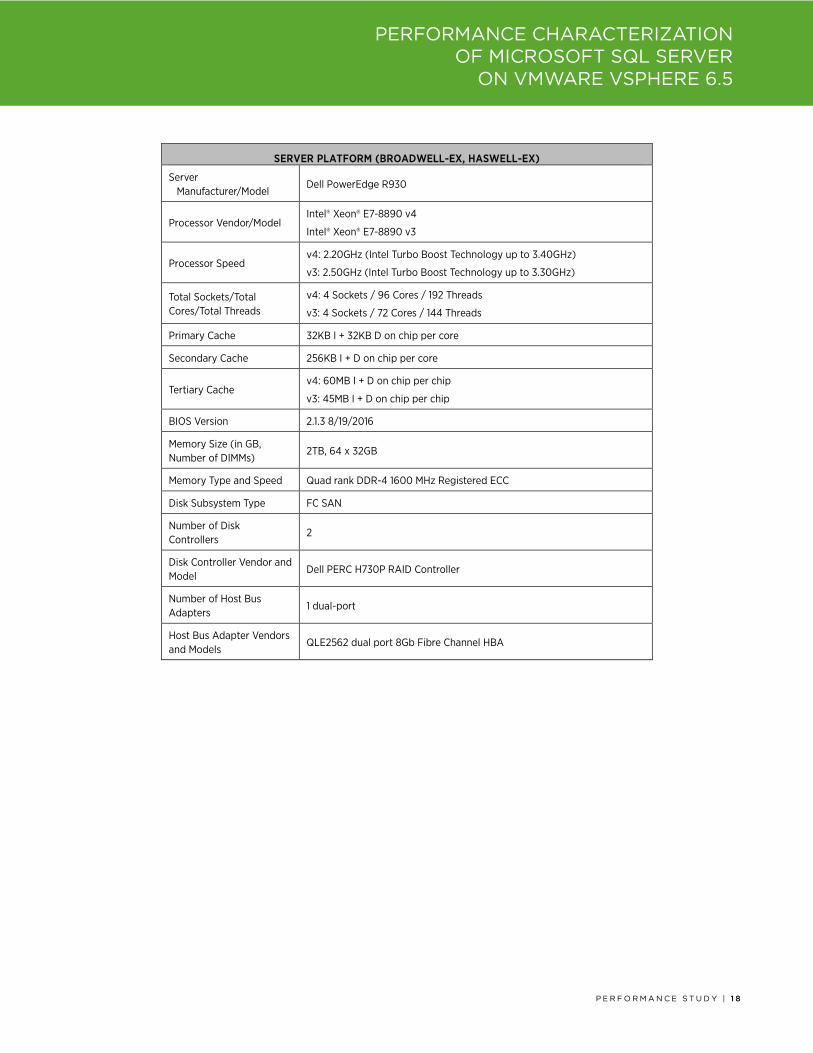
SERVER PLATFORM (BROADWELL-EX, HASWELL-EX)
Server Manufacturer/Model
Dell PowerEdge R930
Processor Vendor/Model Intel® Xeon® E7-8890 v4
Intel® Xeon® E7-8890 v3
Processor Speed v4: 2.20GHz (Intel Turbo Boost Technology up to 3.40GHz)
v3: 2.50GHz (Intel Turbo Boost Technology up to 3.30GHz)
Total Sockets/Total Cores/Total Threads
v4: 4 Sockets / 96 Cores / 192 Threads
v3: 4 Sockets / 72 Cores / 144 Threads
Primary Cache 32KB I + 32KB D on chip per core
Secondary Cache 256KB I + D on chip per core
Tertiary Cache v4: 60MB I + D on chip per chip
v3: 45MB I + D on chip per chip
BIOS Version 2.1.3 8/19/2016
Memory Size (in GB, Number of DIMMs)
2TB, 64 x 32GB
Memory Type and Speed Quad rank DDR-4 1600 MHz Registered ECC
Disk Subsystem Type FC SAN
Number of Disk Controllers
2
Disk Controller Vendor and Model
Dell PERC H730P RAID Controller
Number of Host Bus Adapters
1 dual-port
Host Bus Adapter Vendors and Models
QLE2562 dual port 8Gb Fibre Channel HBA

PERFORMANCE CHARACTERIZATION OF MICROSOFT SQL SERVER
ON VMWARE VSPHERE 6.5
P E R F O R M A N C E S T U D Y | 1 9
SERVER PLATFORM (IVY BRIDGE-EX)
Server Manufacturer/Model
Dell PowerEdge R920
Processor Vendor/Model Intel® Xeon® E7-4890 v2
Processor Speed 2.8GHz (Intel Turbo Boost Technology up to 3.4GHz)
Total Sockets/Total Cores/Total Threads
4 Sockets / 60 Cores / 120 Threads
Primary Cache 32KB I + 32KB D on chip per core
Secondary Cache 256KB I + D on chip per core
Tertiary Cache 37.5MB I + D on chip per chip
BIOS Version 1.6.2 7/13/2016
Memory Size (in GB, Number of DIMMs)
1TB, 64 x 16GB
Memory Type and Speed Dual rank DDR-3 1333 MHz Registered ECC
Disk Subsystem Type FC SAN
Number of Disk Controllers
1
Disk Controller Vendor and Model
Dell PERC H730P RAID Controller
Number of Host Bus Adapters
1 dual-port
Host Bus Adapter Vendors and Models
QLE2662 dual port 16Gb Fibre Channel HBA
PERFORMANCE CHARACTERIZATION OF MICROSOFT SQL SERVER
ON VMWARE VSPHERE 6.5
P E R F O R M A N C E S T U D Y | 2 0
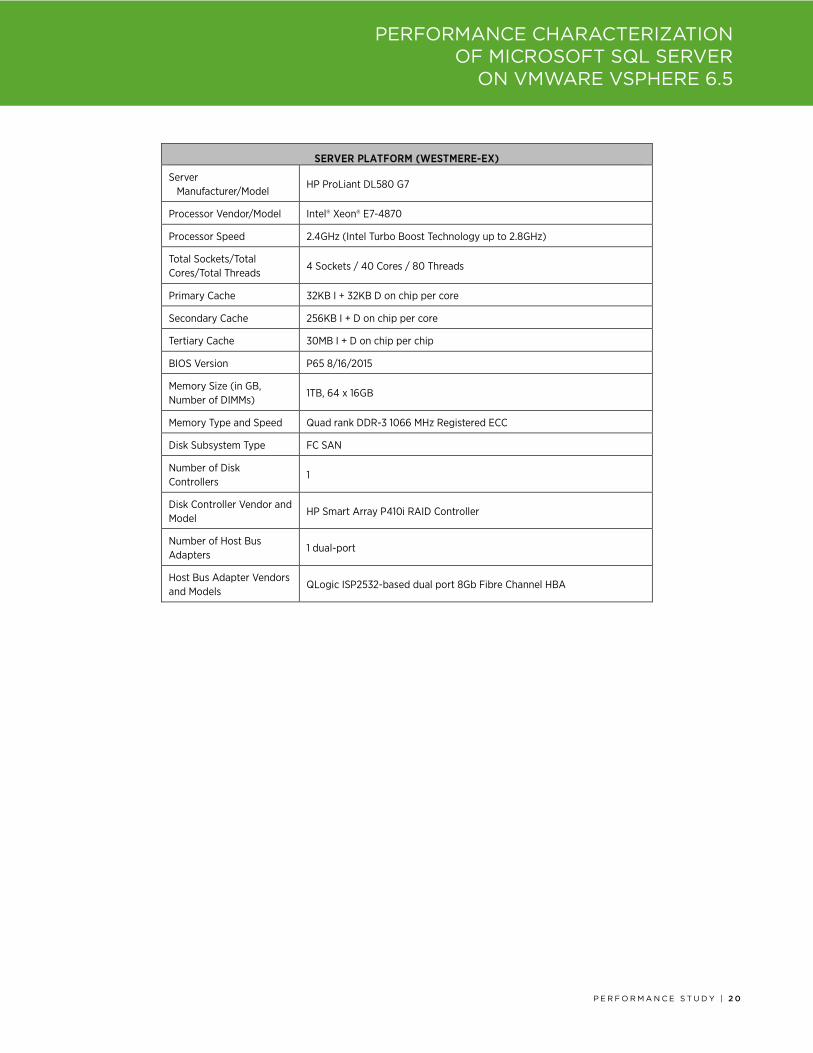
SERVER PLATFORM (WESTMERE-EX)
Server Manufacturer/Model
HP ProLiant DL580 G7
Processor Vendor/Model Intel® Xeon® E7-4870
Processor Speed 2.4GHz (Intel Turbo Boost Technology up to 2.8GHz)
Total Sockets/Total Cores/Total Threads
4 Sockets / 40 Cores / 80 Threads
Primary Cache 32KB I + 32KB D on chip per core
Secondary Cache 256KB I + D on chip per core
Tertiary Cache 30MB I + D on chip per chip
BIOS Version P65 8/16/2015
Memory Size (in GB, Number of DIMMs)
1TB, 64 x 16GB
Memory Type and Speed Quad rank DDR-3 1066 MHz Registered ECC
Disk Subsystem Type FC SAN
Number of Disk Controllers
1
Disk Controller Vendor and Model
HP Smart Array P410i RAID Controller
Number of Host Bus Adapters
1 dual-port
Host Bus Adapter Vendors and Models
QLogic ISP2532-based dual port 8Gb Fibre Channel HBA
PERFORMANCE CHARACTERIZATION OF MICROSOFT SQL SERVER
ON VMWARE VSPHERE 6.5
P E R F O R M A N C E S T U D Y | 2 1
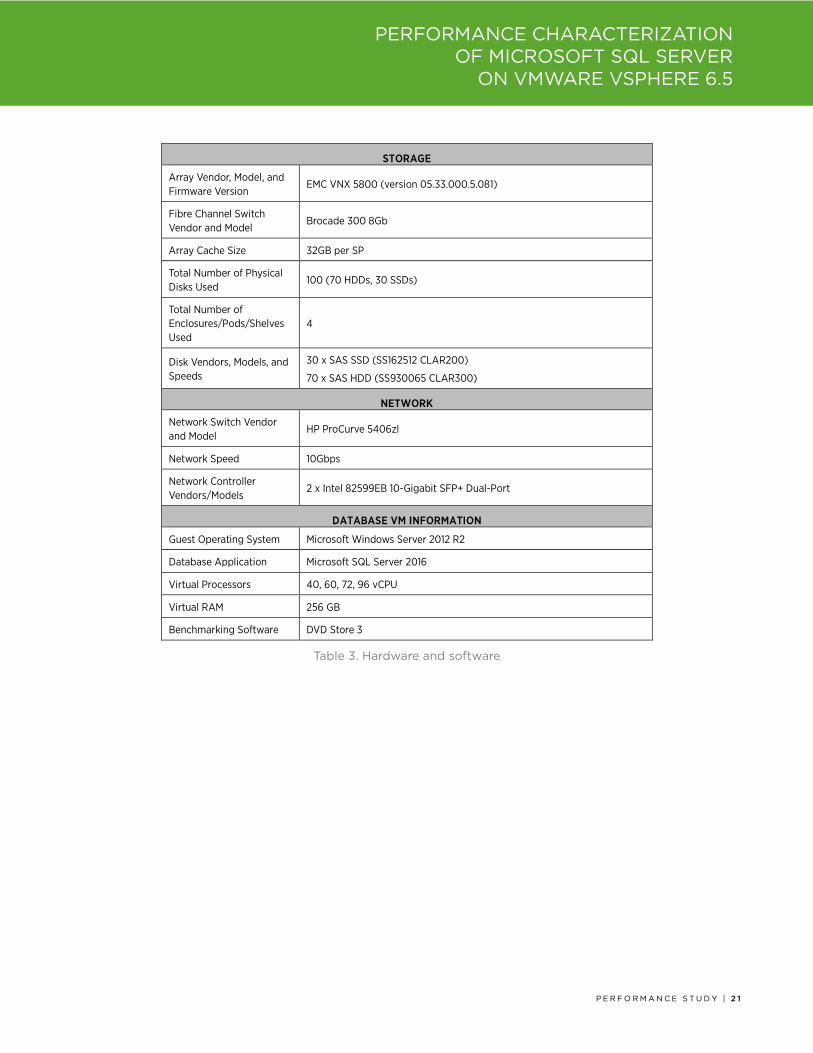
STORAGE
Array Vendor, Model, and Firmware Version
EMC VNX 5800 (version 05.33.000.5.081)
Fibre Channel Switch Vendor and Model
Brocade 300 8Gb
Array Cache Size 32GB per SP
Total Number of Physical Disks Used
100 (70 HDDs, 30 SSDs)
Total Number of Enclosures/Pods/Shelves Used
4
Disk Vendors, Models, and Speeds
30 x SAS SSD (SS162512 CLAR200)
70 x SAS HDD (SS930065 CLAR300)
NETWORK
Network Switch Vendor and Model
HP ProCurve 5406zl
Network Speed 10Gbps
Network Controller Vendors/Models
2 x Intel 82599EB 10-Gigabit SFP+ Dual-Port
DATABASE VM INFORMATION
Guest Operating System Microsoft Windows Server 2012 R2
Database Application Microsoft SQL Server 2016
Virtual Processors 40, 60, 72, 96 vCPU
Virtual RAM 256 GB
Benchmarking Software DVD Store 3
Table 3. Hardware and software

PERFORMANCE CHARACTERIZATION OF MICROSOFT SQL SERVER
ON VMWARE VSPHERE 6.5
P E R F O R M A N C E S T U D Y | 2 2
References [1] VMware, Inc. (2016) Configuration Maximums.
https://www.vmware.com/pdf/vsphere6/r65/vsphere-65-configuration-maximums.pdf
[2] VMware, Inc. (2012, September) Virtualizing Business-Critical Applications on vSphere. http://www.vmware.com/content/dam/digitalmarketing/vmware/en/pdf/whitepaper/solutions/vmware-virtualizing-business-critical-apps-on-vmware_en-white-paper.pdf
[3] David Morse. (2015, March) Performance Characterization of Microsoft SQL Server on VMware vSphere 6. https://communities.vmware.com/docs/DOC-27373
[4] VMware, Inc. (2017, February) Virtual machine application runs slower than expected in ESXi (1018206). http://kb.vmware.com/kb/1018206
[5] Frank Denneman. (2106, December) Decoupling of Cores per Socket from Virtual NUMA Topology in vSphere 6.5. http://frankdenneman.nl/2016/12/12/decoupling-cores-per-socket-virtual-numa-topology-vsphere-6-5/
[6] Mark Achtemichuk. (2017, March) Virtual Machine vCPU and vNUMA Rightsizing – Rules of Thumb. https://blogs.vmware.com/performance/2017/03/virtual-machine-vcpu-and-vnuma-rightsizing-rules-of-thumb.html
[7] VMware, Inc. (2017, March) Configuring disks to use VMware Paravirtual SCSI (PVSCSI) adapters (1010398). http://kb.vmware.com/kb/1010398
[8] VMware, Inc. (2017, February) Choosing a network adapter for your virtual machine (1001805). http://kb.vmware.com/kb/1001805
[9] Todd Muirhead. (2017, February) DVD Store version 3. https://github.com/dvdstore/ds3
[10] VMware, Inc. (2016) VMmark. http://www.vmware.com/products/vmmark.html
[11] VMware, Inc. (2007, July) Performance Characteristics of VMFS and RDM. http://www.vmware.com/techpapers/2007/performance-characteristics-of-vmfs-and-rdm-1019.html
[12] VMware, Inc. (2008, November) Performance Characterization of VMFS and RDM Using a SAN. http://www.vmware.com/techpapers/2008/performance-characterization-of-vmfs-and-rdm-using-1040.html
[13] Mark Achtemichuk. (2103, January) vSphere 5.1 – VMDK versus RDM. https://blogs.vmware.com/vsphere/2013/01/vsphere-5-1-vmdk-versus-rdm.html
[14] Thomas LaRock. (2016, October) VMDK versus RDM: Which One Do I Need for SQL Server? https://logicalread.com/vmdk-vs-rdm-sql-server-tl01/
PERFORMANCE CHARACTERIZATION OF MICROSOFT SQL SERVER
ON VMWARE VSPHERE 6.5
P E R F O R M A N C E S T U D Y | 2 3
[15] Jin Heo and Lenin Singaravelu. (2013, September) Deploying Extremely Latency-Sensitive Applications in VMware vSphere 5.5. http://www.vmware.com/resources/techresources/10383
[16] Niran Even-Chen. (2016, March) Architecting Microsoft SQL Server on VMware vSphere. http://www.vmware.com/content/dam/digitalmarketing/vmware/en/pdf/solutions/sql-server-on-vmware-best-practices-guide.pdf
[17] Microsoft. Performance Tuning Guidelines for Windows Server 2012 R2. http://msdn.microsoft.com/en-us/library/windows/hardware/dn529133
[18] Microsoft. Performance Tuning for Online Transaction Processing (OLTP). http://msdn.microsoft.com/en-us/library/windows/hardware/dn567642
[19] Jeremiah Peschka. (2013, September) Five SQL Server Settings to Change. http://www.brentozar.com/archive/2013/09/five-sql-server-settings-to-change/
[20] Brent Ozar. (2011, May) Top 10 Keys to Deploying SQL Server on VMware. http://www.brentozar.com/archive/2011/05/keys-deploying-sql-server-on-vmware/
[21] David Klee. (2013, July) Benchmark Your SQL Server Instance with DVDStore. http://www.davidklee.net/2013/07/29/benchmark-your-sql-server-instance-with-dvdstore/
[22] Microsoft. (2015, May) Recommendations and guidelines for the "max degree of parallelism" configuration option in SQL Server. http://support.microsoft.com/kb/2806535
[23] Brent Ozar. (2010, September) SQL Server Virtualization: Get Your Hands Off That MAXDOP. http://www.sqlskills.com/blogs/brent/sql-server-virtualization-get-your-hands-off-that-maxdop/
[24] Microsoft. Configure the cost threshold for parallelism Server Configuration Option. http://msdn.microsoft.com/en-us/library/ms190949(v=sql.110).aspx
[25] Microsoft. (2017, March) affinity mask Server Configuration Option. https://msdn.microsoft.com/en-us/library/ms187104(v=sql.130).aspx
[26] Microsoft. (2017, March) affinity Input-Output mask Server Configuration Option. https://msdn.microsoft.com/en-us/library/ms189629(v=sql.130).aspx
[27] Microsoft. Microsoft SQL Server 2016 Licensing Guide. https://download.microsoft.com/download/9/C/6/9C6EB70A-8D52-48F4-9F04-08970411B7A3/SQL_Server_2016_Licensing_Guide_EN_US.pdf
[28] Microsoft. (2016, March) SQL 2016 – It Just Runs Faster: Automatic Soft NUMA. https://blogs.msdn.microsoft.com/psssql/2016/03/30/sql-2016-it-just-runs-faster-automatic-soft-numa/
[29] VMware, Inc. (2016) VMware vSphere 6.5 Documentation Center: Latency Sensitivity. http://pubs.vmware.com/vsphere-65/index.jsp?topic=%2Fcom.vmware.vsphere.resmgmt.doc%2FGUID-9F4FD589-A73B-454A-A5A5-FED4C0F918C3.html
PERFORMANCE CHARACTERIZATION OF MICROSOFT SQL SERVER
ON VMWARE VSPHERE 6.5
VMware, Inc. 3401 Hillview Avenue Palo Alto CA 94304 USA Tel 877-486-9273 Fax 650-427-5001 www.vmware.com Copyright © 2017 VMware, Inc. All rights reserved. This product is protected by U.S. and international copyright and intellectual property laws. VMware products are covered by one or more patents listed at http://www.vmware.com/go/patents. VMware is a registered trademark or trademark of VMware, Inc. in the United States and/or other jurisdictions. All other marks and names mentioned herein may be trademarks of their respective companies. Comments on this document: https://communities.vmware.com/docs/DOC-27373
About the Author David Morse is a Staff Engineer on the Performance Engineering team at VMware. He has 18 years of benchmarking experience at VMware, Dell Inc., and NCR Corp. He has held a variety of roles within the Standard Performance Evaluation Corporation (SPEC), including chairing the Open Systems Steering Committee and serving on the Board of Directors. David has a B.S. in Computer Engineering from the University of South Carolina and is a Red Hat Certified Engineer (RHCE).
Acknowledgements The author would like to thank: Todd Muirhead, for his DVD Store development; David Klee, for his SQL Server expertise; Qasim Ali, for his power profile advice; and colleagues within the performance engineering organization, many of whom provided valuable feedback throughout this study.
![Performance Characterization of Microsoft SQL Server on ... · Generational Performance Comparison ... using vSphere 6 and Oracle 12c [4] ... SQL Server detected 32 sockets with 1](https://static.documents.pub/doc/80x56/5af5e9aa7f8b9a190c8ef52e/performance-characterization-of-microsoft-sql-server-on-performance-comparison.jpg)


![SQL Server TSQL [Read-Only] - csuohio.educis.csuohio.edu/~sschung/IST331/SQL_Server_TSQL.pdf · Microsoft SQL Server. SQL Server 2005 Microsoft-SQL Server 2005 is a relational database](https://static.documents.pub/doc/80x56/5e202cff7110143c3f45a3d1/sql-server-tsql-read-only-sschungist331sqlservertsqlpdf-microsoft-sql.jpg)


![Performance Characterization of Microsoft SQL Server on ......For tuning SQL Server, here are two great resources: 1. The SQL Server on VMware Best Practices Guide [7] has a wealth](https://static.documents.pub/doc/80x56/5f0de1d37e708231d43c8c6b/performance-characterization-of-microsoft-sql-server-on-for-tuning-sql-server.jpg)
