17
Amazon Cloud Performance Compared David Adams
Amazon Cloud Performance Compared
David Adams
Amazon EC2 performance comparison
How does EC2 compare to traditional supercomputer for scientific applications?
"Performance Analysis of High PerformanceComputing Applications on the Amazon WebServices Cloud", 2010
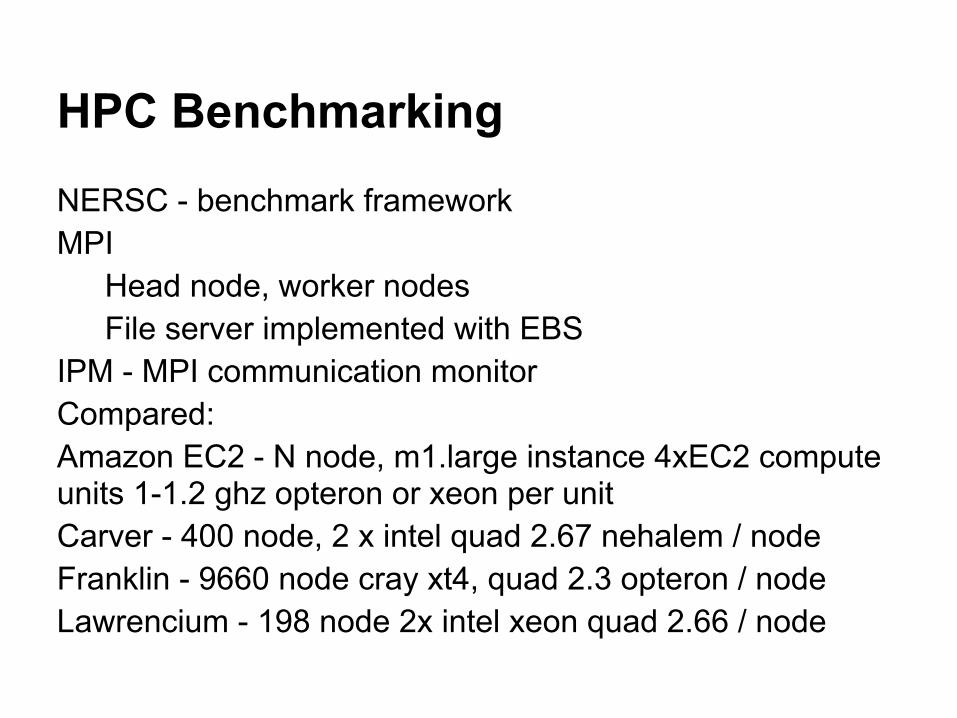
HPC Benchmarking
NERSC - benchmark frameworkMPI
Head node, worker nodesFile server implemented with EBS
IPM - MPI communication monitorCompared:Amazon EC2 - N node, m1.large instance 4xEC2 compute units 1-1.2 ghz opteron or xeon per unitCarver - 400 node, 2 x intel quad 2.67 nehalem / nodeFranklin - 9660 node cray xt4, quad 2.3 opteron / nodeLawrencium - 198 node 2x intel xeon quad 2.66 / node

NERSC Benchmark SuiteCAM ● Community Atmosphere Model● Stresses processor data movement and MPI interconnect p2p bandwidth
Gamess● General Atomic and molecular electronic structure system● memory access and bandwidth, collective interconnect performance
GTC● Stresses indirect addressing and random access memory
IMPACT-T● Integrated Map and Particle Accelerator Tracking Time● sensitive to memory bandwidth and MPI performance

NERSC Benchmark Suite ContMAESTRO
● Stresses memory performance, latency and global communicationsMILC
● Stresses memory bandwidth, prefetching and processing powerParatec● Parallel Total Energy Code● Stresses global communication bandwidth, processing power
HPCC● 7 synthetic benchmarks● Targets computation, communications
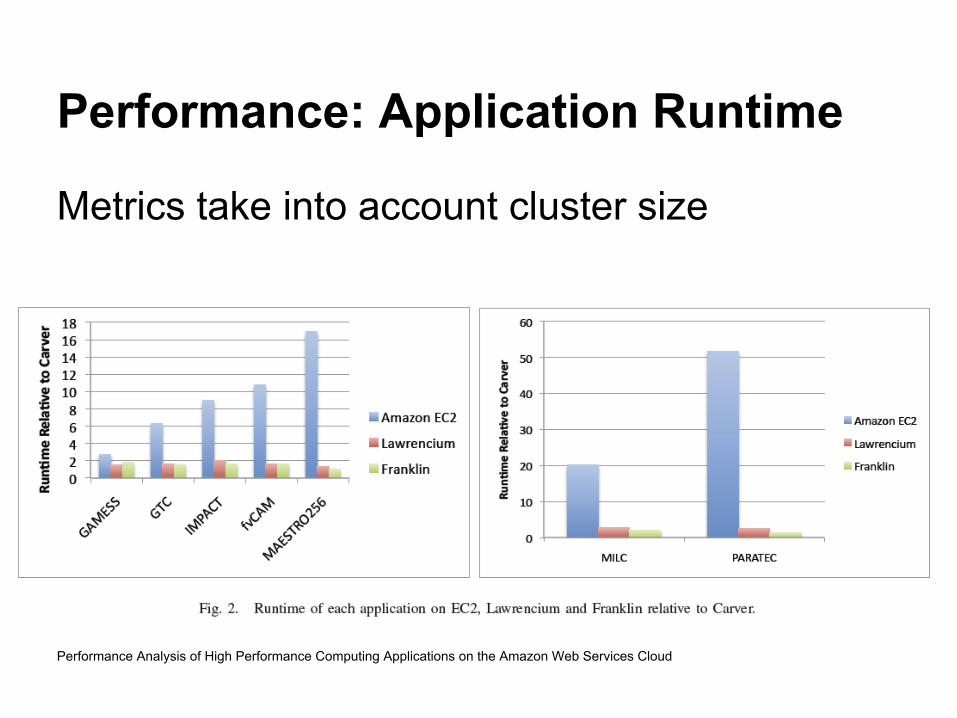
Performance: Application Runtime
Metrics take into account cluster size
Performance Analysis of High Performance Computing Applications on the Amazon Web Services Cloud

Performance: Percentage runtime communicating using IPM
Performance Analysis of High Performance Computing Applications on the Amazon Web Services Cloud

Performance: Sustained Flops
Performance Analysis of High Performance Computing Applications on the Amazon Web Services Cloud
Considerations using EC2Heterogeneous cpus:● Intel Xeon E5430 2.66GHz quad-core processor● AMD Opteron 270 2.0GHz dual-core processor● AMD Opteron 2218 HE 2.6GHz dual-core processor● Cannot optimize code
High performance variability● Sharing hardware with other vms
Slow node communication● Gigabit ethernet
"Transient errors"● Failure to boot, network misconfigurations, virtual machine hangs
Not always able to acquire requested cores● 256+ cores require scheduling/reservation

Cost/Performance compared to Desktop Grid
How does Amazon EC2 compare to Grid Computing?
"Cost-Benefit Analysis of Cloud Computing versus Desktop Grids", 2009

Desktop Grid/Volunteer Computing
Fastest virtual supercomputers (From wikipedia)
Bitcoin network 168.26 PFLOPS
BOINC 5.634 PFLOPS
Folding@Home 5 PFLOPS
MilkyWay@Home 1.6 PFLOPS
SETI@Home 730 TFLOPS
Einstein@Home 210 TFLOPS
Amazon HPC 240 teraflops 17024 cores

Considerations using VC
Slow acquisition of computing resources● 7.8 days to achieve 1000 cloud node
equivalentSlow task deployment● time = (reconnections * # tasks) / # clients● 1000 tasks to 10000 nodes about 45 minSlow completion times● deadlines, priorities, 96+% completion rate● Average 9 days vs < 4 hours on dedicated

When would you use VC over Cloud?
Cost-Benefit Analysis of Cloud Computing versus Desktop Grids

Cloud Power attainable given VC Costs
Resources Per Month
*One or the other
Given 12k/Month
Processing Storage
SETI 514 TeraFLOPS
7.7 TB
Amazon 2 TeraFLOPS* 80 TB*

Cloud-VC Hybrid Approach
Host VC Server on Cloud: Cost BreakdownCost-Benefit Analysis of Cloud Computing versus Desktop Grids

Storage vs Bandwidth
Storage vs Bandwidth for a fixed budget
Cost-Benefit Analysis of Cloud Computing versus Desktop Grids

Conclusions
VC outperform clouds on cost for large long term and highly parallel projects● Projects on the order of weeks● VC needs a certain number of volunteer nodes before
cost effectiveness● High startup costs make short term projects not cost
effective1 small EC2 instance is equivalent to 2.83 VC hostsHybrid approach can lower startup and monthly costs of VC● 40% savings on SETI


