REFERENCES [1] Lord, R. D. (1954) The use of the Hankel transform in statistics. Biometrika, 41 (1954), 44—55. [2] Drumheller, D. M. (1999) Pad ´ e approximations to matched filter amplitude probability functions. IEEE Transactions on Aerospace and Electronic Systems, 35, 3 (1999), 1033—1045. [3] Trunk, G. V. (1972) Radar properties of non-Rayleigh sea clutter. IEEE Transactions on Aerospace and Electronic Systems, AES-8, 2 (1972), 196—204. [4] Dugelay, S., Pace, N. G., Heald, G. J. and Brothers, R. J. (2000) Statistical analysis of high frequency acoustic scatter: What makes a statistical distribution? Proceedings of the Fifth European Conference on Underwater Acoustics, Lyon, France, 2000. [5] Eaves, J. L., and Reedy, E. K. (1987) Principles of Modern Radar. Princeton, NJ: Van Nostrand Reinhold, 1987, ch. 11. [6] Sangston, K. J., and Gerlach, K. R. (1992) Non-Gaussian noise models and coherent detection of radar targets. NRL Report 5341-92-9367, Naval Research Laboratory, Washington, DC, Nov. 1992. [7] Kay, S. M. (1993) Fundamentals of Statistical Signal Processing. Saddle River, NJ: Prentic-Hall, 1993, ch. 15. [8] Wooding, R. A. (1956) The multivariate distribution of complex normal random variables. Biometrika, 43 (1956), 212—215. [9] Turin, G. L. (1960) The characteristic function of Hermitian quadratic forms in complex normal variables. Biometrika, 47 (1960), 199—201. [10] Conte, E., and Longo, M. (1987) Characterization of radar clutter as a spherically invariant random process. IEE Proceedings, 134, Pt. F, 2 (1987), 191—197. [11] Conte, E., DiBisceglie, M., Longo, M., and Lops, M. (1995) Canonical detection in spherically invariance noise. IEEE Transactions on Communications, 43, 2/3/4 (1995), 416—424. [12] Goldman, J. (1976) Detection in the presence of spherically symmetric random vectors. IEEE Transactions on Information Theory, IT-22, 1 (1976), 52—59. [13] Rangaswamy, M., Weiner, D., and ¨ Ozt ¨ urk, A. (1993) Non-Gaussian random vector identification using spherically invariant random processes. IEEE Transactions on Aerospace and Electronic Systems, 29, 1 (1993), 111—124. [14] Yao, K. (1973) A representation theorem and its applications to spherically-invariant random processes. IEEE Transactions on Information Theory, IT-19, 5 (1973), 600—608. [15] Watson, G. N. (1944) A Treaties on the Theory of Bessel Functions, (2nd ed.). Cambridge, England: Cambridge University Press, 1944. [16] Luke, Y. L. (1962) Integrals of Bessel Functions. New York: McGraw-Hill, 1962, ch. 2. Performance Complexity Study of Several Approaches to Automatic Target Recognition from SAR Images A framework which allows for the direct comparison of alternate approaches to automatic target recognition (ATR) from synthetic aperture radar (SAR) images is described and applied to variants of several ATR algorithms. This framework allows comparisons to be made on an even footing while minimizing the impact of implementation details and accounts for variation in image sizes, in angular resolution, and in the sizes of orientation windows used for training. Alternate approaches to ATR are characterized in terms of the best achievable performance as a function of the complexity of the model parameter database. Several approaches to ATR from SAR images are described and the performance achievable by each for a range of database complexities is studied and compared. These approaches are based on a likelihood test under a conditionally Gaussian model, log-magnitude least squared error, and quarter power least squared error. All approaches are evaluated for a wide range of parameterizations and the dependence on these parameters of both the resulting performance and the resulting database complexity is explored. Databases for all of the approaches are trained using identical sets of images and their performance is assessed under identical testing scenarios in terms of probability of correct classification, confusion matrices, and orientation estimation error. The results indicate that the conditionally Gaussian approach outperforms the other two approaches on average for both target recognition and orientation estimation, that accounting for radar power fluctuation improves performance for all three methods, and that the conditionally Gaussian approach normalized for power delivers average performance that is equal or superior to all other considered approaches. I. INTRODUCTION Many approaches to performing automatic target recognition (ATR) from synthetic aperture radar (SAR) data have been proposed in the literature Manuscript received December 21, 1999; revised November 29, 2000, September 20, 2001, and January 15, 2002; released for publication January 16, 2002. IEEE Log No. T-AES/38/2/11448. Refereeing of this contribution was handled by L. M. Kaplan. This work was supported in part by the U.S. Army Research Office, Grant DAAH04-95-1-0494, by the Office of Naval Research, Grant N00014-98-1-06-06, and by the Boeing-McDonnell Foundation. 0018-9251/02/$17.00 c ° 2002 IEEE 632 IEEE TRANSACTIONS ON AEROSPACE AND ELECTRONIC SYSTEMS VOL. 38, NO. 2 APRIL 2002
Transcript
REFERENCES
[1] Lord, R. D. (1954)The use of the Hankel transform in statistics.Biometrika, 41 (1954), 44—55.
[2] Drumheller, D. M. (1999)Pade approximations to matched filter amplitudeprobability functions.IEEE Transactions on Aerospace and Electronic Systems,35, 3 (1999), 1033—1045.
[3] Trunk, G. V. (1972)Radar properties of non-Rayleigh sea clutter.IEEE Transactions on Aerospace and Electronic Systems,AES-8, 2 (1972), 196—204.
[4] Dugelay, S., Pace, N. G., Heald, G. J. and Brothers, R. J.(2000)Statistical analysis of high frequency acoustic scatter:What makes a statistical distribution?Proceedings of the Fifth European Conference onUnderwater Acoustics, Lyon, France, 2000.
[5] Eaves, J. L., and Reedy, E. K. (1987)Principles of Modern Radar.Princeton, NJ: Van Nostrand Reinhold, 1987, ch. 11.
[6] Sangston, K. J., and Gerlach, K. R. (1992)Non-Gaussian noise models and coherent detection ofradar targets.NRL Report 5341-92-9367, Naval Research Laboratory,Washington, DC, Nov. 1992.
[7] Kay, S. M. (1993)Fundamentals of Statistical Signal Processing.Saddle River, NJ: Prentic-Hall, 1993, ch. 15.
[8] Wooding, R. A. (1956)The multivariate distribution of complex normal randomvariables.Biometrika, 43 (1956), 212—215.
[9] Turin, G. L. (1960)The characteristic function of Hermitian quadratic formsin complex normal variables.Biometrika, 47 (1960), 199—201.
[10] Conte, E., and Longo, M. (1987)Characterization of radar clutter as a spherically invariantrandom process.IEE Proceedings, 134, Pt. F, 2 (1987), 191—197.
[11] Conte, E., DiBisceglie, M., Longo, M., and Lops, M. (1995)Canonical detection in spherically invariance noise.IEEE Transactions on Communications, 43, 2/3/4 (1995),416—424.
[12] Goldman, J. (1976)Detection in the presence of spherically symmetricrandom vectors.IEEE Transactions on Information Theory, IT-22, 1 (1976),52—59.
[13] Rangaswamy, M., Weiner, D., and Ozturk, A. (1993)Non-Gaussian random vector identification usingspherically invariant random processes.IEEE Transactions on Aerospace and Electronic Systems,29, 1 (1993), 111—124.
[14] Yao, K. (1973)A representation theorem and its applications tospherically-invariant random processes.IEEE Transactions on Information Theory, IT-19, 5 (1973),600—608.
[15] Watson, G. N. (1944)A Treaties on the Theory of Bessel Functions, (2nd ed.).Cambridge, England: Cambridge University Press, 1944.
[16] Luke, Y. L. (1962)Integrals of Bessel Functions.New York: McGraw-Hill, 1962, ch. 2.
Performance Complexity Study of SeveralApproaches to Automatic Target Recognition fromSAR Images
A framework which allows for the direct comparison of
alternate approaches to automatic target recognition (ATR) from
synthetic aperture radar (SAR) images is described and applied
to variants of several ATR algorithms. This framework allows
comparisons to be made on an even footing while minimizing the
impact of implementation details and accounts for variation in
image sizes, in angular resolution, and in the sizes of orientation
windows used for training. Alternate approaches to ATR are
characterized in terms of the best achievable performance as
a function of the complexity of the model parameter database.
Several approaches to ATR from SAR images are described
and the performance achievable by each for a range of database
complexities is studied and compared. These approaches are
based on a likelihood test under a conditionally Gaussian
model, log-magnitude least squared error, and quarter power
least squared error. All approaches are evaluated for a wide
range of parameterizations and the dependence on these
parameters of both the resulting performance and the resulting
database complexity is explored. Databases for all of the
approaches are trained using identical sets of images and their
performance is assessed under identical testing scenarios in
terms of probability of correct classification, confusion matrices,
and orientation estimation error. The results indicate that the
conditionally Gaussian approach outperforms the other two
approaches on average for both target recognition and orientation
estimation, that accounting for radar power fluctuation improves
performance for all three methods, and that the conditionally
Gaussian approach normalized for power delivers average
performance that is equal or superior to all other considered
approaches.
I. INTRODUCTION
Many approaches to performing automatic targetrecognition (ATR) from synthetic aperture radar(SAR) data have been proposed in the literature
Manuscript received December 21, 1999; revised November 29,2000, September 20, 2001, and January 15, 2002; released forpublication January 16, 2002.
IEEE Log No. T-AES/38/2/11448.
Refereeing of this contribution was handled by L. M. Kaplan.
This work was supported in part by the U.S. Army Research Office,Grant DAAH04-95-1-0494, by the Office of Naval Research, GrantN00014-98-1-06-06, and by the Boeing-McDonnell Foundation.
0018-9251/02/$17.00 c° 2002 IEEE
632 IEEE TRANSACTIONS ON AEROSPACE AND ELECTRONIC SYSTEMS VOL. 38, NO. 2 APRIL 2002
and their performance is reported under trainingand testing scenarios with sample data. The relativeperformance of the various approaches, however,can be difficult to assess based upon these empiricalperformance evaluations. This difficulty is due toimplementation details which may vary from onereport to another and which may not achieve optimalresults in the studies to which they are applied. Thesedetails include methods of segmenting target, shadow,and clutter regions, methods of feature extraction,selections of data to use for training and testing thealgorithms, and parameterizations such as angularresolution and the widths of intervals from whichtraining data are selected.Here we seek to provide a framework for the
direct comparison of ATR algorithms and whichpoints to the best parameterization of each approach.Building upon the work of O’Sullivan, et al. [20],several variants of three different approaches to ATRfrom SAR data are compared within this framework.The algorithms compared are a likelihood approachbased on a conditionally Gaussian model [11, 19, 20],a least squared error approach based on log-magnitudeimages [15, 22], and a least squared error approachbased on quarter power images [28]. The comparisonis performed in terms of the relationship betweenalgorithm performance and database complexityafforded by each approach using sets of training andtesting images defined identically for all approaches.As described in [1], ATR performance is highly
dependent upon the range of orientation anglesused for training. The influence of these parameterchoices on a comparison of algorithms is reducedby considering a wide range of angular resolutionsand interval widths from which data is selected fortraining each angular cell. For each approach, theperformance results and overall database complexityunder each combination of parameters is analyzed todetermine the best performance that can be achievedfor any given database complexity. The resultingperformance-complexity curves for all approachesare then directly compared. Database complexity isreported as the logarithm of the number of floatingpoint values per target type which must be trainedand stored in order for the recognition algorithm tooperate. Performance of the various approaches isempirically assessed using publicly released data fromthe Moving and Stationary Target Acquisition andRecognition (MSTAR) program. The performance isreported in terms of average orientation estimationerror, percentage of correctly recognized targets, andconfusion matrices.This method of comparing approaches to ATR
is motivated by information-theoretic notions of thetradeoffs between communication rates and datadistortion. The database complexity, indicating thequantity of data which must be stored and processed,plays a role similar to communication rate and
performance measurements, which indicate thedisparity between the true and inferred targets, playa role similar to distortion. The study is aimed atexploring the capability of the models underlyingthe algorithms employed, so the comparison ofapproaches to ATR is limited in the sense thatalgorithm testing is performed only with imagestaken under conditions which were very similar tothe images used to train. This comparison methodcan also be applied to tests in which the operatingconditions vary.The study is also limited in the sense that optimal
segmentation of the SAR image chips into target,shadow, and background is not considered andthe various approaches are required to adequatelymodel pixels in all three region types. Because theapproaches to ATR may vary in their response tothe relative amounts of these types of pixels, theSAR images are truncated into square subimages ofsix different sizes, the largest of which includes alltarget and shadow pixels and the smallest of whicheliminates substantial portions of the shadow andbackground so the target occupies a larger portion ofthe image chip. Performance results may be expectedto improve for carefully and properly selected targetsegmentations and optimal segmentation depends, inpart, on the recognition algorithm used. Algorithmswhich tend to deliver superior performance withvery small or very large images may be goodcandidates for segmentation strategies which err onthe side of removing or retaining, respectively, pixelswhose classification is in doubt. Many approachesto the segmentation of SAR images have beenreported including those based on statistical basedmethods [26], fractals [12], and neural networks [17].Information-theoretic based approaches include simplethresholding [6, 7], Rissanen’s minimum descriptionlength (MDL) principle [24], and optimal componentselection [5, 21]. The performance-complexity methodof comparing alternate approaches to ATR canaccommodate such methods of segmentation, alternatemodel representations, etc., and this work establishesa performance baseline against which performanceimprovements of such alternates can be measured. Adirect extension of this framework to other complexitymeasures, such as chip processing rate [4], and tothe comparison of other approaches to ATR such asscattering center approaches [2, 27], neural networkbased approaches [25], and enhanced-resolution-basedapproaches [16] is also possible.Robustness to deviations from model assumptions
are an important issue in ATR. It is desirable for analgorithm to be robust with respect to many typesof deviation including the presence of clutter, radargain, partial occlusion, vehicle modifications, andthe presence of confuser vehicles (target classespresent in the set of testing images but for whichtraining data does not exist). ATR algorithms have
CORRESPONDENCE 633
the potential to be robust with respect to some ofthese and not to others. Preference for one algorithmover another is likely to be influenced by the choiceof robustness dimensions. A comparison in termsof the performance-complexity behavior of alternatealgorithms can be carried out with test data selected totypify the dimensions of concern.Section II describes in detail the models for SAR
data which are considered. Section III details thealgorithms for target recognition and orientationestimation that are derived from the SAR datamodels. Section IV looks at the performance ofeach of the algorithms when orientation is finelydiscretized. Section V contains a full performanceversus complexity study for all of the algorithms.Conclusions follow in Section VI.
II. MODELS FOR SYNTHETIC APERTURE RADARDATA
This section contains a discussion of the modelsunderlying the conditionally Gaussian, log-magnitudeleast squared error, and quarter power least squarederror approaches. Estimation of the parameters of eachmodel from training data is also considered. Commonto all three approaches is the use of a dictionary ofestimated values, or templates, which characterizeproperties of the SAR images of each target classat multiple orientations. The notation employs arepresentation of a complex-valued SAR image ofsize m£ n as a column vector of length mn obtainedby concatenating the values of successive rows andcolumns of the image.
A. Conditionally Gaussian Model
In the conditionally Gaussian model [20], thepixels in a SAR image are modeled as independent,complex, conditionally Gaussian random variablesgiven the target class a and orientation µ 2 [0,2¼).Specifically, the SAR data are modeled as the vectorr= s(µ,a) +w, where the signal s is a complexGaussian signal vector conditioned on fµ,ag withmean 0 and diagonal covariance matrix K(µ,a),and the receiver noise w is also complex Gaussianwith mean 0 and covariance N0I and is independentof the signal s. The received vector r is complexconditionally Gaussian with mean 0 and diagonalcovariance matrix ¾2(µ,a) =K(µ,a)+N0I. Thelog-likelihood of r given fµ,ag is a summation overall pixels as
l(r j µ,a) =Xi
·¡ ln(¾2i (µ,a))¡
jrij2¾2i (µ,a)
¸(1)
where ¾2i (µ,a) is the ith diagonal element of ¾2(µ,a).
Model training amounts to estimating the pixelvariances ¾2i (µ,a) which are the only unknowns in (1).
Because the mean value of every pixel is assumed tobe zero, an unbiased estimate for pixel variance givena target and orientation is the sample mean of thesquared magnitude of pixel values given fµ,ag. Sincesufficient training data is not likely to be availableat each possible value of the continuous variableµ, the variance functions ¾2i (µ,a) are approximatedas piecewise constant over some finite number ofwindows Nw. The variance over the kth window isestimated from the training data which comes fromimages of targets with azimuth angles lying in aninterval Wk centered at 2¼k=Nw and having a widthd, Wk = [2¼k=Nw¡ d=2,2¼k=Nw+ d=2]. Note that ford > 2¼=Nw the training intervals will overlap and apixel from a given training image may contributeto the variance estimate for more than one azimuthwindow. Given sets of training data Ik,a which consistof SAR images of target a at azimuth µ 2Wk, thevariance of the ith pixel over the kth window for thelth target is estimated as
¾2i (µk,al) =1jIk,aj
Xr2I
k,a
jrij2, 1· k ·Nw, 1· l · t
(2)
where t is the number of targets in the dictionary.The power emitted by a SAR platform is subject
to fluctuation so that the pixel values in a SARimage of a target may be uniformly scaled by someunknown quantity. The model for a received SARimage can be extended to incorporate such fluctuationvia the maximum-likelihood estimate of the power.Specifically, we model the SAR image obtained undernominal transmitter power as y; let r= cy denote theSAR image obtained with some other transmitterpower, where c is an unknown deterministic scalefactor. The received vector r is a complex Gaussianrandom vector with mean 0 and diagonal covariancematrix c2¾2(µ,a) and the maximum-likelihoodestimate for c2 is
c2(µ,a) =1N
Xi
jrij2¾2i (µ,a)
: (3)
Substituting this estimate into the log-likelihoodfunction for r yields
l(r j µ,a) =Xi
·¡ ln(c2¾2i (µ,a))¡
jrij2c2¾2i (µ,a)
¸=¡2N ln c(µ,a)¡
Xi
ln¾2i (µ,a)¡N: (4)
Note that what constitutes the nominal transmitterpower is quite arbitrary since it is accommodated bythe estimated multiplicative factor c. In practice wecan take this nominal power to be that of the SARplatform from which the training images Ik,a werecollected.
634 IEEE TRANSACTIONS ON AEROSPACE AND ELECTRONIC SYSTEMS VOL. 38, NO. 2 APRIL 2002
B. Log-Magnitude Model
In the log-magnitude model, the complex valuedpixels in a SAR image are modeled as independentand having a squared magnitude which follows alog-normal distribution conditioned on target typeand orientation. The log-normal distribution hasbeen suggested for use in radar applications, forexample [10] and [23, p. 183]. This is analogousto the advanced methods employed in [15, 16, 22]in the sense that the likelihood function for thisdistribution yields the same decision function asemployed there, though these also incorporate handsegmentation of models, superresolution techinques,and threshold-based confuser rejection. Accordingto this model, the image in decibel representationhas mean ¹dB(µ,a) and the variance of each pixel isconstant across all pixels, targets, and orientations.Then for a received SAR image r, the pixels in20log jrj ¡¹dB(µ,a), where j ¢ j is the pixel-wisemagnitude and the logarithm is applied pixel-wise,are Gaussian random variables that are independentand identically distributed having mean zero andvariance ¾2. In this case, the log-likelihood of rdB =20log jrj given fµ,ag is the negative of the sum overall pixels of the squared difference between rdB and¹dB(µ,a). Maximizing this log-likelihood over fµ,ag isequivalent to minimizing the squared distance betweena received SAR image rdB and the mean vector forsome fµ,ag defined by
d2(rdB,¹dB(µ,a)) = krdB¡¹dB(µ,a)k2 (5)
where k ¢ k2 equals the sum of the squaredcomponents.With the goal of producing a recognition system
which is less sensitive to fluctuations in the radartransmitter and receiver on successive uses, the use ofimage normalization prior to the distance computationin (5) has been suggested. In the geometric meanapproach to normalization, the squared magnitudevector jrj2 is divided by its geometric mean priorto representation in decibels. This is equivalent tosubtracting the arithmetic mean in the decibel scale.The resulting pixels are no longer independent,however in keeping with the form of (5), the squareddistance used as a score function indicating how muchthe received vector appears to come from target a atorientation µ is
where x is the average value across all components ofthe vector x.Model training for these approaches consists of
estimating the mean vectors ¹dB(µ,a). Estimatesfor these mean vector functions can be obtainedfrom the sample mean of the magnitude in decibels
given fµ,ag. As with the variance functions inthe conditionally Gaussian model, it is useful toapproximate the mean vector functions as piecewiseconstant in µ over some finite number of windowsNw. The mean over the kth window is estimatedby averaging sample vectors that come from atarget having an azimuth angle in the interval Wk =[2¼k=Nw¡ d=2,2¼k=Nw+ d=2] for some interval widthd. Given sets of training images Ik,a which consist ofSAR images of target a at azimuth µ 2Wk, the meanof the ith pixel over the kth window for the lth targetis estimated as
¹i(µk,al) =1jIk,aj
Xr2I
k,a
20log jrij,
1· k ·Nw, 1· l · t (7)
where t is the number of targets in the dictionary.
C. Quarter Power Model
In the quarter power approach, the magnitudeof the complex pixels in a SAR image are modeledas gamma distributed random variables. It has beennoted [8] that for a gamma random variable g, thetransformation z = g® for some ® 2 (0,1) yieldsa random variable which is similar to a Gaussianrandom variable in the sense that the kurtosis of z,E[(z¡¹z)4]=E2[(z¡¹z)2], is approximately 3 which isthe kurtosis for a Gaussian random variable. In thequarter power approach, the value used is ®= 1=2and the square root of the magnitude of each pixelin a SAR image is modeled as having some meanvalue ¹QP(µ,a) which is a function of both orientationand target. The squared distance between the quarterpower representation of a received SAR image rQP =jrj1=2, where j ¢ j1=2 indicates the pixel-wise squareroot of the magnitude, and the mean vector for somefµ,ag,
d2(rQP,¹QP(µ,a)) = krQP¡¹QP(µ,a)k2 (8)
is used as a score function indicating how much theimage appears to be that of target a at orientation µ.As with the other approaches, a form of
normalization of r can be invoked in an attempt toreduce the sensitivity of the recognition algorithmto fluctuations in radar performance. Here, thevectors rQP and ¹QP(µ,a) are normalized to haveunit magnitude. In keeping with the form of (8), thesquared distance
d2(rQP=krQPk,¹QP(µ,a)=k¹QP(µ,a)k)
=
°°°°° rQPkrQPk
¡ ¹QP(µ,a)
k¹QP(µ,a)k
°°°°°2
(9)
is used as a score function.
CORRESPONDENCE 635
Model training in this case consists of estimatingthe mean vectors ¹QP(µ,a). Estimates for these meanvector functions can be obtained from the samplemean of the quarter power given fµ,ag. Again, weapproximate the mean vector functions as piecewiseconstant in µ. Given sets of training images Ik,a whichconsist of SAR images of target a at azimuth µ 2Wk,the mean of the ith pixel over the kth window for thelth target is estimated as
¹i(µk,al) =1jIk,aj
Xr2I
k,a
jrij1=2, 1· k ·Nw, 1· l · t
(10)
where t is the number of targets in the dictionary.
III. ESTIMATION AND RECOGNITION ALGORITHMS
This section contains a brief discussion of themeasure of orientation error used in this work andthen considers various methods for inferring a targetclass a(r) corresponding to a SAR image r andestimating the orientation of the target in the imagegiven the trained models discussed in Section II.This section concludes with a description of the SARimage data used for assessing the performance of thevarious approaches and the empirical measures ofperformance which are employed.
A. Orientation Distance Measures
At any given time, a target has an orientationin 3-dimensional space that can be represented bya rotation matrix which is an element of SO(3),the special orthogonal group of dimension 3. Forground-based targets on a horizontal surface, theorientation can be represented by a rotation matrixwhich is an element of SO(2). The orientation of atarget in SO(2) can be thought of as a function ofthe azimuth angle µ of the target relative to a radarplatform with known depression angle. The matrixrepresentation in SO(2) corresponding to angle µ is
O(µ) =·cosµ ¡sinµsinµ cosµ
¸: (11)
The squared Hilbert—Schmidt distance betweentwo matrices is defined as the sum of the squareddifference between the entries of the two matrices. Forany two angles µ1 and µ2,
We use the squared Hilbert—Schmidt distanced2HS(Otrue,O(r)) between the true orientation of atarget, Otrue, and any estimate, O(r), as a measureof the squared error and report the average of thissquared distance over the testing set as the averagesquared error e2HS. The average estimation error
is also reported as the equivalent error in degrees,cos¡1(1¡ e2HS=4), to aid in interpreting the results.
B. Algorithms for the Conditionally Gaussian Model
Orientation estimates under the conditionallyGaussian model can be obtained through theHilbert—Schmidt estimator which is the orientationthat minimizes the mean of the squared estimationerror conditioned on the received vector r and thetarget class a. Since the conditional probabilitydensity function p(O j r,a)/ p(r jO,a)p(O j a), theHilbert—Schmidt estimator can be written as
OHS(r) = argminO2SO(2)
ZSO(2)
kO0 ¡Ok2HS
£p(r jO0,a)p(O0 j a)°(dO0) (13)
where ° is the base measure on SO(2) and the formof p(r jO,a) is known from Section IIA. Expressingthis integral in terms of µ and simplifying yields anexpression for the Hilbert—Schmidt estimator for targetazimuth
Finally, since the covariance function ¾2(µ,a) is notknown but approximated as piecewise constant withestimated values ¾2i (µk,a) from (2), the probabilitydensity function used is also piecewise constantin µ and proportional to the exponential of thelog-likelihood in (1) or (4), depending on whetherpower normalization is employed. Then the aboveintegrals can be reduced to summations over theazimuth windows Wk, and with a uniform prior onorientation and with azimuth windows of uniformwidth, the estimator becomes
µHS(r) = tan¡1"P
k sin(µk)exp[l(r j µk,a)]Pk cos(µk)exp[l(r j µk,a)]
#:
(15)
A Bayesian approach to ATR can be utilized underthe conditionally Gaussian model by selecting thetarget class a(r) which maximizes the conditionalprobability P(a j r)/ p(r j a)P(a). We already havean expression for p(r jO,a) so we write p(r j a) as amarginal probability density over all orientations andselect a target class according to
aBayes(r) = argmaxa
P(a)ZSO(2)
p(r jO,a)p(O)°(dO):(16)
Given an estimated log-likelihood function l(r jO,a)that is piecewise constant in µ from either (1) or (4),
636 IEEE TRANSACTIONS ON AEROSPACE AND ELECTRONIC SYSTEMS VOL. 38, NO. 2 APRIL 2002
the above integral can be reduced to a summation overall azimuth windows Wk, and with uniform priors onorientation and target type and with uniformly spacedwindows, we can select a target class according to
aBayes(r) = argmaxa
Xk
exp[l(r j µk,a)]: (17)
C. Algorithms for the Log-Magnitude Model
Orientation estimates in the log-magnitude modelare obtained from SAR data r for a given target aby selecting the azimuth angle µ that minimizes thesquared distance between rdB and the mean vectorfunction for a. Given the estimated mean vectorfunction ¹dB(µ,a) from (10), which is piecewiseconstant in µ, the estimate is given as
µLM(r,a) = argminµ
d2(rdB, ¹dB(µ,a)): (18)
In the case that normalization is used, the distancemeasure minimized is d2(rdB¡ rdB,¹dB(µ,a)¡¹dB(µ,a)).ATR in the log-magnitude model from r is
performed by finding the combination of target typea and azimuth angle µ which minimizes the squareddistance between rdB and the corresponding meanvector. That is,
aLM(r) = argmina
minµd2(rdB,¹dB(µ,a)): (19)
In the case that normalization is used, the distancemeasure minimized is d2(rdB¡ rdB,¹dB(µ,a)¡¹dB(µ,a)).
D. Algorithms for the Quarter Power Model
Orientation estimates in the quarter power modelare obtained from SAR data r for a given target aby selecting the azimuth angle µ that minimizes thesquared distance between rQP and the mean vectorfunction for a. Given the estimated mean vectorfunction, ¹QP(µ,a) from (10), which is piecewiseconstant in µ, the estimate is given as
µQP(r,a) = argminµ
d2(rQP, ¹QP(µ,a)): (20)
If the normalization form is used, the distancemeasure minimized is d2(rQP=krQPk,¹QP(µ,a)=k¹QP(µ,a)k).ATR in the quarter power model from r is
performed by finding the combination of target typea and azimuth angle µ which minimizes the squareddistance between rQP and the corresponding meanvector. That is,
aQP(r) = argmina
minµd2(rQP,¹QP(µ,a)): (21)
If the normalization form is used, the distancemeasure minimized is d2(rQP=krQPk,¹QP(µ,a)=k¹QP(µ,a)k).
E. MSTAR Dataset and Empirical Evaluation
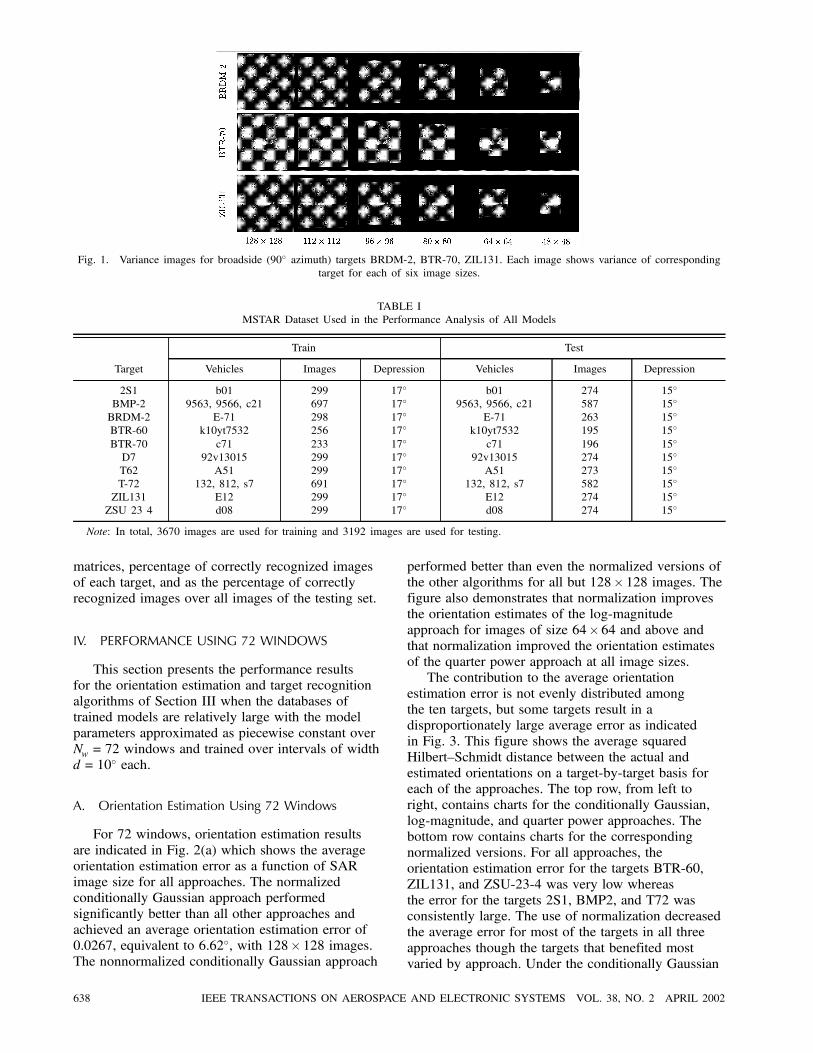
The SAR image data used for the results wepresent were collected under the MSTAR1 programconducted under DARPA funding. The image setcontains X band SAR data for a number of targetsimaged at two or more depression angles. The SARimages in the dataset are of 1 ft by 1 ft resolution.The target lies in the central portion of the chip andoccupies a small portion of it. The rest of the chipconsists of background clutter and target shadow.The results we present include an assessment ofhow the performance of the algorithms varies as afunction of the target chip size which is intendedto accommodate different sensitivities to shadowremoval and excess clutter as the approaches may varyin their ability to model target, shadow, and clutterregions. Smaller image chips of sizes 128£128,112£ 112, 96£ 96, 80£ 80, 64£64, and 48£ 48were constructed by extracting a square region fromthe center of the MSTAR images. Variance imagesfrom the conditionally Gaussian model are shownin Fig. 1 for several of the targets at each of thesix image sizes. As can be seen from the figure,for some targets and some orientations such as theBRDM-2 and BTR-70 shown, decreasing the size ofimages used from 128£ 128 down to 80£ 80 reducesbackground clutter in the image without infringingupon either the target or shadow. Further reductionin image size eliminates more of the clutter pixelsbut also eliminates much of the shadow region. Forsome targets and orientations such as the ZIL131shown, any reduction of the image size eliminatesboth target shadow and image artifacts along with thebackground clutter. As will be shown, each algorithmtends to favor its own particular tradeoff betweenclutter reduction and retention of shadow and artifactpixels which may have implications for segmentationstrategies likely to be useful for each approach.For each target and depression angle, the MSTAR
set contains SAR image data for two to three hundredvalues of target aspect pose. We have divided theseimages into two nonoverlapping sets, one for modeltraining and the other for assessing the performance ofthe various approaches. A summary of the datasetsused is provided in Table I. Orientation estimationperformance is characterized in terms of the averagesquared Hilbert—Schmidt distance between the actualand estimated orientations. This average is computedas a function of target type and as an overall valueacross all 3192 images of the testing set. Recognitionperformance is characterized in terms of confusion
1The MSTAR dataset can be requested through the Sensor DataManagement System (SDMS) web page of Wright Laboratoryat the URL http://www.mbvlab.wpafb.af.mil/public/sdms/ or bycontacting Kelly Miller at AFRL/SNAS, Building 23, 2010 FifthStreet, WPAFB, OH 45433.
CORRESPONDENCE 637
Fig. 1. Variance images for broadside (90± azimuth) targets BRDM-2, BTR-70, ZIL131. Each image shows variance of correspondingtarget for each of six image sizes.
TABLE IMSTAR Dataset Used in the Performance Analysis of All Models
Note: In total, 3670 images are used for training and 3192 images are used for testing.
matrices, percentage of correctly recognized imagesof each target, and as the percentage of correctlyrecognized images over all images of the testing set.
IV. PERFORMANCE USING 72 WINDOWS
This section presents the performance resultsfor the orientation estimation and target recognitionalgorithms of Section III when the databases oftrained models are relatively large with the modelparameters approximated as piecewise constant overNw = 72 windows and trained over intervals of widthd = 10± each.
A. Orientation Estimation Using 72 Windows
For 72 windows, orientation estimation resultsare indicated in Fig. 2(a) which shows the averageorientation estimation error as a function of SARimage size for all approaches. The normalizedconditionally Gaussian approach performedsignificantly better than all other approaches andachieved an average orientation estimation error of0.0267, equivalent to 6:62±, with 128£ 128 images.The nonnormalized conditionally Gaussian approach
performed better than even the normalized versions ofthe other algorithms for all but 128£ 128 images. Thefigure also demonstrates that normalization improvesthe orientation estimates of the log-magnitudeapproach for images of size 64£64 and above andthat normalization improved the orientation estimatesof the quarter power approach at all image sizes.The contribution to the average orientation
estimation error is not evenly distributed amongthe ten targets, but some targets result in adisproportionately large average error as indicatedin Fig. 3. This figure shows the average squaredHilbert—Schmidt distance between the actual andestimated orientations on a target-by-target basis foreach of the approaches. The top row, from left toright, contains charts for the conditionally Gaussian,log-magnitude, and quarter power approaches. Thebottom row contains charts for the correspondingnormalized versions. For all approaches, theorientation estimation error for the targets BTR-60,ZIL131, and ZSU-23-4 was very low whereasthe error for the targets 2S1, BMP2, and T72 wasconsistently large. The use of normalization decreasedthe average error for most of the targets in all threeapproaches though the targets that benefited mostvaried by approach. Under the conditionally Gaussian
638 IEEE TRANSACTIONS ON AEROSPACE AND ELECTRONIC SYSTEMS VOL. 38, NO. 2 APRIL 2002
Fig. 2. Performance comparison for each of the approaches when model parameters are approximated as piecewise constant over 72windows and trained over intervals of width 10± each. (a) Average squared Hilbert-Schmidt distance between actual and estimated
orientations as function of target chip size; smaller values denote better performance. (b) Overall percentage of correctly classified testimages as function of target chip size; larger values denote better performance.
Fig. 3. Average orientation error by target at best performing image size for each of the models; smaller values denote betterperformance. From left to right, top row shows performance for conditionally Gaussian approach with 96£ 96 images, log-magnitudeapproach at 80£ 80, and quarter power approach at 128£ 128. Bottom row shows results from normalized versions of these approaches
at 128£ 128, 96£ 96, and 128£ 128 images, respectively.
approach, the 2S1 performed slightly worse withnormalization but still better than for any variantof the log-magnitude or quarter powerapproaches.Much of the average orientation estimation error is
due to a few estimates which are nearly 180± fromthe true orientation, implying that some images oftargets are occasionally interpreted as facing theopposite direction. This is indicated in Fig. 4(a) whichshows a relative frequency histogram of orientationestimation errors for the normalized quarter power
approach. This chart shows that over 95% of theorientation estimates are within 5± of the actualorientation and that over 98% are within 10±. Thereare almost no estimates that are between 20± and170± from the true orientation. The small bar atthe extreme right edge of the chart indicates thataround 1/2% of the estimates are over 175± from theactual orientation. These results are typical for allapproaches as can be seen in Table II which showsthe percentages of estimates which differ from the trueorientation by more than 170± and of those differing
CORRESPONDENCE 639
Fig. 4. Relative frequency histogram showing percentage ororientation estimates that fall within a given distance of the trueorientation for magnitude normalized quarter power approachwhen optimal image size of 128£ 128 is used. The x axes havebeen labeled in terms of the angle, in degrees, which is equivalent
to the resulting average squared Hilbert—Schmidt distance.(a) Histogram data collected over 36 successive 5± intervals
ranging from 0± to 180±. (b) More detailed look at histogram datafrom 0± to 15± in 15 successive 1± intervals.
by more than 175±. The normalized conditionallyGaussian approach results in far fewer errors of thistype.Fig. 4(b) shows the details of the relative
frequency histogram for orientation estimation errorsfrom 0± to 15± for the magnitude normalized quarterpower approach. This chart shows that most of thetarget orientation estimates are within 2± of theactual orientation. This result and the general shapeof the histogram chart are common to allapproaches.
TABLE IIPercentage of Orientation Estimates Which Differ From True Orientation By a Large Amount
Note: The results shown are for the optimum image size for each method.
B. Target Recognition Using 72 Windows
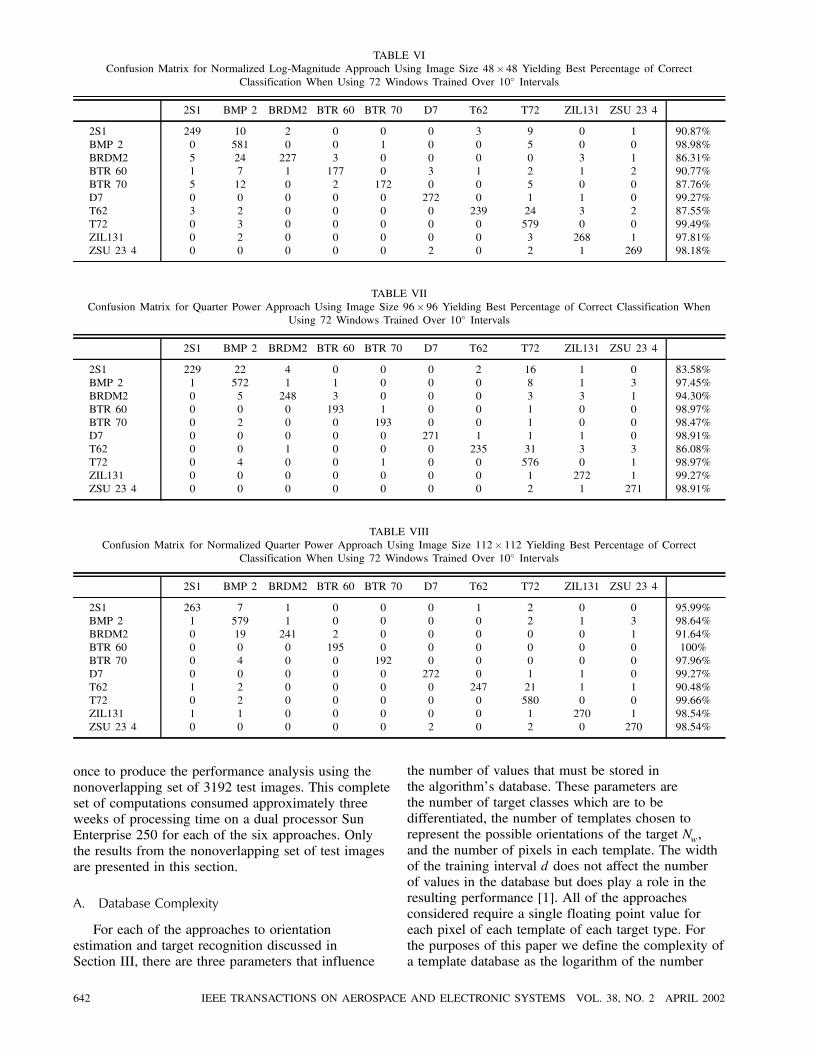
The performance results for target recognitionwith 72 windows are shown in Fig. 2(b). This graphshows the percentage of correctly classified imagesversus image size for all of the approaches to targetrecognition. It can be seen that the normalizedconditionally Gaussian approach produced correctrecognition rates higher than the other approachesfor image sizes less than or equal to 96£ 96 whilethe magnitude normalized quarter power approachproduced higher rates for image sizes greater than orequal to 112£ 112. Furthermore, at 96£96 imagesthe normalized conditionally Gaussian approachachieved a correct recognition rate of 97.7% whichwas the highest rate of all the approaches at anyimage size. The log-magnitude approach and itsnormalized variant performed competitively for48£ 48 images but their performance dropped offconsiderably for larger image sizes. Finally note thatall three normalized variants performed better at allimage sizes than their unnormalized counterparts, withthe largest increases occurring at the largest imagesizes.Exact details of the recognition performance on a
target-by-target basis are provided in Tables III—VIIIwhich give confusion matrices for all approachesat the best performing image size for each method.The targets BMP2, D7, and T72 were among the topperformers for each method, whereas the targets 2S1,BRDM2, and T62 were among the worst. Recall fromSection IVA that the targets BMP2 and T72 wereconsistently among the worst performers in terms oforientation estimation error, implying that in generalthere is not a direct relationship between the ability ofthese approaches to correctly recognize a target andtheir ability to estimate its orientation.These confusion matrices for the log-magnitude
and quarter power approaches also indicate thatimages of the targets 2S1 and BRDM2 werecommonly misclassified as BMP2 and that images oftargets 2S1 and T62 were commonly misclassifiedas T72. Both normalized approaches increasedthe recognition rate of the 2S1 by more than 10percentage points and increased the recognition rateof the T62 by 2 to 4 percentage points. Under thelog-magnitude approach, normalization also resulted
640 IEEE TRANSACTIONS ON AEROSPACE AND ELECTRONIC SYSTEMS VOL. 38, NO. 2 APRIL 2002
TABLE IIIConfusion Matrix for Conditionally Gaussian Approach Using 80£ 80 Pixel SAR Images With 72 Windows Trained Over 10± Intervals
Note: Row headings give the true target class for each of the test images represented in the row. For each row, the number in eachcell indicates the number of test images which were classified as the corresponding column heading. The rightmost column shows theoverall percentage of correctly classified test images for each target.
TABLE IVConfusion Matrix for Normalized Conditionally Gaussian Approach Using 96£ 96 Pixel SAR Images With 72 Windows Trained Over
in a decrease of the recognition rate of the BTR60by more than 6 percentage points. Under the quarterpower approach, the use of normalization decreasedthe recognition rate of the BRDM2 by more than 2percentage points.
V. PERFORMANCE-COMPLEXITY TRADEOFFS
The relationship between algorithm performanceand database complexity is explored in this section. Toproduce these results, all algorithms were run for 40
combinations of number of windows Nw and traininginterval width d, at 6 different image sizes for a totalof 240 parameter combinations. Fig. 5 shows thecombinations of Nw and d that were included alongwith the legend for the performance-complexity detailplots in this section. The use of databases with imagesizes that vary by target was not considered. Trainingwas performed using the set of 3670 training imagesdescribed in Table I for all parameter combinations,and testing was performed twice, once as a checkof proper operation using the training set itself and
CORRESPONDENCE 641
TABLE VIConfusion Matrix for Normalized Log-Magnitude Approach Using Image Size 48£ 48 Yielding Best Percentage of Correct
Classification When Using 72 Windows Trained Over 10± Intervals
once to produce the performance analysis using thenonoverlapping set of 3192 test images. This completeset of computations consumed approximately threeweeks of processing time on a dual processor SunEnterprise 250 for each of the six approaches. Onlythe results from the nonoverlapping set of test imagesare presented in this section.
A. Database Complexity
For each of the approaches to orientationestimation and target recognition discussed inSection III, there are three parameters that influence
the number of values that must be stored inthe algorithm’s database. These parameters arethe number of target classes which are to bedifferentiated, the number of templates chosen torepresent the possible orientations of the target Nw,and the number of pixels in each template. The widthof the training interval d does not affect the numberof values in the database but does play a role in theresulting performance [1]. All of the approachesconsidered require a single floating point value foreach pixel of each template of each target type. Forthe purposes of this paper we define the complexity ofa template database as the logarithm of the number
642 IEEE TRANSACTIONS ON AEROSPACE AND ELECTRONIC SYSTEMS VOL. 38, NO. 2 APRIL 2002
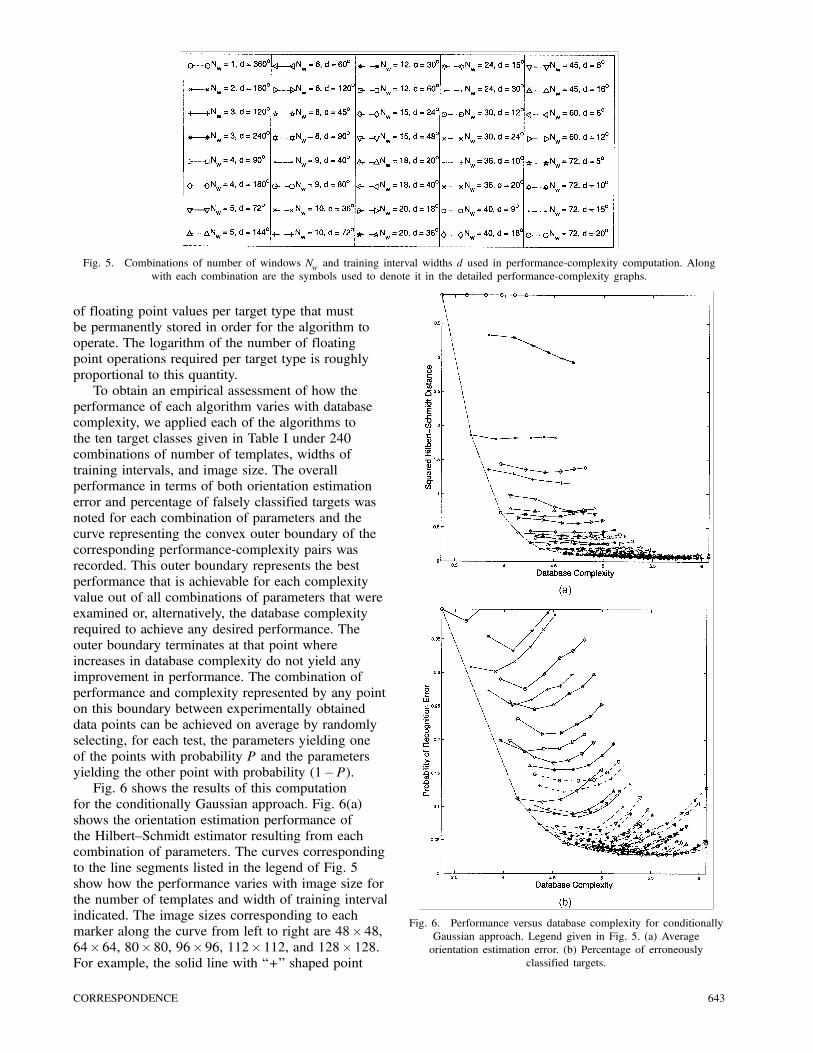
Fig. 5. Combinations of number of windows Nw and training interval widths d used in performance-complexity computation. Alongwith each combination are the symbols used to denote it in the detailed performance-complexity graphs.
of floating point values per target type that mustbe permanently stored in order for the algorithm tooperate. The logarithm of the number of floatingpoint operations required per target type is roughlyproportional to this quantity.To obtain an empirical assessment of how the
performance of each algorithm varies with databasecomplexity, we applied each of the algorithms tothe ten target classes given in Table I under 240combinations of number of templates, widths oftraining intervals, and image size. The overallperformance in terms of both orientation estimationerror and percentage of falsely classified targets wasnoted for each combination of parameters and thecurve representing the convex outer boundary of thecorresponding performance-complexity pairs wasrecorded. This outer boundary represents the bestperformance that is achievable for each complexityvalue out of all combinations of parameters that wereexamined or, alternatively, the database complexityrequired to achieve any desired performance. Theouter boundary terminates at that point whereincreases in database complexity do not yield anyimprovement in performance. The combination ofperformance and complexity represented by any pointon this boundary between experimentally obtaineddata points can be achieved on average by randomlyselecting, for each test, the parameters yielding oneof the points with probability P and the parametersyielding the other point with probability (1¡P).Fig. 6 shows the results of this computation
for the conditionally Gaussian approach. Fig. 6(a)shows the orientation estimation performance ofthe Hilbert—Schmidt estimator resulting from eachcombination of parameters. The curves correspondingto the line segments listed in the legend of Fig. 5show how the performance varies with image size forthe number of templates and width of training intervalindicated. The image sizes corresponding to eachmarker along the curve from left to right are 48£ 48,64£ 64, 80£ 80, 96£ 96, 112£ 112, and 128£ 128.For example, the solid line with “+” shaped point
Fig. 6. Performance versus database complexity for conditionallyGaussian approach. Legend given in Fig. 5. (a) Averageorientation estimation error. (b) Percentage of erroneously
classified targets.
CORRESPONDENCE 643
Fig. 7. Performance versus database complexity for conditionallyGaussian approach. Legend given in Fig. 5. (a) Averageorientation estimation error. (b) Percentage of erroneously
classified targets.
markers shows that for 3 templates each trained overan interval of 120±, the average orientation estimationerror decreases uniformly with increasing image sizefrom nearly 1.4 for 48£ 48 images down to around1.2 for 128£ 128 images. The database complexityfor this combination of parameters grows uniformlyfrom around 3.8 for 48£ 48 images to 4.7 for 128£128 images. Fig. 6(b) shows the recognition errorrate for each combination of parameters. Figs. 7—11show the computation results for the other fiveapproaches.These figures show that for all of the six
approaches and for both orientation estimation andtarget recognition, at small complexities the largest
Fig. 8. Performance versus database complexity log-magnitudeapproach. Legend given in Fig. 5. (a) Average orientation
estimation error. (b) Percentage of erroneously classified targets.
increases in performance come from increasing thenumber of templates in the database rather thanincreasing image size. Also for all approaches,increases in performance tend to taper off as thedatabase complexity passes 4.5. The figures alsoindicate that at large database complexities it isthe image size and not the number of templatesthat has the largest influence on performance. Inall approaches orientation estimation performanceis less sensitive to image size than is recognitionperformance. At high database complexities, thequarter power and normalized quarter powerapproaches are much less sensitive to variations inimage size than are any of the other approaches.
644 IEEE TRANSACTIONS ON AEROSPACE AND ELECTRONIC SYSTEMS VOL. 38, NO. 2 APRIL 2002
Fig. 9. Performance versus database complexity for normalizedlog-magnitude approach. Legend given in Fig. 5. (a) Averageorientation estimation error. (b) Percentage of erroneously
classified targets.
Finally, note that the particular combination of 72templates per target class with parameters trainedover 5± intervals (denoted by a five-pointed star ona dash-dotted line), which is occasionally reportedin the literature, is for all six approaches one of theworst performing among the highly complex databaseparameterizations.These figures also show some trends in the
orientation estimation and recognition error rateswhen the number of templates per target type andwidth of the template training interval are heldconstant and the image sizes are varied. For manycombinations of targets and pose, nearly all additionalpixels at large image sizes contain clutter. This
Fig. 10. Performance versus database complexity for quarterpower approach. Legend given in Fig. 5. (a) Average orientationestimation error. (b) Percentage of erroneously classified targets.
could potentially bias the results for large images.Both the conditionally Gaussian and quarter powerapproaches tend to have orientation estimationperformance which is relatively insensitive to imagesize and a recognition error rate which dips atthe medium image sizes. This is consistent withclutter degrading performance. Normalization of theconditionally Gaussian and quarter power approachesyields performance which tends to increase withimage size for both orientation estimation and targetrecognition regardless of the number of templatesin the database. Though clutter pixels are notdirectly useful for target classification, their usedoes improve the estimates of power scale factors
CORRESPONDENCE 645
Fig. 11. Performance versus database complexity for normalizedquarter power approach. Legend given in Fig. 5. (a) Averageorientation estimation error. (b) Percentage of erroneously
classified targets.
c, and these in turn improve classification results.The log-magnitude approach tends to have slightlyworse estimation performance with increasing imagesize and shows significant degradation in recognitionperformance with large image sizes. Normalization ofthe log-magnitude approach shows less sensitivity toimage size when the number of templates per targettype is not large, for both orientation estimationand target recognition, but continues to show alarge degradation in recognition performance withincreasing image size when a large number oftemplates is employed.
Fig. 12. Best achievable performance versus database complexityfor all approaches. For both graphs, smaller values denote better
performance.
B. Side-by-Side Comparison
The best achievable performance for all ofthe methods as a function of database complexityis shown in Fig. 12. Fig. 12(a) shows the lowestachievable average orientation estimation error foreach approach and indicates that the normalizedconditionally Gaussian approach delivered betterestimation performance than any of the otherapproaches at all database complexities. Theunnormalized conditionally Gaussian variant was aclose second. The other approaches are relativelyundifferentiated in terms of orientation estimationexcept for database complexities below 4.5 where thelog-magnitude approach performs slightly worse thanthe others.Fig. 12(b) shows the lowest achievable recognition
error rate for each of the methods. This figure showsthat the normalized conditionally Gaussian approachdelivered performance equal to or better than allother methods for all complexities. The normalized
646 IEEE TRANSACTIONS ON AEROSPACE AND ELECTRONIC SYSTEMS VOL. 38, NO. 2 APRIL 2002
log-magnitude approach delivers equivalentperformance over a small range of complexities near4.5. Normalization improved the performance of eachof the three approaches for all complexities with adecrease in error rate of approximately a quarter ofa percentage point for most complexities.
VI. CONCLUSIONS
This study extends to ten classes the performance-complexity results described by O’Sullivan, DeVore,Kedia, and Miller [20], and it extends the studyto five other approaches. Exact descriptions of allalgorithms were presented along with details of themethods by which the empirical results were obtained.None of these six algorithms are suggested for adirect implementation because key elements, such asoptimal segmentation strategy, effects of SAR imageresolution, the effects of varying depression angles,and characterization of performance under extremeconditions are not yet included in this study. Also, thiswork does not address methods of rejecting confuservehicles as do [14, 15]. A framework was presentedwhich provides a direct means of quantifying thecost and benefit, in terms of database complexity andperformance, of various approaches to incorporatingthese elements. This same framework allows for thedirect comparison of differing approaches to ATRfrom SAR images and was demonstrated in a studyof six different algorithms, providing baseline resultsfor each.Normalization of the received SAR image to
account for radar power fluctuation resulted in asignificant increase in target recognition performancebut did not significantly improve orientationestimation capability. The normalized conditionallyGaussian approach delivered superior performance forevery database complexity in both target recognitionand orientation estimation. The approach yielded abest case average orientation estimation error of 6:62±
for 128£128 images with 72 orientation windowsand parameters trained over 10± intervals. The bestcase percentage of correctly classified images was98.75% for 128£ 128 images with 20 orientationwindows and parameters trained over 36± intervals.The normalized variants of the conditionally Gaussianand quarter power approaches delivered their bestperformance with larger image sizes, suggestingthat improved estimates of normalization scalefactors offset the presence of additional clutter, andsegmentation algorithms for those approaches may dowell to retain pixels whose classification is not clear.However, both variants of the log-magnitude approachdelivered their best performance with much smallerimages which suggests that segmentation algorithmsfor those algorithms may do well to disregard pixelswhose classification is ambiguous. The normalizationresults suggest that careful use of the surrounding
scene to more accurately determine fluctuating radarcharacteristics may prove useful in classifying thecontents of the scene.Current efforts are underway to explore the
performance of ATR algorithms as functions ofalternate measures of complexity such as the timeto classify a SAR image chip [4], to compare otherlikelihood-based approaches [3]. Future effortsinclude investigating the use of optimal segmentationstrategies and extending the study to investigatealgorithm behavior under extended operatingconditions [20] in which testing and training dataare gathered under dissimilar conditions. Finally,the incorporation of confuser vehicles into thelikelihood-based approaches and a comparison of theconfuser rejection capability of each of the methodsis planned. One possible model-based approach toconfuser rejection is to set a probability of falserejection for each target class, and reject an imageif the likelihood falls in the resulting critical regionfor the most likely class. Regardless of the confuserrejection method chosen, a non-zero probability offalse rejection will affect the probability of correctclassification.
ACKNOWLEDGMENTS
The authors wish to thank Michael Bryant ofWright Laboratory who provided details about thequarter power approaches evaluated in this paper.
MICHAEL D. DeVOREJOSEPH A. O’SULLIVANElectronic Systems and SignalsResearch Laboratory
Department of Electrical EngineeringBox 1127Washington UniversityOne Brookings Dr.St. Louis, MO 63130-4899
REFERENCES
[1] Bryant, M. L., Worrell, S. W., and Dixon, A. C. (1998)MSE template size analysis for MSTAR data.In E. G. Zelnio (Ed.), Algorithms for Synthetic ApertureRadar Imagery V, Proceedings of SPIE, 3370 (1998),396—405.
[2] Chiang, H. C., Moses, R. L., and Irving, W. W. (1999)Performance estimation of model-based automatic targetrecognition using attributed scattering center features.In Proceedings of the 10th International Conference onImage Analysis and Processing, Sept. 1999.
[3] DeVore, M. D., Lanterman, A. D., and O’Sullivan, J. A.(2000)ATR performance of a Rician model for SAR images.In F. A. Sadjadi (Ed.), Automatic Target Recognition X,Proceedings of SPIE, 4050 (2000).
[4] DeVore, M. D., O’Sullivan, J. A., Chamberlain, R. D., andFranklin, M. A. (2001)Relationships between computational system performanceand recognition system performance.In F. A. Sadjadi (Ed.), Automatic Target Recognition XI,Proceedings of SPIE, 4379 (2001).
CORRESPONDENCE 647
[5] DeVore, M. D., Schmid, N. A., and O’Sullivan, J. A. (2000)Analytical and experimental performance-complexitytradeoffs in ATR.In Proceedings of the Thirty-Fourth Asilomar Conferenceon Signals, Systems, and Computers, Oct. 2000.
[6] Donoho, D. L. (1995)De-noising by soft-thresholding.IEEE Transactions on Information Theory, 41, 33 (May1995), 613—627.
[7] Donoho, D. L., and Johnstone, I. M. (1994)Ideal spatial adaptation by wavelet shrinkage.Biometrika, 81, 3 (1994), 425—455.
[8] Fukunaga, K. (1990)Introduction to Statistical Pattern Recognition (2nd ed.).New York: Academic Press, 1990, 76—77.
[9] Grenander, U., Miller, M. I., and Srivastava, A. (1998)Hilbert-Schmidt lower bounds for estimators on matrix liegroups for ATR.IEEE Transactions on Pattern Analysis and MachineIntelligence, 20, 8 (1998), 790—802.
[10] Heidbreder, G. R., and Mitchell, R. L. (1967)Detection probabilities for log-normally distributedsignals.IEEE Transactions on Aerospace and Electronic Systems,AES-3, 1 (Jan. 1967), 5—13.
[11] Jacobs, S. P., and O’Sullivan, J. A. (2000)Automatic target recognition using sequences of highresolution radar range-profiles.IEEE Transactions on Aerospace and Electronic Systems,36, 2 (Apr. 2000), 364—382.
[12] Kaplan, L. M. (1999)Extended fractal analysis for texture classification andsegmentation.IEEE Transactions on Image Processing, 8, 11 (Nov.1999), 1572—1585.
[13] Kaplan, L. M., Murenzi, R., Asika, E., and Namuduri, K. R.(1998)Effect of signal-to-clutter ratio on template-based ATR.In E. G. Zelnio (Ed.), Algorithms for Synthetic ApertureRadar Imagery V, Proceedings of SPIE, 3370 (1998),408—419.
[14] Mossing, J. C., and Ross, T. D. (1998)An evaluation of SAR ATR algorithm performancesensitivity to MSTAR extended operating conditions.In E. G. Zelnio (Ed.), Algorithms for Synthetic ApertureRadar Imagery V, Proceedings of SPIE, 3370 (1998),554—565.
[15] Novak, L. M., Owirka, G. J., Brower, W. S., and Weaver,A. L. (1997)The automatic target recognition system in SAIP.Lincoln Laboratory Journal, 10, 2 (1997), 187—201.
[16] Novak, L. M., Owirka, G. J., and Weaver, A. L. (1999)Automatic target recognition using enhanced resolutionSAR data.IEEE Transactions on Aerospace and Electronic Systems,35, 1 (1999), 157—175.
[17] Osman, H. M., and Blostein, S. D. (1996)SAR imagery segmentation using probabilisticwinner-take-all clustering.In E. G. Zelnio and R. J. Douglass (Eds.), Algorithms forSynthetic Aperture Radar Imagery III, Proceedings of SPIE,2757 (1996), 217—226.
[18] O’Sullivan, J. A., Blahut, R. E., and Snyder, D. L. (1998)Information-theoretic image formation.IEEE Transactions on Information Theory, 44, 6 (Oct.1998), 2094—2123.
[19] O’Sullivan, J. A., and DeVore, M. D. (1999)Performance analysis of ATR from SAR imagery.In Proceedings of the 33rd Annual Conference onInformation Sciences and Systems, Apr. 1999.
[20] O’Sullivan, J. A., DeVore, M. D., Kedia, V., and Miller,M. I. (2001)Automatic target recognition performance for SARimagery using a conditionally Gaussian model.IEEE Transactions on Aerospace and Electronic Systems,37, 1 (Jan. 2001), 91—108.
[21] O’Sullivan, J. A., and Ryleeva, N. A. (2000)Method for reducing dimensionality in ATR systems.In F. A. Sadjadi (Ed.), Automatic Target Recognition X,Proceedings of SPIE, 4050 (2000).
[22] Owirka, G. J., and Novak, L. M. (1994)A new SAR ATR algorithm suite.In Algorithms for Synthetic Aperture Radar Imagery,Proceedings of SPIE, 2230 (1994), 336—343.
[23] Raemer, H. R. (1997)Radar System Principles.Boca Raton, FL: CRC Press, 1997.
[24] Rissanen, J. (1986)Stochastic complexity and modeling.The Annals of Statistics, 14, 3 (1986), 1080—1100.
[25] Theera-Umpon, N., Khabou, M. A., Gader, P. D., Keller,J. M., Shi, H., and Li, H. (1998)Detection and classification of MSTAR objects viamorphological shared-weight neural networks.In E. G. Zelnio (Ed.), Algorithms for Synthetic ApertureRadar Imagery V, Proceedings of SPIE, 3370 (1998),530—540.
[26] Weisenseel, R. A., Karl, W. C., Castanon, D. A., Power,G. J., and Douville, P. (1999)Markov random field segmentation methods for SARtarget chips.In E. G. Zelnio (Ed.), Algorithms for Synthetic ApertureRadar Imagery VI, Proceedings of SPIE, 3721 (1999),462—473.
[27] Wissinger, J., Washburn, R. B., Friedland, N. S., Nowicki,A., Morgan, D. R., Chong, C., and Fung, R. (1996)Search algorithms for model based SAR ATR.In E. G. Zelnio and R. J. Douglass (Ed.), Algorithms forSynthetic Aperture Radar Imagery III, Proceedings of SPIE,2757 (1996), 279—293.
[28] Worrell, S. W., Parker, S., and Bryant, M. L. (1997)Class separability assessments and MSE algorithmrobustness.In E. G. Zelnio (Ed.), Algorithms for Synthetic ApertureRadar Imagery IV, Proceedings of SPIE, 3070 (1997),294—304.
648 IEEE TRANSACTIONS ON AEROSPACE AND ELECTRONIC SYSTEMS VOL. 38, NO. 2 APRIL 2002