Date post: | 25-Aug-2018 |
Category: |
Documents |
Upload: | duongkhuong |
View: | 213 times |
Download: | 0 times |
Performance Effects of Measurement and Analysis: Project, Product and High Maturity
© 2010 Carnegie Mellon University
James McCurley
Dennis R. Goldenson
CMMI Technology Conference & User Group
Denver, Colorado – November 2010
NO WARRANTY
THIS CARNEGIE MELLON UNIVERSITY AND SOFTWARE ENGINEERINGINSTITUTE MATERIAL IS FURNISHED ON AN “AS-IS" BASIS. CARNEGIEMELLON UNIVERSITY MAKES NO WARRANTIES OF ANY KIND, EITHEREXPRESSED OR IMPLIED, AS TO ANY MATTER INCLUDING, BUT NOTLIMITED TO, WARRANTY OF FITNESS FOR PURPOSE ORMERCHANTABILITY, EXCLUSIVITY, OR RESULTS OBTAINED FROM USEOF THE MATERIAL. CARNEGIE MELLON UNIVERSITY DOES NOT MAKEANY WARRANTY OF ANY KIND WITH RESPECT TO FREEDOM FROMPATENT, TRADEMARK, OR COPYRIGHT INFRINGEMENT.
Use of any trademarks in this presentation is not intended in any way toinfringe on the rights of the trademark holder.
This Presentation may be reproduced in its entirety, without modification, and
`© 2010 Carnegie Mellon University
This Presentation may be reproduced in its entirety, without modification, andfreely distributed in written or electronic form without requesting formalpermission. Permission is required for any other use. Requests forpermission should be directed to the Software Engineering Institute [email protected].
This work was created in the performance of Federal Government ContractNumber FA8721-05-C-0003 with Carnegie Mellon University for the operationof the Software Engineering Institute, a federally funded research anddevelopment center. The Government of the United States has a royalty-freegovernment-purpose license to use, duplicate, or disclose the work, in wholeor in part and in any manner, and to have or permit others to do so, forgovernment purposes pursuant to the copyright license under the clause at252.227-7013.
Today’s Talk
Scope of the presentation
More results from the 2009 high maturity survey in the SEI’s series of measurement & analysis state-of-the-practice sample surveys
• Surveys of appraised organizations in 2008 & high maturity lead appraisers
(HMLAs) in 2009
— Great deal of consistency in replies & statistical relationships
3
Performance Effects of Measurement and Analysis James McCurley & Dennis R. Goldenson CMMI Technology Conference, November 2010
© 2010 Carnegie Mellon University
— Great deal of consistency in replies & statistical relationships
— Based on perspectives of two groups that are often thought to be quite
different
• Focus here today on results linking process performance modeling to
success in achieving organizations’ appraised high maturity level goals
Summary, lessons learned & next steps
Why is This Work Important?
Confusion still exists about what is necessary to meet the high maturity goals of CMMI based process improvement
• & the value of improving measurement capability often isn’t appreciated in
lower maturity organizations
We need more & better measured evidence about the quality & performance outcomes that are possible with CMMI-based process
4
Performance Effects of Measurement and Analysis James McCurley & Dennis R. Goldenson CMMI Technology Conference, November 2010
© 2010 Carnegie Mellon University
performance outcomes that are possible with CMMI-based process improvement
• Especially in these times of limited resources & increasing skepticism
• Without such evidence continued support for CMMI is at increasing risk
The Wider Body of Work
In depth studies• SEI’s series of workshops on measurement & analysis activities in high
maturity organizations
— In-depth presentations by leaders in the field: 5 workshops over 3 years
— Focused initially on value added by CMMI-based process performance
modeling
— Detailed discussions of modeling methods & results
— Additional collaboration within & across organizations
5
Performance Effects of Measurement and Analysis James McCurley & Dennis R. Goldenson CMMI Technology Conference, November 2010
© 2010 Carnegie Mellon University
— Additional collaboration within & across organizations
— (References & URLs are at the end of this presentation)
• Similar work ongoing through SEI Partner Network working group of leading
HMLAs
Wider publication of results
Additional workshops & colloquia (TBD)
Other ideas?
• Let’s talk later!
Sample Surveys
Measurement & analysis state-of-the-practice series since 2006• & occasionally since 1990
• A basis for more broadly based comparisons across programs & organizations
• Focus on value added by CMMI process performance modeling since 2007
— As it varies with the extent of use & understanding of PPMs
— Along with other aspects of measurement & analytical practices
— As well as organizational resources & management support
— 2009 response rate: 55%
6
Performance Effects of Measurement and Analysis James McCurley & Dennis R. Goldenson CMMI Technology Conference, November 2010
© 2010 Carnegie Mellon University
— 2009 response rate: 55%
A little about validity & generalizability of sample surveys…• Candid replies recognizing:
... (Particularly seen in open-ended text responses) ...
— Weak points & need for improvement
— Backsliding over time
— Failure to achieve appraisal goals
• Consistent covariation with performance outcomes
— Business value
— Achieved maturity levels
Today’s Talk
Scope of the presentation
More results from the 2009 high maturity survey in the SEI’s series of measurement & analysis state-of-the-practice sample surveys
• Surveys of appraised organizations in 2008 & high maturity lead appraisers
(HMLAs) in 2009
— Great deal of consistency in replies & statistical relationships
7
Performance Effects of Measurement and Analysis James McCurley & Dennis R. Goldenson CMMI Technology Conference, November 2010
© 2010 Carnegie Mellon University
— Great deal of consistency in replies & statistical relationships
— Based on perspectives of two groups that are often thought to be quite
different
• Focus here today on results linking process performance modeling to
success in achieving organizations’ appraised high maturity level goals
Summary, lessons learned & next steps
How do the Samples differ?
To review from last year...
2008: Sponsors of organizations appraised at maturity level 4 & 5
2009: HMLAs asked to answer from perspective of organizational units
• With which they worked & were most recently appraised for CMMI-based
high maturity status
8
Performance Effects of Measurement and Analysis James McCurley & Dennis R. Goldenson CMMI Technology Conference, November 2010
© 2010 Carnegie Mellon University
• As lead appraisers, appraisal team members, or in a coaching capacity
Still a relatively small number of HMLAs with direct experience at time of 2009 survey
• Realized sample would include HMLA replies about organizations that did
not achieve appraised high maturity goals
• Useful to better understand HMLA reports about use & value added by
analytical approaches & methods used for process performance modeling
among organizations seeking appraised high maturity status
9
Performance Effects of Measurement and Analysis James McCurley & Dennis R. Goldenson CMMI Technology Conference, November 2010
© 2010 Carnegie Mellon University
n=83
The Survey Data Do Not Speak for Themselves
Perceptions & expectations often differ among survey respondents
• & they probably do by maturity level
• e.g., standards about how much is enough to justify a positive answer
We’re not claiming cause & effect
• It’s statistical association at one point in time
• Cause & effect often are recursively reciprocal over time
10
Performance Effects of Measurement and Analysis James McCurley & Dennis R. Goldenson CMMI Technology Conference, November 2010
© 2010 Carnegie Mellon University
• Cause & effect often are recursively reciprocal over time
• Keep this in mind as we review the evidence!
Results described more fully in two SEI technical reports
• CMU/SEI-2008-TR-024
• CMU/SEI-2010-TR-022
• (References & URLs are at the end of this presentation)
Comparable Organization Scope in Both Years
Similar organizational context in the 2008 and 2009 high maturity surveys
• Sector (commercial, contracted new development, in-house or proprietary
development or maintenance, defense contractors, other government
contractors, DoD or military organizations)
• Focus (product or system development, maintenance or sustainment,
acquisition, service provision)
• Engineering discipline (software, systems, hardware, design, test)
11
Performance Effects of Measurement and Analysis James McCurley & Dennis R. Goldenson CMMI Technology Conference, November 2010
© 2010 Carnegie Mellon University
• Engineering discipline (software, systems, hardware, design, test)
• Number of FTE software, hardware or systems engineering employees
They do differ somewhat by country
• More from China & relatively fewer from India
• Possibly since the 2009 engagements are more recent
Synopsis & Implications
As noted last year: Overall results from HMLAs in 2009 are consistent with reports from HM appraisal sponsors in the 2008 survey
Considerable understanding & use of process performance models (PPMs) is evident in both surveys
Judgments about value added by process performance modeling also vary predictably along with variation in:
12
Performance Effects of Measurement and Analysis James McCurley & Dennis R. Goldenson CMMI Technology Conference, November 2010
© 2010 Carnegie Mellon University
predictably along with variation in:
• Understanding & reported use of process performance models
• Use of various analytical methods & management processes
Whether or not the organizations achieved their appraised high maturity goals also varies predictably for the same reasons
We hope to see how & if high maturity organization sponsor perspectives continue to mirror those of HMLAs in future surveys
• With respect to increasing use of analytical techniques to inform decision-making
40%
50%
60%
70%
80%
90%
100%
2009: Statements about the possible results of using process performance modeling
Not applicable
Don't know
Rarely if ever
Occasionally
About half the time
13
Performance Effects of Measurement and Analysis James McCurley & Dennis R. Goldenson CMMI Technology Conference, November 2010
© 2010 Carnegie Mellon University
0%
10%
20%
30%
Better product quality (n=77)
Better project performance
(n=76)
Fewer project failures (n=76)
Better tactical decisions
(n=73)
Better strategic decision
making (n=74)
Frequently
Almost always
Overall Value of PPMs
Extremely valuable:they rely on them extensively
Very valuable:they have obtained much
14
Performance Effects of Measurement and Analysis James McCurley & Dennis R. Goldenson CMMI Technology Conference, November 2010
© 2010 Carnegie Mellon University
they have obtained much useful information from them
Mixed value:they have obtained useful information on occasion
Little or no value
It's been harmful, not helpful
Achieved Maturity Level Varies Too
15
Performance Effects of Measurement and Analysis James McCurley & Dennis R. Goldenson CMMI Technology Conference, November 2010
© 2010 Carnegie Mellon University
n=82
The Two are Closely Related
16
Performance Effects of Measurement and Analysis James McCurley & Dennis R. Goldenson CMMI Technology Conference, November 2010
© 2010 Carnegie Mellon University
This may be the most important graphic in the whole presentation. Why?
What causes what?
Cause & effect are reciprocal over time...
17
Performance Effects of Measurement and Analysis James McCurley & Dennis R. Goldenson CMMI Technology Conference, November 2010
© 2010 Carnegie Mellon University
The Chicken or the Egg?
Cause & effect may be reciprocal over time
• But it doesn’t matter which comes first!
Organizations that find value in their PPMs are more likely to achieve their HM goals
But achieving HM status also affects the likelihood that organizations will find additional value in creating & using an enhanced suite of PPMs
18
Performance Effects of Measurement and Analysis James McCurley & Dennis R. Goldenson CMMI Technology Conference, November 2010
© 2010 Carnegie Mellon University
find additional value in creating & using an enhanced suite of PPMs
• Achieving HM status also affects the use of related analytical methods &
model results to inform business and technical decision making
Some organizations undoubtedly have implemented processes that are consonant with CMMI best practices for other reasons
• Especially early adopters of CMMI
But the fact of the matter is that they are CMMI best practices.
Selected Relationships
Not surprisingly: Strength of relationships with a wide variety of factors are often similar for both:
• Overall value attributed by HMLAs to use of process performance modeling
• Whether or not the organizations achieved their appraised high maturity level goals
They both vary predictably with:
• Understanding & reported use of process performance models
19
Performance Effects of Measurement and Analysis James McCurley & Dennis R. Goldenson CMMI Technology Conference, November 2010
© 2010 Carnegie Mellon University
• Understanding & reported use of process performance models
• Use of various analytical methods & management processes
See the TR & last year’s presentation for more detail about overall value…
• (References & URLs are at the end of this presentation)
What follows here?• The strongest relationships with achievement of high maturity level goals
• Highlighting instances where strength of those relationships differ from comparable relationships with overall value
Healthy PPM Ingredients: Emphasis
How much emphasis does the organization place upon the following in its process performance modeling?
• Accounting for uncertainty and variability in predictive factors and predicted
outcomes
• Factors that are under management or technical control
• Other product, contractual or organizational characteristics, resources or
constraints
20
Performance Effects of Measurement and Analysis James McCurley & Dennis R. Goldenson CMMI Technology Conference, November 2010
© 2010 Carnegie Mellon University
constraints
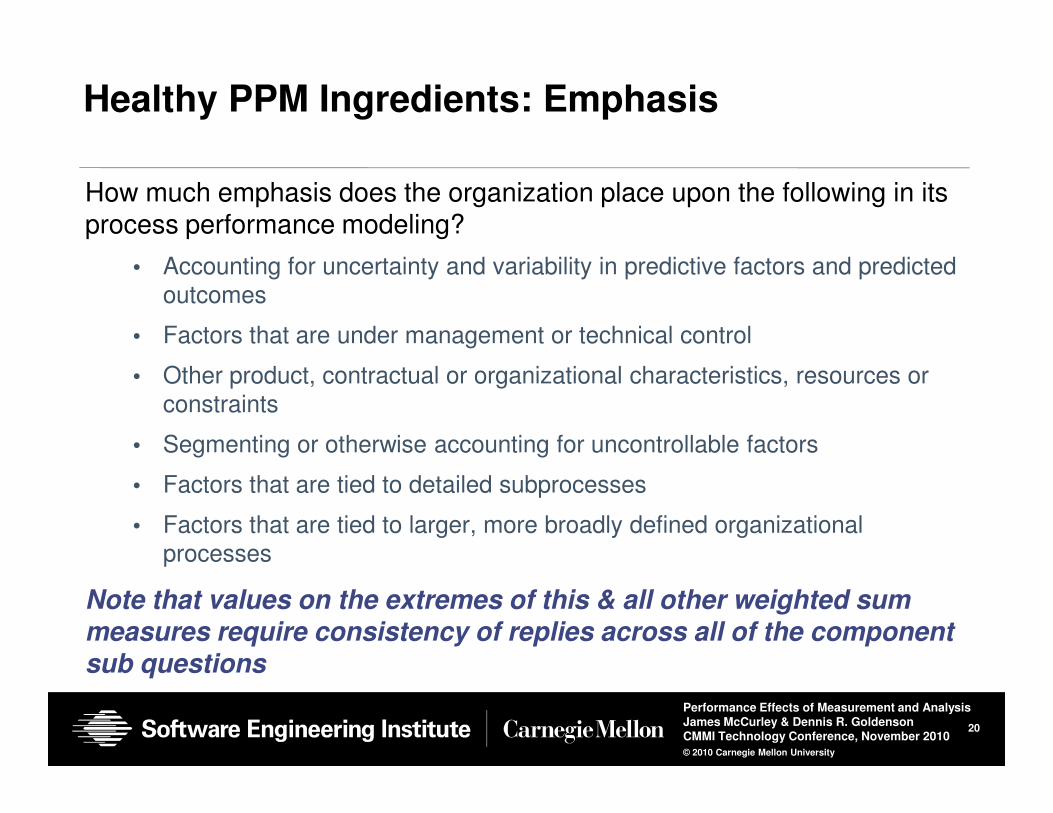
• Segmenting or otherwise accounting for uncontrollable factors
• Factors that are tied to detailed subprocesses
• Factors that are tied to larger, more broadly defined organizational
processes
Note that values on the extremes of this & all other weighted sum measures require consistency of replies across all of the component sub questions
Survey Composite Variables
Many of the relationships described here use composite measures that are based on combinations of several related component questions. Each composite measures is based on the appraisers’ answers to a group of related questions. The possible answers to those questions are ordinal categories such as extensive, substantial, moderate, limited & little if any.
Some of the composite measures are simple counts. Others such as this one are weighted, summed index of the respondents’ answers to each of the questions. Much like a grade-point average, the answers are assigned ordered numeric values that are added and then divided by the number of valid answers to the series of questions for each respondent. For example extensive answers are scored as the value 5, substantial as 4, down to little if any as 1. Hence the values on the extremes of the weighted sum
21
Performance Effects of Measurement and Analysis James McCurley & Dennis R. Goldenson CMMI Technology Conference, November 2010
© 2010 Carnegie Mellon University
substantial as 4, down to little if any as 1. Hence the values on the extremes of the weighted sum measures require consistency of replies across all of their respective component questions. The index scores are separated into categories based on the distribution of the total response values for ease of interpretation.
The weighting & summing are mathematically equivalent to an arithmetic mean; however, also much like a grade point average, the results are rank orders. Such indices are not interval- or ratio-level measures that can be added or multiplied meaningfully.
See Appendix C in CMU/SEI-2010-TR-022 (http://www.sei.cmu.edu/library/abstracts/reports/10tr022.cfm) for further detail.
Relationship Between Healthy PPM Ingredients & Overall Value Attributed to PPMs: Emphasis
Still room for improvement in PPM emphasis
Which does seem to pay off
22
Performance Effects of Measurement and Analysis James McCurley & Dennis R. Goldenson CMMI Technology Conference, November 2010
© 2010 Carnegie Mellon University
Possible answers:
● Extensive● Substantial● Moderate● Limited● Little if any
Interpreting the Mosaics & Gamma
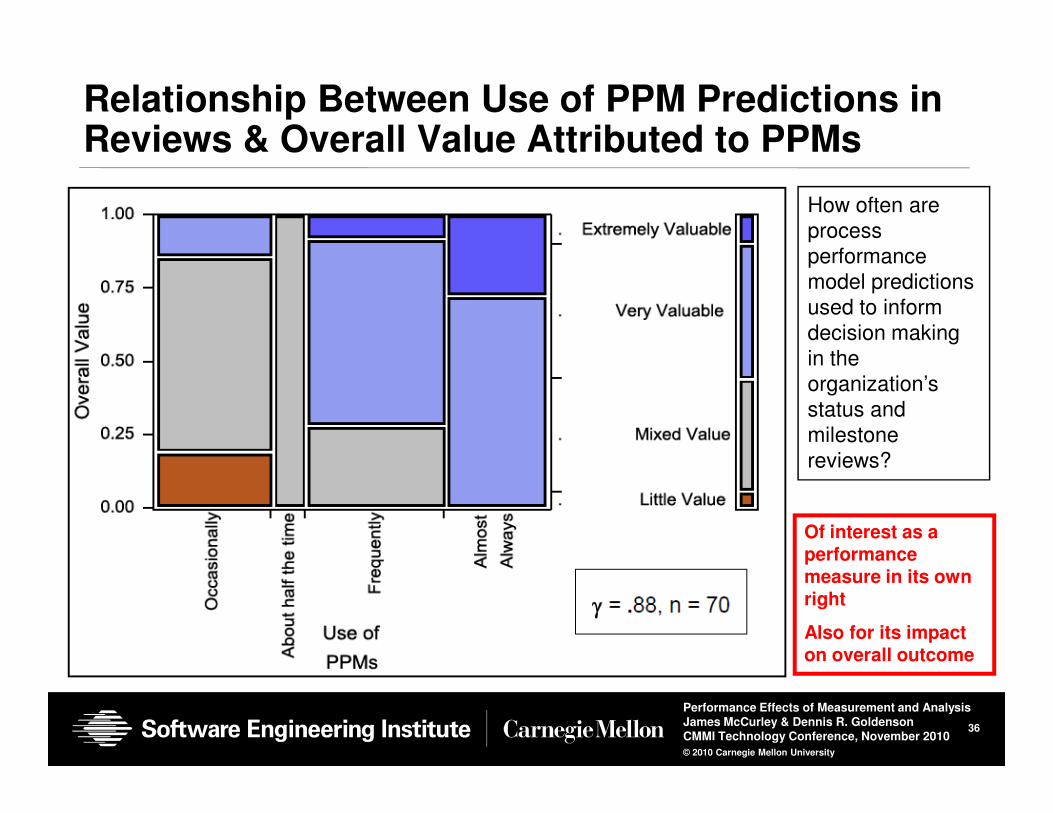
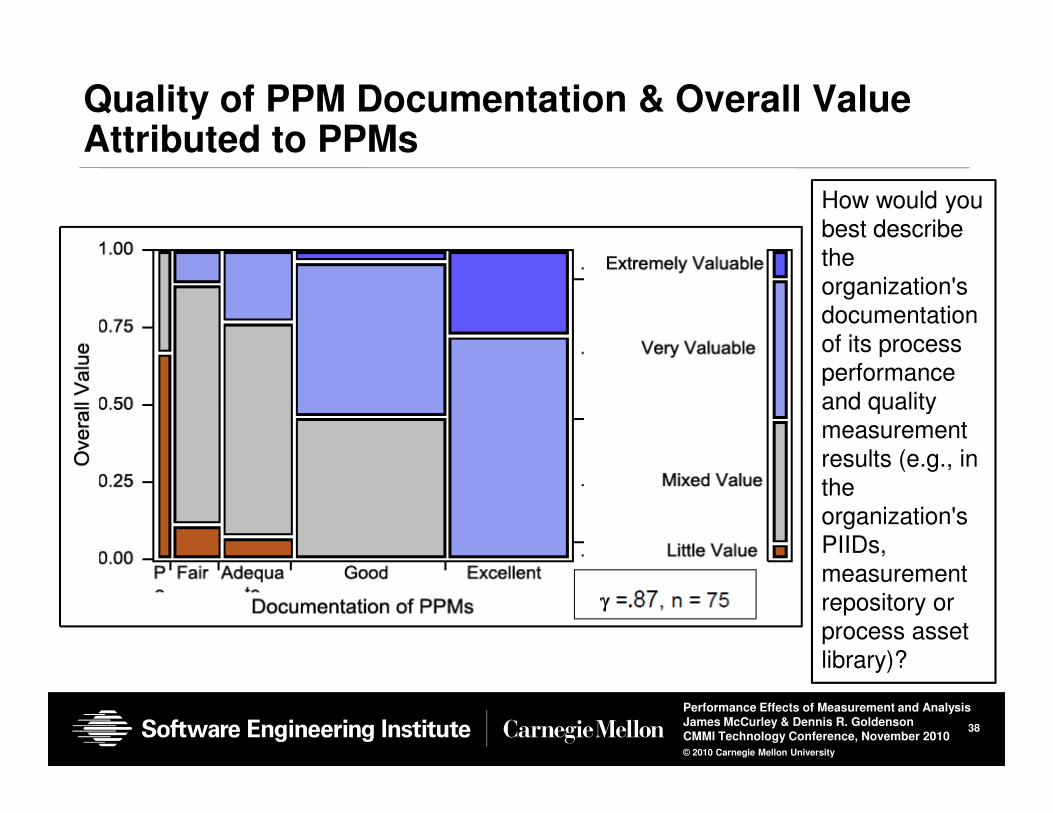
Most of the results described here summarize relationships between two variables. Many of them use a graphical mosaic such as this one to shows the extent to which the survey respondents’ answers vary together in a consistent manner.
The values for each x-variable are displayed along the horizontal axis on the bottom of the mosaic, and labels for the respondents’ answers to the y-factor are displayed to the right of the mosaic on the vertical axis. The proportions of responses for each category of the x-variable are shown in separate columns of the mosaic, where each value of the y-variable is represented in a separate mosaic tile. The width of each column varies in proportion to the number of responses for each category of the x-variable. This can provide a quick sense of how evenly or unevenly the survey answers are distributed.
23
Performance Effects of Measurement and Analysis James McCurley & Dennis R. Goldenson CMMI Technology Conference, November 2010
© 2010 Carnegie Mellon University
provide a quick sense of how evenly or unevenly the survey answers are distributed.
The overall strength of the relationship between the two variables can be described by the value of the gamma statistic. Gamma is an ordinal measure of association that is appropriate for ordered categorical measures such as these. It is symmetric, which means that its value will be the same regardless of which variable is considered to be an x-variable or a y-variable.
The value of gamma is the proportion of paired comparisons where knowing the rank order of one variable reduces the proportionate error in predicting the rank order of the other variable. So, for example, if gamma is .75 then knowing the independent variable reduces our error in predicting the rank of the dependent variable by 75 percent.
See Appendix C in CMU/SEI-2010-TR-022 (http://www.sei.cmu.edu/library/abstracts/reports/10tr022.cfm) for further detail.
Healthy PPM Ingredients & Achievement of Appraisal Maturity Level Goal: Emphasis
24
Performance Effects of Measurement and Analysis James McCurley & Dennis R. Goldenson CMMI Technology Conference, November 2010
© 2010 Carnegie Mellon University
Healthy PPM Ingredients: Purpose
To what degree are your organization’s process performance models used for the following purposes?
• Predict final project outcomes
• Predict interim outcomes during project execution (e.g., connecting
“upstream” with “downstream” activities)
25
Performance Effects of Measurement and Analysis James McCurley & Dennis R. Goldenson CMMI Technology Conference, November 2010
© 2010 Carnegie Mellon University
• Model the variation of factors and understand the predicted range or
variation of the predicted outcomes
• Enable “what-if” analysis for project planning, dynamic re-planning and
problem resolution during project execution
• Enable projects to achieve mid-course corrections to ensure project
success
Relationship Between Healthy PPM Ingredients & Overall Value Attributed to PPMs: Purpose
More do report using PPMs for the right reasons
26
Performance Effects of Measurement and Analysis James McCurley & Dennis R. Goldenson CMMI Technology Conference, November 2010
© 2010 Carnegie Mellon University
Healthy PPM Ingredients & Achievement of Appraisal Maturity Level Goal: Purpose
27
Performance Effects of Measurement and Analysis James McCurley & Dennis R. Goldenson CMMI Technology Conference, November 2010
© 2010 Carnegie Mellon University
Statistical Analysis Methods
To what extent are the following statistical methods used in the organization’s process performance modeling?
• Regression analysis predicting continuous outcomes (e.g., bivariate or
multivariate linear regression or non-linear regression)
• Regression analysis predicting categorical outcomes (e.g., logistic
regression or loglinear models)
28
Performance Effects of Measurement and Analysis James McCurley & Dennis R. Goldenson CMMI Technology Conference, November 2010
© 2010 Carnegie Mellon University
regression or loglinear models)
• Analysis of variance (e.g., ANOVA, ANCOVA or MANOVA)
• Attribute SPC charts (e.g., c, u, p, or np)
• Individual point SPC charts (e.g., ImR or XmR)
• Continuous SPC charts (e.g., XbarR or XbarS)
• Design of experiments
Relationship Between Use of Multiple Statistical Methods & Overall Value Attributed to PPMs
29
Performance Effects of Measurement and Analysis James McCurley & Dennis R. Goldenson CMMI Technology Conference, November 2010
© 2010 Carnegie Mellon University
Use of Multiple Statistical Methods & Achievement of Appraisal Maturity Level Goal
30
Performance Effects of Measurement and Analysis James McCurley & Dennis R. Goldenson CMMI Technology Conference, November 2010
© 2010 Carnegie Mellon University
Simulation/ Optimization Techniques
Which of the following other optimization approaches are used in your organization’s process performance modeling?
• Monte Carlo simulation
• Discrete event simulation for process modeling
• Markov or Petri-net models
31
Performance Effects of Measurement and Analysis James McCurley & Dennis R. Goldenson CMMI Technology Conference, November 2010
© 2010 Carnegie Mellon University
• Probabilistic modeling
• Neural networks
• Optimization
Relationship between # of Simulation/Optimization Techniques used & overall value attributed to PPMs
32
Performance Effects of Measurement and Analysis James McCurley & Dennis R. Goldenson CMMI Technology Conference, November 2010
© 2010 Carnegie Mellon University
# of Simulation/Optimization Techniques Used & Achievement of Appraisal Maturity Level Goal
33
Performance Effects of Measurement and Analysis James McCurley & Dennis R. Goldenson CMMI Technology Conference, November 2010
© 2010 Carnegie Mellon University
Use of Specific Simulation/Optimization Techniques & Achievement of Appraisal ML Goal
It’s not just what techniques you use.It’s how & why you use them…
34
Performance Effects of Measurement and Analysis James McCurley & Dennis R. Goldenson CMMI Technology Conference, November 2010
© 2010 Carnegie Mellon University
γγγγ = .50 γγγγ = .05 γγγγ = -.87γγγγ = .51 γγγγ = .80 γγγγ = 1.0 γγγγ = .91
It’s the uses to which the results are put…
Measurement & analytical methods aren’t all that’s important for achieving high maturity status
Management processes are important too!
• With active participation of the intended users of the measurement results
35
Performance Effects of Measurement and Analysis James McCurley & Dennis R. Goldenson CMMI Technology Conference, November 2010
© 2010 Carnegie Mellon University
• Who in turn are well equipped to understand the results
Relationship Between Use of PPM Predictions in Reviews & Overall Value Attributed to PPMs
How often are
process
performance
model predictions
used to inform
decision making
in the
organization’s
status and
36
Performance Effects of Measurement and Analysis James McCurley & Dennis R. Goldenson CMMI Technology Conference, November 2010
© 2010 Carnegie Mellon University
status and
milestone
reviews?
Of interest as a performance measure in its own right
Also for its impact on overall outcome
Use of PPM Predictions in Status/Milestone Reviews & Achievement of Appraisal ML Goal
37
Performance Effects of Measurement and Analysis James McCurley & Dennis R. Goldenson CMMI Technology Conference, November 2010
© 2010 Carnegie Mellon University
Quality of PPM Documentation & Overall Value Attributed to PPMs
How would you
best describe
the
organization's
documentation
of its process
performance
and quality
38
Performance Effects of Measurement and Analysis James McCurley & Dennis R. Goldenson CMMI Technology Conference, November 2010
© 2010 Carnegie Mellon University
and quality
measurement
results (e.g., in
the
organization's
PIIDs,
measurement
repository or
process asset
library)?
Quality of PPM Documentation & Achievement of Maturity Level Appraisal Goal
39
Performance Effects of Measurement and Analysis James McCurley & Dennis R. Goldenson CMMI Technology Conference, November 2010
© 2010 Carnegie Mellon University
Relationship Between Managers’ Understanding of Model Results & Overall Value Attributed to PPMs
How well do
the
managers in
the
organization
who use
process
40
Performance Effects of Measurement and Analysis James McCurley & Dennis R. Goldenson CMMI Technology Conference, November 2010
© 2010 Carnegie Mellon University
process
performance
model results
understand
the results
that they
use?
Relationship Between Managers’ Understanding of Model Results & Achievement of ML Goal
41
Performance Effects of Measurement and Analysis James McCurley & Dennis R. Goldenson CMMI Technology Conference, November 2010
© 2010 Carnegie Mellon University
γγγγ = .78, n = 70
Stakeholder Involvement
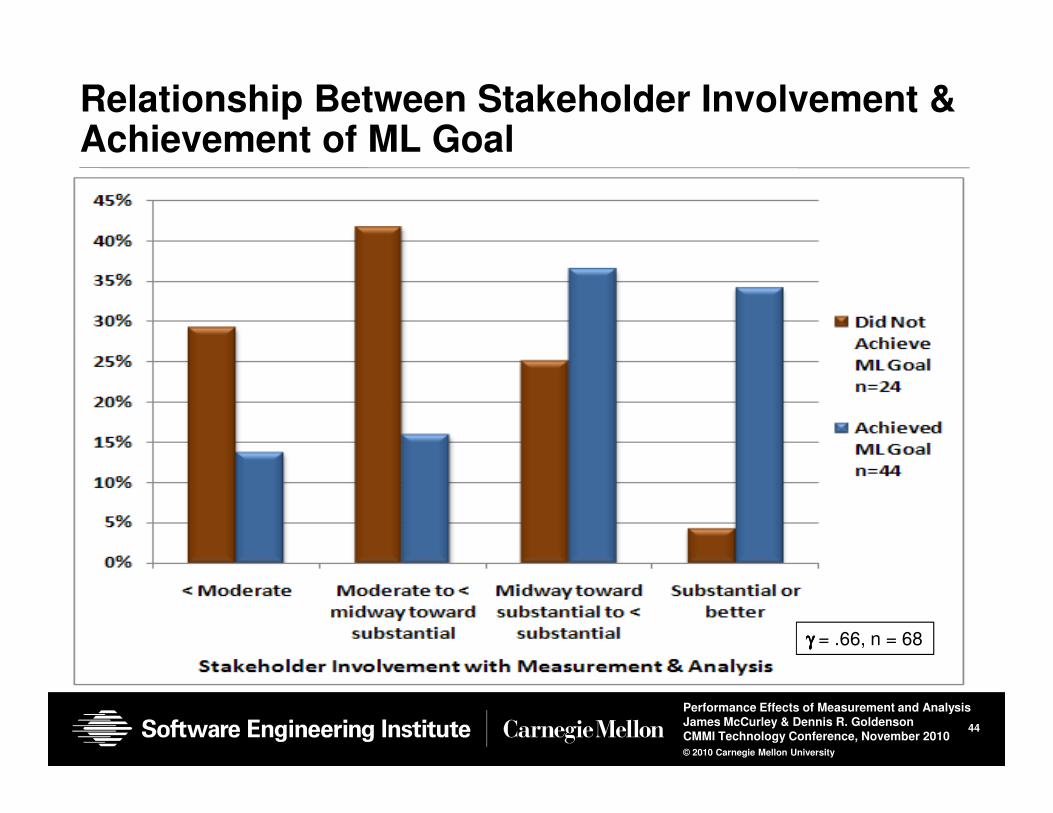
How would you characterize the involvement of various potential stakeholders in setting goals and deciding on plans of action for measurement and analysis in your organization?
• Customers
• Executive and senior managersAs per GQ(I)M
Measurement & Analysis SG1, SP1
42
Performance Effects of Measurement and Analysis James McCurley & Dennis R. Goldenson CMMI Technology Conference, November 2010
© 2010 Carnegie Mellon University
• Middle managers (e.g., program or product line)
• Project managers
• Project engineers and other technical staff
• Process and quality engineers
• Measurement specialists
Analysis SG1, SP1
As well as GP 2.7
Relationship Between Stakeholder Involvement & Overall Value Attributed to PPMs
43
Performance Effects of Measurement and Analysis James McCurley & Dennis R. Goldenson CMMI Technology Conference, November 2010
© 2010 Carnegie Mellon University
Relationship Between Stakeholder Involvement & Achievement of ML Goal
44
Performance Effects of Measurement and Analysis James McCurley & Dennis R. Goldenson CMMI Technology Conference, November 2010
© 2010 Carnegie Mellon University
γγγγ = .66, n = 68
Relation Between Quality of Project Manager Training & Overall Value Attributed to PPMs
How would you
best characterize
the measurement
related training
that is available
45
Performance Effects of Measurement and Analysis James McCurley & Dennis R. Goldenson CMMI Technology Conference, November 2010
© 2010 Carnegie Mellon University
that is available
(for project
managers) in the
organization?
γγγγ = .66, n= .73
Relation Between Quality of Project Manager Training & Achievement of ML Goal
46
Performance Effects of Measurement and Analysis James McCurley & Dennis R. Goldenson CMMI Technology Conference, November 2010
© 2010 Carnegie Mellon University
γγγγ = .61, n = 70
Today’s Talk
Scope of the presentation
More results from the 2009 high maturity survey in the SEI’s series of measurement & analysis state-of-the-practice sample surveys
Summary, lessons learned & next steps
47
Performance Effects of Measurement and Analysis James McCurley & Dennis R. Goldenson CMMI Technology Conference, November 2010
© 2010 Carnegie Mellon University
Summary of Results1
Overall value of process performance modeling & related activities was judged to be more valuable for organizations that:
• Understood & used measurement & analysis activities more frequently
• Provided organizational resources & management support for the work
48
Performance Effects of Measurement and Analysis James McCurley & Dennis R. Goldenson CMMI Technology Conference, November 2010
© 2010 Carnegie Mellon University
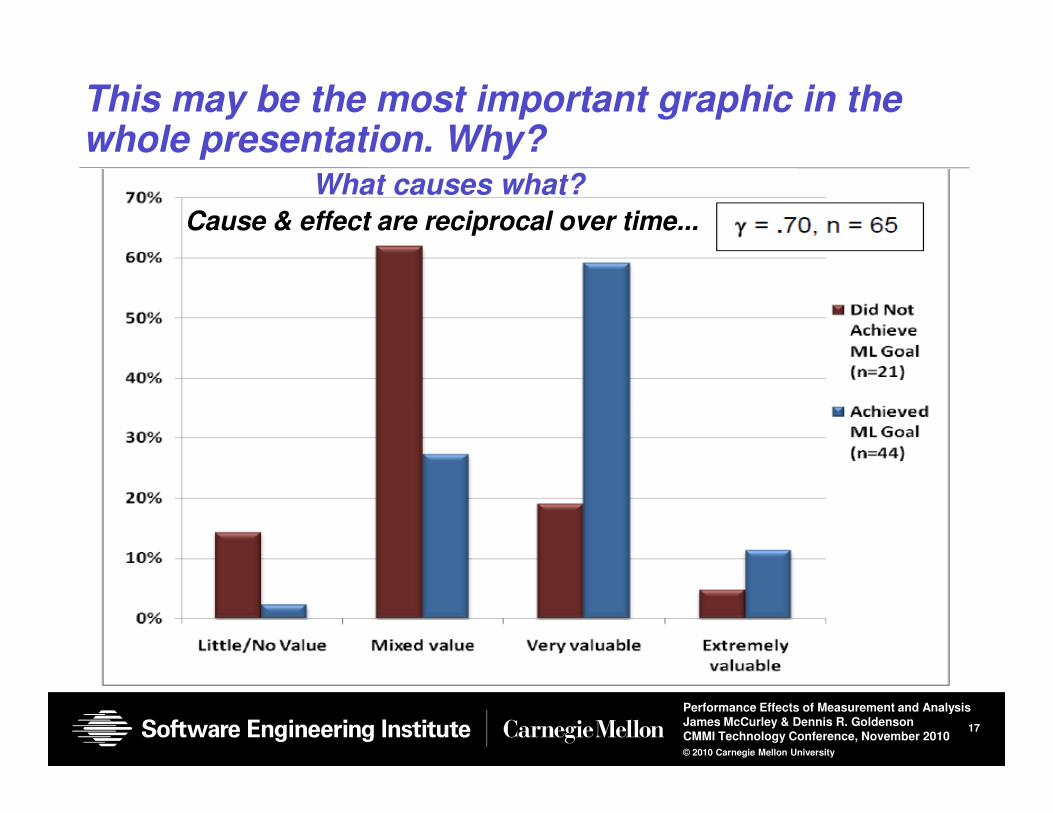
Organizations that achieved their appraised high maturity goals shared the same characteristics
• Moreover achievement of appraised high maturity status is closely associated with better project/program performance, product quality & organizational decision making
Replies to both surveys were generally consistent even though the two groups are often thought to be quite different
Summary of Results2
HMLAs were slightly less positive overall in judgments of value added
But somewhat more positive than the sponsors about consistent use of process performance modeling approaches & analytical methods
Some conjectures about why that is so
• The HMLAs were reporting about more recent appraisals & coaching
49
Performance Effects of Measurement and Analysis James McCurley & Dennis R. Goldenson CMMI Technology Conference, November 2010
© 2010 Carnegie Mellon University
• The HMLAs were reporting about more recent appraisals & coaching
engagements
• The HMLAs were basing their judgments on evidence gathered at the
project or program level
• The sponsors have a better understanding about overall goals & objectives
— Which may not be addressed by the process performance modeling
The Bottom Line Again...
Responses to 2009 survey of high maturity lead appraisers are consistent with the responses from representatives from appraised high maturity organizations surveyed in 2008
The community can be confident that the appraisers’ judgments are
50
Performance Effects of Measurement and Analysis James McCurley & Dennis R. Goldenson CMMI Technology Conference, November 2010
© 2010 Carnegie Mellon University
The community can be confident that the appraisers’ judgments are consistent with the organizations’ own views of the value of measurement & analysis to their work
References
Dennis R. Goldenson, James McCurley, Robert W. Stoddard II, Use and Organizational Effects of Measurement and Analysis in High Maturity Organizations: Results from the 2008 SEI State of Measurement and Analysis Practice Surveys, CMU/SEI-2008-TR-024(http://www.sei.cmu.edu/library/abstracts/reports/08tr024.cfm)
Dennis R. Goldenson, James McCurley, Robert W. Stoddard IICMMI, “ Perspectives on Use and Organizational Impact of Measurement and Analytical Methods in CMMI High Maturity Organizations: Results from the SEI Annual Survey Series,” CMMI Technology Conference & User Group, Denver, Colorado –19 November 009 (http://www.dtic.mil/ndia/2009CMMI/9244ThursdayTrack4Goldenson.pdf)
James McCurley, Dennis R. Goldenson, Performance Effects of Measurement and Analysis: Perspectives
51
Performance Effects of Measurement and Analysis James McCurley & Dennis R. Goldenson CMMI Technology Conference, November 2010
© 2010 Carnegie Mellon University
James McCurley, Dennis R. Goldenson, Performance Effects of Measurement and Analysis: Perspectives from CMMI High Maturity Organizations and Appraisers, CMU/SEI-2010-TR-022 (http://www.sei.cmu.edu/library/abstracts/reports/10tr022.cfm)
Robert W. Stoddard II, Dennis R. Goldenson, Dave Zubrow, Erin Harper, CMMI High Maturity Measurement and Analysis Workshop Report: March 2008, CMU/SEI-2008-TN-027(http://www.sei.cmu.edu/library/abstracts/reports/08tn027.cfm)
Robert W. Stoddard II, Dennis R. Goldenson, Approaches to Process Performance Modeling: A Summary from the SEI Series of Workshops on CMMI High Maturity Measurement and Analysis, CMU/SEI-2009-TR-021 (http://www.sei.cmu.edu/library/abstracts/reports/09tr021.cfm)
Dennis R. Goldenson, Michael J. Zuccher, Robert W. Stoddard II, Whitepaper & updated web links on CMMI performance results, forthcoming TBD
Thank You for Your Attention!
Jim McCurley & Dennis Goldenson
Software Engineering InstituteCarnegie Mellon UniversityPittsburgh, PA 15213-3890
USA
52
Performance Effects of Measurement and Analysis James McCurley & Dennis R. Goldenson CMMI Technology Conference, November 2010
© 2010 Carnegie Mellon University
USA
Back Ups
53
Performance Effects of Measurement and Analysis James McCurley & Dennis R. Goldenson CMMI Technology Conference, November 2010
© 2010 Carnegie Mellon University
Why do the 2008 & 2009 High Maturity Samples Differ?
Surveyed high maturity lead appraisers (HMLAs) in 2009
• Provides a useful comparison with those of the perspectives from the
appraised organizations
Intent has been to reuse & modify the 2008-2009 questionnaire in future years
• Using the 2008 results as the baseline for tracking changes in high
54
Performance Effects of Measurement and Analysis James McCurley & Dennis R. Goldenson CMMI Technology Conference, November 2010
© 2010 Carnegie Mellon University
• Using the 2008 results as the baseline for tracking changes in high
maturity organizations over time
Only a limited number of organizations have achieved high maturity status
But we won’t ask the same people to answer the same questions over & over each year
• (Surveyed appraisal sponsors & their designees in 2008)
55
Performance Effects of Measurement and Analysis James McCurley & Dennis R. Goldenson CMMI Technology Conference, November 2010
© 2010 Carnegie Mellon University
n=82
56
Performance Effects of Measurement and Analysis James McCurley & Dennis R. Goldenson CMMI Technology Conference, November 2010
© 2010 Carnegie Mellon University
n=82
57
Performance Effects of Measurement and Analysis James McCurley & Dennis R. Goldenson CMMI Technology Conference, November 2010
© 2010 Carnegie Mellon University
n=83
58
Performance Effects of Measurement and Analysis James McCurley & Dennis R. Goldenson CMMI Technology Conference, November 2010
© 2010 Carnegie Mellon University
59
Performance Effects of Measurement and Analysis James McCurley & Dennis R. Goldenson CMMI Technology Conference, November 2010
© 2010 Carnegie Mellon University
60
Performance Effects of Measurement and Analysis James McCurley & Dennis R. Goldenson CMMI Technology Conference, November 2010
© 2010 Carnegie Mellon University
Sampling Issues
Lower than desired response rates
Not surprising in relatively long questionnaires
Exacerbated by:
• Repeated contact of the same individuals for business as well as survey
purposes
61
Performance Effects of Measurement and Analysis James McCurley & Dennis R. Goldenson CMMI Technology Conference, November 2010
© 2010 Carnegie Mellon University
• Demands on time from busy executives
Considering other sampling strategies for future surveys
“State of the practice” also can refer to very different target populations
• The SEI customer base ... the broader software & systems engineering
community ... or those organizations that more routinely use measurement?
• Of course, the population depends on the purposes of the survey