Performance Efficiency Evaluation of the Booker Lake Alum Stormwater Treatment System Final Report April 2013 Prepared For : Prepared By : City of St. Petersburg Engineering Department P.O. Box 2842 St. Petersburg, FL 33731 Phone: 727-893-7854 Dan Saunders Project Manager Environmental Research & Design, Inc. 3419 Trentwood Blvd., Suite 102 Belle Isle, FL 32812-4864 Phone: 407-855-9465 Harvey H. Harper, Ph.D., P.E. Project Manager
Transcript
Performance Efficiency Evaluation of the Booker Lake
Alum Stormwater Treatment System
Final Report April 2013
Prepared For:
Prepared By:
City of St. Petersburg
Engineering Department P.O. Box 2842
St. Petersburg, FL 33731 Phone: 727-893-7854
Dan Saunders
Project Manager
Environmental Research & Design, Inc.
3419 Trentwood Blvd., Suite 102 Belle Isle, FL 32812-4864
Phone: 407-855-9465
Harvey H. Harper, Ph.D., P.E. Project Manager
ST. PETERSBURG \ BOOKER LAKE ATS EVALUATION REPORT
TABLE OF CONTENTS
Section / Description Page
LIST OF TABLES LT-1
LIST OF FIGURES LF-1
1. INTRODUCTION 1-1
1.1 Receiving Waters Designation 1-1
1.2 Project Description 1-1
1.3 Watershed Characteristics 1-5
1.4 Characteristics of Inflows to Booker Lake 1-11
1.5 Work Efforts Performed by ERD 1-11
1.6 Project Costs and Funding 1-12
2. BOOKER LAKE ATS SYSTEM 2-1
2.1 Process Chemistry of Alum 2-1
2.2 Description of the ATS Design 2-2
2.3 Effectiveness of Alum for Reducing Runoff and Baseflow Loadings 2-8
2.4 Runoff Generated Loadings to Booker Lake 2-9
2.5 Anticipated Load Reductions from the ATS Facility 2-10
3. FIELD AND LABORATORY ACTIVITIES 3-1
3.1 Surface Water Monitoring 3-1
3.2 Sediment Monitoring 3-4
3.2.1 Sampling Techniques 3-4
3.2.2 Sediment Characterization and Speciation Techniques 3-4
3.3 Collection of Benthic Samples 3-6
3.4 Monitoring for Floc Accumulation 3-7
3.5 Laboratory Analyses 3-8
3.6 Routine Data Analysis and Compilation 3-9
3.7 Quality Assurance 3-9
TOC-1
ST. PETERSBURG \ BOOKER LAKE ATS EVALUATION REPORT
TABLE OF CONTENTS -- CONTINUED
Section / Description Page
4. RESULTS OF FIELD MONITORING AND LABORATORY ANALYSES 4-1
4.1 Operational Status of the ATS Facility During the Field Monitoring
Program 4-1
4.2 Surface Water Characteristics 4-3
4.2.1 Vertical Field Profiles 4-3
4.2.1.1 Pre-Treatment Vertical Profiles 4-3
4.2.1.2 Post-Treatment Vertical Profiles 4-8
4.2.2 Chemical Characteristics of Pre- and Post-Treatment Surface Water 4-13
4.2.2.1 Pre-Treatment Characteristics 4-13
4.2.2.2 Post-Treatment Characteristics 4-21
4.2.2.3 Comparison of Pre- vs. Post-Characteristics 4-28
4.3.3 Comparison of Pre- vs. Post-Treatment Sediment Characteristics 4-37
4.4 Floc Accumulation 4-39
4.5 Benthic Monitoring 4-41
4.6 Estimated Mass Load Reductions 4-42
5. SUMMARY 5-1
Appendices
A. Booker Lake Stormwater, Baseflow, and Jar Test Data
B. Vertical Field Profiles Collected in Booker Lake During Pre- and Post-Treatment
Monitoring
B.1 Pre-Treatment Monitoring
B.2 Post-Treatment Monitoring
C. Pre- and Post-Treatment Benthic Monitoring Reports
C.1 Pre-Treatment Summer and Winter Season Monitoring Events
C.2 Post-Treatment Summer and Winter Season Monitoring Events
D. Laboratory QA/QC Data
D.1 Sample Duplicate Analyses
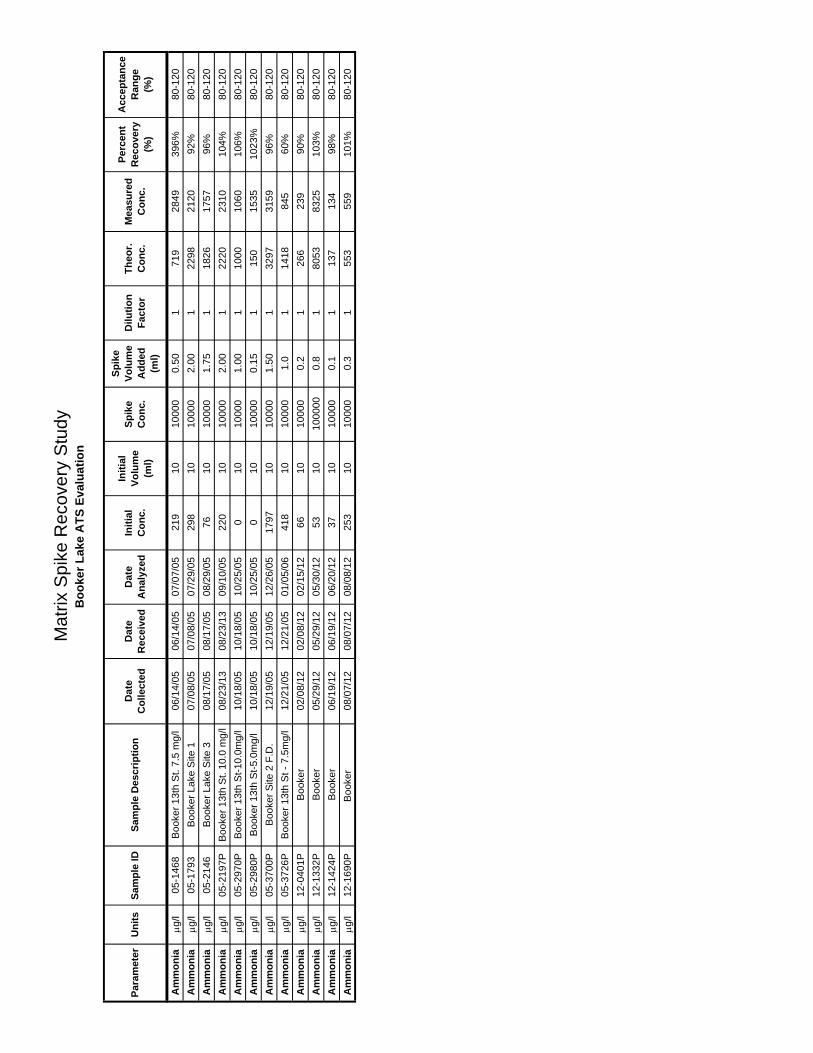
D.2 Matrix Spike Recovery
D.3 Continuing Calibration Verification (CCV) Study
D.4 Laboratory Calibration Standards (LCS) Study
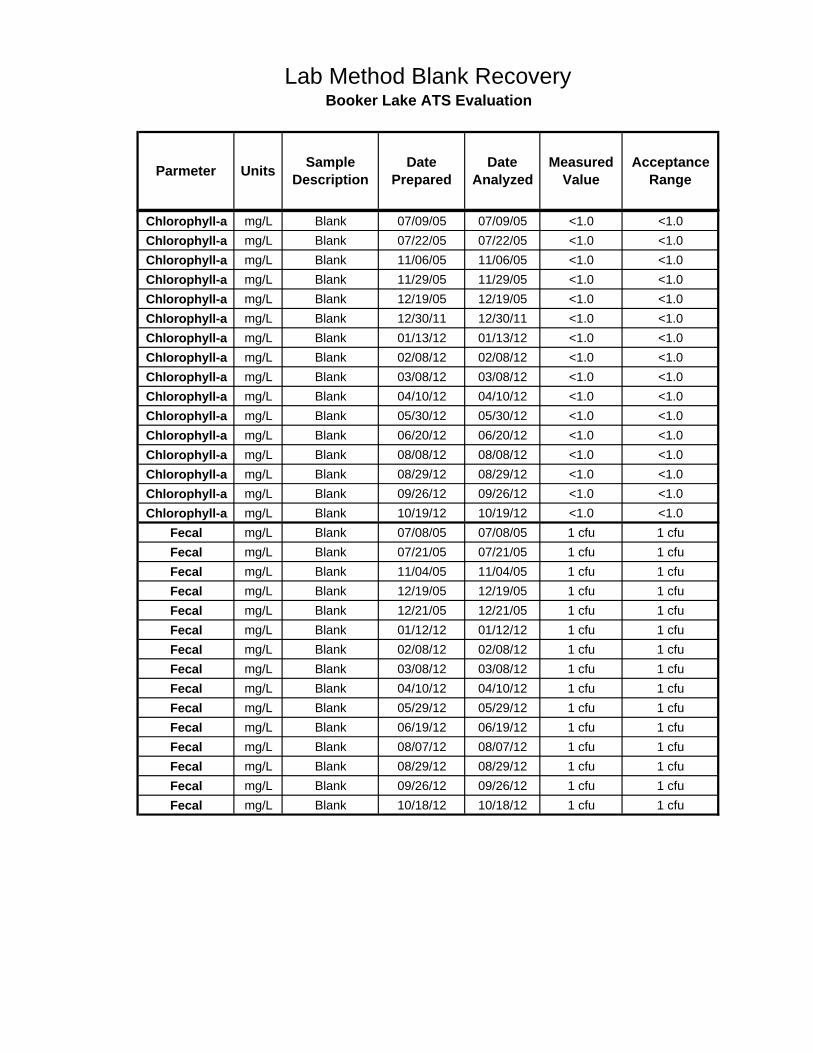
D.5 Lab Method Blank Recovery
TOC-2
ST. PETERSBURG \ BOOKER LAKE ATS EVALUATION REPORT
LIST OF TABLES
Table Number / Title Page
1-1 Elevation-Area-Volume Relationships for Booker Lake 1-3
1-2 Summary of Sub-basins Discharging to Booker Lake 1-5
1-3 Current Land Use Characteristics in the Booker Lake Drainage Basin 1-8
1-4 Hydrologic Soil Groups in the Booker Lake Drainage Basin 1-8
1-5 Summary of Annual SWMM Model Inflows to Booker Lake 1-10
1-6 Characteristics of Pre-Treatment Stormwater and Baseflow Entering Booker Lake 1-12
1-7 Funding Amounts and Sources for the Booker Lake ATS Facility 1-13
2-1 Summary of Mean Removal Efficiencies for Alum Treatment of Stormwater and
Baseflow Entering Booker Lake from July-October 2005 2-9
2-2 Estimated Annual Mass Loadings of Total Nitrogen, Total Phosphorus, and
TSS to Booker Lake from Stormwater Runoff 2-9
2-3 Estimated Annual Mass Load Reductions for Alum Treatment of Stormwater
Runoff 2-10
3-1 Analytical Methods for Sediment Analyses 3-5
3-2 Analytical Methods and Detection Limits for Laboratory Analyses 3-9
4-1 Chemical Characteristics of Pre-Treatment Surface Water Samples Collected in
Booker Lake from June 2005-June 2006 4-14
4-2 Chemical Characteristics of Post-Treatment Surface Water Samples Collected in
Booker Lake from November 2011-October 2012 4-22
4-3 Comparison of Mean Pre- and Post-Treatment Characteristics in Booker Lake 4-34
4-4 Characteristics of Pre-Treatment Sediment Core Samples Collected in Booker
Lake on July 21, 2005 4-35
LT-1
ST. PETERSBURG \ BOOKER LAKE ATS EVALUATION REPORT
LIST OF TABLES -- CONTINUED
Table Number / Title Page
4-5 Characteristics of Post-Treatment Sediment Core Samples Collected in Booker
Lake on October 18, 2012 4-36
4-6 Comparison of Pre- and Post-Treatment Sediment Characteristics in Booker Lake 4-38
4-7 Field Measurements of Underwater Staff Gauges in Booker Lake from November
2011-October 2012 4-39
4-8 Estimated Annual Mass Load Reductions for the Booker Lake ATS Facility 4-42
LT-2
ST. PETERSBURG \ BOOKER LAKE ATS EVALUATION REPORT
LIST OF FIGURES
Figure Number / Title Page
1-1 General Location Map for Booker Lake 1-2
1-2 Overview of Booker Lake 1-3
1-3 Bathymetric Contour Map for Booker Lake 1-4
1-4 Watershed Areas Discharging to Booker Lake 1-6
1-5 Land Use in the Booker Lake Drainage Basin 1-7
1-6 Hydrologic Soil Groups in the Booker Lake Drainage Basin 1-9
2-1 Major Components of the Booker Lake Regional ATS Facility 2-3
2-2 Control Building 2-4
2-3 Discharges of Alum/Water Mixture at the Two Injection Points 2-4
2-4 Overview of Alum System Control Panels 2-5
2-5 Overview of Alum System Pumping and Piping 2-5
2-6 Alum Pump Calibration Chamber 2-6
3-1 Pre-Treatment Surface Water Monitoring Sites in Booker Lake 3-2
3-2 Post-Treatment Surface Water Monitoring Sites in Booker Lake 3-3
3-3 Photograph of the Datasonde Unit Installed in Booker Lake 3-3
3-4 Schematic of Chang and Jackson Speciation Procedure for Evaluating Soil
Phosphorus Bonding 3-6
3-5 Pre- and Post-Treatment Benthic Monitoring Sites in Booker Lake 3-7
3-6 Locations of Underwater Staff Gauges Installed in Booker Lake 3-8
4-1 Summary of Days with Verified System Operation 4-2
LF-1
ST. PETERSBURG \ BOOKER LAKE ATS EVALUATION REPORT
LIST OF FIGURES -- CONTINUED
Figure Number / Title Page
4-2 Pre-Treatment Vertical Field Profiles Collected at Booker Lake Site 1 from July
2005-June 2006 4-4
4-3 Pre-Treatment Vertical Field Profiles Collected at Booker Lake Site 2 from July
2005-June 2006 4-5
4-4 Pre-Treatment Vertical Field Profiles Collected at Booker Lake Site 3 from July
2005-June 2006 4-7
4-5 Post-Treatment Vertical Field Profiles Collected in Booker Lake from November
2011-October 2012 4-9
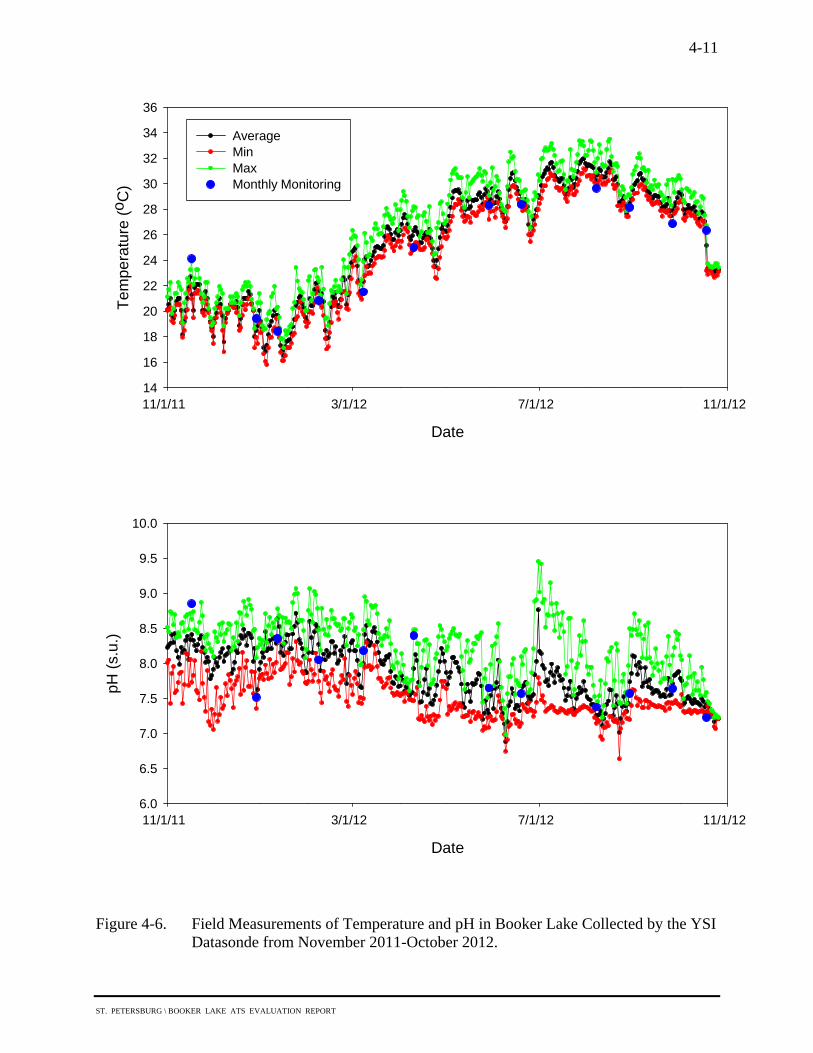
4-6 Field Measurements of Temperature and pH in Booker Lake Collected by the
YSI Datasonde from November 2011-October 2012 4-11
4-7 Continuous Field Measurements of Conductivity in Booker Lake Collected by
the YSI Datasonde from November 2011-October 2012 4-12
4-8 Variability in Pre-Treatment Concentrations of pH, Alkalinity, Conductivity,
and TSS in Booker Lake from July 2005-June 2006 4-15
4-9 Variability in Pre-Treatment Concentrations of Nitrogen Species in Booker Lake
from July 2005-June 2006 4-16
4-10 Variability in Pre-Treatment Concentrations of Phosphorus Species in Booker
Lake from July 2005-June 2006 4-18
4-11 Variability in Pre-Treatment Concentrations of Chlorophyll-a, Secchi Disk
Depth, and Dissolved Aluminum in Booker Lake from July 2005-June 2006 4-20
4-12 Variability in Post-Treatment Concentrations of pH, Alkalinity, Conductivity,
and TSS in Booker Lake from November 2011-October 2012 4-23
4-13 Variability in Post-Treatment Concentrations of Nitrogen Species in Booker
Lake from November 2011-October 2012 4-25
4-14 Variability in Post-Treatment Concentrations of Phosphorus Species in Booker
Lake from November 2011-October 2012 4-26
4-15 Variability in Post-Treatment Concentrations of Chlorophyll-a, Secchi Disk
Depth, and Dissolved Aluminum in Booker Lake from November 2011-October
2012 4-27
LF-2
ST. PETERSBURG \ BOOKER LAKE ATS EVALUATION REPORT
LIST OF FIGURES -- CONTINUED
Figure Number / Title Page
4-16 Comparison of Pre- vs. Post-Treatment Concentrations of pH, Alkalinity,
Conductivity, and TSS in Booker Lake 4-29
4-17 Comparison of Pre- vs. Post-Treatment Concentrations of Nitrogen Species in
Booker Lake 4-30
4-18 Comparison of Pre- vs. Post-Treatment Concentrations of Phosphorus Species in
Booker Lake 4-32
4-19 Comparison of Pre- vs. Post-Treatment Concentrations of Chlorophyll-a, Secchi
Disk Depth, and Dissolved Aluminum in Booker Lake 4-33
4-20 Change in Measured Sediment Levels in Booker Lake from November 2011-
October 2012 4-40
LF-3
ST. PETERSBURG \ BOOKER LAKE ATS EVALUATION REPORT
SECTION 1
INTRODUCTION
This document provides a summary of work efforts conducted by Environmental Research & Design, Inc. (ERD) for the City of St. Petersburg (City) to conduct a performance efficiency evaluation of the Booker Lake Alum Stormwater Treatment (ATS) system. This facility was constructed by the City, with cooperative funding from the Florida Department of Environmental Protection (FDEP) through a Section 319(h) Grant to reduce pollutant loadings discharging from the Booker Lake watershed into Tampa Bay.
The Booker Lake ATS facility is designed to reduce pollutant loadings from a watershed of approximately 1,437 acres which consists primarily of residential, commercial, industrial, and transportation land uses, much of which currently have no existing stormwater treatment. The Booker Lake ATS facility injects liquid alum into the incoming stormwater flows, providing significant removals for TSS, heavy metals, nutrients, and bacteria, with the accumulated alum floc retained within Booker Lake. Alum injection was selected for treating inflows into Booker Lake due to the lack of available land for traditional stormwater BMPs, the high removal efficiencies achieved by alum for the target pollutants, and the substantially lower pollutant mass removal costs for alum compared with traditional BMPs.
1.1 Receiving Waters Designation The ultimate receiving water for discharges from Booker Lake is Tampa Bay which covers more than 400 square miles and is the largest open water estuary within the State of Florida. Tampa Bay has been designated by EPA as an Estuary of National Significance and as a State priority waterbody under the Surface Water Improvement and Management Program (SWIM). The segment of Tampa Bay which receives inflows from Booker Creek is included on the Section 303(d) list of impaired waters. Runoff from urban and residential areas comprises the largest source of nutrients to Tampa Bay, particularly total nitrogen, and accounted for approximately 63% of the total nitrogen loading to Tampa Bay over the period from 1999-2003. The Booker Lake ATS facility is designed to reduce nutrient loading to Tampa Bay and assist in improving the existing impaired conditions.
1.2 Project Description A general location map for Booker Lake is given on Figure 1-1. Booker Lake is located within the city limits of St. Petersburg on the west side of I-275, approximately 1.8 miles northwest of downtown St. Petersburg, in a densely developed area of residential, commercial, industrial, and transportation land uses. The lake is bordered on the north by 13th Avenue North, on the south by 9th Avenue North, on the west by 25th Street North, and on the east by I-275.
1-1
ST. PETERSBURG \ BOOKER LAKE ATS EVALUATION REPORT
1-2
Figure 1-1. General Location Map for Booker Lake.
An aerial overview of Booker Lake is given on Figure 1-2. Booker Lake is approximately 13.0 acres in size and receives largely untreated stormwater runoff from watershed areas located north and west of the lake. Runoff enters Booker Lake through two primarily inflows, identified as the northern channel and western channel on Figure 1-2. Discharges from the lake occur through an outfall structure located on the southeast corner of the lake which passes beneath I-275 and forms the headwaters of Booker Creek which ultimately discharges into Tampa Bay. Park facilities are located north of the lake and an exercise trail was constructed around the perimeter of the lake. A bathymetric contour map of Booker Lake was developed for the City during 2004 by a private surveying consultant. A copy of the bathymetric contour map for Booker Lake is given on Figure 1-3. The elevation values indicated on Figure 1-3 are based upon the City of St. Petersburg datum. Shoreline areas of the lake exhibit a relatively mild slope, with central portions of the lake exhibiting water depths ranging from approximately 14-17 ft. A summary of elevation-area-volume relationships for Booker Lake is given in Table 1-1. At the normal water level of 130.4 ft (St. Petersburg datum), Booker Lake has a surface area of approximately 13.02 acres and a water volume of 146.4 ac-ft. The mean depth in Booker Lake, calculated by dividing the lake volume by the surface area, is approximately 11.2 ft. This value is typical of waterbody depths commonly observed in southwest Florida.
MirrorLake
BookerLake
CrescentLake
TampaBay
ST. PETERSBURG \ BOOKER LAKE ATS EVALUATION REPORT
1-3
Figure 1-2. Overview of Booker Lake.
TABLE 1-1
ELEVATION-AREA-VOLUME RELATIONSHIPS FOR BOOKER LAKE
ELEVATION
(ft) AREA (acres)
VOLUME (ac-ft)
ELEVATION (ft)
AREA (acres)
VOLUME (ac-ft)
130.4 13.02 146.4 121 7.93 38.5
130 13.02 133.4 120 7.35 30.9
129 12.63 120.5 119 6.75 23.8
128 12.17 108.1 118 6.13 17.4
127 11.46 96.3 117 5.45 11.6
126 10.80 85.2 116 4.56 6.61
125 10.16 74.7 115 3.02 2.82
124 9.57 64.8 114 1.31 0.66
123 9.05 55.5 113 0.00 0.0
122 8.51 46.8
NorthernChannel
WesternChannel
OutfallStructure
BookerLake
(13.0 ac.)
ST. PETERSBURG \ BOOKER LAKE ATS EVALUATION REPORT
1-4
Figure 1-3. Bathymetric Contour Map for Booker Lake. (Elevations based on City of St. Petersburg datum).
ST. PETERSBURG \ BOOKER LAKE ATS EVALUATION REPORT
1-5
1.3 Watershed Characteristics An overview of watershed areas discharging to Booker Lake is given on Figure 1-4, based upon information provided to ERD by the City. Watershed areas for the lake extend primarily north and west of Booker Lake. A tabular summary of sub-basin areas discharging to Booker Lake is given on Table 1-2. Watershed sizes range from 22.22-283.54 acres, with a total combined watershed area of 1437.3 acres.
TABLE 1-2
SUMMARY OF SUB-BASINS DISCHARGING TO BOOKER LAKE
BASIN AREA (acres)
B-1 142.59
B-2 189.57
B-3 86.54
B-4 22.22
B-5 104.15
B-6 174.09
B-6A 74.60
B-7 117.91
B-8 150.61
B-9 91.43
B-10 283.54
Total: 1437.25
Runoff generated within the watershed areas discharges into Booker Lake through either the northern or western channels (depicted on Figure 1-2). The primary piping systems for the western and northern channels are interconnected in multiple places, and it is difficult to define the specific basin areas which discharge to either of the inflows for a given rain event. Each of the two channels maintains a relatively constant baseflow component which exists throughout much of the year. This inflow volume is in addition to the volume of runoff estimated through modeling techniques. An overview of current land use in the Booker Lake drainage basin is given in Figure 1-5, with a tabular summary provided in Table 1-3. The largest land use within the Booker Lake basin is high-density residential which covers 55.3% of the basin area. Approximately 15.8% of the basin is industrial, with 14.6% in commercial activities and services and 4.7% in transportation. Each of the remaining land use categories occupies approximately 3% or less each of the drainage basin area.
S
T.
PE
TE
RS
BU
RG
\ B
OO
KE
R L
AK
E A
TS
EV
AL
UA
TIO
N R
EP
OR
T
Fig
ure
1-4.
W
ater
shed
Are
as D
isch
argi
ng to
Boo
ker
Lak
e.
1-6
Boo
ker
La
ke
B-8
B-10
B-9
B-6
A
B-3
B-2
B-1
B-7
B-5
B-6B-
4
02
,00
04,
00
01
,000
Fee
t
Lege
nd Su
b B
asi
ns
Bo
und
arie
s
Bo
oke
r La
ke
S
T.
PE
TE
RS
BU
RG
\ B
OO
KE
R L
AK
E A
TS
EV
AL
UA
TIO
N R
EP
OR
T
Fig
ure
1-5.
L
and
Use
in th
e B
ooke
r L
ake
Dra
inag
e B
asin
.
1-7
Bo
oke
rL
ake
B-8
B-1
0
B-9
B-6
A
B-3
B-2
B-1
B-7
B-5
B-6B
-4
02
,00
04
,00
01
,00
0
Fe
et
Lege
nd Su
b B
asi
ns
Bo
und
arie
s
Bo
oke
r La
ke
Land
Use
CO
MM
ER
CIA
L A
ND
SE
RV
ICE
S
IND
US
TR
IAL
INS
TIT
UT
ION
AL
OP
EN
LA
ND
RE
CR
EA
TIO
NA
L
RE
SID
EN
TIA
L H
IGH
DE
NS
ITY
TR
AN
SP
OR
TAT
ION
UT
ILIT
IES
FR
ES
HW
AT
ER
MA
RS
HE
S
EM
ER
GE
NT
AQ
UA
TIC
VE
GE
TAT
ION
RE
SE
RV
OIR
S
ST. PETERSBURG \ BOOKER LAKE ATS EVALUATION REPORT
1-8
TABLE 1-3
CURRENT LAND USE CHARACTERISTICS IN THE BOOKER LAKE DRAINAGE BASIN
LAND USE AREA (acres)
PERCENT OF TOTAL (%)
High-Density Residential 794.51 55.3
Commercial and Services 209.30 14.6
Industrial 227.58 15.8
Institutional 22.89 1.6
Recreational 37.18 2.6
Open Land 36.38 2.5
Reservoirs 40.28 2.8
Freshwater Marshes 0.21 < 0.1
Emergent Aquatic Vegetation 0.35 < 0.1
Transportation 67.12 4.7
Utilities 0.99 0.1
Total: 1437.25 100.0
An overview of hydrologic soil groups (HSG) in the Booker Lake drainage basin is given on Figure 1-6, with a tabular summary provided in Table 1-4. Approximately 82.5% of the basin area is covered with soils classified in HSG D which reflect fine sands with a low potential for infiltration and high rate of runoff. Approximately 15.2% of the basin area is covered by soils in HSG C which reflect a moderate infiltration rate and a moderate to high degree of runoff. In general, soils within the Booker Lake drainage basin are characterized by low infiltration rates and high runoff potentials.
TABLE 1-4
HYDROLOGIC SOIL GROUPS IN THE BOOKER LAKE DRAINAGE BASIN
HSG TYPE AREA (acres)
PERCENT OF TOTAL (%)
B/D 6.47 0.5
C 218.80 15.2
D 1186.02 82.5
W 25.96 1.8
Total: 1437.25 100.0
S
T.
PE
TE
RS
BU
RG
\ B
OO
KE
R L
AK
E A
TS
EV
AL
UA
TIO
N R
EP
OR
T
Fig
ure
1-6.
H
ydro
logi
c S
oil G
roup
s in
the
Boo
ker
Lak
e D
rain
age
Bas
in.
1-9
Boo
ker
Lake
B-8
B-10
B-9
B-6
A
B-3
B-2
B-1
B-7
B-5
B-6B
-4
02
,00
04
,00
01
,00
0
Fe
et
Lege
nd Su
b B
asi
ns
Bo
und
arie
s
Bo
oke
r La
ke
Hyd
rolo
gic
Soil
Gro
upB
/D
C D W
ST. PETERSBURG \ BOOKER LAKE ATS EVALUATION REPORT
1-10
A SWMM model (Version 4.4) of the Booker Lake watershed, originally developed by PBS&J, was provided to ERD by the City for use with this project. This model was used by ERD to simulate inflows through the northern and western channel into Booker Lake during a wide range of rain events which were then used to estimate annual inflows into the lake through each of the two channels. A summary of the results of the SWMM modeling is given in Table 1-5. On an average annual basis, the northern inflow channel contributes approximately 272.2 ac-ft of runoff each year to Booker Lake, with 377.5 ac-ft/yr contributed by the western channel. Overall, the western channel contributes approximately 58% of the annual inflows to Booker Lake, with 42% contributed by the northern channel. Approximately 649.7 ac-ft/yr of runoff is discharged to Booker Lake from the two inflows. These values do not include baseflows which occur throughout much of the year.
TABLE 1-5
SUMMARY OF ANNUAL SWMM MODEL INFLOWS TO BOOKER LAKE
CHANNEL AVERAGE
ANNUAL INFLOW (ac-ft/yr)
PERCENT OF TOTAL
(%)
Northern 272.2 42
Western 377.5 58
Total: 649.7 100
Baseflow inputs into Booker Lake from the northern inflow channel originate primarily as a result of gradual bleed-down of stormwater detention basins and depressional areas throughout the basin, along with groundwater infiltration into the extensive stormsewer system. Baseflow inputs into Booker Lake through the western channel are also contributed by bleed-down of stormwater management systems and groundwater inflow into the stormsewer system. However, significant baseflows also originate within the western channel as a result of the periodic pumped drawdown of Lake Emerald which is a 16.5-acre waterbody located northwest of Booker Lake. Excess water in Lake Emerald is pumped into the western inflow for Booker Lake and provides the single largest baseflow component for the western channel. However, the annual quantity of water which is pumped from Lake Emerald to Booker Lake is not known. Therefore, in addition to the 649.7 ac-ft/yr of runoff which discharges to Booker Lake, an additional unknown quantity of baseflow also discharges to the lake.
ST. PETERSBURG \ BOOKER LAKE ATS EVALUATION REPORT
1-11
1.4 Characteristics of Inflows to Booker Lake A field stormwater monitoring program was conducted by ERD in the Booker Lake watershed from July-October 2005 to quantify the characteristics of raw stormwater runoff discharging into Booker Lake and to collect composite runoff samples for use in laboratory jar testing using alum. Stormwater monitoring was conducted in the two primary inflows into Booker Lake, referred to previously as the northern and western channels, upstream from the point of inflow to Booker Lake, using Sigma Model 900 automatic sequential stormwater collectors with integral flow meters. Three composite runoff and four composite baseflow samples were collected at the northern channel inflow, with four composite stormwater and three composite baseflow samples collected at the western channel inflow. The collected samples were analyzed in the ERD Laboratory for general parameters, nutrients, and microbiological parameters, and jar testing was conducted to evaluate responses to various alum doses. A complete listing of the results of the stormwater and baseflow monitoring efforts and the laboratory jar testing is given in Appendix A. A summary of mean chemical characteristics of stormwater and baseflow samples collected at the northern and western inflow channel from July-October 2005 is given in Table 1-6. Both stormwater and baseflow samples were approximately neutral in pH and moderately to well buffered, based upon measured alkalinity values. Runoff entering Booker Lake through the 13th Avenue location (northern channel), was found to contain elevated levels of nitrates, total nitrogen, total phosphorus, TSS, and extremely elevated levels of fecal coliform bacteria. Baseflow collected in the northern inflow channel contained substantially lower concentrations for virtually all of the measured parameters, although nitrate concentrations in the baseflow were still relatively elevated in value.
Runoff entering Booker Lake through the western inflow channel contained more moderate concentrations of virtually all of the measured parameters, compared with the northern inflow channel. Baseflow discharges through the western channel contained relatively elevated levels of both nitrate and total nitrogen, with relatively modest concentrations for each of the remaining measured parameters.
1.5 Work Efforts Performed by ERD A Quality Assurance Project Plan (QAPP) was developed by ERD during April 2005 which provides details concerning the proposed field monitoring and laboratory analyses. The QAPP was reviewed and approved by FDEP. Pre-construction field monitoring was conducted in Booker Lake by ERD from July 2005-June 2006. Construction of the ATS facility was completed during June 2011, and post-treatment monitoring was conducted from November 2011-October 2012.
This report has been divided into five separate sections to summarize the work efforts conducted by ERD. Section 1 contains an introduction to the report and a brief summary of work efforts performed by ERD. A description of the Booker Lake ATS facility is given in Section 2. Section 3 provides a detailed discussion of the methodologies used for field and laboratory evaluations. Section 4 includes a discussion of the water quality monitoring results, with a summary provided in Section 5. Appendices are attached which contain data and supporting documentation for the results and conclusions of this project.
ST. PETERSBURG \ BOOKER LAKE ATS EVALUATION REPORT
1-12
TABLE 1-6
CHARACTERISTICS OF PRE-TREATMENT
STORMWATER AND BASEFLOW ENTERING BOOKER LAKE
PARAMETER UNITS
13th AVENUE (Northern Inflow Channel)
24th STREET (Western Inflow Channel)
Stormwater Baseflow Stormwater Baseflow
pH s.u. 7.71 7.59 7.68 7.25
Conductivity µmho/cm 260 375 204 284
Alkalinity mg/l 106 155 80 108
Ammonia µg/l 276 97 173 261
Nitrates µg/l 973 671 424 677
Diss. Organic N µg/l 142 351 176 151
Particulate N µg/l 337 84 224 341
Total N µg/l 1,727 1,203 996 1,430
SRP µg/l 136 11 51 18
Diss. Organic P µg/l 89 6 17 18
Particulate P µg/l 163 13 148 54
Total P µg/l 388 28 216 91
Turbidity NTU 29.0 1.8 11.0 1.8
TSS mg/l 54.8 3.1 17.7 1.8
BOD mg/l 3.4 2.9 3.3 2.9
Color Pt-Co 35 34 18 21
Diss. Al µg/l 54 65 59 39
Fecal Coliform cfu/100 ml 18,877 45 874 374
1.6 Project Costs and Funding
Funding for the Booker Lake alum treatment system was provided jointly by the City of St. Petersburg and FDEP. A summary of funding amounts and sources for the Booker Lake ATS is given on Table 1-7. The overall total cost of the project was approximately $1,060,000, with $424,000 (40%) contributed by the City and $636,000 (60%) contributed by FDEP through 319(h) funding. Funds contributed by the City included the survey of the project site, engineering design, project management, grant administration, water quality monitoring, the educational component of the system, and a portion of the construction costs. Funds contributed by FDEP were used exclusively for construction of the system. All but $4,000 of the funds contributed by the City was paid for through the St. Petersburg Stormwater Utility.
ST. PETERSBURG \ BOOKER LAKE ATS EVALUATION REPORT
1-13
TABLE 1-7
FUNDING AMOUNTS AND SOURCES FOR THE BOOKER LAKE ATS FACILITY
(SOURCE: DEP Agreement No. G0135)
TASK 319(h) FUNDS
($)
NON-FEDERAL MATCH FUNDS*
($)
1. Survey Project Site 0 35,000 (SP SU)
2. Engineering Design 0 240,000 (SP SU)
3. Prepare, Send, Receive, Evaluate, and Award Construction Bid 0 4,000 (Gen Rev)
4. Construction of Stormwater Facilities 636,000 90,000 (SP SU)
5. Post-Award Grant Administration 0 15,000 (SP SU)
6. Water Quality Monitoring Program 0 30,000 (SP SU)
7. Education Component 0 10,000 (SP SU)
Total: $ 636,000 (60%) $ 424,000 (40%)
TOTAL PROJECTED COST: $ 1,060,000
*SP SU: St. Petersburg Stormwater Utility Gen Rev: St. Petersburg General Revenue Funds
ST. PETERSBURG \ BOOKER LAKE ATS EVALUATION REPORT
SECTION 2
BOOKER LAKE ATS SYSTEM
This section provides a description of the Booker Lake ATS design and operational characteristics. Details of the facility are discussed in the following sections.
2.1 Process Chemistry of Alum
Alum is produced by dissolving aluminum ore in sulfuric acid and water. The most common aluminum sources used for production of alum are chemical grade bauxite, high aluminum clays, and aluminum trihydrate. Bauxite and bauxitic clays are used to produce the standard grade alum most commonly used for coagulation. The purity of alum will vary with aluminum and acid sources used in the production process. However, bauxite and bauxitic clays are low in metal contaminants, and alum solutions are typically low in virtually all heavy metals. Aluminum chloride is generated in a similar manner by dissolving aluminum ore in hydrochloric acid.
When aluminum sulfate is added to water, aluminum hydrous oxides are precipitated
according to the following stoichiometric coagulation reaction:
Al2(SO4)3 + 18H2O + 3Ca(HCO3)2 = Al(OH)3(s) + 3CaSO4 + 6CO2(g) + 18H2O In this reaction, calcium carbonate is used to represent the alkalinity needed to form Al(OH)3(s). According to this relationship, 1 mg/l of alum requires 0.45 mg/l of alkalinity as CaCO3 and releases 0.9 mg/l of CO2(g) as CaCO3. The alum coagulation reaction is frequently abbreviated to include just significant products and reactants.
The addition of alum to water results in the production of chemical precipitates which remove pollutants by two primary mechanisms. Removal of suspended solids, algae, phosphorus, heavy metals and bacteria occurs primarily by enmeshment and adsorption onto aluminum hydroxide precipitate according to the following net reaction: Al+3 + 6H2O = Al(OH)3(s) + 3H3O
+
Removal of additional dissolved phosphorus occurs as a result of direct formation of AlPO4 by:
2-1
ST. PETERSBURG \ BOOKER LAKE ATS EVALUATION REPORT
2-2
Al+3 + HnPO4
n-3 = AlPO4(s) + nH+
The aluminum hydroxide precipitate, Al(OH)3, is a gelatinous floc which attracts and
adsorbs colloidal particles onto the growing floc, thus clarifying the water. Phosphorus removal or entrapment can occur by several mechanisms, depending on the solution pH. Inorganic phosphorus is also effectively removed by adsorption to the Al(OH)3 floc. Removal of particulate phosphorus is most effective in the pH range of 6-8 where maximum floc occurs (Cooke and Kennedy, 1981). At higher pH values, OH- begins to compete with phosphate ions for aluminum ions, and aluminum hydroxide-phosphate complexes begin to form. At lower pH values and higher inorganic phosphorus concentrations, the formation of aluminum phosphate (AlPO4) is favored.
ERD pioneered the concept of using chemical coagulants for treatment of stormwater and tributary inflows during the mid-1980s. Alum stormwater treatment systems provide a cost-effective and highly efficient method for treatment of stormwater runoff in an urban setting. Currently, there are more than 60 operational alum stormwater treatment systems within the State of Florida.
2.2 Description of the ATS Design An overview of main components of the Booker Lake Regional ATS Facility is given on Figure 2-1. Controls and pumps for the ATS facility are located in a concrete block structure on the east side of the lake adjacent to I-275. An overview of the control building is given on Figure 2-2. The building contains two separate rooms, with one room used to house the pumps and electronic controls, and the second room used to house the 8,000-gallon FRP alum storage tank. Ultrasonic flow measurement devices were installed in both the northern and western inflow channels, upstream from the point of discharge into Booker Lake. These flow meters generate estimates of discharge from the inflow channels based upon depth of water using the Manning Equation and provide a continuous measurement of discharges through each of the two inflow channels under both storm and baseflow conditions. The flow meters generate 4-20 mA signals which are transmitted back to the building by telemetry and are used to pace the chemical feed pumps to inject liquid alum at a constant dose of 7.5 mg Al/liter, regardless of the rate of the incoming runoff or baseflow. The alum is transported to each of the two points of injection using a water carrier pump. Water is pumped from Booker Lake, and alum is injected into the carrier flow which assists in the preliminary mixing of the alum with water. The alum/water mixture is then injected into each of the two inflow channels. Photographs of the injection of the alum/water mixture into the two inflow channels are given on Figure 2-3. An overview of control panels for the ATS facility is given on Figure 2-4. Separate control panels are provided for each of the two chemical metering pumps and the individual flow sensors. Operation of the system is controlled by a Programmable Logic Controller (PLC) which controls and coordinates all system components, including operation of the chemical metering pumps, carrier pump, and system operational status. The PLC allows a wide degree of control over system start-up, operation, and shut-down. The PLC stores all operational data for the system, including stormwater inflow rates and volumes, alum use, and system status.
Fig
ure
2-1.
M
ajor
Com
pone
nts
of th
e B
ooke
r L
ake
Reg
iona
l AT
S F
acil
ity.
2-3
S
T.
PE
TE
RS
BU
RG
\ B
OO
KE
R L
AK
E A
TS
EV
AL
UA
TIO
N R
EP
OR
T
ST. PETERSBURG \ BOOKER LAKE ATS EVALUATION REPORT
2-4
Figure 2-2. Control Building.
Western Channel
Northern Channel
Figure 2-3. Discharges of Alum/Water Mixture at the Two Injection Points.
ST. PETERSBURG \ BOOKER LAKE ATS EVALUATION REPORT
2-5
Figure 2-4. Overview of Alum System Control Panels.
Figure 2-5. Overview of Alum System Pumping and Piping.
ST. PETERSBURG \ BOOKER LAKE ATS EVALUATION REPORT
2-6
An overview of alum system pumping and piping is given on Figure 2-5. The system has two progressive cavity pumps which introduce alum in a flow proportioned manner into the carrier feeds for each of the two inflows. The piping system includes backpressure valves and magnetic meters for accurately measuring the volume of alum which has been dispensed. The system also contains a calibration chamber to calibrate the alum flow meters and pumping rates. A photograph of the alum pump calibration chamber is given on Figure 2-6.
Figure 2-6. Alum Pump Calibration Chamber.
ST. PETERSBURG \ BOOKER LAKE ATS EVALUATION REPORT
2-7
A SWMM model was provided to ERD by the City for use in estimating inflows to Booker Lake through the western and northern inflow channels on an average annual basis. The alum treatment system is capable of providing full alum treatment for inflows up to 100 cfs in each of the two channels. Modeling was conducted using the SWMM model to estimate the average annual stormwater volume which would be treated if the first 100 cfs of typical storm events receive full alum addition. The SWMM model indicated that the proposed ATS facility would be capable of treating up to 98.5% of the runoff generated annual inflows to Booker Lake through the northern and western inflow channels, or approximately 640 ac-ft/yr. Based upon the alum addition rate of 7.5 mg Al/liter determined through laboratory jar testing of collected stormwater and baseflow samples, the Booker Lake ATS facility will require approximately 26,697 gallons of liquid alum on an average annual basis to provide treatment for 640 ac-ft/yr of runoff.
The estimated annual alum volume does not include treatment of additional inflows from
baseflow in the two channels. In an effort to reduce annual alum usage, the treatment system is set-up to largely ignore low discharge baseflow inputs to Booker Lake, including most of the pumped inflows from Lake Kenwood, although higher level baseflow discharges may be treated at times. Baseflow in the northern channel is ignored by programming the system to activate only when discharges exceed a pre-determined, but adjustable, flow rate assumed to represent baseflow conditions. Baseflow through the western channel is highly variable, and can reach fairly large flow rates when pumping from Lake Emerald is occurring. Baseflow through this inflow is ignored by programming the western channel to inject alum only when the northern channel is injecting which indicates storm event conditions.
Alum floc generated as a result of treatment of stormwater and baseflow accumulates
within the sediments of Booker Lake. Portions of Booker Lake below elevation 120.0 ft are designated as floc storage areas. As indicated on Table 1-1, the volume of Booker Lake below elevation 120.0 is approximately 30.9 ac-ft. When the floc accumulation reaches this level, the floc will be removed using a manually operated portable dredge unit designed to operate at a relatively low flow rate of 300-400 gpm. Once the floc is dredged, it will be disposed of by addition to the sanitary sewer system or processed using a rapid dewatering system with the dewatered solids trucked off-site for disposal. Relationships between alum floc production and alum treatment dose have been developed by Harper (1990) based upon alum treatment of stormwater and baseflow with a wide variety of chemical characteristics. At a dose of 7.5 mg Al/liter, the alum floc production rate is approximately 0.2% of the treated stormwater runoff flow. Using this value, the estimated annual floc volume generated as a result of treating inflows through the northern and western channels is approximately 1.3 ac-ft/yr. Therefore, approximately 23.8 years of storage is available within Booker Lake below elevation 120 for storage of alum floc.
ST. PETERSBURG \ BOOKER LAKE ATS EVALUATION REPORT
2-8
2.3 Effectiveness of Alum for Reducing Runoff and Baseflow Loadings
Once alum has been identified as an option in a stormwater management or retrofit project, extensive laboratory testing must be performed to verify the feasibility of alum treatment and to establish process design parameters. The feasibility of alum treatment for a particular stormwater stream is typically evaluated in a series of laboratory jar tests conducted on representative runoff samples collected from the project watershed area. This laboratory testing is an essential part of the evaluation process necessary to determine design, maintenance, and operational parameters such as the optimum coagulant dose required to achieve the desired water quality goals, chemical pumping rates and pump sizes, the need for additional chemicals to buffer receiving water pH, post-treatment water quality characteristics, floc formation and settling characteristics, floc accumulation, annual chemical costs and storage requirements, ecological effects, and maintenance procedures. In addition to determining the optimum coagulant dose, jar tests can also be used to determine floc strength and stability, required mixing intensity and duration, and establish design criteria for floc settling.
As discussed in Section 1.4, a field monitoring program was conducted by ERD from July-October 2005 to identify the characteristics of stormwater and baseflow inputs into Booker Lake and to collect composite samples of runoff and baseflow for use in laboratory jar tests using alum. A summary of mean removal efficiencies for alum treatment of stormwater and baseflow collected from the northern and western channels of Booker Lake from July-October 2005 is given in Table 2-1. Mean removal efficiencies for total nitrogen in stormwater runoff collected from the two inflow channels ranged from 27-28%, with mean removal efficiencies for total phosphorus ranging from 82-98%, and 80-96% removal for TSS.
Laboratory removal efficiencies for baseflow samples collected from the northern and western inflow channels were somewhat lower than removal efficiencies observed for treatment of stormwater runoff. Baseflow entering Booker Lake from both the northern and western channels was found to be low in both nutrients and suspended solids. As a result of the initial low raw concentrations, the water quality improvements obtained using alum treatment were not as dramatic as removal efficiencies obtained for treatment of stormwater runoff which exhibited much higher raw concentrations.
A summary of assumed removal efficiencies for treatment of stormwater runoff from both the northern and western channels is given at the bottom of Table 2-1. Since field operational conditions are less controlled than laboratory jar tests, a slightly lower removal efficiency is assumed for the alum treatment system than the removal efficiencies observed during the jar testing process. For purposes of estimating pollutant load reductions for the Booker Lake ATS facility, a removal of 25% is assumed for total nitrogen, with a 90% removal for total phosphorus, and a 90% removal for TSS. Although laboratory jar testing was conducted on baseflow samples collected from the northern and western channels, the annual volumetric inputs of baseflow are not known, and the system is programmed to largely ignore baseflow inputs. Therefore, estimates of annual loadings and load reductions are not included for the baseflow components.
ST. PETERSBURG \ BOOKER LAKE ATS EVALUATION REPORT
2-9
TABLE 2-1
SUMMARY OF MEAN REMOVAL EFFICIENCIES FOR ALUM TREATMENT OF STORMWATER AND BASEFLOW ENTERING BOOKER LAKE FROM JULY-OCTOBER 2005
INFLOW INFLOW
TYPE
ALUM DOSE
(mg Al/liter)
NUMBER OF
TESTS
MEAN REMOVAL EFFICIENCY (%) Total
Nitrogen Total
Phosphorus TSS
Northern Channel
Stormwater 7.5 4 27 98 96
Baseflow 7.5 3 8 82 80
Western Channel
Stormwater 7.5 3 28 97 87
Baseflow 7.5 4 13 96 63
Assumed Removal Efficiency for Stormwater: 25 90 90
2.4 Runoff Generated Loadings to Booker Lake A summary of estimated annual mass loadings of total nitrogen, total phosphorus, and TSS to Booker Lake from stormwater runoff is given on Table 2-2. Estimated annual mass loadings were calculated by multiplying the modeled runoff inflow volumes for the northern and western channels (summarized in Table 1-5) and the mean pre-treatment runoff characteristics for the northern and western channels (summarized in Table 1-6). On an annual basis, the northern and western channels contribute approximately 1,043 kg of total nitrogen, 231 kg of total phosphorus, and 26,636 of TSS each year. These annual loadings do not include the additional loadings to Booker Lake provided by baseflow inputs since the annual volume of the baseflow inputs is not known.
TABLE 2-2
ESTIMATED ANNUAL MASS LOADINGS OF TOTAL NITROGEN, TOTAL PHOSPHORUS, AND TSS TO BOOKER LAKE FROM STORMWATER RUNOFF
INFLOW RUNOFF VOLUME (ac-ft/yr)
ASSUMED INFLOW CONCENTRATION
ANNUAL MASS LOADING (kg/yr)
Total N (g/l)
Total P (g/l)
TSS (mg/l)
Total N Total P TSS
Northern Channel
272.2 1,727 388 54.8 580 130 18,396
Western Channel
377.5 996 216 17.7 464 101 8,240
Total: 649.7 1,043 231 26,636
ST. PETERSBURG \ BOOKER LAKE ATS EVALUATION REPORT
2-10
2.5 Anticipated Load Reductions from the ATS Facility
Estimated annual mass load reductions for alum treatment of stormwater runoff are summarized in Table 2-3. The calculated load reductions reflect the assumed removal efficiencies for stormwater treatment provided at the bottom of Table 2-1. Overall, the Booker Lake ATS facility is expected to remove approximately 261 kg/yr of total nitrogen, 208 kg/yr of total phosphorus, and 23,973 kg/yr of TSS.
TABLE 2-3
ESTIMATED ANNUAL MASS LOAD REDUCTIONS
FOR ALUM TREATMENT OF STORMWATER RUNOFF
INFLOW
ASSUMED REMOVAL EFFICIENCY (%)
ANNUAL LOAD REDUCTION (kg/yr)
Total N (g/l)
Total P (g/l)
TSS (mg/l)
Total N Total P TSS
Northern Channel 25 90 90 145 117 16,556
Western Channel 25 90 90 116 91 7,416
Total: 261 208 23,973
ST. PETERSBURG \ BOOKER LAKE ATS EVALUATION REPORT
SECTION 3
FIELD AND LABORATORY ACTIVITIES
Field and laboratory investigations were conducted by ERD to evaluate the effectiveness of the Booker Lake ATS facility. Pre-construction field monitoring was conducted from July 2005-June 2006 which included evaluation of surface water quality, sediment characteristics, and benthic communities. Post-treatment monitoring was conducted from November 2011-October 2012, following completion of the alum stormwater treatment facility, to document changes in water quality, sediment characteristics, and benthic communities, as well as floc accumulation rates. Laboratory analyses were conducted on the collected pre- and post-treatment samples to assist in quantifying the pollutant removal effectiveness of the treatment system. Specific details of monitoring efforts conducted to evaluate the performance efficiency of the Booker Lake ATS facility are given in the following sections.
3.1 Surface Water Monitoring Surface water monitoring was conducted in Booker Lake under both pre- and post-treatment conditions to evaluate the performance efficiency of the Booker Lake ATS facility. Under pre-treatment conditions, surface water monitoring was conducted at 3 separate locations in Booker Lake to evaluate horizontal variability in water quality characteristics within the lake. The locations of the pre-treatment surface water monitoring sites are illustrated on Figure 3-1. Pre-treatment surface water monitoring was conducted at each of the 3 sites on a monthly basis over the period from July 2005-June 2006, with a total of 12 separate monthly monitoring events conducted to evaluate pre-treatment characteristics. During each monthly surface water monitoring event, surface water samples were collected at each of the 3 monitoring sites at a water depth equivalent to one-half of the measured Secchi disk depth at the time of sample collection. The surface water samples were collected using a portable submersible pump which operated on 12-volt DC power. The pump was lowered to the appropriate depth, and surface water was pumped from the selected water depth through polyethylene tubing into the appropriate collection container. The collected samples were placed in ice and returned to the ERD Laboratory for analyses. Measurements of Secchi disk depth were conducted during each monitoring event using a standard 10-cm diameter disk. During each monthly monitoring event, vertical field profiles of pH, temperature, specific conductivity, dissolved oxygen, and oxidation-reduction potential (ORP) were conducted at each of the 3 monitoring sites using a Hydrolab Datasonde 4a water quality monitor. Field measurements were conducted at depths of 0.25 m and 0.5 m, and continued at 0.5 m intervals to the lake bottom at each site. This information is used to evaluate potential stratification and anoxic conditions in bottom portions of the lake.
3-1
ST. PETERSBURG \ BOOKER LAKE ATS EVALUATION REPORT
3-2
Figure 3-1. Pre-Treatment Surface Water Monitoring Sites in Booker Lake.
After reviewing the results of the pre-treatment surface water monitoring program, it was concluded that Booker Lake is a well-mixed waterbody, and chemical characteristics of the surface water can be evaluated by monitoring at a single location. Therefore, the post-treatment monitoring program was conducted only at a single monitoring site near the geographic center of Booker Lake. The location of the post-treatment surface water monitoring site is indicated on Figure 3-2. Post-treatment surface water monitoring was conducted from November 2011-October 2012, with samples collected on a monthly basis, with a total of 12 separate monthly monitoring events. Monitoring techniques used for collection of surface water samples and vertical field profiles were identical to the techniques used for collection of the pre-treatment data. In addition to the routine monthly surface water monitoring, a Hydrolab Model MS5 recording datasonde unit was installed in Booker Lake upstream from the outfall structure at the location indicated on Figure 3-2. The datasonde was suspended at approximately mid-depth in the water column using a buoy and anchor system. The unit was programmed to collect measurements of pH, temperature, and specific conductivity at 15-minute intervals, with the data stored into internal memory within the unit. During each monthly monitoring event, the data were downloaded from the datasonde unit and the internal batteries were replaced. The primary purpose of the datasonde was to record pH values within Booker Lake to ensure that the alum treatment process did not reduce pH levels in Booker Lake to undesirable levels. A photograph of the datasonde unit is given on Figure 3-3. The Datasonde was calibrated and cleaned during each of the monthly events. In general, the calibration remained very stable between the monthly calibration events.
Site 1
Site 2
Site 3
ST. PETERSBURG \ BOOKER LAKE ATS EVALUATION REPORT
3-3
Figure 3-2. Post-Treatment Surface Water Monitoring Sites in Booker Lake.
Figure 3-3. Photograph of the Datasonde Unit Installed in Booker Lake.
SurfaceWater
pH DataSonde
ST. PETERSBURG \ BOOKER LAKE ATS EVALUATION REPORT
3-4
3.2 Sediment Monitoring Collection of sediment core samples was conducted in Booker Lake under pre- and post-treatment conditions to evaluate potential changes in sediment characteristics resulting from operation of the Booker Lake ATS facility. Sediment monitoring was conducted under both pre- and post-treatment conditions at each of the 3 surface water monitoring sites indicated on Figure 3-1. 3.2.1 Sampling Techniques
Sediment samples were collected at each of the 3 monitoring sites using a stainless steel
split-spoon core device, which was penetrated into the sediments at each location to a minimum distance of approximately 0.5 m. After retrieval of the sediment sample, any overlying water was carefully decanted before the split-spoon device was opened to expose the collected sample. Visual characteristics of each sediment core sample were recorded, and the 0-10 cm layer was carefully sectioned off and placed into a polyethylene container for transport to the ERD laboratory. The polyethylene containers utilized for storage of the collected samples were filled completely to minimize air space in the storage container above the composite sediment sample.
Triplicate core samples were collected at each site for both pre- and post-treatment
monitoring events. Under pre-treatment conditions, the 0-10 cm layers for each of the triplicate samples were combined together to form a single composite sample for each of the 3 monitoring sites, forming a total of 3 pre-treatment sediment core samples. During the post-treatment sediment monitoring event, each of the triplicate core samples were placed into separate bottles and analyzed separately, resulting in a total of 9 individual core samples which were analyzed individually. Each of the collected pre- and post-treatment samples was stored on ice and returned to the ERD laboratory for physical and chemical characterization.
3.2.2 Sediment Characterization and Speciation Techniques The collected pre- and post-treatment sediment core samples was analyzed for a variety
of general parameters, including moisture content, organic content, sediment density, total nitrogen, and total phosphorus. Methodologies utilized for preparation and analysis of the sediment samples for these parameters are outlined in Table 3-1.
In addition to general sediment characterization, a fractionation procedure for inorganic soil
phosphorus was conducted on each of the collected post-treatment sediment samples. A modified version of the Chang and Jackson Procedure, as proposed by Peterson and Corey (1966), was used for phosphorus fractionation. The Chang and Jackson Procedure allows the speciation of sediment phosphorus into saloid-bound phosphorus (defined as the sum of soluble plus easily exchangeable sediment phosphorus), iron-bound phosphorus, and aluminum-bound phosphorus. Although not used in this project, subsequent extractions of the Chang and Jackson procedure also provide calcium-bound and residual fractions.
ST. PETERSBURG \ BOOKER LAKE ATS EVALUATION REPORT
3-5
TABLE 3-1 ANALYTICAL METHODS FOR SEDIMENT ANALYSES
MEASUREMENT PARAMETER
SAMPLE PREPARATION
ANALYSIS REFERENCE
REFERENCE PREP./ANAL.*
METHOD DETECTION LIMITS
(MDLs)
pH EPA 903 EPA 903 3 / 3 0.01 pH units
Moisture Content p. 3-54 p. 3-58 1 / 1 0.1% Organic Content (Volatile Solids)
p. 3-52 pp. 3-52 to 3-53 1 / 1 0.1%
Total Phosphorus pp. 3-227 to 3-228
(Method C) EPA 365.4 1 / 2 0.005 mg/kg
Total Nitrogen p. 3-201 pp. 3-201 to 3-204 1 / 1 0.010 mg/kg Specific Gravity
(Density) p. 3-61 pp. 3-61 to 3-62 1 / 1 NA
*REFERENCES:
1. Procedures for Handling and Chemical Analysis of Sediments and Water Samples, EPA/Corps of Engineers, EPA/CE-81-1, 1981.
2. Methods for Chemical Analysis of Water and Wastes, EPA 600/4-79-020, Revised March 1983.
3. Test Methods for Evaluating Solid Wastes, Physical-Chemical Methods, Third Edition, EPA-SW-846,
Updated November 1990.
The Chang and Jackson procedure was originally developed at the University of Wisconsin
to evaluate phosphorus bonding in dried agricultural soils. However, drying of wet sediments will significantly impact the phosphorus speciation, particularly the soluble and iron-bound associations. Therefore, the basic Chang and Jackson method was adapted and modified by ERD for wet sediments by adjusting solution concentrations and extraction timing to account for the liquid volume in the wet sediments and the reduced solids mass. This modified method has been used as the basis for all sediment inactivation projects which have been conducted in the State of Florida.
Saloid-bound phosphorus is considered to be available under all conditions at all times.
Iron-bound phosphorus is relatively stable under aerobic environments, generally characterized by redox potentials greater than 200 mv (Eh), while unstable under anoxic conditions, characterized by redox potential less than 200 mv. Aluminum-bound phosphorus is considered to be stable under all conditions of redox potential and natural pH conditions. A schematic of the Chang and Jackson Speciation Procedure for evaluating soil phosphorus bounding is given in Figure 3-4.
For purposes of evaluating release potential, ERD typically assumes that potentially available inorganic phosphorus in soils/sediments, particularly those which exhibit a significant potential to develop reduced conditions below the sediment-water interface, is represented by the sum of the soluble inorganic phosphorus and easily exchangeable phosphorus fractions (collectively termed saloid-bound phosphorus), plus iron-bound phosphorus which can become solubilized under reduced conditions. Aluminum-bound phosphorus is generally considered to be unavailable in the pH range of approximately 5.5-7.5 under a wide range of redox conditions.
ST. PETERSBURG \ BOOKER LAKE ATS EVALUATION REPORT
3-6
Figure 3-4. Schematic of Chang and Jackson Speciation Procedure for Evaluating Soil
Phosphorus Bonding.
3.3 Collection of Benthic Samples Benthic monitoring was conducted in Booker Lake under pre- and post-treatment conditions to evaluate potential impacts on benthic populations from operation of the Booker Lake ATS facility. Pre-construction benthic monitoring was conducted in Booker Lake during July 2005 and January 2006 to evaluate benthic populations under summer and winter conditions. Post-treatment benthic monitoring was conducted during January and August 2012. Locations of the pre- and post-treatment benthic monitoring sites in Booker Lake are indicated on Figure 3-5. Sample collection for the pre- and post-treatment benthic monitoring event was performed by ERD, with sample identification conducted by Mr. Mark Vogel, formerly employed by the Florida Fish and Game Commission and the Orange County Environmental Protection Division, and currently employed by USGS. Sample collection was performed using a 6-inch x 6-inch stainless steel Eckman dredge. Three separate dredge samples were collected at each sample site. Each of the collected samples was placed into a wash bucket with a 500 μm stainless steel sieve screen. The samples were washed to remove silt and fine sand and stored in individual bottles for subsequent analysis. This procedure formed a total of nine separate benthic samples (3 sites x 3 samples/site) for analysis from each of the pre- and post-treatment monitoring events. Each of the benthic samples was preserved and shipped to Mr. Vogel for evaluation. In order to maintain uniform procedures and sample methodologies between the monitoring events, specifics concerning monitoring techniques, sieve size, preservation and shipping methods were provided to ERD by Mr. Vogel.
Sediment2N NH4Cl Saloid-Bound
Phosphorus(30 minutes)
Residue0.5 N NH4F Al-Bound
Phosphorus(1 hour)
Residue0.1 N NaOH Iron-Bound
Phosphorus(17 hours)
ST. PETERSBURG \ BOOKER LAKE ATS EVALUATION REPORT
3-7
Figure 3-5. Pre- and Post-Treatment Benthic Monitoring Sites in Booker Lake.
3.4 Monitoring for Floc Accumulation Field monitoring was conducted by ERD under post-treatment conditions to evaluate the rate of floc accumulation in Booker Lake resulting from treatment of inflows from the northern and western channels. Monitoring for floc accumulation was conducted at 10 separate locations in Booker Lake using underwater staff gauges installed by ERD. Locations of the underwater staff gauge sites are illustrated on Figure 3-6. The staff gauges consisted of stainless steel rulers (approximately 3” wide and 4’ long) which were attached to 1.5-inch aluminum fence post piping. Each of the pipes was inserted firmly into the sediments such that the stainless steel staff gauges extended approximately 1 ft below the sediment surface and 3 ft above the sediment surface. Each of the pipes was extended to near the water surface to assist in locating each of the staff gauge monitoring sites. On approximately a bimonthly basis, readings were collected of the elevation of the top sediment layer at each of the staff gauge locations. The readings were conducted by gently lowering an underwater video camera at each site and recording the relative sediment elevation. The use of the underwater camera minimized disturbances to the sediments which would have potentially impacted the measured values. Changes in each of the relative sediment depths are used to evaluate the distribution of the alum floc within Booker Lake.
Site 1
Site 2
Site 3
ST. PETERSBURG \ BOOKER LAKE ATS EVALUATION REPORT
3-8
Figure 3-6. Locations of Underwater Staff Gauges Installed in Booker Lake.
3.5 Laboratory Analyses
A summary of laboratory methods and MDLs for analyses conducted on water samples collected during this project is given in Table 3-2. All laboratory analyses were conducted in the ERD Laboratory which is NELAC-certified (No. E1031026). Details on field operations, laboratory procedures, and quality assurance methodologies are provided in the Quality Assurance Project Plan (QAPP), outlining the specific field and laboratory procedures to be conducted for this project, were submitted to and approved by FDEP prior to initiation of any field and laboratory activities.
1
2 3
4
5
67
89
10
ST. PETERSBURG \ BOOKER LAKE ATS EVALUATION REPORT
3-9
TABLE 3-2
ANALYTICAL METHODS AND DETECTION LIMITS FOR LABORATORY ANALYSES
PARAMETER METHOD
OF ANALYSIS
METHOD DETECTION LIMITS
(MDLs)1
pH SM-21, Sec. 4500-H+ B2 N/A
Conductivity SM-21, Sec. 2510 B 0.2 mho/cm
Alkalinity SM-21, Sec. 2320 B 0.5 mg/l
Ammonia SM-21, Sec. 4500-NH3 G 0.005 mg/l
NOx SM-21, Sec. 4500-NO3 F 0.005 mg/l
Total Nitrogen SM-21, Sec. 4500-N C 0.01 mg/l
Soluble Reactive Phosphorus (ORP) SM-21, Sec. 4500-P F 0.001 mg/l
Total Phosphorus SM-21, Sec. 4500-P B.5 0.001 mg/l
Turbidity SM-21, Sec. 2130 B 0.3 NTU
Color SM-21, Sec. 2120 C 1 Pt-Co Unit
TSS SM-21, Sec. 2540 D 0.7 mg/l
Chlorophyll-a3 SM-21, Sec. 10200 H.1,3 1 mg/m3
BOD SM-21, Sec. 5210 B 2 mg/l
Fecal Coliform SM-21, Sec. 9222 D 1 cfu
Diss. Aluminum SM-21, Sec. 3500-Al E 4 g/l
1. MDLs are calculated based on the EPA method of determining detection limits 2. Standard Methods for the Examination of Water and Wastewater, 21st Ed., 2005. 3. Measured on surface water samples only
3.6 Routine Data Analysis and Compilation All data generated during this project, including field measurements, water quality information, sediment characteristics, and datasonde downloads were entered into a computerized database and double-checked for accuracy. Data collected during this project were analyzed using a variety of statistical methods and software.
3.7 Quality Assurance Supplemental samples (such as equipment blanks and duplicate samples) were collected during the field monitoring program for quality assurance purposes. In addition, a number of supplemental laboratory analyses were performed to evaluate precision and accuracy of the collected data. Overall, more than 1000 additional laboratory analyses were conducted for quality assurance purposes. A summary of the QA data collected as part of this project is given in Appendix D.
ST. PETERSBURG \ BOOKER LAKE ATS EVALUATION REPORT
SECTION 4
RESULTS OF FIELD MONITORING AND LABORATORY ANALYSES
This section provides a summary of the results of field monitoring and laboratory analyses conducted at Booker Lake before and after construction of the alum stormwater treatment system. Pre- and post-treatment comparisons are provided for water quality, sediments, observed floc accumulation rates, and benthic communities. Pre-treatment monitoring was conducted from July 2005-June 2006, with post-treatment monitoring conducted from November 2011-October 2012. A discussion of the results of the monitoring activities is given in the following sections. Information is also provided on the operational status of the Booker Lake ATS during the field monitoring program.
4.1 Operational Status of the ATS Facility During the Field Monitoring Program The Booker Lake ATS facility includes a programmable logic controller (PLC) that provides a record of the operational status of the system at one minute intervals and provides information on operational parameters such as water level readings in the various channels, calculated storm flows, alum pumping requirements based upon the calculated discharge rates through the western and northern channels, and the actual pumped rate of alum addition. This information is stored onto an SD card which can be retrieved and downloaded onto a laptop computer in an Excel format. The data stored on the SD card were retrieved approximately mid-way through the 12-month field monitoring program and at the completion of the field monitoring program. A graphical summary of days with verified system operation, based upon the information contained on the SD card, is given in Figure 4-1. Continuous operational data are available from 11/1/11-1/8/12 and from 7/13/12-10/31/12. System operation was evaluated by reviewing the stored data for measured water levels in the western and northern channels along with the theoretical and actual alum pumping rates. The alum treatment system is assumed to be operational on days when water level measurements in one or both of the two inflow channels exhibit a trend of either increasing or decreasing elevations, combined with actual operation of the alum injection pump. This analysis does not include an evaluation of whether or not the alum pumping system was dispensing the appropriate amount of alum. The system is also assumed to be operational during periods of low flow conditions when the depth transducers in the two channels appear to be measuring reasonable values, although the calculated inflow rates may be too low to energize the alum addition system.
4-1
ST. PETERSBURG \ BOOKER LAKE ATS EVALUATION REPORT
4-2
Figure 4-1. Summary of Days with Verified System Operation.
Unfortunately, operational data are not available over the period from 1/8/12-7/13/12. It is not known whether the missing data suggests that the system was turned off and inoperable or if the stored data were lost. As a result, no conclusions can be drawn regarding the operational status of the system during this period. Overall, information necessary to evaluate system performance is available for approximately 179 of the 365 days included in the field monitoring program. As indicated on Figure 4-1, alum addition to the west channel was verified during the months of November, December, and January, along with the period from July-October. Of the 179 days included in this period, the western channel alum addition system appeared to be operational for approximately 113 days, or approximately 63% of the available period of record. The operational status of the west channel injection system over the period of missing data from 1/8/12-7/13/12 is not known. Based upon the review of the operational data, the north inflow channel appeared to be operational during approximately 13 of the 179 days for which data are available, reflecting approximately 7% of the time. Based upon the information summarized in Figure 4-1, it appears that operation of the Booker Lake alum treatment system was sporadic at best. Verifiable operation of the north channel alum addition system is only available for approximately 7% of the period for which data are available, with an operational effectiveness of 63% for the west channel. Unfortunately, the reasons for the poor operational status of the Booker Lake ATS facility are not known. The data do not provide sufficient information to determine the cause of the poor performance, such as equipment problems, poor operational techniques, or lack of sufficient alum within the tank which would cause a low-level shut-down of both injection points. The fact that the system only operated during a portion of the 12-month field monitoring program must be considered when reviewing the results of the post-treatment monitoring program.
0
5
10
15
20
25
30
11 12 1 2 3 4 5 6 7 8 9 10
2011 2012
Operational Days/Month
North Channel West Channel
Operational DataUnavailable
ST. PETERSBURG \ BOOKER LAKE ATS EVALUATION REPORT
4-3
4.2 Surface Water Characteristics 4.2.1 Vertical Field Profiles As discussed in Section 3, vertical field profiles were collected under both pre- and post-treatment conditions in Booker Lake. A complete listing of vertical field profiles collected in Booker Lake under pre- and post-treatment conditions is given in Appendix B, with pre-treatment profiles provided in Appendix B.1 and post-treatment profiles provided in Appendix B.2. 4.2.1.1 Pre-Treatment Vertical Profiles A graphical compilation of pre-treatment vertical field profiles collected at Booker Lake Site 1 from July 2005-June 2006 is given on Figure 4-2. Relatively isograde temperature profiles were observed in Booker Lake during the vast majority of the field monitoring events, with virtually uniform temperature measurements throughout the entire water column. This type of temperature profile is often indicative of a well-mixed waterbody. Classic thermal stratification, defined as a temperature decrease of 1oC or more within a 1 m portion of the water column, was observed only during 2 of the 12 events (March and July). Surface temperature measurements at Site 1 during the field monitoring program ranged from approximately 15-31oC. Overall, the temperature profiles for Site 1 (exhibited on Figure 4-2) indicate a well-mixed water column through much of the year. Surface pH measurements at Site 1 in Booker Lake ranged from approximately 7.4-8.6 during the field monitoring program. Relatively isograde pH profiles were observed in top portions of the water column to a depth of approximately 2-3 m during most events. Below this depth, water column pH decreased steadily, reaching values ranging from 6.7-7.7 near the water-sediment interface.
Measured surface conductivity values at Site 1 under pre-treatment conditions ranged from approximately 230-400 mho/cm. Relatively isograde conductivity profiles were observed during virtually all of the monitoring events to a water depth of approximately 3-4 m. Below this depth, increases in specific conductivity were observed near the water-sediment interface during 6 of the 12 monitoring events, suggesting that internal recycling may occur during portions of the year at Site 1. Measured dissolved oxygen concentrations at Site 1 in Booker Lake were highly variable during the field monitoring program, with surface measurements ranging from approximately 3-11 mg/l. Dissolved oxygen concentrations were generally uniform in upper portions of the water column to a depth of approximately 2-3 m, followed by a relatively rapid decrease in concentrations, with anoxic conditions (defined as dissolved oxygen concentrations less than 1 mg/l) at the water-sediment interface during 9 of the 12 monitoring events. The areas of low dissolved oxygen concentrations at Site 1 correspond closely with the areas of increasing conductivity in lower portions of the water column, indicating that internal recycling is occurring within the sediments at Site 1 under anoxic conditions during a portion of each year. Surface dissolved oxygen concentrations less than the applicable Class III criterion of 5 mg/l, outlined in Section 302 FAC, were observed during 2 of the 12 monitoring events (March and May).
ST. PETERSBURG \ BOOKER LAKE ATS EVALUATION REPORT
4-4
Figure 4-2. Pre-Treatment Vertical Field Profiles Collected at Booker Lake Site 1 from July
2005-June 2006.
Temperature
Temperature (oC)
14 16 18 20 22 24 26 28 30 32 34
Dep
th (
m)
0
1
2
3
4
5
pH
pH (s.u.)
6.5 7.0 7.5 8.0 8.5 9.0D
epth
(m
)
0
1
2
3
4
5
Conductivity
Conductivity (µmho/cm)
100 200 300 400 500 600
Dep
th (
m)
0
1
2
3
4
5
Dissolved Oxygen
Dissolved Oxygen (mg/l)
0 2 4 6 8 10 12 14
Dep
th (
m)
0
1
2
3
4
5
7/21/058/17/059/29/0510/31/05
11/28/0512/19/051/20/062/14/06
3/15/064/13/065/15/066/16/06
ST. PETERSBURG \ BOOKER LAKE ATS EVALUATION REPORT
4-5
A graphical summary of pre-treatment vertical field profiles collected at Booker Lake Site 2 from July 2005-June 2006 is given on Figure 4-3. As indicated on Figure 3-2, pre-treatment Site 2 is located near the center of Booker Lake. Temperature profiles observed at Site 2 are virtually identical to the temperature profiles observed at Site 1, with largely isograde temperature profiles observed during each of the 12 monthly monitoring events. Significant thermal stratification at Site 2 was observed only during November 2005 when thermal stratification was also observed at Site 1. In general, the water column at Site 2 appears to be well-mixed with little vertical change in temperature during most portions of the year. Vertical pH profiles at Site 2 also appear to be similar to the vertical pH profiles observed at Site 1. Surface pH measurements at Site 2 ranged from approximately 7.5-8.7 during the field monitoring program. During approximately half of the field monitoring events, pH profiles were relatively isograde, with uniform pH measurements throughout the entire water column with the exception of areas near the water-sediment interface. On the remaining monitoring dates, pH measurements exhibited a relatively steady decrease in value with increasing water depth, reaching values ranging from 6.6-7.4 near the water-sediment interface. Monitoring events which exhibited the trend of gradually decreasing values from top to bottom within the water column occurred primarily during summer and early fall conditions. Relatively isograde conductivity profiles were observed at Site 2 which appear to be very similar to the vertical profiles for conductivity observed at Site 1. Isograde conductivity values were observed throughout the water column during each of the 12 monitoring events, with substantial increases in conductivity observed near the water-sediment interface during 4 of the 12 monitoring events. The observed increases in conductivity near the water-sediment interface are an indication of likely internal recycling from the sediments of Booker Lake into the overlying water column during portions of the year.
Similar to the trends observed at Site 1, dissolved oxygen concentrations at Site 2 were highly variable, with surface dissolved oxygen concentrations ranging from approximately 3-12 mg/l. During approximately 9 of the 12 monitoring events at Site 2, relatively uniform dissolved oxygen concentrations were observed throughout the water column with rapid decreases in dissolved oxygen observed near the water-sediment interface. During the remaining monitoring events, dissolved oxygen concentrations decreased steadily from the surface to the bottom, with near-anoxic conditions observed at the water-sediment interface. The monitoring events with anoxic conditions in lower portions of the water column correspond closely to the events which exhibited increases in conductivity at the water-sediment interface. Surface dissolved oxygen concentrations less than the Class III criterion of 5 mg/l, outlined in Section 302 FAC, were observed during 2 of the 12 monitoring events. A graphical summary of vertical field profiles collected at Site 3 in Booker Lake from July 2005-June 2006 is given on Figure 4-4. As indicated on Figure 3-1, monitoring Site 3 is located near the outfall channel for Booker Lake on the southeast portion of the lake. Temperature profiles measured at Site 3 exhibited relatively isograde characteristics during virtually all of the field monitoring events, with measured surface temperatures ranging from approximately 15-32oC during the field monitoring program. Classic thermal stratification was observed at Site 3 only during one of the monitoring events (July 2005). In general, the temperature profiles observed at Site 3 are virtually identical to the temperature profiles observed at Sites 1 and 2.
ST. PETERSBURG \ BOOKER LAKE ATS EVALUATION REPORT
4-6
Figure 4-3. Pre-Treatment Vertical Field Profiles Collected at Booker Lake Site 2 from July
2005-June 2006.
Temperature
Temperature (oC)
12 14 16 18 20 22 24 26 28 30 32 34
Dep
th (
m)
0
1
2
3
4
pH
pH (s.u.)
6.5 7.0 7.5 8.0 8.5 9.0
Dep
th (
m)
0
1
2
3
4
Conductivity
Conductivity (µmho/cm)
200 250 300 350 400 450 500 550
Dep
th (
m)
0
1
2
3
4
Dissolved Oxygen
Dissolved Oxygen (mg/l)
0 2 4 6 8 10 12 14
Dep
th (
m)
0
1
2
3
4
7/21/058/17/059/29/0510/31/05
11/28/0512/19/051/20/062/14/06
3/15/064/13/065/15/066/16/06
ST. PETERSBURG \ BOOKER LAKE ATS EVALUATION REPORT
4-7
Figure 4-4. Pre-Treatment Vertical Field Profiles Collected at Booker Lake Site 3 from July
2005-June 2006.
Temperature
Temperature (oC)
12 14 16 18 20 22 24 26 28 30 32 34
Dep
th (
m)
0
1
2
3
4
5
pH
pH (s.u.)
6.5 7.0 7.5 8.0 8.5 9.0D
epth
(m
)
0
1
2
3
4
5
Conductivity
Conductivity (µmho/cm)
200 250 300 350 400 450 500 550
Dep
th (
m)
0
1
2
3
4
5
Dissolved Oxygen
Dissolved Oxygen (mg/l)
0 2 4 6 8 10 12 14
Dep
th (
m)
0
1
2
3
4
5
7/21/058/17/059/29/0510/31/05
11/28/0512/19/051/20/062/14/06
3/15/064/13/065/15/066/16/06
ST. PETERSBURG \ BOOKER LAKE ATS EVALUATION REPORT
4-8
Measured surface pH values at Site 3 ranged from approximately 7.6-8.7 during the field monitoring program. In general, pH profiles observed at Site 3 are very similar to the pH profiles observed at Sites 1 and 2. Relatively uniform pH measurements were observed in upper portions of the water column to a depth of approximately 2 m. Below this depth, pH values decreased steadily with increasing water depth, reaching pH measurements near the water-sediment interface ranging from 6.7-7.2. Measured conductivity profiles at Site 3 are also similar to the profiles measured at Sites 1 and 2. Relatively isograde conductivity measurements were observed throughout the water column with the exception of areas immediately adjacent to the water-sediment interface, with significant increases in conductivity observed in lower portions of the water column during 6 of 12 monitoring events, suggesting that internal recycling is significant at Site 3 in Booker Lake during at least a portion of the year. Monitoring events which exhibited the observed increases in conductivity near the water-sediment interface occurred primarily during summer and early-fall conditions. Measured surface dissolved oxygen concentrations at Site 3 in Booker Lake ranged from approximately 3-12 mg/l during the field monitoring program. Relatively uniform dissolved oxygen concentrations were observed in upper portions of the water column to a depth of approximately 1-2 m. Below this depth, gradual decreases in dissolved oxygen were observed with increasing water depth. Anoxic conditions were observed at the water-sediment interface during 10 of the 12 monitoring events, suggesting that low levels of dissolved oxygen are a chronic problem near the water-sediment interface in this portion of the lake throughout much of the year. Dissolved oxygen concentrations less than the minimum criterion of 5 mg/l, outlined in Section 302 FAC, were observed at Site 3 during 2 of the 12 monitoring events.
4.2.1.2 Post-Treatment Vertical Profiles A graphical compilation of post-treatment vertical field profiles collected in Booker Lake
from November 2011-October 2012 is given on Figure 4-5. As discussed previously, due to the similarities in field measurements observed between the three pre-treatment monitoring sites, post-treatment monitoring was conducted at only a single location near the center of Booker Lake.
In general, vertical field profiles of temperature in Booker Lake under post-treatment
conditions from November 2011-October 2012 appear to be virtually identical to the temperature profiles observed under pre-treatment conditions. Relatively isograde temperature profiles were observed during 10 of the 12 monthly monitoring events. Classic thermal stratification was observed on only one occasion during July 2012. The post-treatment temperature profiles suggest that Booker Lake continues to be a relatively well-mixed waterbody under post-treatment conditions.
ST. PETERSBURG \ BOOKER LAKE ATS EVALUATION REPORT
4-9
Figure 4-5. Post-Treatment Vertical Field Profiles Collected in Booker Lake from November
2011-October 2012.
Temperature
Temperature (oC)
16 18 20 22 24 26 28 30 32
Dep
th (
m)
0
1
2
3
4
pH
pH (s.u.)
6.5 7.0 7.5 8.0 8.5 9.0D
epth
(m
)
0
1
2
3
4
Conductivity
Conductivity (µmho/cm)
200 250 300 350 400 450 500 550
Dep
th (
m)
0
1
2
3
4
Dissolved Oxygen
Dissolved Oxygen (mg/l)
0 2 4 6 8 10 12
Dep
th (
m)
0
1
2
3
4
11/17/1112/29/111/12/122/8/12
3/8/124/10/125/29/126/19/12
7/27/128/29/129/26/1210/18/12
ST. PETERSBURG \ BOOKER LAKE ATS EVALUATION REPORT
4-10
Measured surface pH values in Booker Lake under post-treatment conditions ranged from approximately 7.1-8.8. Relatively isograde pH profiles were observed in upper portions of the water column, extending to depths of approximately 1-2.5 m, followed by a gradual decrease in pH with increasing water depth. Measured pH values near the water-sediment interface under post-treatment conditions ranged from approximately 6.7-7.3. Although measured pH values appear to be relatively similar between pre- and post-treatment conditions, the area of isograde pH conditions appears to extend deeper into the water column under post-treatment conditions compared with pre-treatment conditions. In addition, a majority of pH profiles under post-treatment conditions appear to be concentrated in a relatively narrow pH range of approximately 7.1-7.6.
Conductivity profiles in Booker Lake during the post-treatment conditions exhibited
isograde characteristics throughout virtually the entire water column. Measured conductivity values ranged from approximately 250-400 mho/cm, and appear to be slightly higher in value than conductivity values observed under pre-treatment conditions. Conductivity increases near the water-sediment interface were observed during each of the 12 post-treatment monitoring events, suggesting that internal recycling is occurring, at least in central portions of the lake.
Vertical dissolved oxygen profiles in Booker Lake under post-treatment conditions
appear to be relatively similar to profiles observed under pre-treatment conditions with a few notable exceptions. Only one of the 12 post-treatment monitoring events was characterized by surface dissolved oxygen concentrations less than 5 mg/l. Relatively uniform dissolved oxygen concentrations occurred within the water column to depths ranging from approximately 1.5-2.5 m, followed by a gradual decrease in dissolved oxygen with increasing water depth. Under pre-treatment conditions, dissolved oxygen concentrations near 0 mg/l were observed on multiple occasions at water depths of approximately 2.5 m or greater. However, under post-treatment conditions, dissolved oxygen concentrations in lower portions of the water column were generally higher in value, never reaching a value near 0 mg/l.
In general, post-treatment vertical field profiles are characterized by a more uniform water column pH, with isograde pH conditions extending to deeper water depths than observed under pre-treatment conditions. Isograde conductivity profiles were observed on each of the 12 post-treatment monitoring events, with increases in conductivity observed near the water-sediment interface. Dissolved oxygen concentrations under post-treatment conditions appear to be generally higher in value, particularly near the water-sediment interface, with no measured concentrations near 0 mg/l under post-treatment conditions. As discussed in Section 3.1, continuous measurements of temperature, pH, and specific conductivity were conducted near the outfall for Booker Lake using a YSI recording datasonde unit. This unit provided measurements of the characteristics of water discharging from Booker Lake to downstream waterbodies. A graphical summary of field measurements of temperature and pH in Booker Lake collected by the YSI datasonde from November 2011-October 2012 is given on Figure 4-6. Three separate graphical lines are provided for each of the evaluated parameters which reflect minimum daily values, maximum daily values, and average daily values for each of the monitored parameters. The results of monthly values obtained from the vertical field profiles collected near this location are also included on Figure 4-5 for corroboration purposes. In general, the measurements collected as part of the vertical profile measurement match very closely with the information collected by the YSI datasonde.
ST. PETERSBURG \ BOOKER LAKE ATS EVALUATION REPORT
4-11
Figure 4-6. Field Measurements of Temperature and pH in Booker Lake Collected by the YSI Datasonde from November 2011-October 2012.
Date
11/1/11 3/1/12 7/1/12 11/1/12
Tem
pera
ture
(o C
)
14
16
18
20
22
24
26
28
30
32
34
36
AverageMinMaxMonthly Monitoring
Date
11/1/11 3/1/12 7/1/12 11/1/12
pH (
s.u.
)
6.0
6.5
7.0
7.5
8.0
8.5
9.0
9.5
10.0
ST. PETERSBURG \ BOOKER LAKE ATS EVALUATION REPORT
4-12
Measured temperature values in Booker Lake recorded by the datasonde unit ranged from approximately 16-34oC during the 12-month post-treatment monitoring program. The measured temperature values appear to reflect seasonal patterns which would be expected in a lake in southwest Florida. Measured pH values by the datasonde unit ranged from approximately 7-9 throughout a majority of the field monitoring program. The minimum pH value recorded by the datasonde was approximately 6.7 units which is above the minimum criterion of 6.0 for freshwater Class III waterbodies. Therefore, no violations of the pH criterion were observed during the post-treatment field monitoring program. The vast majority of measured pH values ranged from approximately 7.0-8.5 which is similar to pH values commonly observed in urban lakes. A graphical summary of continuous field measurements of conductivity in Booker Lake collected by the YSI datasonde from November 2011-October 2012 is given on Figure 4-7. During the period from November 2011-June 2012, conductivity measurements in Booker Lake ranged from approximately 375-425 mho/cm and appeared to remain relatively constant over time. However, beginning in June 2012, a decrease in conductivity was observed within Booker Lake for the remainder of the field monitoring program, with measured conductivity values ranging from approximately 200-300 mho/cm. Conductivity values during this period were also highly variable as opposed to the relatively consistent conductivity values observed during the first 8 months of the field monitoring program. The reason for the apparent decreases in conductivity in Booker Lake is not known at this time, although the change in conductivity could be related to high quantities of inflow with substantially lower conductivity values.
Figure 4-7. Continuous Field Measurements of Conductivity in Booker Lake Collected by the
YSI Datasonde from November 2011-October 2012.
Date
11/1/11 3/1/12 7/1/12 11/1/12
Con
duct
ivity
(µ
mho
/cm
)
150
200
250
300
350
400
450
AverageMinMaxMonthly Monitoring
ST. PETERSBURG \ BOOKER LAKE ATS EVALUATION REPORT
4-13
4.2.2 Chemical Characteristics of Pre- and Post-Treatment Surface Water As discussed in Section 3.1, surface water monitoring was conducted in Booker Lake over a 12-month period during both pre- and post-treatment conditions to evaluate changes in water quality characteristics resulting from the alum stormwater treatment system. Pre-treatment surface water monitoring was conducted at each of the 3 monitoring sites indicated on Figure 3-1, with post-treatment surface water monitoring conducted at a single site near the geographic center of the lake. A total of 12 separate monthly monitoring events was conducted during both pre- and post-treatment programs. A summary of the water quality characteristics of Booker Lake under pre- and post-treatment conditions is given in the following sections. 4.2.2.1 Pre-Treatment Characteristics A tabular summary of the chemical characteristics of pre-treatment surface water samples collected in Booker Lake from June 2005-June 2006 is given on Table 4-1. Measured values are provided for each collected sample at each of the 3 pre-treatment surface water monitoring sites. Summary statistics are provided for each of the 3 surface water monitoring sites which includes minimum value, maximum value, median value, and geometric mean value. Since environmental data commonly exhibit log-normal distributions, the geometric mean is used in this evaluation as the primary measure of central tendency for each of the data sets.
A graphical summary of temporal variability in pre-treatment concentrations of pH, alkalinity, conductivity, and TSS in Booker Lake from July 2005-June 2006 is given on Figure 4-8. Individual values are provided for measurements collected at each of the 3 pre-treatment monitoring sites to assist in evaluating horizontal variability in water quality characteristics. Measured water quality characteristics at each of the 3 pre-treatment monitoring sites were extremely close in value for each of the parameters included in Figure 4-8, with the possible exception of one of the TSS measurements conducted at Site 3. Measured pH values at the 3 monitoring sites ranged from approximately 7.5-8.6, with no distinct seasonal patterns. Measured alkalinity values at the 3 monitoring sites were extremely close in value, ranging from 80-150 mg/l. Surface water in Booker Lake appears to be moderately to well-buffered based upon the measured alkalinity values. Extremely close agreement was also obtained between conductivity measurements collected at each of the 3 monitoring sites, with measured conductivity values ranging from approximately 240-400 mho/cm which is typical of conductivity values commonly observed in urban lakes in southwest Florida. Measured TSS values in Booker Lake were generally approximately 10-15 mg/l or less throughout much of the year. More elevated spikes in TSS concentrations were observed during late-fall and early-winter conditions, and may be related to a blue-green algal bloom which is common in Florida lakes during this period. A graphical summary of temporal variability in pre-treatment concentrations of nitrogen species in Booker Lake from July 2005-June 2006 is given on Figure 4-9. Measured concentrations of nitrogen species were highly variable during the pre-treatment surface water monitoring program, particularly for ammonia. However, a relatively close agreement is apparent for measured concentrations between the 3 monitoring sites for each individual monitoring date.
4-14
TABLE 4-1
CHEMICAL CHARACTERISTICS OF PRE-TREATMENT SURFACE WATER SAMPLES COLLECTED IN BOOKER LAKE FROM JUNE 2005 – JUNE 2006
ST. PETERSBURG \ BOOKER LAKE ATS EVALUATION REPORT
4-17
Measured concentrations of ammonia in Booker Lake surface water samples ranged from approximately 10-480 g/l during the field monitoring program. The highest degree of variability appears to occur during fall and early-winter conditions. This type of variability in ammonia concentration during fall and early-winter conditions is sometimes related to release of ammonia from internal recycling from the frequent turnover events that commonly occur during this portion of the year.
Measured concentrations of NOx were generally low in value throughout most of the pre-treatment field monitoring program, with most values ranging from near zero to approximately 30 g/l. However, spikes in NOx concentrations were observed during late-fall and late-winter conditions in Booker Lake, although the magnitude of the observed spikes is relatively low. Measured concentrations of particulate nitrogen in Booker Lake were highly variable during the pre-treatment field monitoring program, with measured concentrations ranging from near zero to 1400 g/l. The lowest observed concentrations of particulate nitrogen under pre-treatment conditions occurred during the wet season conditions, with more elevated concentrations observed during dry season conditions. This type of pattern is often observed in lakes with significant internal recycling which fuels algal growth during fall and winter conditions. Particulate nitrogen is clearly the dominant nitrogen species present in Booker Lake, comprising approximately 60-70% of the total nitrogen measured during the individual monitoring events.
Measured concentrations of total nitrogen in Booker Lake were also highly variable
during the pre-treatment field monitoring program, with measured concentrations ranging from approximately 600-2000 g/l. The temporal trends for total nitrogen are very similar to the trends exhibited by particulate nitrogen since this is the dominant nitrogen species in Booker Lake. In general, total nitrogen concentrations appear to be lowest during wet season conditions, with more elevated values observed during fall and winter conditions. The observed concentrations of total nitrogen in Booker Lake are typical of nitrogen concentrations commonly observed in eutrophic urban lakes.
A graphical summary of temporal variability in pre-treatment concentrations of
phosphorus species in Booker Lake from July 2005-June 2006 is given on Figure 4-10. Similar to the trends observed for the previously discussed water quality parameters, measured concentrations of phosphorus species appear to be similar in value between the 3 monitoring sites during a given monitoring event.
Measured concentrations of soluble reactive phosphorus (SRP) were highly variable
during the pre-treatment monitoring program, with measured values ranging from 1-9 g/l. Although these values are small in comparison to total phosphorus concentrations, the measured SRP concentrations in Booker Lake are substantially elevated compared with SRP values commonly observed in urban lakes which typically are less than 2-4 g/l. Significant spikes in SRP concentrations were observed at each of the 3 monitoring sites during December 2005 and April 2006. These observed increases in concentrations may be related to a significant rain event or, more likely, evidence of upwelling of nutrients released from the lake sediments.
ST. PETERSBURG \ BOOKER LAKE ATS EVALUATION REPORT
4-18
Figure 4-10. Variability in Pre-Treatment Concentrations of Phosphorus Species in Booker Lake from July 2005-June 2006.
ST. PETERSBURG \ BOOKER LAKE ATS EVALUATION REPORT
4-19
Measured concentrations of dissolved organic phosphorus were generally low in value throughout the initial 8-9 months of the field monitoring program, with measured values ranging from near 0 to 20 g/l. A steady increase in dissolved organic phosphorus was observed in Booker Lake beginning in April 2006 and continuing until the end of the pre-treatment monitoring program in June 2006. Measured concentrations of dissolved organic phosphorus were extremely close in value between the 3 monitoring sites.
Measured concentrations of particulate phosphorus in Booker Lake ranged from
approximately 50-160 g/l during the field monitoring program. In general, particulate phosphorus concentrations appear to be slightly greater during dry season conditions compared with wet season conditions. This type of pattern is often associated with internal recycling processes in eutrophic lakes. Particulate phosphorus is clearly the dominant form of phosphorus in Booker Lake, comprising 80-90% of the total phosphorus measured during each monitoring event.
Measured concentrations of total phosphorus exhibit a temporal pattern which is virtually
identical to the pattern exhibited by particulate phosphorus. In general, total phosphorus concentrations in Booker Lake appear to be greatest during dry season conditions, with lower values measured during wet season conditions. The observed total phosphorus concentrations in Booker Lake are extremely elevated in value and much greater than total phosphorus concentrations commonly observed in urban lakes.
A graphical summary of temporal variability in pre-treatment concentrations of
chlorophyll-a, Secchi disk depth, and dissolved aluminum in Booker Lake from July 2005-June 2006 is given on Figure 4-11. Measured concentrations of chlorophyll-a in Booker Lake ranged from approximately 20-160 mg/m3 during the pre-treatment monitoring program, although the majority of values appear to range between 40-100 mg/m3. Spikes in chlorophyll-a were observed during August 2005, presumably resulting from stormwater loadings to the lake, and from November-December 2005 which may be associated with nutrients introduced from internal recycling. Chlorophyll-a concentrations during the remaining portions of the pre-treatment monitoring program were relatively consistent in value.
Measured Secchi disk depth in Booker Lake under pre-treatment conditions ranged from
approximately 0.5-1 m, with higher Secchi disk depth readings observed during wet season conditions and lower readings observed during dry season conditions. Recorded measurements between the 3 monitoring sites were extremely close in value throughout the entire field monitoring program. Measured concentrations of dissolved aluminum in Booker Lake were highly variable during the pre-treatment monitoring program, with measured concentrations ranging from 10-140 g/l, although the majority of measured values were less than 80 g/l.
ST. PETERSBURG \ BOOKER LAKE ATS EVALUATION REPORT
4-20
Figure 4-11. Variability in Pre-Treatment Concentrations of Chlorophyll-a, Secchi Disk Depth,
and Dissolved Aluminum in Booker Lake from July 2005-June 2006.
ST. PETERSBURG \ BOOKER LAKE ATS EVALUATION REPORT
4-21
In summary, pre-treatment water quality in Booker Lake is characterized by a relatively high degree of variability in concentrations for virtually all of the measured parameters which is a common characteristic of eutrophic waterbodies. Booker Lake contained highly variable and sometimes elevated concentrations of ammonia which, when combed with elevated pH values observed at times, could generate toxic levels of unionized ammonia. Measured total nitrogen concentrations within the lake were highly variable during the pre-treatment monitoring program, although the measured values are typical of total nitrogen concentrations commonly observed in urban lakes. Highly variable concentrations were observed for species of phosphorus, with particularly elevated levels for SRP and total phosphorus. The measured concentrations of total phosphorus in Booker Lake are substantially greater in value than phosphorus concentrations observed in eutrophic waterbodies. Measured concentrations of chlorophyll-a were also highly variable, with peaks in concentrations under both wet season and dry season conditions. Patterns of nutrient concentrations, chlorophyll-a, and Secchi disk depths in Booker Lake suggest that nutrient loadings, particularly for phosphorus, may be greater during dry season conditions. Increases in phosphorus loadings during dry season conditions often suggest the presence of internal recycling or a significant groundwater influence, particularly in view of the high levels of phosphorus in Pinellas County soils.
4.2.2.2 Post-Treatment Characteristics A tabular summary of the chemical characteristics of post-treatment surface water
samples collected in Booker Lake from November 2011-October 2012 is given on Table 4-2. As discussed previously, surface water monitoring under post-treatment conditions was conducted at a single monitoring location near the center of the lake since the pre-treatment field monitoring program indicated that Booker Lake is well-mixed. Summary statistics are provided which include minimum value, maximum value, median value, and geometric mean value. Since environmental data commonly exhibit log-normal distributions, the geometric mean is used in this evaluation as the primary measure of central tendency for each of the data sets.
A graphical summary of temporal variability in post-treatment concentrations of pH,
alkalinity, conductivity, and TSS in Booker Lake from November 2011-October 2012 is given on Figure 4-12. Measured pH values in Booker Lake under post-treatment conditions ranged from approximately 7-8.2 and appear to be slightly lower than pH values measured during pre-treatment conditions. No significant seasonal trend is apparent in measured pH values within the lake.
Measured alkalinity values in Booker Lake under post-treatment conditions are similar in
value to alkalinity measurements conducted under pre-treatment conditions, with more elevated concentrations during fall and winter conditions and lower alkalinity measurements during other portions of the year. A similar pattern is also exhibited by conductivity which appears to have more elevated values during dry season conditions compared with wet season conditions. This same pattern was observed under pre-treatment conditions. Measured TSS concentrations in Booker Lake were substantially lower in value during the post-treatment program than measured during the pre-treatment program, although a peak in concentration as high as 20 mg/l was observed on one occasion.
TA
BL
E 4
-2
CH
EM
ICA
L C
HA
RA
CT
ER
IST
ICS
O
F P
OS
T-T
RE
AT
ME
NT
S
UR
FA
CE
W
AT
ER
SA
MP
LE
S C
OL
LE
CT
ED
IN
B
OO
KE
R L
AK
E F
RO
M
NO
VE
MB
ER
2011 –
OC
TO
BE
R 2012
S
am
ple
Loca
tion
Sit
e
Da
te
Co
llec
ted
pH
(s.u
.)
Alk
.
(mg/l
)
NH
3
(g/l
)
NO
x
(g
/l)
Dis
s.
Org
. N
(g
/l)
Pa
rt.
N
(g
/l)
To
tal
N
(g
/l)
SR
P
(g
/l)
Dis
s.
Org
. P
(g
/l)
Pa
rt.
P
(g
/l)
To
tal
P
(g
/l)
Tu
rb
.
(NT
U)
Colo
r
(Pt-
Co)
Ch
yl-
a
(mg/m
3)
TS
S
(mg/l
)
BO
D
(mg/l
)
Fecal
(cfu
/100 m
l)
Al
(g/l
)
Mid
dle
11
/17
/11
8.2
3
12
0
18
3
64
5
17
7
84
3
1
1
84
86
6.7
2
7
53
.9
13
.0
4.9
5
8
50
12
/29
/11
7.0
9
13
5
28
5
59
41
0
15
0
90
4
3
2
85
90
5.6
2
8
31
.6
6.2
5
.2
78
53
1/1
2/1
2
7.5
4
13
2
20
5
13
6
21
9
11
3
67
3
2
1
55
58
6.8
2
3
13
8
12
.8
5.1
8
1
43
2/8
/12
7.5
1
13
3
66
6
23
0
24
8
55
0
3
9
11
4
12
6
6.5
2
8
10
4
10
.9
4.8
4
6
71
3/8
/12
7.5
3
13
7
10
4
14
1
32
2
47
7
3
6
93
10
2
9.6
2
2
10
2
20
.0
5.7
5
7
10
4
4/1
0/1
2
8.1
6
13
4
3
3
17
5
23
3
41
4
3
9
48
60
5.8
2
9
33
.6
10
.4
4.0
2
0
13
1
5/2
9/1
2
7.3
5
98
.8
53
3
10
8
13
9
30
3
1
6
52
59
4.4
2
3
14
.5
6.9
3
.8
30
15
9
6/1
9/1
2
7.4
9
92
.4
37
3
19
4
22
7
46
1
2
1
53
56
4.9
1
7
63
.1
8.6
5
.0
35
13
2
8/7
/12
7.1
1
82
.6
25
3
89
14
1
26
2
74
5
3
3
34
40
5.5
2
1
26
.2
7.2
3
.3
50
95
8/2
9/1
2
7.0
2
79
.2
8
32
12
6
18
9
35
5
3
3
28
34
3.7
2
0
50
.0
3.0
3
.1
39
10
9
9/2
6/1
2
7.4
4
92
.6
3
11
18
7
15
7
35
8
2
3
39
44
4.8
3
0
51
.2
8.8
3
.8
25
16
8
10
/18
/12
7.5
4
96
.8
65
29
14
7
16
0
40
1
3
4
21
28
3.8
2
1
37
.3
6.5
3
.0
73
11
2
Min
imu
m V
alu
e:
7.0
2
79
.2
3
3
10
8
11
3
30
3
1
1
21
28
3.7
1
7
14
.5
3.0
3
.0
20
43
Ma
xim
um
Va
lue:
8
.23
13
7
28
5
13
6
64
5
32
2
90
4
3
9
11
4
12
6
9.6
3
0
13
8
20
.0
5.7
8
1
16
8
Med
ian
Va
lue
7.5
0
10
9
45
9
18
1
18
3
46
9
3
3
53
59
5.6
2
3
50
.6
8.7
4
.4
48
10
7
Geo
met
ric
Mea
n:
7.4
9
10
9
33
12
19
7
19
0
50
8
2
3
52
59
5.5
2
4
49
.0
8.6
4
.2
45
94
4-22
ST
. P
ET
ER
SB
UR
G \
BO
OK
ER
L
AK
E
AT
S E
VA
LU
AT
ION
R
EP
OR
T
ST. PETERSBURG \ BOOKER LAKE ATS EVALUATION REPORT
4-23
Figure 4-12. Variability in Post-Treatment Concentrations of pH, Alkalinity, Conductivity, and
TSS in Booker Lake from November 2011-October 2012.
ST. PETERSBURG \ BOOKER LAKE ATS EVALUATION REPORT
4-24
A graphical summary of temporal variability in post-treatment concentrations of nitrogen species in Booker Lake from November 2011-October 2012 is given on Figure 4-13. Under post-treatment conditions, ammonia concentrations exhibited peaks in value during late-fall/ early-winter and during the summer season, with measured concentrations ranging from approximately 250-300 g/l. During remaining portions of the year, ammonia concentrations in Booker Lake were typically less than 50 g/l. A similar pattern was also observed for concentrations of NOx, with peaks during late-fall/winter conditions and during the summer rainy season, although the observed peak concentrations were only moderate in value. During other portions of the year, measured concentrations of NOx were generally less than 40 mg/l, reflecting extremely low concentrations. Measured concentrations of particulate nitrogen under post-treatment conditions ranged from approximately 100-300 g/l, with peak concentrations observed during late-winter and summer conditions, although the relative increase in concentrations for particulate nitrogen is not as great as the observed increases for ammonia and NOx.
Measured concentrations of total nitrogen in Booker Lake during the post-treatment
monitoring program ranged from approximately 300-900 g/l. The most elevated total nitrogen concentrations were observed during late-fall/early-winter and summer conditions, similar to the peaks exhibited by ammonia and NOx. However, measured concentrations of total nitrogen under post-treatment conditions were generally low in value in comparison with nitrogen concentrations commonly observed in urban lakes.
A graphical summary of temporal variability in post-treatment concentrations of
phosphorus species in Booker Lake from November 2011-October 2012 is given on Figure 4-14. In general, SRP concentrations were low in value under post-treatment conditions, with measured values ranging from 1-3 g/l. Concentrations of dissolved organic phosphorus were also low in value, ranging from 1-9 g/l. Moderate concentrations of particulate phosphorus were observed during the post-treatment monitoring program, with measured values ranging from approximately 20-110 g/l. However, the majority of measured concentrations were less than 50 g/l.
Trends in total phosphorus concentrations generally mimic the trends exhibited by
particulate phosphorus since particulate phosphorus is the dominant phosphorus species present under post-treatment conditions, representing more than 90% of the total phosphorus present during most of the monitoring events. In general, post-treatment total phosphorus concentrations were low in value, particularly during the final 6 months of the field monitoring program. Temporal trends in post-treatment concentrations of chlorophyll-a, Secchi disk depth, and dissolved aluminum in Booker Lake from November 2011-October 2012 are summarized on Figure 4-15. Measured concentrations of chlorophyll-a exhibited a peak in late-fall/early-winter, with concentrations reaching approximately 140 mg/m3. However, during much of the remaining portion of the year, chlorophyll-a concentrations were generally 60 mg/m3 or less, reflecting moderately elevated values. Measured Secchi disk depths under post-treatment conditions ranged from approximately 0.4-1.0 m, reflecting poor to moderate water clarity. Water clarity was poorest during fall and winter conditions, with the greatest transparency observed during wet season conditions.
ST. PETERSBURG \ BOOKER LAKE ATS EVALUATION REPORT
4-25
Figure 4-13. Variability in Post-Treatment Concentrations of Nitrogen Species in Booker Lake
ST. PETERSBURG \ BOOKER LAKE ATS EVALUATION REPORT
4-28
Measured concentrations of dissolved aluminum in Booker Lake under post-treatment conditions ranged from approximately 40-160 g/l, although the vast majority of measured values were less than 120 g/l. The observed concentrations for dissolved aluminum are moderate to low in value and well below concentrations which would create toxicity concerns in Florida lakes. 4.2.2.3 Comparison of Pre- vs. Post-Characteristics A graphical comparison of pre- vs. post-treatment concentrations of pH, alkalinity, conductivity, and TSS in Booker Lake is given on Figure 4-16. Under post-treatment conditions, measured pH values in Booker Lake ranged from approximately 7.0-8.3, with pre-treatment pH measurements ranging from 7.6-8.6. Post-treatment pH values were lower in value than pre-treatment measurements during 10 of the 12 monitoring events. Since the addition of alum results in a reduction in pH, the observed lower pH values under post-treatment conditions are presumably due to addition of alum to the lake. Measured alkalinity values under pre- and post-treatment conditions were very similar during the initial 6-7 months of field monitoring. However, during summer and fall conditions, measured alkalinity values were slightly lower under post-treatment conditions, presumably resulting from alkalinity consumption by the alum addition. The minimum measured alkalinity value in Booker Lake was approximately 80 mg/l under both pre- and post-treatment conditions, reflecting moderately well-buffered conditions. Measured conductivity values in Booker Lake appear to be relatively similar under both pre- and post-treatment conditions, with more elevated conductivity values observed under post-treatment conditions during 6 of the monitoring events and more elevated conductivity values under pre-treatment conditions during the remaining events. In general, the alum treatment system does not appear to have had a significant impact on the measured conductivity values in Booker Lake.
Measured concentrations of TSS in Booker Lake appear to be relatively similar under pre- and post-treatment conditions during a majority of the monitoring events. With the exception of the December monitoring event, there appears to be no significant difference between TSS measurements conducted under pre- vs. post-treatment conditions. A graphical comparison of pre- vs. post-treatment concentrations of nitrogen species in Booker Lake is given on Figure 4-17. Measured concentrations of ammonia, particulate nitrogen, and total nitrogen were generally lower in value under post-treatment conditions than observed under pre-treatment conditions, with the exception of monitoring conducted during July. For total nitrogen, post-treatment concentrations appear to be substantially lower in value than the pre-treatment measurements. It appears that the alum treatment system provided reductions in concentrations of ammonia, particulate nitrogen, and total nitrogen, with no significant change in measured concentrations of NOx.
ST. PETERSBURG \ BOOKER LAKE ATS EVALUATION REPORT
4-29
Figure 4-16. Comparison of Pre- vs. Post-Treatment Concentrations of pH, Alkalinity, Conductivity, and TSS in Booker Lake.
pH (
s.u.
)
6.8
7.2
7.6
8.0
8.4
8.8
PrePost
Alk
alin
ity (
mg/
l)
60
80
100
120
140
160
Con
duct
ivity
(µ
mho
/cm
)
200
240
280
320
360
400
440
Jan Feb Mar April May June July Aug Sept Oct Nov Dec
TS
S (
mg/
l)
0
5
10
15
20
25
30
35
Month
ST. PETERSBURG \ BOOKER LAKE ATS EVALUATION REPORT
4-30
Figure 4-17. Comparison of Pre- vs. Post-Treatment Concentrations of Nitrogen Species in
Booker Lake.
Am
mon
ia (
µg/
l)
0
100
200
300
400
500
PrePost
NO
x (µ
g/l)
0
20
40
60
80
100
120
140
160
180
Pa
rtic
ulat
e N
(µ
g/l)
0
200
400
600
800
1000
1200
Jan Feb Mar April May June July Aug Sept Oct Nov Dec
Tot
al N
(µ
g/l)
200
400
600
800
1000
1200
1400
1600
1800
Month
ST. PETERSBURG \ BOOKER LAKE ATS EVALUATION REPORT
4-31
A graphical comparison of pre- vs. post-treatment concentrations of phosphorus species in Booker Lake is given on Figure 4-18. Post-treatment concentrations for SRP, dissolved organic phosphorus, particulate phosphorus, and total phosphorus are all lower in value during a majority of the monitoring events compared with pre-treatment conditions. The observed differences in phosphorus concentrations under pre- and post-treatment conditions are particularly visible for dissolved organic phosphorus, particulate phosphorus, and total phosphorus. Post-treatment concentrations of total phosphorus in Booker Lake ranged from approximately 25-120 g/l, with pre-treatment concentrations ranging from approximately 80-140 g/l. A graphical comparison of pre- vs. post-treatment concentrations of chlorophyll-a, Secchi disk depth, and dissolved aluminum in Booker Lake is given on Figure 4-19. During the first few months of the field monitoring program, post-treatment concentrations of chlorophyll-a were higher in value than pre-treatment concentrations. However, beginning in April, post-treatment chlorophyll-a concentrations were substantially lower in value than the pre-treatment values. A similar pattern was also observed for Secchi disk depth, with lower Secchi disk depths observed under post-treatment conditions during the initial few months of the monitoring program, followed by substantially greater Secchi disk depths under post-treatment conditions for much of the remainder of the monitoring program. Pre-treatment concentrations of dissolved aluminum in Booker Lake ranged from approximately 10-100 g/l. Under post-treatment conditions, dissolved aluminum concentrations ranged from 40-170 g/l, reflecting an increase under post-treatment conditions. However, although slight increases in dissolved aluminum were observed, the resulting absolute concentrations are well below any documented toxicity levels for Florida fauna or flora. A comparison of mean pre- and post-treatment characteristics in Booker Lake is given on Table 4-3. The data summarized in Table 4-3 reflect mean values for the entire 12-month pre- and post-treatment monitoring programs. Reductions in concentrations were observed under post-treatment conditions for each of the measured parameters, with the exception of dissolved aluminum which exhibited a slight increase. Measured concentrations of pH decreased by approximately 8% under post-treatment conditions, with a 5% decrease in alkalinity. Substantial reductions were observed for nitrogen species, with a 68% reduction in ammonia, 42% reduction in NOx, 34% reduction in dissolved organic nitrogen, 55% reduction in particulate nitrogen, and 51% in total nitrogen.
Similar removal efficiencies were also observed for measured phosphorus species, with a 15% reduction in SRP, 72% reduction in dissolved organic phosphorus, 45% reduction in particulate phosphorus, and 47% reduction in total phosphorus. Alum is well known for its ability to remove inorganic phosphorus, and the observed relatively low removal efficiencies for phosphorus appear to be related to the sporadic operation of the system. Alum treatment of runoff entering Booker Lake resulted in a 2% reduction in turbidity, 10% reduction in color, 26% reduction in chlorophyll-a, and a 10% reduction in TSS. For chlorophyll-a, post-treatment concentrations decreased from 66.6 mg/m3 under pre-treatment conditions to 49.0 mg/m3 under post-treatment conditions. Measured BOD concentrations were reduced by approximately 10%, with a 53% reduction in fecal coliform bacteria. Removal efficiencies for these parameters are also substantially lower than commonly observed and are also likely related to the sporadic system operation. The only parameter which exhibited an increase in concentration was dissolved aluminum, which increased from 39 mg/l to 94 mg/l. However, the observed increased concentrations of aluminum are well below concentrations which would cause toxicity issues to flora or fauna in the State of Florida.
ST. PETERSBURG \ BOOKER LAKE ATS EVALUATION REPORT
4-32
Figure 4-18. Comparison of Pre- vs. Post-Treatment Concentrations of Phosphorus Species in
Booker Lake.
SR
P (
µg/
l)
0
2
4
6
8
10
PrePost
Dis
s. O
rga
nic
P (
µg/
l)
0
5
10
15
20
25
30
Par
ticul
ate
P (
µg/
l)
0
20
40
60
80
100
120
140
Jan Feb Mar April May June July Aug Sept Oct Nov Dec
To
tal P
(µ
g/l)
20
40
60
80
100
120
140
160
Month
ST. PETERSBURG \ BOOKER LAKE ATS EVALUATION REPORT
4-33
Figure 4-19. Comparison of Pre- vs. Post-Treatment Concentrations of Chlorophyll-a, Secchi
Disk Depth, and Dissolved Aluminum in Booker Lake.
Month
Jan Feb Mar April May June July Aug Sept Oct Nov Dec
Chl
orop
hyl
l -a
(mg/
m3)
0
20
40
60
80
100
120
140
160
PrePost
Month
Jan Feb Mar April May June July Aug Sept Oct Nov Dec
Sec
chi (
m)
0.0
0.2
0.4
0.6
0.8
1.0
1.2
Jan Feb Mar April May June July Aug Sept Oct Nov Dec
Dis
solv
ed A
l (µ
g/l)
0
20
40
60
80
100
120
140
160
180
Month
ST. PETERSBURG \ BOOKER LAKE ATS EVALUATION REPORT
4-34
TABLE 4-3
COMPARISON OF MEAN PRE- AND POST- TREATMENT CHARACTERISTICS IN BOOKER LAKE
PARAMETER UNITS PRE-
TREATMENT1 (7/05-6/06)
POST- TREATMENT1
(11/11-10/12)
PERCENT CHANGE
(%)
pH s.u. 8.12 7.49 -8
Alkalinity mg/l 115 109 -5
NH3 g/l 104 33 -68
NOx g/l 21 12 -42
Diss. Organic N g/l 300 197 -34
Particulate N g/l 418 190 -55
Total N g/l 1,037 508 -51
SRP g/l 3 2 -15
Diss. Organic P g/l 11 3 -72
Particulate P g/l 96 52 -45
Total P g/l 112 59 -47
Turbidity NTU 5.6 5.5 -2
Color Pt-Co 26 24 -10
Chlorophyll-a mg/m3 66.6 49.0 -26
TSS mg/l 9.6 8.6 -10
BOD mg/l 4.7 4.2 -10
Fecal Coliform cfu/100 ml 97 45 -53
Aluminum g/l 39 94 139 1. Includes all data collected during the pre- and post-treatment monitoring programs
4.3 Sediment Characteristics
This section provides a discussion of the physical and chemical characteristics of sediment samples collected in Booker Lake under pre- and post-treatment conditions. 4.3.1 Pre-Treatment Sediment Characteristics As discussed in Section 3.2, pre-treatment sediment core samples were collected in Booker Lake at each of the 3 monitoring locations indicated on Figure 3-1 on July 21, 2005 near the beginning of the pre-treatment field monitoring program. Triplicate core samples were collected at each of the 3 monitoring sites, with the triplicate samples combined together to form a single composite sediment sample for each of the 3 monitoring sites. Each of the collected pre-treatment sediment samples was evaluated for general characteristics and nutrients.
ST. PETERSBURG \ BOOKER LAKE ATS EVALUATION REPORT
4-35
A summary of the characteristics of pre-treatment sediment core samples collected in Booker Lake on July 21, 2005 is given on Table 4-4. The collected sediment samples were slightly acidic, with measured pH values ranging from 6.42-6.59 and an overall geometric mean of 6.48. The pre-treatment sediment samples were characterized by elevated moisture contents ranging from 65.9-79.2%, with an overall geometric mean of 73.6%. Sediments with moisture contents in this range are commonly associated with organic muck type sediments. Measured organic contents within the sediments ranged from 19.2-40.4%, with an overall geometric mean of 25.2%. Sediments with organic contents in this range are also characteristic of highly organic muck type sediments. Measured sediment densities were also low in value, ranging from 1.19-1.41 g/cm3 with an overall geometric mean of 1.29 g/cm3. Sediments with measured densities less than approximately 1.5 g/cm3 are also indicative of organic muck type sediments.
TABLE 4-4
CHARACTERISTICS OF PRE-TREATMENT SEDIMENT CORE SAMPLES COLLECTED IN BOOKER LAKE ON JULY 21, 2005
SITE pH
(s.u.)
MOISTURECONTENT
(%)
ORGANIC CONTENT
(%)
DENSITY (g/cm3)
TOTAL NITROGEN
(g/cm3)
TOTAL PHOSPHORUS
(g/cm3)
1 6.44 65.9 19.2 1.41 638 548
2 6.42 76.3 20.7 1.28 589 507
3 6.59 79.2 40.4 1.19 585 407
Geometric Mean 6.48 73.6 25.2 1.29 604 483
Relatively low levels of total nitrogen were measured in the pre-treatment Booker Lake sediment core samples, with values ranging from 585-638 g/cm3 and an overall geometric mean of 604 g/cm3. Sediment nitrogen concentrations in this range are somewhat lower than nitrogen concentrations commonly observed in lake sediments. Measured phosphorus concentrations in the pre-treatment Booker Lake sediment core samples ranged from 407-548 g/cm3, with an overall geometric mean of 483 g/cm3. Phosphorus concentrations in this range are typical of concentrations commonly observed in urban lakes.
Overall, the pre-treatment sediment characteristics in Booker Lake are similar to
characteristics commonly observed in sediments of eutrophic lakes. The pre-treatment samples were characterized by elevated levels of moisture content and organic content and low wet density values, all of which are consistent with organic muck.
ST. PETERSBURG \ BOOKER LAKE ATS EVALUATION REPORT
4-36
4.3.2 Post-Treatment Sediment Characteristics Post-treatment sediment core samples were collected in Booker Lake on October 18, 2012 near the completion of the post-treatment monitoring program. During the post-treatment sediment monitoring event, each of the triplicate core samples was placed into separate bottles and analyzed separately, resulting in a total of 9 individual core samples submitted for analysis. The post-treatment sediment core samples were collected from the same monitoring locations indicated on Figure 3-1. Laboratory analyses were conducted for general sediment characteristics, along with sediment phosphorus speciation. A summary of the characteristics of post-treatment sediment core samples collected in Booker Lake is given on Table 4-5. Mean values for each of the triplicate samples collected at the 3 monitoring locations are provided at the bottom of Table 4-5, along with an overall geometric mean for the post-treatment sediment characteristics. Post-treatment sediments collected in Booker Lake were slightly acidic, with mean pH values measured at each of the 3 monitoring sites ranging from 6.47-6.49. The post-treatment sediment core samples were also characterized by substantially elevated moisture contents, with mean values for the 3 sites ranging from 73.6-79.7%, and elevated organic contents, ranging from 21.1-30.4% between the 3 monitoring sites. The elevated concentrations observed for moisture content and organic content are indicative of organic muck type sediments. Measured wet densities for the three monitoring sites ranged from 1.21-1.3 g/cm3, also indicative of highly organic sediments.
TABLE 4-5
CHARACTERISTICS OF POST-TREATMENT SEDIMENT CORE SAMPLES COLLECTED IN BOOKER LAKE ON OCTOBER 18, 2012
SITE pH MOISTURE CONTENT
(%)
ORGANIC CONTENT
(%)
DENSITY (g/cm3)
TOTAL N
(g/cm3)
TOTAL P
(g/cm3)
SALOID- BOUND
P (g/cm3)
IRON- BOUND
P (g/cm3)
TOTAL AVAILABLE
P
Al- BOUND
P (g/cm3) (g/cm3)
% of TP
1-A 6.45 65.9 15.8 1.43 524 459 13 66 79 17 256
1-B 6.49 76.3 23.6 1.27 540 473 9 65 74 16 246
1-C 6.46 79.2 25.0 1.23 500 435 11 63 73 17 234
2-A 6.47 82.9 28.4 1.18 519 393 11 57 69 17 200
2-B 6.51 79.0 24.4 1.24 536 334 10 51 61 18 195
2-C 6.50 72.4 20.9 1.33 523 373 12 55 67 18 222
3-A 6.46 80.7 32.4 1.20 526 449 12 61 73 16 227
3-B 6.53 80.4 31.2 1.20 548 404 8 57 65 16 200
3-C 6.49 77.5 27.8 1.24 527 310 8 55 63 20 180
Mean
Values
1 6.47 73.6 21.1 1.31 521 456 11 65 76 17 245
2 6.49 78.0 24.4 1.25 526 366 11 55 65 18 205
3 6.49 79.6 30.4 1.21 534 383 9 58 67 17 201
Overall Mean
6.48 77.0 25.0 1.26 527 400 10 59 69 17 216
ST. PETERSBURG \ BOOKER LAKE ATS EVALUATION REPORT
4-37
Measured sediment concentrations of total nitrogen were relatively consistent between
the 3 post-treatment monitoring sites, ranging from 521-534 g/cm3. Total nitrogen concentrations in this range are somewhat lower than nitrogen concentrations commonly observed in urban lakes. Measured total phosphorus concentrations in the post-treatment sediments ranged from 366-456 g/cm3 between the 3 monitoring sites which are typical of values commonly observed in urban lakes. As discussed in Section 3.2.2, a fractionation procedure for inorganic sediment phosphorus was also conducted on the post-treatment sediment core samples collected from Booker Lake. Saloid-bound phosphorus (reflecting phosphorus which is soluble or easily exchangeable within the sediments) ranged from 9-11 g/cm3 between the 3 monitoring sites. Values in this range are typical of saloid-bound phosphorus concentrations commonly observed in untreated lake sediments. Iron-bound phosphorus concentrations in the sediments ranged from 55-65 g/cm3 which is also typical of the range of iron-bound phosphorus concentrations observed in untreated lake sediments. Total available phosphorus (defined as the sum of saloid plus iron-bound phosphorus) ranged from 65-76 g/cm3 which is also typical of values commonly observed in untreated lake sediments. Overall, the available phosphorus within the sediments reflected approximately 17-18% of the total phosphorus present within the sediments. Aluminum-bound phosphorus concentrations in the post-treatment sediment core samples ranged from 201-245 g/cm3. These values are substantially greater than aluminum-bound phosphorus concentrations observed in urban lakes and indicate that approximately half of the phosphorus within the sediments in bound with aluminum. Since these elevated aluminum-bound concentrations were observed throughout the entire lake, it is unlikely that these values were significantly impacted by accumulation of alum floc within the sediments and appear to indicate a high natural bonding of sediment phosphorus with aluminum in Booker Lake which appears to be unrelated to the alum treatment system. 4.3.3 Comparison of Pre- vs. Post-Treatment Sediment Characteristics A comparison of pre- and post-treatment sediment characteristics in Booker Lake is given on Table 4-6. Mean values are provided for measured sediment characteristics at each of the 3 sites under pre- and post-treatment conditions as well as overall mean values for each of the two monitoring events. Operation of the alum treatment system does not appear to have resulted in any measurable change in sediment pH at any of the 3 monitoring sites, with mean sediment pH values under pre- and post-treatment conditions each equal to 6.48. Operation of the alum stormwater treatment system resulted in slight increases in measured moisture contents at Sites 1 and 2, with no measurable change in moisture content in sediments collected at Site 3. Overall, the pre-treatment sediment core samples were characterized by a mean moisture content of 73.6% compared with a mean moisture content of 77.0% for the post-treatment samples. Although this difference is not statistically significant, introduction of alum floc into sediments has been shown to result in slight increases in moisture content due to the relatively high moisture content of alum floc.
ST. PETERSBURG \ BOOKER LAKE ATS EVALUATION REPORT
4-38
TABLE 4-6
COMPARISON OF PRE- AND POST-TREATMENT
SEDIMENT CHARACTERISTICS IN BOOKER LAKE
SITE CONDITION pH MOISTURECONTENT
(%)
ORGANIC CONTENT
(%)
DENSITY(g/cm3)
TOTAL NITROGEN
(g/cm3)
TOTAL PHOSPHORUS
(g/cm3)
1 Pre 6.44 65.9 19.2 1.41 638 548 Post 6.47 73.6 21.1 1.31 521 456
2 Pre 6.42 76.3 20.7 1.28 589 507 Post 6.49 78.0 24.4 1.25 526 366
3 Pre 6.59 79.2 40.4 1.19 585 407 Post 6.49 79.6 30.4 1.21 534 383
Overall Mean
Pre 6.48 73.6 25.2 1.29 604 483 Post 6.48 77.0 25.0 1.26 527 400
Similar to the trends observed for moisture content, slight increases in organic content were observed at Sites 1 and 2, although a reduction in organic content was observed at Site 3. Overall, the pre-treatment mean sediment organic content was approximately 25.2% compared with a post-treatment organic content of 25.0%. In general, operation of the alum treatment system does not appear to have significantly impacted organic content within the sediments of Booker Lake. Slight reductions in sediment density were observed at Sites 1 and 2 under post-treatment conditions, with no significant change in measured density values at Site 3. The observed reductions in sediment density at Sites 1 and 2 are likely related to the additional moisture content of the alum floc which may have accumulated in these areas. Overall, the pre-treatment mean wet sediment density was 1.29 g/cm3 compared with a post-treatment wet density of 1.26 g/cm3.
Measured sediment nitrogen concentrations in Booker Lake were relatively similar under pre- and post-treatment conditions. Sediment nitrogen concentrations are often highly variable in lakes, and the observed differences in pre- and post-treatment sediment nitrogen concentrations are within the normal range of variability anticipated when collecting and analyzing lake sediments for nitrogen. The pre-treatment mean total sediment nitrogen concentration was 604 g/cm3 compared with a post-treatment mean total nitrogen concentration of 527 g/cm3. Since there is no conceivable mechanism by which alum should alter sediment nitrogen concentrations, the observed differences in concentrations are likely related to ordinary variability within the lake. Measured concentrations of total phosphorus were relatively similar in Booker Lake under both pre- and post-treatment conditions. Since alum floc binds with sediment phosphorus, but does not eliminate it, there should be no significant difference between measured phosphorus concentrations under pre- and post-treatment conditions. The measured mean total phosphorus concentration under pre-treatment concentrations was 483 g/cm3 compared with a post-treatment mean phosphorus sediment concentration of 400 g/cm3. These apparent differences are likely due to normal variability in collection and analysis of sediment phosphorus.
ST. PETERSBURG \ BOOKER LAKE ATS EVALUATION REPORT
4-39
In general, operation of the alum treatment system for Booker Lake has not resulted in any significant changes to sediment characteristics within the lake. Addition of the alum floc has had no impact on pH, although a slight increase in moisture content may have occurred. Virtually no change is apparent in measured organic contents within the lake sediments. Measured concentrations of total nitrogen and total phosphorus in the lake sediments are relatively similar under pre- and post-treatment conditions.
4.4 Floc Accumulation
As discussed in Section 3.4, field monitoring was conducted by ERD under post-treatment conditions to evaluate the rate of floc accumulation in Booker Lake resulting from treatment of inflows from the northern and western channels. Underwater staff gauges were installed at 10 separate locations, as indicated on Figure 3-6, and measurements of relative sediment depth were made on approximately a monthly-bimonthly basis using an underwater video camera. A tabular summary of field measurements of underwater staff gauge readings in Booker Lake from November 2011-October 2012 is given on Table 4-7. The values summarized in this table reflect the relative sediment elevations at each of the 10 underwater staff gauge sites in Booker Lake. The initial values recorded on November 17, 2011 reflect the relative sediment elevation prior to addition of alum floc to the lake. The underwater staff gauge measurements are listed in units of inches and reflect the staff gauge reading at the top of the sediment surface at the beginning of the post-treatment monitoring program. The values summarized in Table 4-7 are not intended to represent any data or elevation.
TABLE 4-7
FIELD MEASUREMENTS OF UNDERWATER STAFF GAUGES IN BOOKER LAKE FROM NOVEMBER 2011 - OCTOBER 2012
Overall Mean Change: 0.2 1. Change in mean values between the initial two dates and final two dates of the monitoring period.
ST. PETERSBURG \ BOOKER LAKE ATS EVALUATION REPORT
4-40 A graphical summary of changes in measured sediment surface levels in Booker Lake from November 2011-October 2012 is given on Figure 4-20. Changes in monitored sediment depths are plotted for each of the 10 underwater staff gauge sites in terms of increases or decreases in sediment depth from the initial measurements conducted on November 17, 2011. The relative elevations of the sediment surface fluctuated at each of the 10 monitoring sites during the 12-month monitoring period within a range of ±0.5 inches. Organic muck sediments in eutrophic lakes are somewhat fluid in nature, and small fluctuations in sediment elevations are commonly observed in these lakes. Much of the variability in measurements indicated on Figure 4-20 is likely due to movement of the surficial fluid layer of sediments within the lake. However, no distinct trend of either increasing or decreasing sediment levels are apparent at any of the 10 individual monitoring sites.
Figure 4-20. Change in Measured Sediment Levels in Booker Lake from November 2011- October 2012.
ST. PETERSBURG \ BOOKER LAKE ATS EVALUATION REPORT
4-41
Estimates of the relative change in sediment elevations in Booker Lake from the beginning to the end of the 12-month monitoring period are summarized in the final column of Table 4-17. These values reflect the change in relative sediment elevations between the initial two monitoring dates and the final two monitoring dates of the 12-month period. Increases in sediment elevations, ranging from 0.3-0.6 inches, were observed at Sites 1, 4, 5, 7, 8, 9, and 10. Decreases in relative sediment elevation, ranging from 0.4-0.5 inches, were recorded at Sites 2, 3, and 6. Based upon this analysis, the sediment elevation in Booker Lake increased by an average of 0.2 inches during the 12-month field monitoring program. The observed overall mean increase of approximately 0.2 inches is equivalent to approximately 0.44 cm which is about half of the mean sediment elevation increase of approximately 1 cm/year commonly observed in lakes receiving alum treatment of stormwater runoff.
4.5 Benthic Monitoring
As discussed in Section 3.3, benthic monitoring was conducted in Booker Lake under pre- and post-treatment conditions to evaluate potential impacts to benthic populations from operation of the Booker Lake ATS facility. Benthic monitoring was conducted during both winter and summer conditions to document changes in benthic populations on a seasonal basis. Pre-treatment benthic monitoring was conducted during July 2005 (summer season) and January 2006 (winter season), with post-treatment benthic monitoring conducted during January 2012 (winter season) and August 2012 (summer season), and individual reports were prepared for each of the four benthic monitoring events. Reports describing the results of the pre-treatment benthic monitoring events are provided in Appendix C.1, with the results of the post-treatment benthic monitoring events provided in Appendix C.2. During summer season pre-treatment conditions, a total of 3 separate benthic species were identified at the monitoring sites during July 2005 compared with 8 different species identified during the September 2012 post-treatment event. A slight increase in organism density was observed at Site 1 under post-treatment conditions, with a slight decrease in overall organism density observed at Site 2. No benthic organisms were observed at Site 3 during the pre-treatment summer monitoring event, but under post-treatment conditions the phantom midge Chaoborus punctipennis was present. Increases in mean Shannon Diversity Index were observed at each of the 3 monitoring sites under post-treatment conditions compared with pre-treatment conditions. The data suggests that addition of alum floc to the sediments has made the environment more favorable for benthic organisms, resulting in an increase in the number of species at 2 of the 3 monitoring sites and an increase in Shannon Diversity Index at each of the 3 post-treatment monitoring sites under summer conditions. During the post-treatment winter monitoring event, substantial increases in the number of benthic species occurred at monitoring Sites 1 and 3 compared with pre-treatment conditions, with a reduction in benthic species observed at Site 2. Overall organism density increased at Site 1 from 1,911 organisms/m2 during pre-treatment conditions to 4,534 organisms/m2 under post-treatment conditions. A similar increase in the density of benthic organisms was observed at Site 3. The only site which exhibited a decrease in overall benthic density under post-treatment conditions was Site 2 which was reduced from 9,275 organisms/m2 during January 2006 to 3,363 organisms/m2 during January 2012.
ST. PETERSBURG \ BOOKER LAKE ATS EVALUATION REPORT
4-42
The benthic results discussed previously are virtually identical to the results of benthic monitoring conducted on previous alum treatment projects where the floc discharges to the receiving waterbody. Benthic communities appear to progress through a 3-year cycle, with an initial increase in the number of species present after approximately one year, although some sites may exhibit a slight reduction in overall organism density caused by the reduction in available nutrients resulting from bonding between phosphorus and the alum floc in the sediments. During year 2 following introduction of an alum treatment system, increases in both the number of species and organism densities continue to occur. During year 3, the benthic population appears to reflect a revised community structure with more clean water organisms and carnivores present compared with polluted water organisms and detritivores which are mostly present under pre-treatment conditions.
4.6 Estimated Mass Load Reductions A summary of estimated annual mass load reductions for the Booker Lake ATS facility is given on Table 4-8. Estimates of annual mass loadings to the lake under pre-treatment conditions are calculated based upon the information summarized on Table 2-2. Removal efficiencies by the alum treatment system are based upon the percent change in water quality characteristics in Booker Lake under pre- and post-treatment conditions, as summarized in Table 4-3.
TABLE 4-8
ESTIMATED ANNUAL MASS LOAD REDUCTIONS FOR THE BOOKER LAKE ATS FACILITY
INFLOW RUNOFF VOLUME (ac-ft/yr)
ANNUAL MASS LOADING
(kg/yr)
REMOVAL BY ATS (%)
ANNUAL MASS LOAD REDUCTION
(kg/yr) Total
N Total
P TSS
Total N
Total P
TSS Total
N Total
P TSS
Northern Channel
272 580 130 18,396 51 47 10 296 61 1,840
Western Channel
378 464 101 8,240 51 47 10 237 47 824
TOTAL: 650 1,044 231 26,636 532 109 2,664
Projected Annual Mass Load Reduction: 261 208 23,973
Fraction of Projected Reduction Achieved: 2.04 0.52 0.11
ST. PETERSBURG \ BOOKER LAKE ATS EVALUATION REPORT
4-43
Annual mass load reductions for the Booker Lake ATS facility are approximately 532 kg/yr for total nitrogen, 109 kg/yr for total phosphorus, and 2,644 kg/yr for TSS. The observed annual load reductions for total phosphorus and TSS are substantially lower than the anticipated load reductions summarized on Table 2-3. The difference between the observed and predicted load reductions is likely related to the sporadic operational status of the facility during the field monitoring program. It is interesting to note that the ATS facility achieved twice the anticipated load reduction for total nitrogen, even though the system was operated on a sporadic basis. The observed load reduction for total phosphorus is approximately 52% of the anticipated load reduction, while the load reduction for TSS is only 11% of the anticipated mass reduction.
ST. PETERSBURG \ BOOKER LAKE ATS EVALUATION REPORT
SECTION 5
SUMMARY
An alum stormwater treatment system was constructed for Booker Lake to provide alum treatment of significant inflows from stormwater and baseflow entering the lake through two separate channels, identified as the western and northern channels. The sub-basin area discharging to Booker Lake through the two inflow channels is approximately 1,437 acres of high-density residential, commercial, and industrial land use activities. Based upon hydrologic modeling of the Booker Lake watershed conducted by ERD using a SWMM Model provided by the City, runoff inflows contribute approximately 600 ac-ft/yr to Booker Lake. This value does not include significant baseflows which also enter Booker Lake throughout much of the year. Construction of the ATS facility was completed during June 2011. The overall total cost of the project was approximately $1,256,000, with approximately 40% contributed by the City and 60% contributed by FDEP through a 319(h) Grant. Pre- and post-treatment field monitoring for water quality, sediments, floc accumulation rates, and benthic communities were conducted to evaluate the performance efficiency of the Booker Lake ATS facility. Pre-treatment monitoring was conducted from July 2005-June 2006, with post-treatment monitoring conducted from November 2011-October 2012. During the field monitoring program, the ATS facility appeared to operate sporadically, with normal system operation occurring approximately 63% of the time within the west channel and 7% of the time in the north channel based upon a period of 179 days during which detailed operational data are available. In general, post-treatment vertical field profiles in Booker Lake were characterized by a more uniform water column pH, with isograde pH conditions extending to deeper water depths than observed under pre-treatment conditions. Isograde conductivity profiles were observed during each of the 12 post-treatment monitoring events. Dissolved oxygen concentrations under post-treatment conditions were generally higher in value, particularly near the water-sediment interface, with no apparent anoxic conditions observed under post-treatment conditions. Although the system operation may have been sporadic, reductions in concentrations for virtually all measured parameters were observed under post-treatment conditions compared with pre-treatment conditions. Measured nitrogen species were reduced from 34-68%, with an overall total nitrogen reduction of approximately 51% in Booker Lake. Measured reductions for phosphorus species ranged from 15-72% with an overall concentration decrease of approximately 47% under post-development conditions. Measured concentrations of color were reduced by approximately 10%, with a 26% reduction in chlorophyll-a and a 53% reduction in fecal coliform bacteria. The ATS facility generated substantial improvements in water quality in Booker Lake even though the operation of the system was somewhat sporadic.
5-1
ST. PETERSBURG \ BOOKER LAKE ATS EVALUATION REPORT
5-2
Mean values for measured sediment characteristics in Booker Lake were virtually
identical under pre- and post-treatment conditions. Operation of the alum treatment system does
not appear to have resulted in measurable change in sediment pH at any of the 3 monitoring sites.
Slight increases were observed in measured moisture contents at 2 of the 3 sediment sites which
may be explained by the additional moisture content of alum floc compared with lake sediments.
Virtually no changes were observed in measured organic content or in sediment concentrations
of total nitrogen or total phosphorus. In general, operation of the ATS for Booker Lake did not
result in any significant changes to sediment characteristics throughout the lake.
Estimates of floc accumulation rates in Booker Lake were conducted by ERD using a
series of 10 separate underwater staff gauges which were used to generate estimates of relative
sediment depth. Field monitoring of the underwater staff gauges was conducted on
approximately a monthly or bi-monthly basis using an underwater video camera to avoid
sediment disturbances. Seven of the 10 monitoring sites exhibited increases in sediment depth,
ranging from 0.3-0.6 inches, while 3 of the 10 monitoring sites exhibited decreases, ranging from
0.4-0.5 inches. Overall, sediment depth in Booker Lake increased by approximately 0.2 inches
(0.44 cm) during the 12-month field monitoring program.
As discussed previously, benthic monitoring was conducted in Booker Lake under pre-
and post-treatment conditions, with separate samples collected during summer and winter
conditions for both pre- and post-treatment programs. In general, the results of the pre- and post-
treatment monitoring events are similar to the results of benthic monitoring conducted on
previous alum stormwater treatment systems. Increases in the number of benthic species
occurred under both winter and summer conditions under post-treatment conditions compared
with pre-treatment conditions. However, increases in organism densities were observed at some
sites, while decreases in organism densities were observed at other sites. Benthic communities
generally go through a 3-year cycle after introduction of alum floc into the sediments, with
steady increases in the number of species and organism densities over time. Increases in
Shannon Diversity Indices were also observed under post-treatment conditions at each of the 3
post-treatment monitoring sites.
Based upon the observed changes in water quality within Booker Lake, the ATS facility
achieved load reductions of 261 kg/yr for total nitrogen, 109 kg/yr for total phosphorus, and
2,664 kg/yr for TSS. Mass load reductions would likely be greater if the system were operated
on a more reliable schedule.
ST. PETERSBURG \ BOOKER LAKE ATS EVALUATION REPORT
APPENDICES
ST. PETERSBURG \ BOOKER LAKE ATS EVALUATION REPORT
APPENDIX A
BOOKER LAKE STORMWATER, BASEFLOW, AND JAR TEST DATA