Page 1
International Journal of Emerging Technology and Advanced Engineering
Website: www.ijetae.com (ISSN 2250-2459, ISO 9001:2008 Certified Journal, Volume 4, Issue 4, April 2014)
328
Performance Evaluation and Optimization of CDMA 2000 1X
Mobile Cellular Radio Network Idigo V.E.
1, Ohaneme C.O.
2, Oguejiofor O.S.
3, Ezeagwu C.O.
4
1,2,3,4 Department of Electronic and Computer Engineering, Nnamdi Azikiwe University Awka, Nigeria
Abstract-- Evaluation and optimization exercise after
service rollout is to correct the expected errors in network
planning and to achieve benefits such as improved network
capacity, enhanced coverage and quality of service. The key
performance indicators viz; call drop ratio, call setup success
ratio, call failure rate, call connection rate that have direct
impact on the subscribers on the network were collated and
analyzed using the industrial best practice values as
benchmark for the exercise. Visafone, an independent mobile
network operator with CDMA access technology at
Maiduguri, North-East Nigeria is used as case study. To
eliminate any existing faults in transmission and installation,
drive tests were carried out and analysis of the traffic
statistics made. Network optimization is then implemented.
The results show that after optimization process, the key
performance indicators were greatly improved.
Keywords-- Call drop, Evaluation, Optimization, Success
ratio, Network coverage.
I. INTRODUCTION
Cellular network operators must periodically evaluate
and optimize their networks to accommodate traffic
growth and performance degradation. Network
performance evaluation and optimization action after
service rollout is to correct the expected errors in
network planning and the benefits like improved
network capacity, enhanced coverage and quality of
service.[1]
Wireless network optimization is the major challenge to
every wireless communication system. The classical
cellular architecture provides only rough guidelines,
propagation modeling and statistics, and network
simulations fall short of representing and optimizing the
actual network performance[2]. Cost effective wireless
network optimization governs the radio coverage at the
base stations and additional RF access points as
required by the environmental and traffic demands.
Optimal performance is achieved by combining
prediction models with dynamic measurements and
applying coverage and diversity means accordingly.
Some research efforts in the past had tried to show
that the optimization of the antennae parameters would
be able to yield some capacity improvements,
however poor handling of this operation or insufficient
tilt will result in high level of inter-cell interference
thereby reducing the capacity of the network, and
ultimately the network operators could end up paying
for unnecessary network infrastructure[3].
Some previous works are reported on the combined
effects of radio interface parameter and network
performance indicator at real data [1, 7]. Some work
investigates individual as well as combined effects of
antenna height, high gain antennas and antenna down
tilting for microcellular applications [1]. Using simulations,
the authors show in [2] that the smaller the cell sizes the
larger the antenna down tilt should be, and the higher the
traffic load the higher the antenna down-tilt should be to
improve performance. While the inter-cell interference is
indeed reduced through such down tilt, the sectorization
efficiency may also be reduced with increased down tilt
[3]. Another study finds that optimization of pilot powers
in a CDMA-1X system does not increase the performance
of the system significantly and substantial reduction in
capacity can be associated with pilot power optimization.
However the optimization of the antenna parameters is able
to yield substantial capacity improvements [4]. Recently,
[5] discussed antenna down tilt concepts and performance
in an actual operating cellular system, relationship between
antenna height, down tilt angle, and coverage radius. In
modern urban propagation environments, the cell coverage
area is less than 2 km, it concluded.
The tradeoff between the coverage and number of users
with fixed transmit power is as presented in [6].
More recent work, has examined the impact of
interference, such as, the problem of where to locate base
stations so as to maximize user capacity in a cellular
CDMA network is studied in [7,8].
The impact of intra-cell and average inter-cell
interference using power-control constraints is captured.
Page 2
International Journal of Emerging Technology and Advanced Engineering
Website: www.ijetae.com (ISSN 2250-2459, ISO 9001:2008 Certified Journal, Volume 4, Issue 4, April 2014)
329
All these efforts had not actually resulted into the
desired capacity and coverage enhancements due to these
obvious limitations.
RF coverage on the forward link is much larger than
that in the reverse link because excessive BTS power
is allocated to the remote user.
Excessive soft handoff area caused by improper cell
site layout and misuse of base station antennas.
Improper RF parameter settings, as this needs to be
fine tuned according to the traffic loading distribution.
However this research effort attempts to bridge these
limitations through the following contributions.
Link imbalance can be identified by drive testing into
problematic areas or analyzing the network
performance data for problematic clusters/sectors.
Unnecessary soft handoff could be reduced.
Maiduguri network of Visafone communications
limited, a privately owned and nationally licensed
telecommunications operator that started commercial
operations in Nigeria in February 2008 using the
CDMA technology platform is the network under
study. Maiduguri, which is the capital city of Borno
state, situated in the North East geopolitical zone of
the country, with a beautiful flat terrain, is one of the
latest cities Visafone has rolled out services with
sixteen Base station transceiver station (BTS) sites. The
BTS sites are connected to the Kano Base station
controller (BSC) via 16E1 leased fibre link. The scope
of this research work includes checking, uploading and
analysis of transmission alarms, Received Signal
Strength Indicator (RSSI), Frame Error Rate (FER), and
other traffic statistics data from the M2000 and the
LMT from all the operational BTS in Maiduguri. For
acquisition of initial knowledge of network quality,
and to eliminate any existing faults in transmission
and installation. Drive tests were carried out and
analysis of the traffic statistics made, and the network
optimization was then implemented at a higher level
using the various techniques.
II. EVALUATION AND OPTIMIZATION APPROACHES
Optimization process begins with monitoring, collection
of data, and the performance of maintenance functions on
the BTS at the far-end, using the Local Maintenance
Terminal (LMT) which is connected to the BSC BAM,
known as a client and Back LMT Administrator Module
(BAM) known as a server.
The BTS Audit is also required to see the real condition
and quality of the whole of the device - the device BTS by
reference the actual parameter values, because sometimes
the values obtained from monitoring (far-end) is far
different from the direct measurements performed on the
field. The drive test data collection requires post-
processing of data analysis, and finally the tuning of the
network is needed to solve problems of RF coverage. Drive
test is performed again to validate the earlier actions taken.
A. Drive Test Exercise
During the drive test, the following tools were used;
Agilent E6474A, drive test equipment such as a laptop unit
that has installed software for the Agilent CDMA, GPS,
two fruit headset (for the long call and short call), power
supply, Agilent hardware devices, and street map site.
Drive test procedure itself was divided into three levels
namely:
Single-cell function tests: Done to test individual base
stations.
Cluster Optimization: Done for testing multiple base
stations in a single cluster and the performance of good
relationship between the BTS.
System Optimization: Done to test a wider network
performance, e.g. in some clusters.
Drive Test are done on several conditions [9]:
Initial test drives conducted when an installed base
station have been completed to determine the initial
data of a BTS and also to demonstrate the feasibility
of a network level.
Maintenance drive test conducted in order to monitor
the performance of the BTS in accordance with the
schedule.
Executed for these necessary reasons, i.e. if there
were complaints from customers or impairment of
performance of base stations as can be seen from the
daily reports.
In some places drive test data uses Actix analyzer
software. Actix analyzer software is useful for processing
drive test data, visualize data, analyze the data and can
identify network problems for subsequent resolution.
Page 3
International Journal of Emerging Technology and Advanced Engineering
Website: www.ijetae.com (ISSN 2250-2459, ISO 9001:2008 Certified Journal, Volume 4, Issue 4, April 2014)
330
III. RESEARCH METHODOLOGY
A. Research Concept
This research work is categorized as a network
planning, optimization and evaluation effort whose
focus is to evaluate the performance of a mobile
cellular radio network in terms of coverage, capacity
and quality, before and after the optimization exercise.
This would have been preceded by the network
planning stage where the various models are analyzed.
The key radio parameters that determine network
performance, namely Tx level (transmit power), Rx level
(receive power), Ec/Io of the primary pilot, FFER
values, and RSSI values are collated and evaluated
The Ec/Io of the primary pilot and the Rx level are
used to define the forward coverage range of the
system. The transmit power of the MS is used to
measure the reverse coverage range. The mean FFER
of the forward link is used to determine the quality of
the traffic channel. The key performance indicators
namely, call drop ratio, call setup success ratio, call
failure rate, call connection rate, that have direct
impact on the subscribers on the network were
collated and evaluated using the industrial best practice
values as benchmark for the exercise [8].
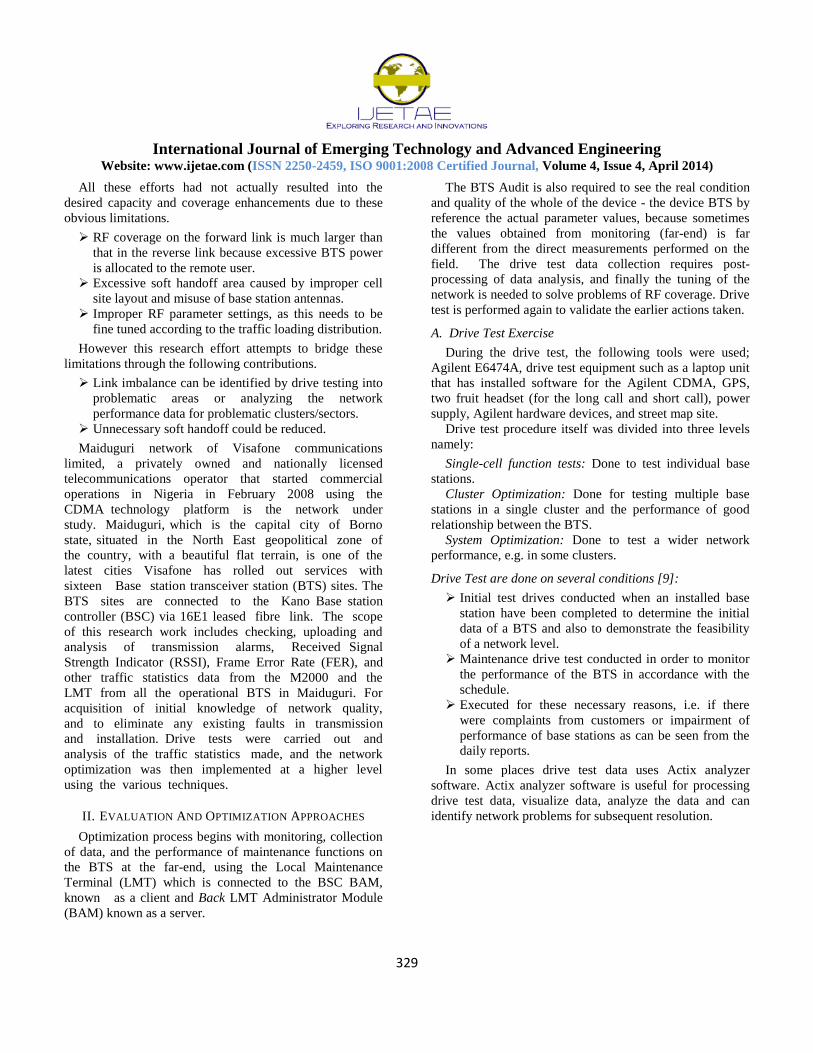
B. Experimental Test Bed
Following the need for the coverage of Maiduguri city in
Nigeria, 16 BTS sites were built by Visafone, with the
intention of creating a good CDMA Tx network in the city.
The BTS configurations are S1/1/1; with frequency point of
419 in the 800MHz band. The 16BTS sites are connected to
the Kano BSC, which is one of the nine BSC locations of
Visafone, via a 16E1 capacity fibre link. The list of the on-
air sites, their co-ordinates and configurations are listed in
Table 1.
Table 1
List of On-Air Sites
Source: Visafone Nigeria
Table 2:
Antenna Adjustment Proposal
Page 4
International Journal of Emerging Technology and Advanced Engineering
Website: www.ijetae.com (ISSN 2250-2459, ISO 9001:2008 Certified Journal, Volume 4, Issue 4, April 2014)
331
C. Sampling Technique
Recently, new sites were installed in Maiduguri. After
installation, it was decided that Drive Test (DT) should be
carried out to determine the performance of the sites and to
proffer solution should any coverage problem be
discovered in the network.
The Drive Test was carried out as decided, but certain
areas of the network proved to have poor network
coverage. Hence, optimization was suggested to improve
the network, with antenna adjustment plan as shown in the
Table 2
Note: Black stands for values BEFORE OPTIMIZATION
Red stands for values AFTER OPTIMIZATION.
D. Research Method and Test Route
Install a set of drive test equipment with GPS and
Qualcomm 1X test mobile station into the test car. Besides,
a compatible computer installed with collection software
(Pilot Panorama). Set the two Mobile stations to the status
of Markov long call and short call respectively at full rate.
MS is used to test Transmit Level (Tx Level), Receive level
(Rx Level) and Down link Pilot (Ec/Io) of the primary
pilot. The Ec/Io of the primary pilot and Rx level are used
to define the forward coverage range of the system.
The transmit power of the MS is used to measure the
reverse coverage range.
The mean FFER of forward link which is used to
determine the quality of the traffic channel was determined.
IV. RESULTS AND DATA ANALYSIS
The data were collated through the drive test, before and
after the network optimization exercise .These were
processed with the drive test tool, Dingli Panorama and the
output was produced in the form of distribution charts and
maps and subsequently analyzed to lay credence to the set
objectives of the study. This result was compared with the
simulation output produced by the simulation software,
Tems cell Planner. These outputs of the examined network
optimization metrics include, Ec/Io, Rx level, Tx level,
FFER, Call drop, PN Plot, Short call statistics.
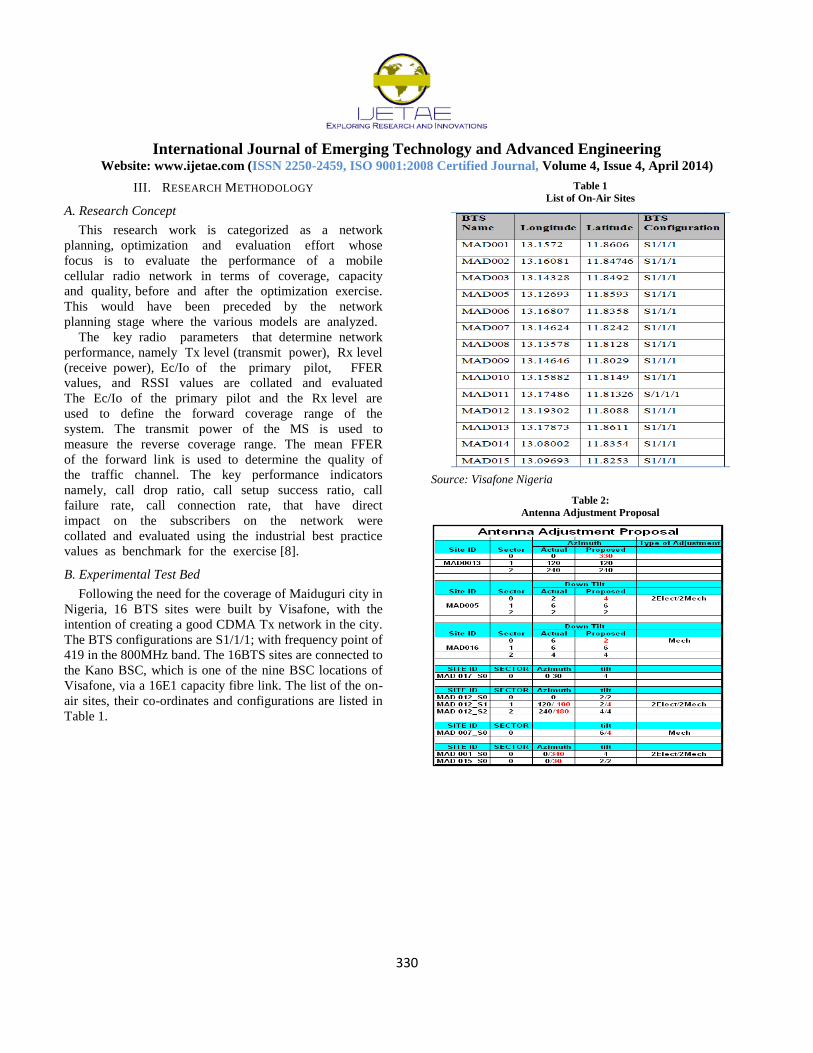
A. Ec/Io Coverage
Areas around MAD016 and MAD 002 had poor
coverage due to GPS antenna tracking problem of
MAD0016 and MAD002 coupled with some sites with
RSSI problems. However, after optimization, all these
snags were cleared and the city has excellent Ec/Io
coverage. As shown by statistics in Figure 1, Total Ec/Io
greater than -9dB was 91.51%, before optimization.
However, after optimization, as shown in Figure 2, the
value came to 95.08%, which is a remarkable improvement
over the previous value for the network.
Figure 1: Maiduguri Visafone Network Distribution map
Page 5
International Journal of Emerging Technology and Advanced Engineering
Website: www.ijetae.com (ISSN 2250-2459, ISO 9001:2008 Certified Journal, Volume 4, Issue 4, April 2014)
332
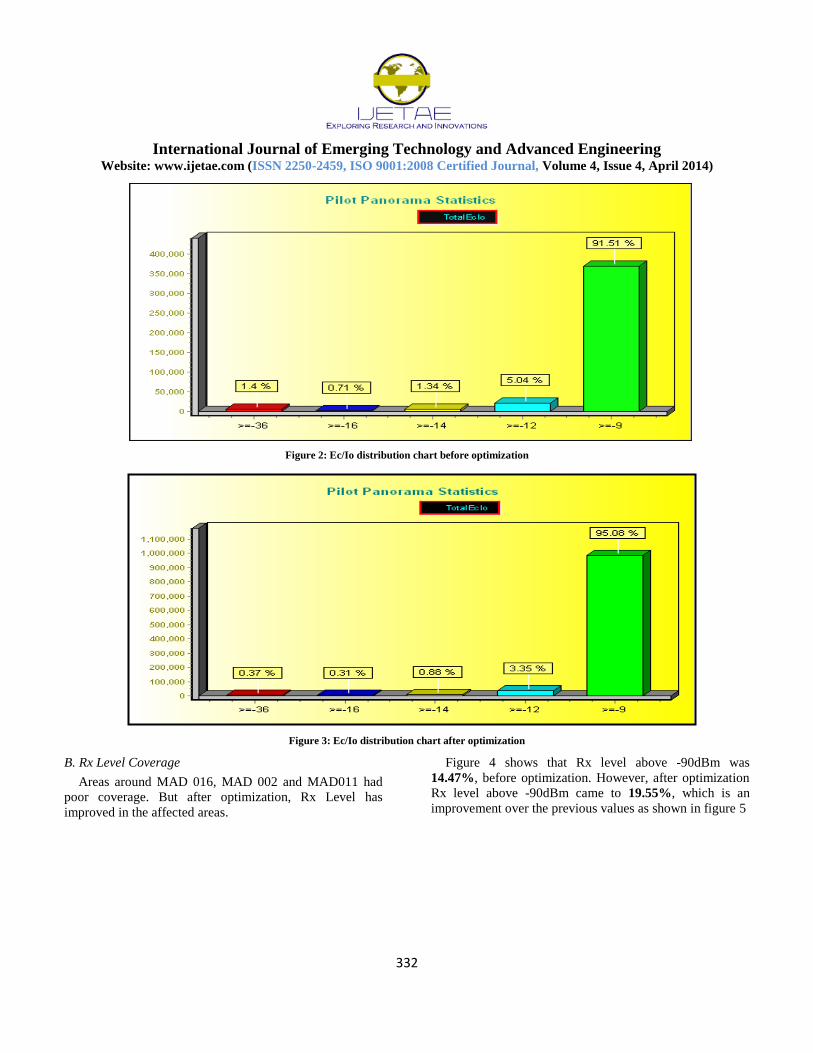
Figure 2: Ec/Io distribution chart before optimization
Figure 3: Ec/Io distribution chart after optimization
B. Rx Level Coverage
Areas around MAD 016, MAD 002 and MAD011 had
poor coverage. But after optimization, Rx Level has
improved in the affected areas.
Figure 4 shows that Rx level above -90dBm was
14.47%, before optimization. However, after optimization
Rx level above -90dBm came to 19.55%, which is an
improvement over the previous values as shown in figure 5
Page 6
International Journal of Emerging Technology and Advanced Engineering
Website: www.ijetae.com (ISSN 2250-2459, ISO 9001:2008 Certified Journal, Volume 4, Issue 4, April 2014)
333
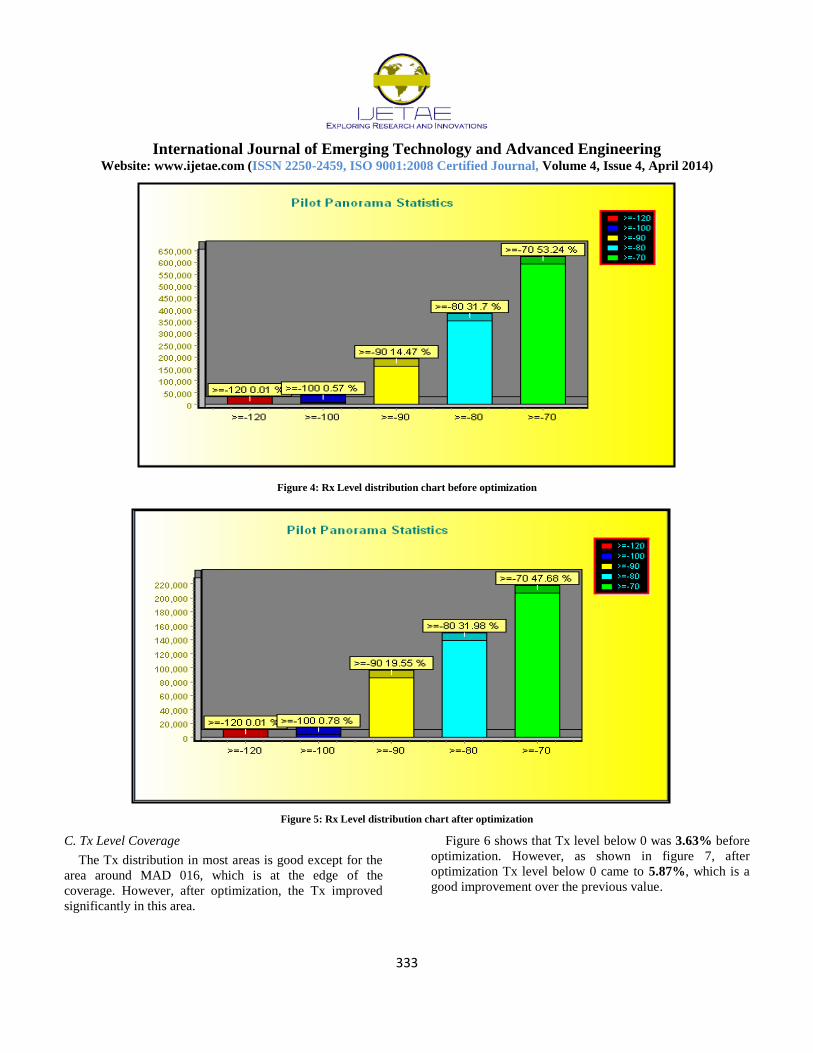
Figure 4: Rx Level distribution chart before optimization
Figure 5: Rx Level distribution chart after optimization
C. Tx Level Coverage
The Tx distribution in most areas is good except for the
area around MAD 016, which is at the edge of the
coverage. However, after optimization, the Tx improved
significantly in this area.
Figure 6 shows that Tx level below 0 was 3.63% before
optimization. However, as shown in figure 7, after
optimization Tx level below 0 came to 5.87%, which is a
good improvement over the previous value.
Page 7
International Journal of Emerging Technology and Advanced Engineering
Website: www.ijetae.com (ISSN 2250-2459, ISO 9001:2008 Certified Journal, Volume 4, Issue 4, April 2014)
334
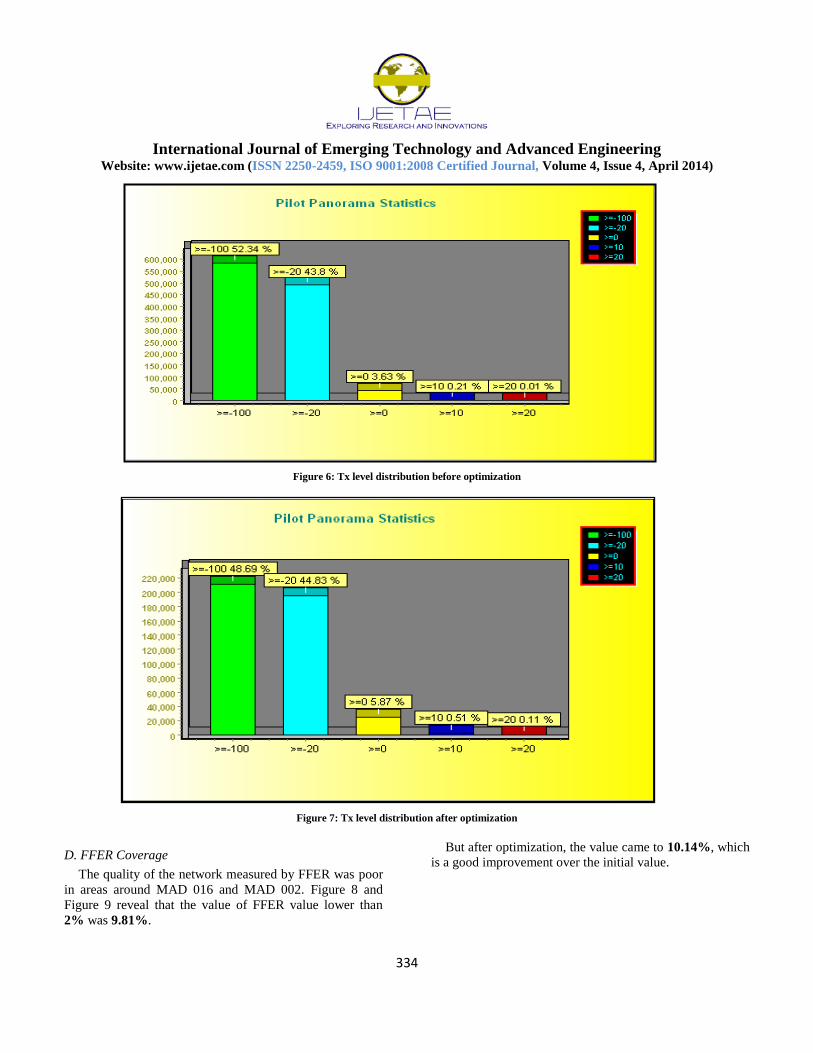
Figure 6: Tx level distribution before optimization
Figure 7: Tx level distribution after optimization
D. FFER Coverage
The quality of the network measured by FFER was poor
in areas around MAD 016 and MAD 002. Figure 8 and
Figure 9 reveal that the value of FFER value lower than
2% was 9.81%.
But after optimization, the value came to 10.14%, which
is a good improvement over the initial value.
Page 8
International Journal of Emerging Technology and Advanced Engineering
Website: www.ijetae.com (ISSN 2250-2459, ISO 9001:2008 Certified Journal, Volume 4, Issue 4, April 2014)
335
Figure 8: FFER distribution histogram after optimization
Figure 9: FFER distribution histogram before optimization
E. Call Drop Analysis Long Call
Before optimization, call drops featured at the center of
the city, as well as at areas toward the edges of the network
due to GPS tracking problem on some sites.
However, no call drops featured in these areas and the
rest of the network after optimization.
Page 9
International Journal of Emerging Technology and Advanced Engineering
Website: www.ijetae.com (ISSN 2250-2459, ISO 9001:2008 Certified Journal, Volume 4, Issue 4, April 2014)
336
Short Call Statistics
In Table 3 and Table 4 there is an improvement after the
optimization in the Call Setup success ratio and call drops.
Table 3:
Short call statistics before optimization
Table 4:
Short Call Statistics after optimization
V. ANALYSIS OF SIMULATION RESULT
A. Downlink Received Power
Figure 10 shows the total mean received RF power over
a carrier’s bandwidth, found by adding the received pilot
powers, common channel powers, traffic channel powers
and background noise at any pixel. The value at each pixel
is obtained by averaging the total received powers of the
terminals attempted at a pixel. In the plot, different colours
are applied to identify the different strength level of the
Mean Received Power. For example, the Green represents
the Received Power level between -80dBm and -70dBm.In
CDMA system, downlink coverage effect lies on both DL
Received Power and Pilot Ec/Io. For example, with the
increase of user, the strength of Received Power will be
stronger, while the strength of Pilot Ec/Io will decrease.
Only if both of them satisfy the coverage threshold, the
downlink coverage effect could be ensured well. The
outdoor coverage threshold of Received Power is -
105dBm; meanwhile in this simulation, there is 5dB-fading
margin to obligate for 75% edge coverage probability,
which means in the area where the Received Power is
greater than -100dBm the outdoor edge coverage of
downlink can be satisfied with a probability of 75%.
Moreover, here we set the penetration loss of buildings as
20dB, so the indoor coverage threshold of Received power
is -80dBm. As shown in the plot, the Received Power in the
areas except orange, yellow is greater than -80dBm, so the
downlink indoor coverage in these areas can be satisfied.
[10]
B. The Uplink (UL) Required MS Transmit Power
Figure 11 shows the mean uplink required Tx Power at
each pixel for the selected service. In the plot, different
colours are applied to identify the different strength level of
UL Mobile Transmit Power. For example, the green
represents the UL Transmit Power level between -22dBm
and -12dBm. The outdoor coverage threshold of the UL
Mobile Transmit Power is 23dBm; meanwhile in this
simulation there is 5dB-fading margin to obligate for 75%
edge coverage probability that means in the area where the
UL Mobile Transmit Power is less than 18dBm the uplink
outdoor edge coverage can be satisfied with a probability of
75%. Moreover, here we set the penetration loss of
buildings as 20dB, so the indoor coverage threshold of UL
Transmit Power is -2dBm. As shown in the plot, the UL
Transmit Power in the red, orange, yellow, green, blue area
is less than -2dBm, so the uplink indoor coverage in these
areas can be satisfied.
C. The Downlink (DL) Pilot Ec/Io
The Pilot Ec/Io figure 12 displays the achieved pilot
Ec/Io for each pixel and is in effect, the same as Ec/Io for
the first best server. In the plot, different colours are
applied to identify the different level of DL Pilot Ec/Io. For
example, the Green represents the Pilot Ec/Io level between
-9dB and -7dB.
In CDMA system, the T drop threshold is –13dB, which
is to say that when the Pilot Ec/Io level is below this
threshold, the DL coverage can’t be satisfied; and when the
DL Pilot Ec/Io level is below –11dB, the DL coverage
effect may be not good. As shown in the plot, the Pilot
Ec/Io in the pink, blue, green, yellow, orange area is greater
than –13dB, so the downlink outdoor coverage in these
areas can be satisfied; and the pilot coverage effect in the
pink, blue, green area, yellow is good.
Page 10
International Journal of Emerging Technology and Advanced Engineering
Website: www.ijetae.com (ISSN 2250-2459, ISO 9001:2008 Certified Journal, Volume 4, Issue 4, April 2014)
337
Figure 10: Downlink simulation
Fig 11: Uplink simulation
Page 11
International Journal of Emerging Technology and Advanced Engineering
Website: www.ijetae.com (ISSN 2250-2459, ISO 9001:2008 Certified Journal, Volume 4, Issue 4, April 2014)
338
Fig 12: DL Pilot E0/I0 Simulation
VI. CONCLUSION
The optimization process is a long term process that
requires the study of the network situation and the
provision of solutions to weak features sorted out first,
without a hasty implementation, for a successful outcome.
The antenna hardware changes (tilt and azimuth) are
important issue in the network optimization, as it is
observed that most times the advised changes are not
correct. The load on the system increases with time and
thus affecting the network performance, hence the need to
periodically monitor the carrier loads, and expand the
network if necessary. Interference affects network capacity
and the overall performance and quality of end user
experience (call setup, call drop rate, etc) and these are
considered key issues that need to be resolved. Network
planning must be based on standard value to predict the
demand services area and QoS. It is important to know the
network layout and QoS before implementing optimization
procedure. There are radio elements to use as check to
adjust the parameters to enhance the QoS. The threshold
values of the parameters must be used as performance
indicators to effect radio interface optimization. Knowing
the radio interface protocols of cdma2000 1x is essential
for radio interface optimization. The function of channels
in setup call and the messaging can provide one with the
reasons behind higher call setup failure and also high call
drop rate.
REFERENCES
[1] Edward B., and Abu S., 2004, “Effects of Antenna Height, Antenna Gain and Pattern Down tilting for Cellular Mobile Radio”,
Proceedings of IEEE Infocom.
[2] George C., and Matt D., 2006, “Antenna tilt control in CDMA Networks”, Motorola Inc.
[3] 3GPP2 C.S0010-B, 2002, “Recommended Minimum Performance Standards for CDMA 2000 Spread Spectrum Base Stations”, Vol.
4.0.
[4] 3GPP2 C.S0011-B, 2002, “Recommended Minimum Performance Standards for CDMA 2000 Spread Spectrum Mobile Stations”,
Vol.4.0.
[5] <www.tektronix.com/signaling_test, June 2003. “CDMA Network
Technologies: A Decade of Advances and Challenges”.
[6] Esmael D., and Aleksey K., January 2006. “The Impacts of Antenna Azimuth and Tilt Installation Accuracy on UMTS Network
Performance”, Bechtel Corporation.
[7] Myron D. Fanton, April 2006. “Antenna Pattern and Coverage
Optimization”, PE ERI Technical Series, Vol. 6
[8] Joseph Shapira, Nov. 2004. “Enhancement and Optimal Utilization of CDMA 2000 Networks”. CEWIT CDMA Workshop.
[9] Dingli Communications Inc, August 2004. “Pilot Panorama User Guide”.
[10] Robert AKL, 2006, “Subscriber Maximization in CDMA Cellular Networks”, Department of Computer Science and Engineering,
University of North Texas, CCCT04
Page 12
International Journal of Emerging Technology and Advanced Engineering
Website: www.ijetae.com (ISSN 2250-2459, ISO 9001:2008 Certified Journal, Volume 4, Issue 4, April 2014)
339
Authors’ Profile
Idigo Victor Eze is an Associate Professor and lecturer with the
Department of Electronic and Computer Engineering, Nnamdi
Azikiwe University Awka Nigeria. He holds Ph.D. in
Communication Engineering from Nnamdi Azikiwe University,
Awka, Nigeria. He has published many papers in both local and
international journal. He has also presented papers in both local
and international conferences. Idigo is currently the head of the
department of Electronic and Computer Engineering of the
institution, and a member in many professional bodies including
IEEE and COREN as in Nigeria. His research interest is on
Wireless and Mobile Communication Systems.
Ohaneme Cletus Ogbonna holds B.Eng. and M.Eng. in
Electrical/Electronic Engineering Communication Engineering
option, and PhD in Communication Engineering, all from Enugu
State University of Science and Technology (ESUT) Enugu,
Nigeria. He is currently a lecturer with the Department of
Electronic and Computer Engineering, Nnamdi Azikiwe
University, Awka Nigeria. Also, he is a member of several
professional bodies, some of which include: Nigeria Society of
Engineers (NSE), Nigeria Institution of Electrical Electronic
Engineers (NIEEE), International Association of Engineers
(IAENG) and a registered engineer with Council for the
Regulation of Engineers in Nigeria (COREN). His research
interest is on Wireless Communication and Spectrum
Management.
Oguejiofor Obinna Samuel is currently a lecturer with the
Department of Electronic and Computer Engineering, Nnamdi
Azikiwe University Awka Nigeria. He holds B.Eng. and M.Eng.
in Electronic and Computer Engineering (Communication
Engineering Option) from Nnamdi Azikiwe University Awka,
Nigeria and presently pursuing his Ph.D. Degree in
Communication Engineering from the same department and
institution. His research interest is on Wireless Communication
and Wireless Sensor Network.
Christopher Ogwugwuam Ezeagwu was born in Ezi, Aniocha
Local Government Area of Delta State Nigeria. He holds B.Eng.
in Electrical/Electronic Engineering and M.Eng. in Electronic and
Communication Engineering both from Enugu State University of
Science and Technology (ESUT) Enugu, Nigeria in 1986, and
2008 respectively. Currently, he is a PhD student in the
department of Electrical/Electronic Engineering, Enugu State
University of Science and Technology (ESUT) Enugu, Nigeria.
Christopher is presently a lecturer in the Department of Electronic
and Computer Engineering Nnamdi Azikiwe University, Awka
Nigeria. Besides, he is a member of several professional bodies
including, Nigeria Society of Engineers (NSE) , Member
Institution of Electrical and Electronic Engineers (IEEE), Fellow
Institute of Chartered Administration (ICA) of Nigeria and
Council for the Regulation of Engineering in Nigeria (COREN).
E-mail: [email protected]