PERFORMANCE EVALUATION AND WAKE STUDY OF A MICRO WIND TURBINE Graeme I. Comyn, David S. Nobes, Brian A. Fleck Department of Mechanical Engineering, University of Alberta, Edmonton, AB, Canada E-mail: [email protected]; [email protected]Received July 2010, Accepted January 2011 No. 10-CSME-51, E.I.C. Accession 3214 ABSTRACT In preparation for a study on icing of wind turbine blades, we tested a horizontal axis micro wind turbine in a low speed wind tunnel. The ratio of wind turbine rotor area to wind tunnel cross-sectional area resulted in highly blocked experimental configuration. The turbine was instrumented to measure rotational speed of the rotor, axial thrust and power output. Performance characteristics were calculated and compared with the manufacturer’s published data. In addition, the near wake of the turbine was measured with a Kiel probe. One dimensional axial momentum theory, including a modification that includes channel walls, was applied to determine power extracted from the wind by the rotor. The results were compared to actual power output and show that though the assumptions of the model over-predict power by 50 % the basic trend is followed. Keywords: small wind turbine; wind power; wind tunnel; axial momentum theory. E ´ VALUATION DE LA PERFORMANCE ET L’E ´ TUDE DU SILLAGE D’UNE MICRO-E ´ OLIENNE RE ´ SUME ´ En pre ´paration pour une e ´tude sur le givrage des pales d’e ´oliennes, nous avons examine ´ une micro-e ´olienne a ` axe horizontal dans une soufflerie a ` basse vitesse. Le rapport de l’aire du rotor de l’e ´olienne a ` l’aire transversale de la soufflerie re ´sulte en une configuration expe ´rimentale tre `s bloque ´e. L’e ´olienne e ´tait instrumente ´e pour mesurer la vitesse rotationnelle du rotor, la pousse ´e axiale et la puissance de sortie. Les caracte ´ristiques de performance ont e ´te ´ calcule ´es et compare ´es avec les spe ´cifications du fabricant. En outre, le sillage proche de l’e ´olienne a e ´te ´ mesure ´ avec une sonde Kiel. La the ´orie de dynamique axiale en une dimension, incluant une modification qui inclue les parois du canal, a e ´te ´ applique ´e pour de ´terminer la puissance extraite du vent par le rotor. Les re ´sultats ont e ´te ´ compare ´s a ` la puissance re ´elle et montrent que, malgre ´ les hypothe `ses du model qui surestiment le pouvoir de 50 %, la tendance de base est suivie. Mots-cle ´s : petite e ´olienne; e ´nergie e ´olienne; soufflerie; the ´orie de dynamique axiale. Transactions of the Canadian Society for Mechanical Engineering, Vol. 35, No. 1, 2011 101
Transcript
PERFORMANCE EVALUATION AND WAKE STUDY OF A MICRO WINDTURBINE
Graeme I. Comyn, David S. Nobes, Brian A. FleckDepartment of Mechanical Engineering, University of Alberta, Edmonton, AB, Canada
In preparation for a study on icing of wind turbine blades, we tested a horizontal axis microwind turbine in a low speed wind tunnel. The ratio of wind turbine rotor area to wind tunnelcross-sectional area resulted in highly blocked experimental configuration. The turbine wasinstrumented to measure rotational speed of the rotor, axial thrust and power output.Performance characteristics were calculated and compared with the manufacturer’s publisheddata. In addition, the near wake of the turbine was measured with a Kiel probe. Onedimensional axial momentum theory, including a modification that includes channel walls, wasapplied to determine power extracted from the wind by the rotor. The results were compared toactual power output and show that though the assumptions of the model over-predict power by50 % the basic trend is followed.
EVALUATION DE LA PERFORMANCE ET L’ETUDE DU SILLAGE D’UNEMICRO-EOLIENNE
RESUME
En preparation pour une etude sur le givrage des pales d’eoliennes, nous avons examine unemicro-eolienne a axe horizontal dans une soufflerie a basse vitesse. Le rapport de l’aire du rotorde l’eolienne a l’aire transversale de la soufflerie resulte en une configuration experimentale tresbloquee. L’eolienne etait instrumentee pour mesurer la vitesse rotationnelle du rotor, la pousseeaxiale et la puissance de sortie. Les caracteristiques de performance ont ete calculees etcomparees avec les specifications du fabricant. En outre, le sillage proche de l’eolienne a etemesure avec une sonde Kiel. La theorie de dynamique axiale en une dimension, incluant unemodification qui inclue les parois du canal, a ete appliquee pour determiner la puissance extraitedu vent par le rotor. Les resultats ont ete compares a la puissance reelle et montrent que, malgreles hypotheses du model qui surestiment le pouvoir de 50 %, la tendance de base est suivie.
Mots-cles : petite eolienne; energie eolienne; soufflerie; theorie de dynamique axiale.
Transactions of the Canadian Society for Mechanical Engineering, Vol. 35, No. 1, 2011 101
1. INTRODUCTION
Small wind turbines are generally considered to be machines that generate less than 100 kWof power and micro (or mini) wind turbines are the subset that generate less than 30 kW [1].They can be connected to the grid to offset electrical load for rural homes, farms or businesses.They can be connected to battery banks or hybridized with solar or diesel generators for placeswithout access to the grid or where getting access would be extremely expensive, such as in theArctic or onboard a sailboat. Canada, with its large rural areas and remote northerncommunities, has the opportunity to expand the number of small wind turbine installations andsignificantly reduce fossil-fuel based electrical consumption [2].
There has been growing public interest in small wind turbines in Canada since the late 1990s[3]. There are three main reasons for this: environmental, economic, and security [4]. Not onlyare people becoming more environmentally conscious but new, stricter regulations are beingimposed on the transport and storage of diesel fuel and on the CO2 emissions from coal-firedgenerating plants. This and rising costs of fossil fuels are forcing people to seek ways to reducetheir consumption.
Remote rural communities must also consider the security of their power generation. Ifconnection to the grid is lost, or the supply of fuel runs out, power might not be restored for asignificant amount of time. During the winter in Canada, a power outage could have disastrousresults. People are seeking ways to reduce their impact on the environment, save money and todiversify their sources of power and small wind turbines can fill this role.
Small wind turbine installations, however, are not simple systems and there is much to learn.There is a large array of choices and considerations to be made including the type of turbine,tower options, electrical components, placement, and noise considerations. In Canada, the coldclimate is an additional challenge that is not yet well understood. With the prevalence of dieselgenerators, there are very few wind turbine installations providing operational feedback [4].
NOMENCLATURE
a axial induction factorA area of rotor disk (m2)BEM blade element momentumCP 5 power coefficientP / (0.5rAU0
3)CT 5 thrust coefficientT / (0.5rAU0
2)CQ 5 torque coefficientCP / TSRDAQ data acquisitionP power (W)R rotor radius (m)RPM revolutions per minuteSTP standard temperature and
e ratio of the area of the rotor tothe area of the channel
r air density (kg/m3)t 5 bypass wind speed ratioUB / U0
V rotational speed of rotor
Transactions of the Canadian Society for Mechanical Engineering, Vol. 35, No. 1, 2011 102
Material selection, construction, lubrication and increased loading due to air density, ice andsnow are all serious factors that need investigation.
Though independent testing of small wind turbines has improved the quality ofmanufacturer’s published data [5–7] the technical specifications and ratings can be confusingto the general public. Optimum practice of wind power systems is still being developed byprofessionals in the field. A recent study illustrates that most small wind turbine installationsproduce much less power than predicted [8]. This highlights the need for a better understandingof small wind power systems and their interactions with their electrical components, thesurrounding terrain, and environmental conditions to improve reliability and efficiency.
The fundamental expression of a wind turbine’s power output uses axial momentum theoryacross an ideal rotor. This theory ignores wake rotation and heat transfer. The ideal rotor hasno drag and an infinite number of blades. The application of this theory led to the Lanchester-Betz limit that demonstrated how the maximum power an ideal rotor can extract from the windis approximately 59 % of the total energy in the wind [9]. Glauert included the rotationalvelocity in the wake and showed that the maximum power extracted by the rotor is reduced astip speed ratio (TSR) decreases. This is because at low rotational speeds of the rotor thetangential component of velocity in the wake is greater [9].
There have been many attempts to improve upon the theory. The effect of swirl in the wakeon the power coefficient is predicted to be small for TSR above 5 in [10], but the analysisdepends on defining the hub vortex, which has not been experimentally measured to date. Arotor with a finite number of blades is considered in [11] and it is shown that the smaller thenumber of blades the less power can be extracted from the wind. Including the presence of achannel around the ideal rotor is performed in [12] for use with tidal turbines, however, it canalso apply to wind turbines being tested inside wind tunnels. An expression is developed for theadditional power available to the rotor based on the ratio of the area of the rotor to the cross-sectional area of the channel.
Wind turbine wakes have been measured since the early days of wind turbine research. Theprimary goal was to examine the effect of a wind turbine’s wake on other wind turbines installedin a wind farm. A comprehensive review and discussion of these measurements is available in[13]. A numerical analysis to model a wake with momentum sinks is compared to fieldmeasurements in [14]. Three dimensional velocity components in the wake are measured withhot-wire anemometry in [15].
2. EXPERIMENT DESCRIPTION
The Department of Mechanical Engineering at the University of Alberta has begun researchprojects focused on small, residential-sized wind turbines. Along with several planned fieldresearch projects, a blade icing study was commenced in the low-speed wind tunnel. An Ampair100 wind turbine was selected chiefly because it would fit inside the wind tunnel. It provided aready-made platform on which to perform experiments. As a preliminary investigation, thepresent study was carried out to evaluate the performance of the turbine as a baseline for futurestudy.
The purpose of the experiment was to confirm the global parameters of the wind turbine.Results from the experiment were compared to manufacturer’s published data to ensure themachine was in correct working order before continuing with further experiments. In addition,the velocity deficit in the wake of the wind turbine was mapped to determine the amount ofpower extracted from the wind by the rotor.
Transactions of the Canadian Society for Mechanical Engineering, Vol. 35, No. 1, 2011 103
The horizontal axis wind turbine was installed in the low-speed wind tunnel. The windturbine was instrumented and a Kiel probe was mounted on a traverse system in the wake of thewind turbine. The wind tunnel ran at a constant wind speed while data was recorded. Theexperiment was repeated at several different wind speeds, from 3 to 25 m/s.
2.1 Wind TurbineThe Ampair 100 is manufactured in the UK and designed for trickle-charging batteries
onboard a sailboat. It has a 928 mm diameter, 6-bladed rotor. The diameter of the hub is228 mm. The glass fibre reinforced polypropylene blades are fixed, tapered and twisted. Thegenerator is rated for 100 W peak output with onboard rectifier circuits for 12 V DC. It usestwo 6-pole permanent magnet rotors with stators staggered at 30u to minimize break-out torque[16].
2.2 Wind TunnelThe low speed wind tunnel used for the experiment is a closed-loop system with a test section
of constant rectangular cross section. The test section is 1.22 m high by 2.44 m wide and isapproximately 11 m long. Stable winds up to 35 m/s are provided by an axial fan driven by avariable speed 150 kW electric motor. Turbulence intensity in the tunnel is ,0.4 % for windspeeds above 2 m/s [17]. The flow profile in the test section was observed to be very close toconstant speed outside of the boundary layer.
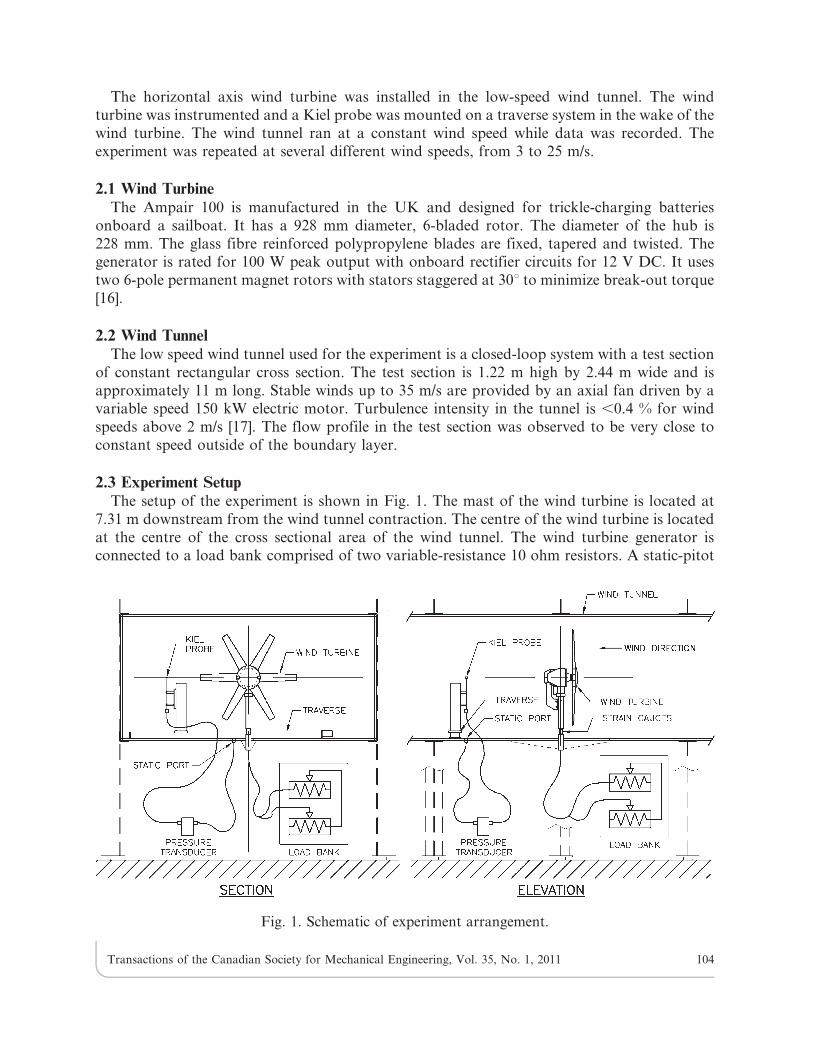
2.3 Experiment SetupThe setup of the experiment is shown in Fig. 1. The mast of the wind turbine is located at
7.31 m downstream from the wind tunnel contraction. The centre of the wind turbine is locatedat the centre of the cross sectional area of the wind tunnel. The wind turbine generator isconnected to a load bank comprised of two variable-resistance 10 ohm resistors. A static-pitot
Fig. 1. Schematic of experiment arrangement.
Transactions of the Canadian Society for Mechanical Engineering, Vol. 35, No. 1, 2011 104
tube is installed 5.21 m upstream of the wind turbine mast at the centre of the cross sectionalarea of the wind tunnel. This static-pitot tube is connected to a manometer in order to calculatethe wind velocity inside the tunnel. The velocity is corrected for static pressure drop due toincreasing boundary layer thickness from the pitot tube to the wind turbine mast. Thetemperature inside the wind tunnel is measured with a thermocouple approximately 4.25 mupstream of the mast. Barometric pressure is measured by a mercury barometer and correctedfor elevation and temperature difference.
A Kiel probe is mounted on a linear traverse system one rotor diameter downstream of thewind turbine rotor. This distance is within the ‘near wake’ where rotor characteristics are stillable to be distinguished [13]. The head of the Kiel probe is positioned at the same elevation asthe centre of the wind turbine rotor. The traverse system can move the Kiel probe laterally fromthe wind tunnel centerline to the wind tunnel wall while stopping at specific locations to sampledata.
Velocity of the wind turbine wake is measured with the Kiel probe and pressure sensor. TheKiel probe and a static port located flush with the wind tunnel floor at the wind tunnelcenterline are connected with hard-walled polypropylene tubing to opposite sides of a Validynediaphragm-type differential pressure sensor. The Kiel probe is a United Sensor Type E with a9 mm diameter head on a stem 305 mm long and 3 mm outer diameter. The pressure sensor iscalibrated by means of an adjustable water column and a micrometer depth gauge manometer.
Many previous wake studies measure velocity using hot-wire anemometry [13, 15]. The Kielprobe was used for velocity measurements instead of hot-wire anemometry for several reasons.Pressure sensors were readily available and easily calibrated. The method of calculating velocityis simple and well-understood. The fast time response of a hot-wire was not required to measurethe average speed of the wake.
The Kiel probe was required because the wake of the wind turbine rotates. The tangentialcomponent of the wake velocity causes the air to hit an upwind-facing probe at an angle ofattack. A typical static-pitot tube is only accurate for angles of attack up to 5u [18]. The Kielprobe measures velocity pressure accurately within a range of ¡ 63u in yaw and ¡ 58u in pitch[19].
The wind turbine was instrumented to measure thrust on the turbine rotor, rotational speedof the rotor, and power output of the generator. The mast was designed to incorporate straingauges arranged in a Wheatstone bridge to measure thrust on the wind turbine rotor. Tworeflective infrared sensors were mounted on the forward face of the turbine hub to detectreflective marks on the back face of the rotor disk. These act as an absolute position encoderwhich reports the position of the blades. Power output of the generator was determined bymeasuring the voltage across the known resistance of the load bank.
The signals from all instruments were collected by a National Instruments data acquisition(DAQ) card, model 6052 E series and recorded by a computer. The DAQ card has 16-bit inputresolution and a maximum sampling rate of 333 kS/s split across the five instrument channels.The maximum possible sampling rate of the data acquisition and custom traversing software is10 kHz per channel. Typically, data was recorded for 2 seconds at each radial location visited bythe Kiel probe. This recording time resulted in a number of rotor revolutions over which toaverage the data. The rotor made approximately 6 rotor revolutions or 36 identical blade passesat 3 m/s wind speed, 30 revolutions or 180 blade passes at 10 m/s and 91 revolutions or 546blade passes at 25 m/s. The data was processed in Matlab with custom scripts to calculate thewind turbine performance parameters.
Transactions of the Canadian Society for Mechanical Engineering, Vol. 35, No. 1, 2011 105
3. DERIVED TURBINE CHARACTERISTICS
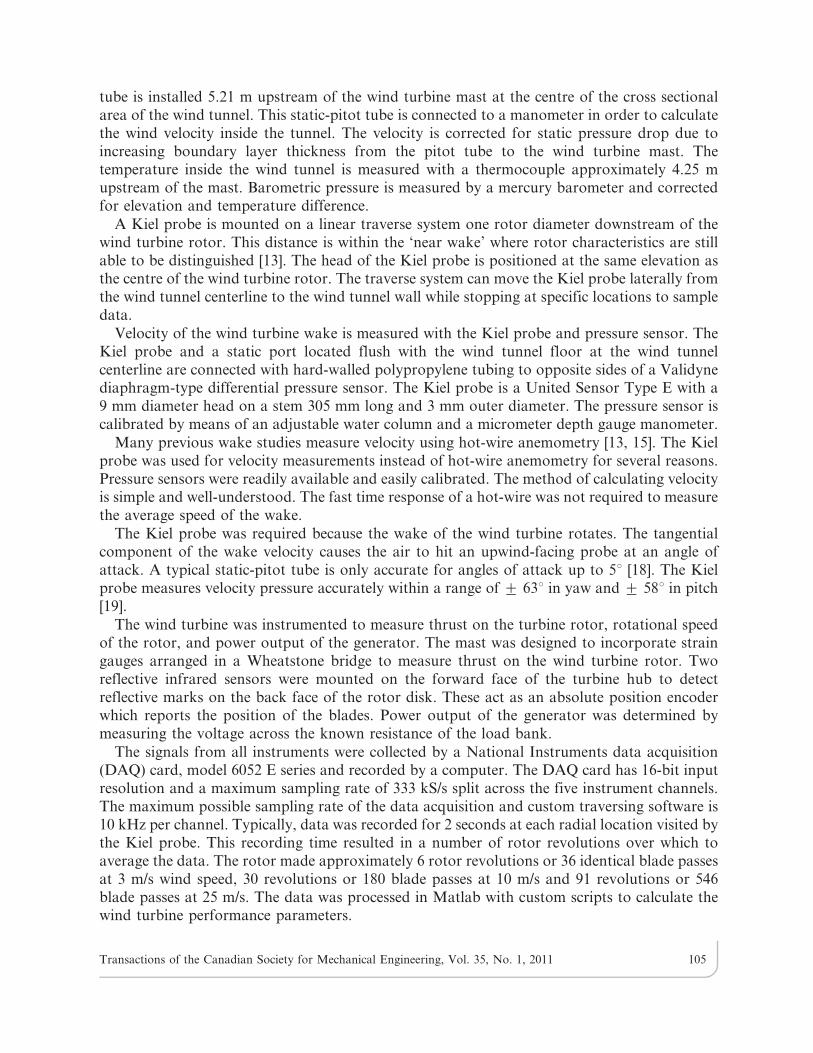
3.1 ThrustThe drag force acting on the wind turbine can be seen in Fig. 2. The thrust measured is
adjusted for air density at standard temperature and pressure (STP). Measurements includethrust on rotor blades, hub and mast. The manufacturer indicates that the drag due to theturbine is 22 kg (216 N) at 25 m/s wind speed [16]. From the experimental results, the drag at25 m/s is 200 N.
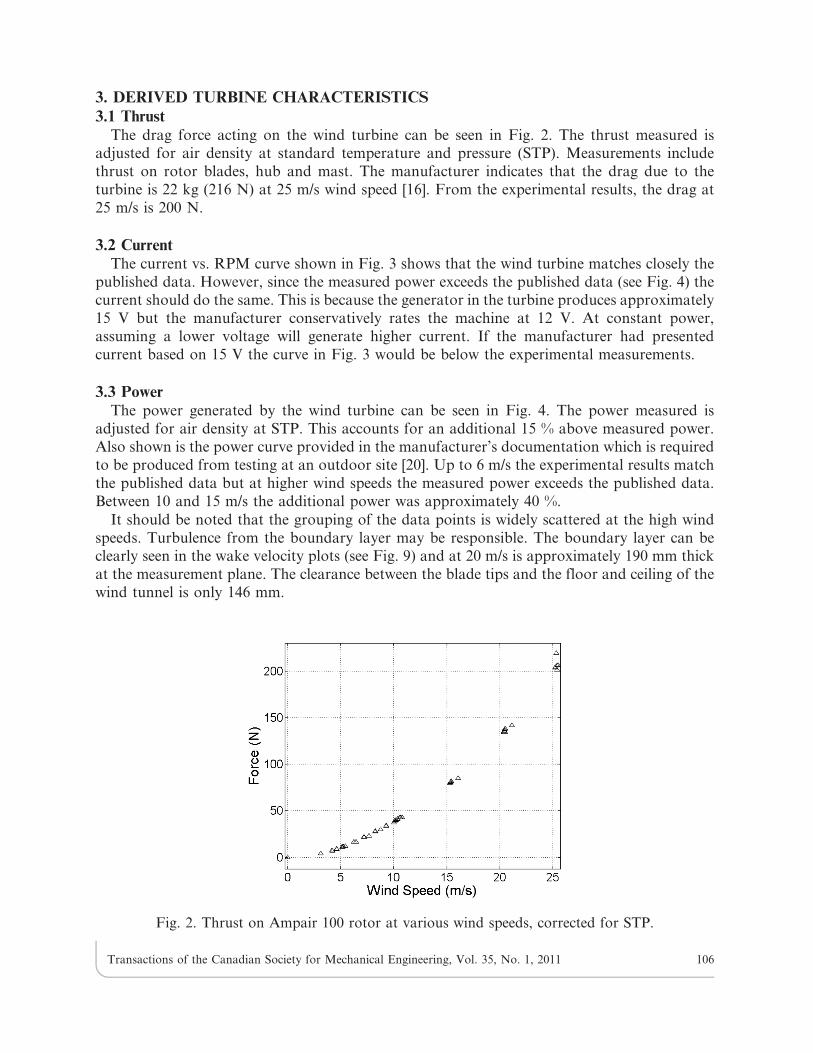
3.2 CurrentThe current vs. RPM curve shown in Fig. 3 shows that the wind turbine matches closely the
published data. However, since the measured power exceeds the published data (see Fig. 4) thecurrent should do the same. This is because the generator in the turbine produces approximately15 V but the manufacturer conservatively rates the machine at 12 V. At constant power,assuming a lower voltage will generate higher current. If the manufacturer had presentedcurrent based on 15 V the curve in Fig. 3 would be below the experimental measurements.
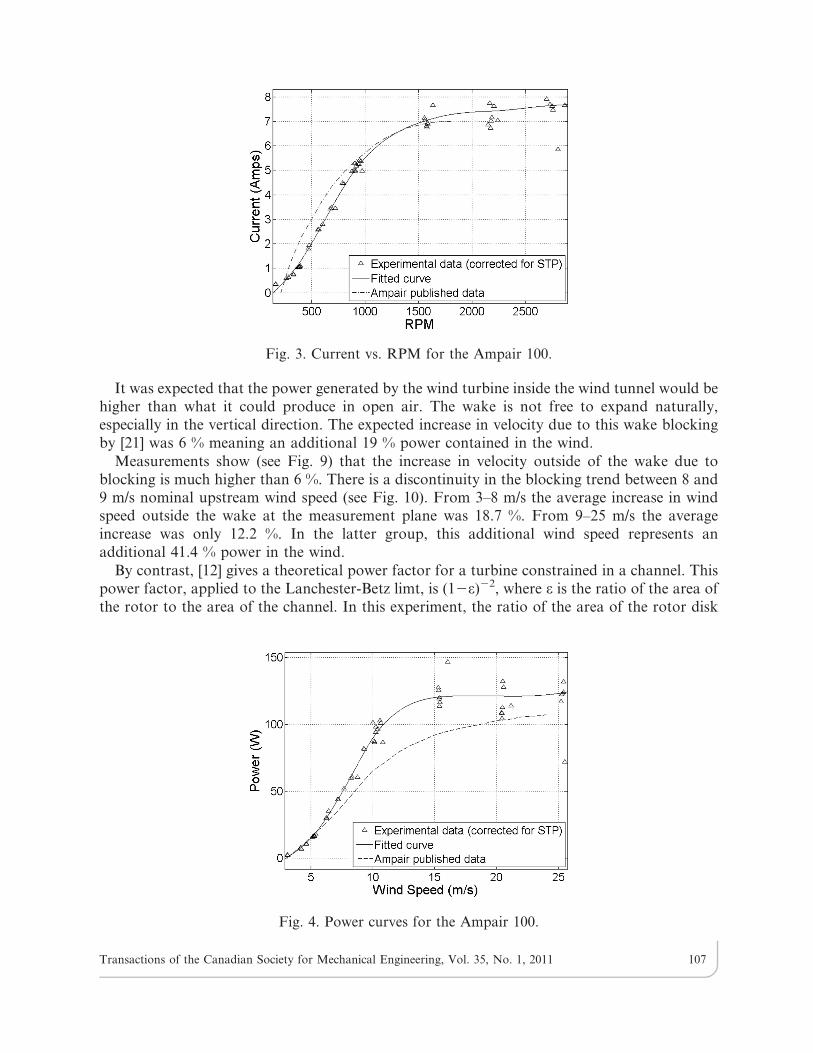
3.3 PowerThe power generated by the wind turbine can be seen in Fig. 4. The power measured is
adjusted for air density at STP. This accounts for an additional 15 % above measured power.Also shown is the power curve provided in the manufacturer’s documentation which is requiredto be produced from testing at an outdoor site [20]. Up to 6 m/s the experimental results matchthe published data but at higher wind speeds the measured power exceeds the published data.Between 10 and 15 m/s the additional power was approximately 40 %.
It should be noted that the grouping of the data points is widely scattered at the high windspeeds. Turbulence from the boundary layer may be responsible. The boundary layer can beclearly seen in the wake velocity plots (see Fig. 9) and at 20 m/s is approximately 190 mm thickat the measurement plane. The clearance between the blade tips and the floor and ceiling of thewind tunnel is only 146 mm.
Fig. 2. Thrust on Ampair 100 rotor at various wind speeds, corrected for STP.
Transactions of the Canadian Society for Mechanical Engineering, Vol. 35, No. 1, 2011 106
It was expected that the power generated by the wind turbine inside the wind tunnel would behigher than what it could produce in open air. The wake is not free to expand naturally,especially in the vertical direction. The expected increase in velocity due to this wake blockingby [21] was 6 % meaning an additional 19 % power contained in the wind.
Measurements show (see Fig. 9) that the increase in velocity outside of the wake due toblocking is much higher than 6 %. There is a discontinuity in the blocking trend between 8 and9 m/s nominal upstream wind speed (see Fig. 10). From 3–8 m/s the average increase in windspeed outside the wake at the measurement plane was 18.7 %. From 9–25 m/s the averageincrease was only 12.2 %. In the latter group, this additional wind speed represents anadditional 41.4 % power in the wind.
By contrast, [12] gives a theoretical power factor for a turbine constrained in a channel. Thispower factor, applied to the Lanchester-Betz limt, is (12e)22, where e is the ratio of the area ofthe rotor to the area of the channel. In this experiment, the ratio of the area of the rotor disk
Fig. 3. Current vs. RPM for the Ampair 100.
Fig. 4. Power curves for the Ampair 100.
Transactions of the Canadian Society for Mechanical Engineering, Vol. 35, No. 1, 2011 107
(including hub) to the area of the wind tunnel cross section is 0.227 which results in a powerfactor of 1.67.
The experimental results do not show any additional power above the published data forwind speeds of 6 m/s and below. This implies that in open air even less power would beproduced. Since the typical wind speed will be less than 10 m/s for the majority of small windturbine installations [22], it is important that accurate information be published in this lowspeed range.
Above 6 m/s the experimental results show power production in excess of the manufacturer’sdata. The additional power is what would be expected from the blockage of the wake inside thewind tunnel. It is not, however, as high as what would be predicted by the power factor in [12].
3.4 Non-Dimensional Parameters
3.4.1 Blockage correctionsThe walls of the wind tunnel constrain the expansion of the wake of the rotor disk. This
results in a flow outside of the wake streamtube that is faster than the freestream air speedleading up to the rotor disk. Ref. [23] developed a blockage factor for bluff bodies (such as arotor disk) based on the additional drag these bodies would experience due to this faster bypassflow. From this [24] provides blockage corrections for CT and TSR.
CT unblockedð Þ~CT
t2
� �blockedð Þ
ð1Þ
TSR unblockedð Þ~TSR
t
� �blockedð Þ
ð2Þ
A blockage correction for CP is not provided in [24]. However, [24] shows good agreementbetween their model and experimental results for CP at low TSR and so no correction is appliedto these experimental results.
3.4.2 Coefficient of thrustThe CT vs. TSR curves for the Ampair 100 are shown in Fig. 5. The peak at about TSR53.4
(corresponding to about 5 m/s wind speed) shows that the rotor is not as efficient at higher windspeeds. It is interesting that the unblocked data shows high outliers at about TSR54. Thiscorresponds to wind speeds of about 10 m/s at which the turbine produces the most power.
3.4.3 Coefficient of powerThe CP vs. TSR curves for the Ampair 100 are shown in Fig. 6 with a peak CP of 0.28 at a
TSR (unblocked) of 3.14. The Lanchester-Betz limit determines a maximum CP possible of 0.59,Glauert reduced this to 0.55, and [11] shows the maximum CP for a 6 bladed rotor at TSR 5
3.14 is 0.48. However, due to the constraining walls of the wind tunnel, applying the powerfactor from [12] results in a maximum CP of 0.83 for this experiment. According to [25] thiswind turbine falls in the category of low-speed, high-torque machines, as expected from itsmany-bladed, small diameter rotor, which typically have a CP of approximately 0.30. Therefore,this wind turbine is performing well for its small size.
Transactions of the Canadian Society for Mechanical Engineering, Vol. 35, No. 1, 2011 108
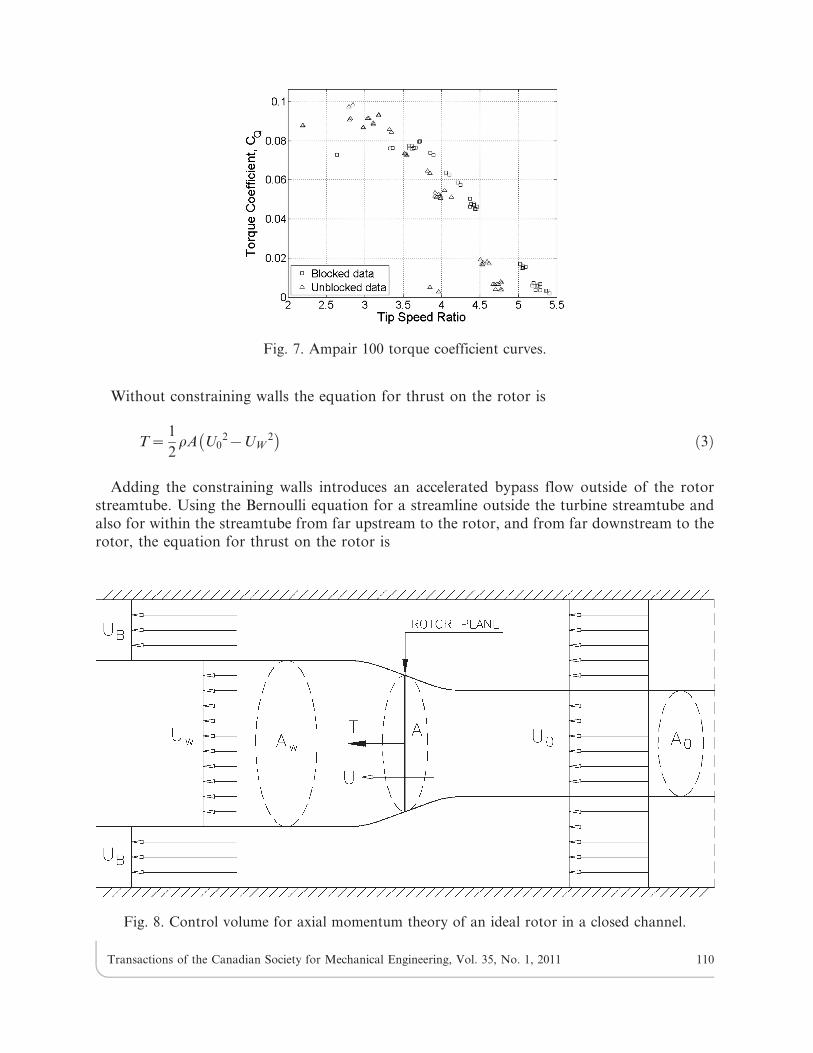
3.4.4 Coefficient of torqueThe CQ vs. TSR curves are shown in Fig. 7. The turbine produces a CQ of 0.093 at a TSR
(unblocked) of 2.53. According to [25] low-speed, high-torque machines typically have CQ rangefrom 0.15–0.02. However, for such small blades this turbine performs well.
4. NEAR WAKE CHARACTERISTICS
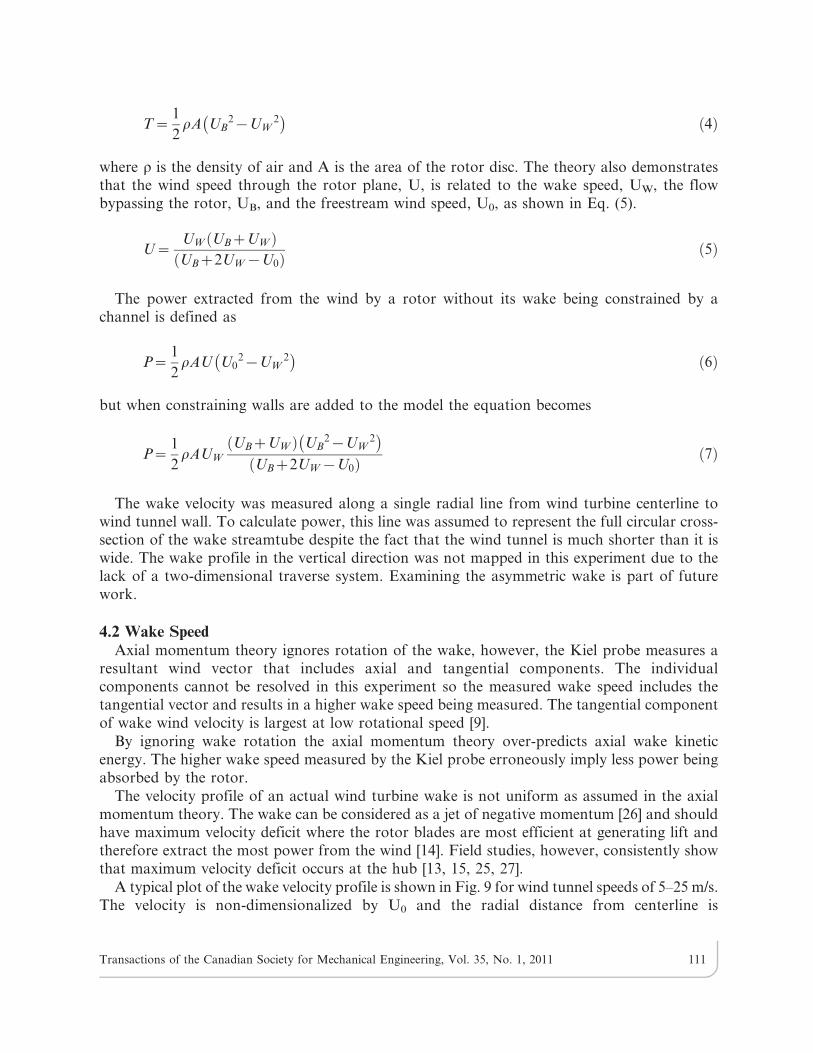
4.1 The ModelRef. [9] provides a summary of the one-dimensional axial momentum theory for an ideal
rotor disk that is commonly used for wind turbines and [12] updates this model with channelwalls. A simple diagram of the control volume considered is shown in Fig. 8. The basicequations of both models are described below.
Fig. 5. Ampair 100 thrust coefficient curves.
Fig. 6. Ampair 100 power coefficient curves.
Transactions of the Canadian Society for Mechanical Engineering, Vol. 35, No. 1, 2011 109
Without constraining walls the equation for thrust on the rotor is
T~1
2rA U0
2{UW2
� �ð3Þ
Adding the constraining walls introduces an accelerated bypass flow outside of the rotorstreamtube. Using the Bernoulli equation for a streamline outside the turbine streamtube andalso for within the streamtube from far upstream to the rotor, and from far downstream to therotor, the equation for thrust on the rotor is
Fig. 7. Ampair 100 torque coefficient curves.
Fig. 8. Control volume for axial momentum theory of an ideal rotor in a closed channel.
Transactions of the Canadian Society for Mechanical Engineering, Vol. 35, No. 1, 2011 110
T~1
2rA UB
2{UW2
� �ð4Þ
where r is the density of air and A is the area of the rotor disc. The theory also demonstratesthat the wind speed through the rotor plane, U, is related to the wake speed, UW, the flowbypassing the rotor, UB, and the freestream wind speed, U0, as shown in Eq. (5).
U~UW UBzUWð ÞUBz2UW{U0ð Þ ð5Þ
The power extracted from the wind by a rotor without its wake being constrained by achannel is defined as
P~1
2rAU U0
2{UW2
� �ð6Þ
but when constraining walls are added to the model the equation becomes
P~1
2rAUW
UBzUWð Þ UB2{UW
2� �
UBz2UW{U0ð Þ ð7Þ
The wake velocity was measured along a single radial line from wind turbine centerline towind tunnel wall. To calculate power, this line was assumed to represent the full circular cross-section of the wake streamtube despite the fact that the wind tunnel is much shorter than it iswide. The wake profile in the vertical direction was not mapped in this experiment due to thelack of a two-dimensional traverse system. Examining the asymmetric wake is part of futurework.
4.2 Wake SpeedAxial momentum theory ignores rotation of the wake, however, the Kiel probe measures a
resultant wind vector that includes axial and tangential components. The individualcomponents cannot be resolved in this experiment so the measured wake speed includes thetangential vector and results in a higher wake speed being measured. The tangential componentof wake wind velocity is largest at low rotational speed [9].
By ignoring wake rotation the axial momentum theory over-predicts axial wake kineticenergy. The higher wake speed measured by the Kiel probe erroneously imply less power beingabsorbed by the rotor.
The velocity profile of an actual wind turbine wake is not uniform as assumed in the axialmomentum theory. The wake can be considered as a jet of negative momentum [26] and shouldhave maximum velocity deficit where the rotor blades are most efficient at generating lift andtherefore extract the most power from the wind [14]. Field studies, however, consistently showthat maximum velocity deficit occurs at the hub [13, 15, 25, 27].
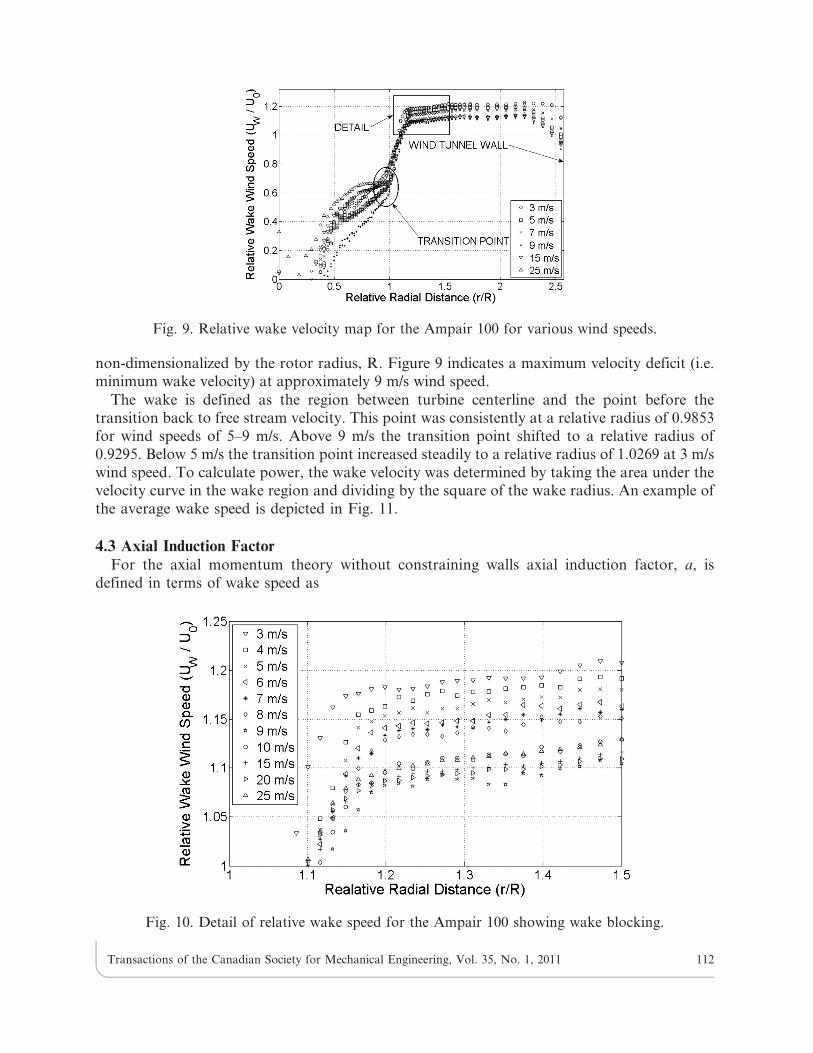
A typical plot of the wake velocity profile is shown in Fig. 9 for wind tunnel speeds of 5–25 m/s.The velocity is non-dimensionalized by U0 and the radial distance from centerline is
Transactions of the Canadian Society for Mechanical Engineering, Vol. 35, No. 1, 2011 111
non-dimensionalized by the rotor radius, R. Figure 9 indicates a maximum velocity deficit (i.e.minimum wake velocity) at approximately 9 m/s wind speed.
The wake is defined as the region between turbine centerline and the point before thetransition back to free stream velocity. This point was consistently at a relative radius of 0.9853for wind speeds of 5–9 m/s. Above 9 m/s the transition point shifted to a relative radius of0.9295. Below 5 m/s the transition point increased steadily to a relative radius of 1.0269 at 3 m/swind speed. To calculate power, the wake velocity was determined by taking the area under thevelocity curve in the wake region and dividing by the square of the wake radius. An example ofthe average wake speed is depicted in Fig. 11.
4.3 Axial Induction FactorFor the axial momentum theory without constraining walls axial induction factor, a, is
defined in terms of wake speed as
Fig. 9. Relative wake velocity map for the Ampair 100 for various wind speeds.
Fig. 10. Detail of relative wake speed for the Ampair 100 showing wake blocking.
Transactions of the Canadian Society for Mechanical Engineering, Vol. 35, No. 1, 2011 112
a~U0{UWð Þ
2U0ð8Þ
For a known thrust on the rotor the theoretical wake speed can be calculated by the axialmomentum theory thrust equation (no walls). When walls are added the axial induction factorbecomes
a~1{UW UBzUWð Þ
U0 UBz2UW{U0ð Þ
� �ð9Þ
Axial induction factor is the relationship between wake speed and the freestream speed. Inessence, it shows how effectively kinetic energy in the wind is being absorbed by the rotor(ignoring wake rotation). However, it has been determined that the assumptions of the axialmomentum theory are only valid for a , 0.4. Above this value there is a turbulent wake state inwhich the large jump from U0 to Uw is so great that the shear line at the edge of the wakebecomes unstable and momentum is transferred from the free stream into the wake [9].
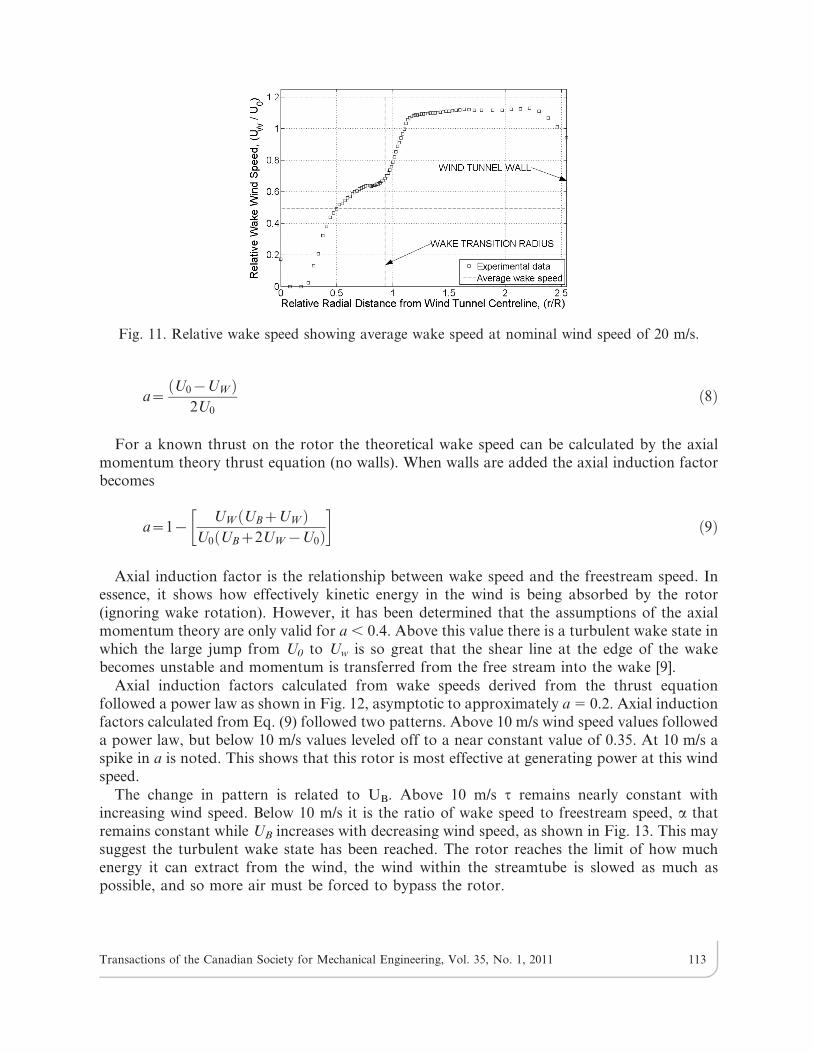
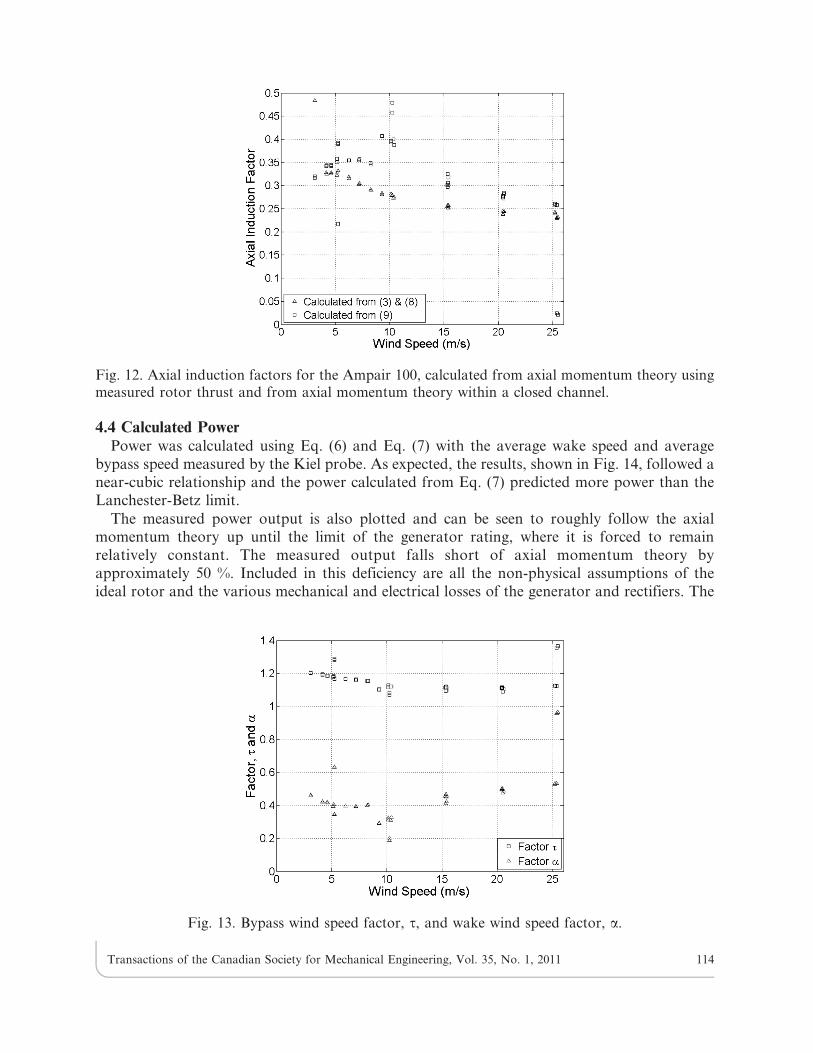
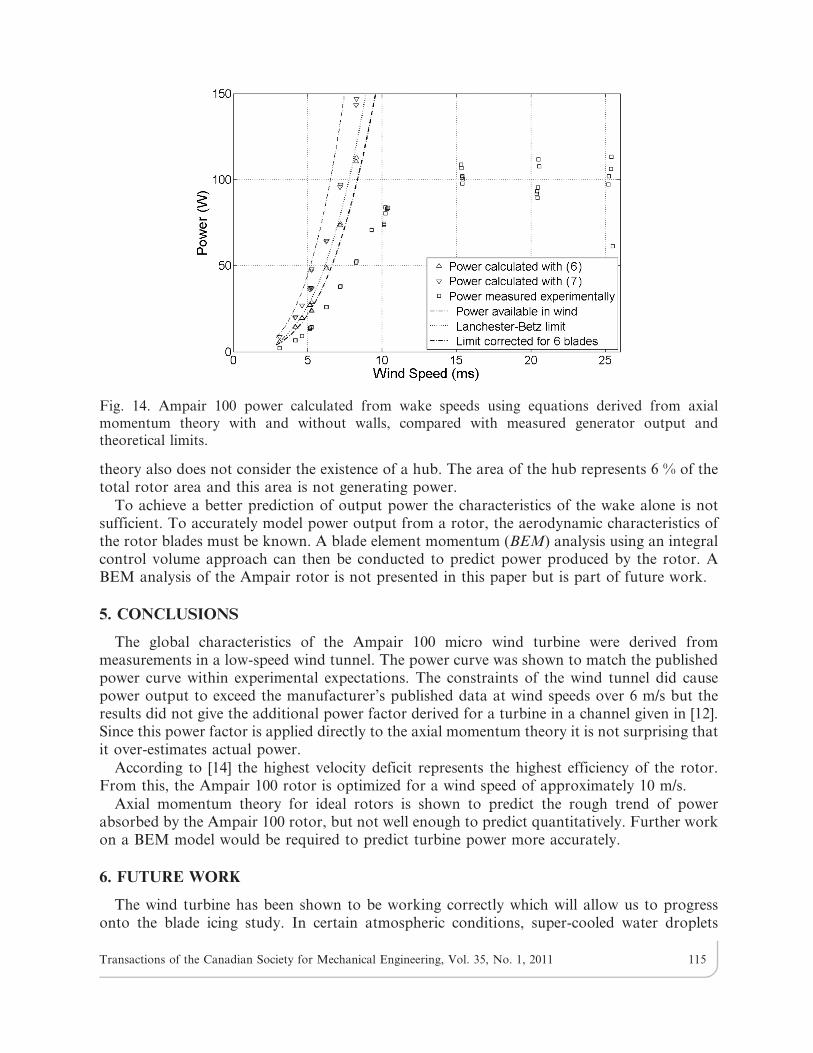
Axial induction factors calculated from wake speeds derived from the thrust equationfollowed a power law as shown in Fig. 12, asymptotic to approximately a 5 0.2. Axial inductionfactors calculated from Eq. (9) followed two patterns. Above 10 m/s wind speed values followeda power law, but below 10 m/s values leveled off to a near constant value of 0.35. At 10 m/s aspike in a is noted. This shows that this rotor is most effective at generating power at this windspeed.
The change in pattern is related to UB. Above 10 m/s t remains nearly constant withincreasing wind speed. Below 10 m/s it is the ratio of wake speed to freestream speed, a thatremains constant while UB increases with decreasing wind speed, as shown in Fig. 13. This maysuggest the turbulent wake state has been reached. The rotor reaches the limit of how muchenergy it can extract from the wind, the wind within the streamtube is slowed as much aspossible, and so more air must be forced to bypass the rotor.
Fig. 11. Relative wake speed showing average wake speed at nominal wind speed of 20 m/s.
Transactions of the Canadian Society for Mechanical Engineering, Vol. 35, No. 1, 2011 113
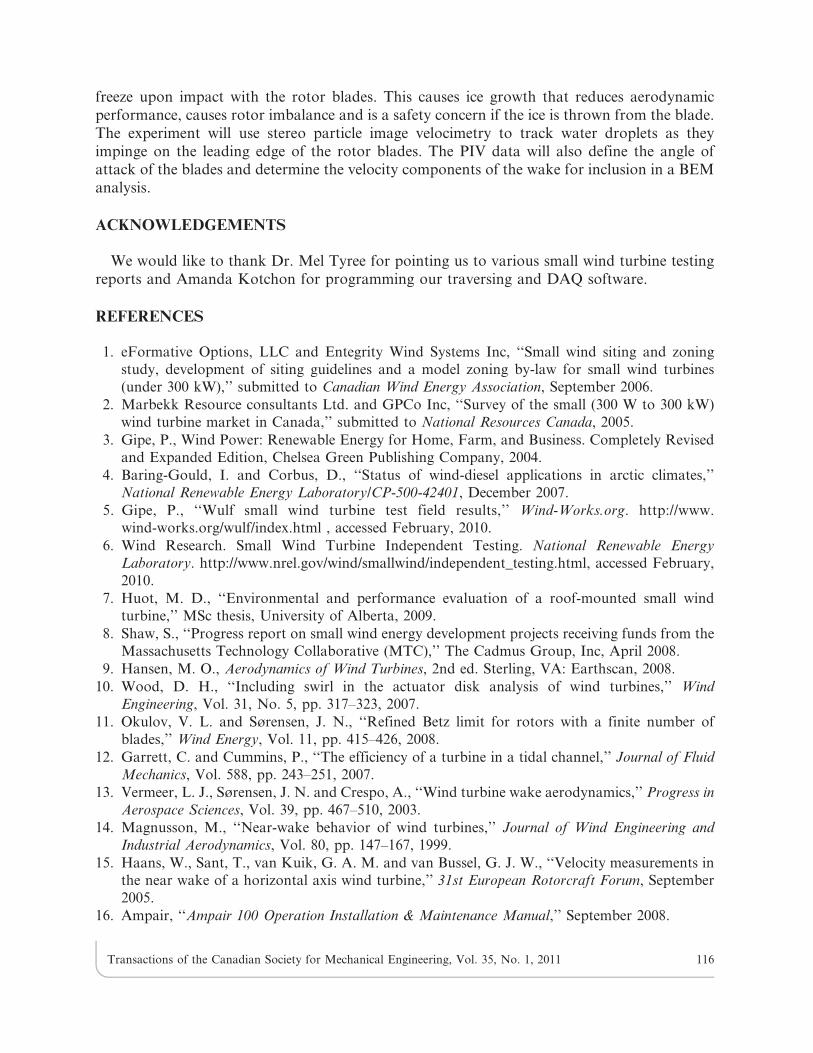
4.4 Calculated PowerPower was calculated using Eq. (6) and Eq. (7) with the average wake speed and average
bypass speed measured by the Kiel probe. As expected, the results, shown in Fig. 14, followed anear-cubic relationship and the power calculated from Eq. (7) predicted more power than theLanchester-Betz limit.
The measured power output is also plotted and can be seen to roughly follow the axialmomentum theory up until the limit of the generator rating, where it is forced to remainrelatively constant. The measured output falls short of axial momentum theory byapproximately 50 %. Included in this deficiency are all the non-physical assumptions of theideal rotor and the various mechanical and electrical losses of the generator and rectifiers. The
Fig. 13. Bypass wind speed factor, t, and wake wind speed factor, a.
Fig. 12. Axial induction factors for the Ampair 100, calculated from axial momentum theory usingmeasured rotor thrust and from axial momentum theory within a closed channel.
Transactions of the Canadian Society for Mechanical Engineering, Vol. 35, No. 1, 2011 114
theory also does not consider the existence of a hub. The area of the hub represents 6 % of thetotal rotor area and this area is not generating power.
To achieve a better prediction of output power the characteristics of the wake alone is notsufficient. To accurately model power output from a rotor, the aerodynamic characteristics ofthe rotor blades must be known. A blade element momentum (BEM) analysis using an integralcontrol volume approach can then be conducted to predict power produced by the rotor. ABEM analysis of the Ampair rotor is not presented in this paper but is part of future work.
5. CONCLUSIONS
The global characteristics of the Ampair 100 micro wind turbine were derived frommeasurements in a low-speed wind tunnel. The power curve was shown to match the publishedpower curve within experimental expectations. The constraints of the wind tunnel did causepower output to exceed the manufacturer’s published data at wind speeds over 6 m/s but theresults did not give the additional power factor derived for a turbine in a channel given in [12].Since this power factor is applied directly to the axial momentum theory it is not surprising thatit over-estimates actual power.
According to [14] the highest velocity deficit represents the highest efficiency of the rotor.From this, the Ampair 100 rotor is optimized for a wind speed of approximately 10 m/s.
Axial momentum theory for ideal rotors is shown to predict the rough trend of powerabsorbed by the Ampair 100 rotor, but not well enough to predict quantitatively. Further workon a BEM model would be required to predict turbine power more accurately.
6. FUTURE WORK
The wind turbine has been shown to be working correctly which will allow us to progressonto the blade icing study. In certain atmospheric conditions, super-cooled water droplets
Fig. 14. Ampair 100 power calculated from wake speeds using equations derived from axialmomentum theory with and without walls, compared with measured generator output andtheoretical limits.
Transactions of the Canadian Society for Mechanical Engineering, Vol. 35, No. 1, 2011 115
freeze upon impact with the rotor blades. This causes ice growth that reduces aerodynamicperformance, causes rotor imbalance and is a safety concern if the ice is thrown from the blade.The experiment will use stereo particle image velocimetry to track water droplets as theyimpinge on the leading edge of the rotor blades. The PIV data will also define the angle ofattack of the blades and determine the velocity components of the wake for inclusion in a BEManalysis.
ACKNOWLEDGEMENTS
We would like to thank Dr. Mel Tyree for pointing us to various small wind turbine testingreports and Amanda Kotchon for programming our traversing and DAQ software.
REFERENCES
1. eFormative Options, LLC and Entegrity Wind Systems Inc, ‘‘Small wind siting and zoning
study, development of siting guidelines and a model zoning by-law for small wind turbines
(under 300 kW),’’ submitted to Canadian Wind Energy Association, September 2006.
2. Marbekk Resource consultants Ltd. and GPCo Inc, ‘‘Survey of the small (300 W to 300 kW)
wind turbine market in Canada,’’ submitted to National Resources Canada, 2005.
3. Gipe, P., Wind Power: Renewable Energy for Home, Farm, and Business. Completely Revised
and Expanded Edition, Chelsea Green Publishing Company, 2004.
4. Baring-Gould, I. and Corbus, D., ‘‘Status of wind-diesel applications in arctic climates,’’
National Renewable Energy Laboratory/CP-500-42401, December 2007.
5. Gipe, P., ‘‘Wulf small wind turbine test field results,’’ Wind-Works.org. http://www.
Transactions of the Canadian Society for Mechanical Engineering, Vol. 35, No. 1, 2011 116
17. Johnson, M. R., ‘‘Wake-stabilized diffusion flames in crossflow: application to the efficienciesof gas flares.’’ PhD dissertation, University of Alberta, 2001.
18. United Sensor Corporation. Pitot-Static Pressure Probes, http://www.unitedsensorcorp.com/pitot.html, accessed February 2010.
19. United Sensor Corporation, Kiel Probes, http://www.unitedsensorcorp.com/kiel.html, accessedFebruary 2010.
20. British Wind Energy Association, ‘‘BWEA small wind turbine performance and safety standard,’’February 2008.
21. Pope, A. and Harper, J. J., ‘‘Low-Speed Wind Tunnel Testing’’. New York, NY: John Wiley &Sons, Inc, 1966.
22. Environment Canada, Canadian Wind Atlas, http://www.windatlas.ca/en/index.php, accessedFebruary 2010.
23. Maskell, E., ‘‘A theory of the blockage effects on bluff bodies and stalled wings in a closed windtunnel.’’ Aeronautical Research Council Reports and Memoranda, No.3400, 1963.
24. Whelan, J. I., Graham, J. M. R. and Peiro, J., ‘‘A free-surface and blockage correction for tidalturbines.’’ Journal of Fluid Mechanics, Vol. 624, pp. 281–291, 2009.
25. Hau, E., Wind Turbines: Fundamentals, Technologies, Application, Economics, 2nd ed., Springer-Verlag Berlin Heidelberg, 2006.
26. Magnusson, M. and Smedman, A. S., ‘‘Air flow behind wind turbines,’’ Journal of Wind
Engineering and Industrial Aerodynamics, Vol. 80, pp. 169–189, 1999.27. Baker, R. W., Walker, S. N. and Katen, P. C., ‘‘Wake measurements around operating wind
turbines,’’ Journal of Solar Energy Engineering, Vol. 107, pp. 183–185, May 1985.
Transactions of the Canadian Society for Mechanical Engineering, Vol. 35, No. 1, 2011 117