29
0 PERFORMANCE EVALUATION, MONITORING AND ASSESSMENT OF UTILITY COMPANIES, AND DEVELOPMENT OF KEY PERFORMANCE INDICATORS. Submitted to by DR. WILLIAM GBONEY November, 2014.
| Date post: | 02-Apr-2018 |
| Category: |
Documents |
| Upload: | phungtuong |
| View: | 220 times |
| Download: | 1 times |

0
PERFORMANCE EVALUATION, MONITORINGAND ASSESSMENT OF UTILITY COMPANIES,AND DEVELOPMENT OF KEY PERFORMANCE
INDICATORS.
Submitted to
by
DR. WILLIAM GBONEY
November, 2014.

1
Table of contentsChapter PagesAbbreviations 3Executive Summary 4
1. Introduction 72. Performance Management Process 83. Identification of Key Performance Indicators 93.1 Proposed Key Performance Indicators 93.1.1 Financial Performnance Indicatots 93.1.2 Commercial Performance Indicators 10
3.1.3 Technical Performance Indicators 103.1.4 Efficiency Performance Indicators 113.1.5 Social Impact Indicatotors 113.2 Proposed Initial Benchmarks 123.3 Rationale for Benchmarked KPIs 144. Definition of Key Performance Indicators 165. Information Reporting Requirements 19

2
Appendices
Appendix A. Form 1A: Operational and Technical Data - Generation Licensee 20Appendix B. Form 1B: Operational and Technical Data - Transmission Licensee 21Appendix C. Form 1C: Operational and Technical Data - Distribution & Sales Licensee 22Appendix D. Form 2: Import and Export - Transmission Licensee 23Appendix E. Form 3: Customer Data 24Appendix F. Form 4A: Data for Generation Plant Output, Sales, Billing, Collection 25Appendix G. Form 4B:Data for Transmission Licensee-Purchase, Billing, Collection 26Appendix H. Form 4C: Data for Distribution Licensee-Purchase, Sale, Billing, Collection 26Appendix I. Form 5: Data on Accounts Receivable 27Appendix J. Form 6A: Data on Wholesale Market Transactions - Energy Balance 28
Tables
Table 3-1. Financial KPIs 10Table 3-2. Commercial KPIs 10Table 3-3 Technical KPIs 10Table 3-4 Efficiency KPIs 11Table 3-5 Social Impact KPIs 11Table 3-6 Financial Benchmarks 12Table 3-7 Commercial Benchmarks 12Table 3-8 Technical Benchmarks 12Table 3-9 Efficiency Benchmarks 13Table 3-10 Social Impact Benchmarks 13Table 3-11 Rationale for Financial KPI Benchmarking 14Table 3-12 Rationale for Commercial KPI Benchmarking 14Table 3-13 Rationale for Technical KPI Benchmarking 15Table 4-1 Definition of Financial KPIs 16Table 4-2 Definition of Commercial KPIs 16Table 4-3 Definition of Technical KPIs 17Table 4-4 Definition of Efficiency KPIs 18Table 4-5 Definition of Social Impact KPIs 18Table 5-1 Summary of Data Reporting by Licensees 19
FiguresFigure 2-1 Performance Management Process 8

3
AbbreviationsCAIDI Customer Average Interruption Duration Index
EBIT Earnings Before Interest and Tax
EBITDA Earnings Before Interest, Tax, Depreciation and Amortization
GoR Government of Rwanda
KPA Key Performance Area
KPI Key Performance Indicator
kWh Kilowatt-hour
MW Megawatt
RAB Regulatory Asset Base
RURA Rwanda Utilities Regulatory Authority
SAIDI System Average Interruption Duration Index
SAIFI System Average Interruption Frequency Index

4
Executive SummaryThe Rwanda Utilities Regulatory Authority (RURA), like all regulatory agencies, is required tocontinuously monitor and evaluate the operational performance (i.e. financial and technical)of the regulated utilities, towards achieving the overall energy policy goals of the Governmentof Rwanda (GoR). The objective of this document is therefore to develop the framework anddefine the parameters, which can be used by RURA to assess, monitor and evaluate theoperational performance of the regulated power utilities.
In developing the performance monitoring framework, the first task was to identify and definethe Key Performance Areas (KPs), for which Key Performance Indicators (KPIs) need tobe developed to monitor the utility company performance. Based on the Energy Policy goals,the following KPAs related to utility operations were identified:
Achieve an efficient sector through higher Productive and Allocative efficiencies; Encourage investment, growth and financial sustainability of resources; Ensure sustainable use of resources; Ensure safe, reliable and security of supply;
The KPIs have therefore been selected to cover the four afore-mentioned KPAs related to thefollowing operational areas of the utility business:
Financial; Commercial; Technical; Efficiency; Social Impact;
For effective performance monitoring, the Indicators have been categorised into the followingtwo groups:
KPIs which can be Benchmarked: This refers to indicators which can bebenchmarked based on best industry practice;
KPIs which can be Tracked: This refers to KPIs which are difficult to benchmarkduring the initial period of implementation of the performance managementprogramme. These indicators can however be tracked over a period of at least oneyears, after which RURA can set realistic benchmarks for performance monitoring.
The complete list of KPIs covering the five operational areas of the utility business aresummarised below.
Financial KPIs.
Indicator Monitoring TypeReturn on RAB BenchmarkOperating Margin TrackCurrent Ratio BenchmarkGearing Ratio BenchmarkInterest ServiceCoverage Ratio
Benchmark

5
Debt ServiceCoverage Ratio
Benchmark
Commercial KPIs.
Indicator Monitoring TypeAccounts Receivable(Debtor) Days
Benchmark
Bad Debts BenchmarkWorking Capital TrackOperatingCost/Sales
Benchmark
Revenue CollectionRate
Benchmark
Revenue GrowthRate
Track
Technical KPIs.
Indicator Monitoring TypePlant Availability BenchmarkNetwork Availability BenchmarkCapacity Factor BenchmarkTransmissionTechnical Losses
Benchmark
Total DistributionSystem Losses
Benchmark
Reserve Margin TrackMWh of load sheddue to breakdowns
Track
SAIFI TrackSAIDI TrackCAIDI Track
Efficiency KPIs.
Indicator MonitoringNumber ofcustomers peremployee
Track
Installed capacity peremployee
Track

6
Energy generated,transmitted ordistributed peremployee
Track
Energy distributedper customer
Track
Km. of network peremployee
Track
Operating cost peremployee
Track
Social Impact KPIs
Indicator Monitoring% of householdselectrified
Track
No. of applicationsfor new connections
Track
No. of applicationsapproved
Track
No. of rejectedapplications
Track
Connectivity Rate Track
In order to ensure effective monitoring system, a Performance Management Process has beenrecommended which will involve chain of events. This will allow for periodic performancemeetings between the regulator and the licensees to review the initial targets, discuss theutility company’s actual performance and fine-tune the benchmarks or KPIs, if necessary.
The document also presents the definitions and the formula for calculating all the KPIs. Sinceeffective performance monitoring depends on credible and reliable data, details of keyinformation to be submitted by the utility companies for each segment of the electricityindustry, are presented in the Appendix.

7
1. IntroductionThe Rwanda Utilities Regulatory Authority (RURA) in addition to reviewing and setting tariffs,is required to continuously monitor the operational performance and results of the regulatedutilities. RURA is therefore required to assess, monitor and evaluate the performance of theutility companies towards achieving the overall energy policy goals of the Government ofRwanda (GoR). The purpose of this document is to develop the framework and define theparameters which can be used by RURA to assess, monitor and evaluate the operationalperformance of the regulated power utilities, towards achieving the overall energy sector policygoals. The energy policy goals as presented in the Final Draft Energy Policy (2014) are asfollows:
Increasing the supply of power generation in line with expected demand; Creating an enabling environment from increased private sector participation in energy
supply and service provision; Encouraging and incentivizing more rational, efficient use of energy in public
institutions, and amongst industrial and household end-users; Ensuring the sustainability of energy exploration, extraction, supply and consumption
so as to prevent damage to the environment and habitats; Promoting safe, efficient and competitive production, procurement, transportation and
distribution of energy;
The above energy policy goals have been used to identify the following Key PerformanceAreas (KPAs), for which Key Performance Indicators (KPIs) would be developed to monitorand assess the performance of the regulated utility companies.
Achieve an efficient sector through achieving higher Productive and AllocativeEfficiencies;
Encourage investment, growth and financial sustainability through private sectorparticipation;
Ensure sustainable use of resources; Ensure safe, reliable and security of supply and prevent damage to the environment;
The KPIs have been selected to cover the four KPAs and going forward, the results of theperformance assessment can feed into the tariff-setting review process, thus making RURA’stariff-setting process, performance or incentive-based.

8
2. Performance Management ProcessThe Performance Management Process involves a chain of events which will allow for periodicperformance meetings between the regulator and the licensees to review and ‘fine-tune’ theinitial targets and discuss the utility’s actual performance. The outcome of such interactionswill then feed into the performance management process to ensure that all the players have avery good understanding of what is involved.
The proposed performance management process is depicted below in figure 2-1.
Figure 2-1. Performance Management Process
IDENTIFY KPAs
AND DEFINE KPIs
SET KPIBENCHMARKS
ANALYZE ANDMEASURE UTILITY
PERFORMANCE
REVIEW ACTUALPERFORMANCE AGAINST
BENCHMARKS
REVIEW AND FINE-TUNE KPIs ANDBENCHMARKS

9
3. Identification of Key PerformanceIndicatorsEven though the selection of the KPIs would be based on the four KPAs, the selection wouldalso take cognizance of the following guiding principles and criteria:
Data reliability; Impact of KPI on utility performance; Whether KPI is endogenous and can be controlled by the utility company; Whether Indicator is measurable; Whether Indicator is output-based;
3.1 Proposed Key Performance IndicatorsThe selection of KPIs was based on intensive research on the subject, as well as internationalbest practice in the electricity sector. The results of this exercise led to the categorisation ofthe KPIs into the following operational areas of the utility business:
Financial; Commercial; Technical; Efficiency; Social Impact;
For performance monitoring, the KPIs have been categorised into the following two groups:
Benchmarking KPIs: Refer to indicators which can be benchmarked based on bestindustry practice;
Tracking KPIs: Refer to KPIs which are difficult to benchmark during the initial periodof implementation of the performance management programme. These indicators canhowever be tracked over a period of at least one year, after which RURA can thendecide to set realistic benchmarks for performance monitoring.
During the initial phase of implementation of the performance management programme, theConsultant would recommend that carefully selected KPIs are benchmarked for licenseeperformance monitoring. This approach would enable RURA to put more emphasis on resultsinterpretation and learning so that going forward, the KPIs can be ‘fine-tuned’ for setting ofmore robust benchmarks.
3.1.1 Financial Performance Indicators
The proposed Financial KPIs for assessing and monitoring the performance of the licenseesare shown below in Table 3-1.

10
Table 3-1. Financial KPIs.
Indicator Monitoring Generation Transmission Distribution & SupplyReturn on RAB Benchmark √ √ √EBIT orOperatingMargin
Track √ √ √
Current Ratio Benchmark √ √ √Gearing Ratio Benchmark √ √ √Interest ServiceCoverage Ratio
Benchmark √ √ √
Debt ServiceCoverage Ratio
Benchmark √ √ √
3.1.2 Commercial Performance Indicators
The proposed commercial KPIs are shown in Table 3-2.
Table 3-2. Commercial KPIs.
Indicator Monitoring Generation Transmission Distribution & SalesAccountsReceivable(Debtor) Days
Benchmark √ √ √
Bad Debts Benchmark √ √ √WorkingCapital
Track √ √ √
OperatingCost/Sales
Benchmark √ √ √
RevenueCollection Rate
Benchmark √
RevenueGrowth Rate
Track √ √ √
3.1.3 Technical Performance Indicators
The technical KPIs proposed for performance evaluation and monitoring are summarised inTable 3-3.
Table 3-3. Technical KPIs.
Indicator Monitoring Generation Transmission Distribution & SalesPlant Availability Benchmark √Network Availability Benchmark √Capacity Factor Benchmark √ √TransmissionTechnical Loss
Benchmark √

11
Total DistributionLosses
Benchmark √
Reserve Margin Track √MWh of load sheddue to breakdowns
Track √ √ √
SAIFI Track √SAIDI Track √CAIDI Track √
3.1.4 Efficiency Performance Indicators
The selected KPIs for monitoring the operational efficiency of the regulated utilities aresummarised in Table 3-4 below.
Table 3-4. Efficiency KPIs.
Indicator Monitoring Generation Transmission Distribution & SalesNumber of customersper employee1.
Track √ √ √
Installed capacity peremployee
Track √
Energy generated,transmitted ordistributed peremployee
Track √ √ √
Energy distributedper customer
Track √
Total Km. of networkper employee
Track √ √
Operating cost peremployee
Track √ √ √
3.1.5 Social Impact Indicators
The proposed KPIs for assessing the social impact of utility performance are shown in Table3-5.
Table 3-5. Social Impact KPIs
Indicator Monitoring Generation Transmission Distribution & Sales% of householdselectrified per year
Track √
No. of applications fornew connections
Track √ √
1 Report on disaggregated basis per segment. If not possible, report aggregated figures and explainthe basis of staff number.

12
No. of applicationsapproved per year
Track √ √
No. of rejectedapplications2
Track √ √
Connectivity Rate3 Track √
3.2 Proposed Initial BenchmarksTable 3-6. Financial Benchmarks.
Indicator Monitoring Generation Transmission Distribution & SalesReturn on RAB Benchmark >5% >5% >5%Operating Margin4 Track √ √ √Current Ratio Benchmark >1.5 >1.5 >1.5Gearing Ratio Benchmark >60% >60% >60%Interest ServiceCoverage Ratio
Benchmark >2.0 >2.0 >2.0
Debt ServiceCoverage
Benchmark >1.5 >1.5 >1.5
Table 3-7. Commercial Benchmarks.
Indicator Monitoring Generation Transmission Distribution & SalesAccounts Receivable(Debtor Days)
Benchmark <30 days <30 days <45 days
Bad Debts Benchmark <0.5% <0.5% <0.5%Working Capital Track √ √ √Operating Cost/Sales Benchmark <15% <20% <25%Revenue CollectionRate
Benchmark >95%
Revenue Growth Rate Track √ √ √
Table 3-8. Technical Benchmarks.
Indicator Monitoring Generation Transmission Distribution & SalesAvge Plant Availability(To be reported perplant)
Benchmark >85%
2 Utility company to provide reasons for rejection of applications to enable the regulator know whether there arespecific barriers faced by potential customers who want to be connected.
3 Gives an indication of the level of electricity coverage in the country. Also gives an indication of how the sector isperforming in meeting the GoR’s goal of enhancing population access to electricity.
4 Also known as Earnings Before Interest and Taxes. It is a key indicator of how effective the company is atcontrolling costs associated with the normal business operations and therefore a measure of profitability. Ithowever excludes capital (i.e. investment) used to generate the profit.

13
Network Availability Benchmark >95% >85%Capacity Factor Benchmark >80% >80%Load Factor5 Track √ √TransmissionTechnical Losses
Benchmark <3%
Total DistributionSystem Losses(Technical + Non-Technical)
Benchmark <20%
Reserve Margin6 Track √MWh of load shed dueto breakdowns
Track √ √ √
SAIFI Track √SAIDI Track √CAIDI Track √
Table 3-9. Efficiency Benchmarks.
Indicator Monitoring Generation Transmission Distribution & SalesNumber of customersper employee
Track √ √ √
Installed capacity peremployee
Track √ √ √
Energy generated,transmitted ordistributed peremployee
Track √ √ √
Energy distributedper customer
Track √
Km. of network peremployee
Track √ √
Operating cost peremployee
Track √ √ √
Table 3-10. Social Impact Benchmarks
Indicator Monitoring Generation Transmission Distribution & Sales% of householdselectrified annually
Track √
No. of applications fornew connections
Track √ √
5 The load factor gives an indication of the load profile that the network company faces. It is a measure of howsteady an electrical load is. Defined as the ratio of the average load over the peak load in a specified timeperiod.6 The reserve margin measures the adequacy of available generation capacity against the system peak capacity.A reserve margin which falls within an acceptable range means the system has adequate generation capacity tokeep load-shedding and blackouts to within acceptable levels, without necessarily over-investing.

14
No. of applicationsapproved
Track √ √
No. of rejectedapplications
Track √ √
Connectivity Rate Track √
3.3 Rationale for Benchmarked KPIsThe rationale for benchmarking the selected KPIs are presented in the table below.
Table 3-11. Rationale for Financial KPI Benchmarking.
Indicator Monitoring RationaleReturn on RAB Benchmark This indicator is used to ascertain whether the
licensee has earned a reasonable return on itsregulatory asset base. This is computed using EBIT orthe operating profit.
Current Ratio Benchmark Gives an indication of a company’s ability to meet itsshort-term financial obligations.
Gearing Ratio Benchmark Gives an indication of the financial structure of thecompany regarding the amount of debt in the capitalstructure of the firm
Interest ServiceCoverage Ratio
Benchmark Gives an indication whether the company has thecapacity to pay its interest payments on its debt. It alsomeasures the number of times a company would beable to make interest payments on its debts. Ittherefore gives an index of the financial strength of thecompany.
Debt ServiceCoverage Ratio
Benchmark Gives an indication of the company’s capacity to meetits interest and principal payments. This KPI gives anindication of the cash producing ability of the companyto cover its debt payment. A higher debt service coverratio implies it is more likely for the company to obtaina loan
Table 3-12. Rationale for Commercial KPI Benchmarking.
Indicator Monitoring RationaleAccountsReceivable(Debtor) Days
Benchmark This KPI gives the number of days it takes thecompany to collect its receivables. It is therefore agood performance indicator for measuring thecompany’s revenue collection effectiveness
Bad Debts Benchmark This KPI gives an indication of receivables which havebeen written off. The indicator is therefore crucial inthe company’s management of outstanding accounts.It therefore measures the commercial effectiveness ofthe utility company

15
OperatingCost/Sales
Benchmark This is an important indicator because it measures theoverall operating efficiency of the company. For thenetwork sector (i.e. transmission and distribution), thisratio is influenced by the network characteristics,population density etc. and therefore this benchmarkmay have to be ‘fine-tuned’ after the initial year ofoperationalizing the performance management system
RevenueCollection Rate
Benchmark This indicator gives the percentage of billed electricitysales which is collected as revenue. It is therefore ameasure of the firm’s revenue collection effectiveness.
Table 3-13. Rationale for Technical KPI Benchmarking.
Indicator Monitoring RationalePlant Availability Benchmark This indicator measures the amount of time the plant
is able to produce electricity within a certain period,relative to the total amount of time in that period. Plantavailability therefore gives an indication of theeffectiveness of the operations and maintenance ofthe power plants.
NetworkAvailability
Benchmark This KPI gives the available number of hours of thenetwork, measured against the total number of hoursin a given period. This indicator can therefore be usedto incentivise network operators to maintain highnetwork availability and reliability and ensure minimumlevel of unsupplied energy.
Capacity Factor Benchmark The KPI gives indication of the actual electricityproduced by a power plant, relative to the maximum itcould produce at continuous full power operationsduring the same period. It thus measures the actualplant output relative to its potential output.
TransmissionTechnicalLosses
Benchmark Transmission technical loss level gives an indicationof the network operations management of line lossesand efficiency. Even though line losses are caused bythe physical properties of the transmission system,they can nevertheless be controlled through goodoperational and maintenance practices, as well asgood network design
TotalDistributionSystem Losses(Technical +Non-Technical)
Benchmark The total distribution system loss indicator measuresthe total amount of loss comprising technical lossesthrough to illegal connections or theft, meteringdeficiencies and billing errors.

16
4. Definition of Key PerformanceIndicatorsThe definition for the KPIs are provided in the tables below.
Table 4-1 Definition of Financial KPIs
Indicator Unit DefinitionReturn on RAB % {Operating Profit or EBIT } X 100%
{Average RAB}
Operating Margin % {Revenue – (Electricity Purchases + O&M)} X 100%Revenue
Current Ratio Ratio Current AssetsCurrent Liabilities
Gearing Ratio Ratio Long Term DebtTotal Capital
Interest ServiceCoverage Ratio
Ratioor No.
ofTimes
EBITInterest Payment
Debt ServiceCoverage Ratio
Ratioor No.
ofTimes
EBIT(Interest Payment + Principal Payment)
Table 4-2. Definition of Commercial KPIs
Indicator Unit DefinitionAccountsReceivable (Debtor)Days
Days {Accounts Receivable at end of period} x 365 days{Total Electricity Sales for period}
Bad Debts % {Bad Debts Written Off During Period} x 100%{Total Revenue for Period}
Working Capital % (Current Assets – Current Liabilities ) x 100%Total Operating Cost (excluding power purchase, depreciation &
interest payment)
OperatingCost/Sales
% {Total Operating Cost (excluding power purchase, depreciation& interest payment)} x 100%
{Total Sales Revenue}Revenue Collection % {Total Revenue Collection} x 100%
{Total Electricity Sold}

17
Revenue GrowthRate
% {Total Revenue Yeart+1 - Total Revenue Year} x 100%{Total Revenue Yeart }
Table 4-3. Definition of Technical KPIs
Indicator Unit DefinitionPlant Availability % {Available Capacity x Hours of Availability during period}
x100%Installed Capacity x 365 days x 24 hours
Average NetworkAvailability
% Sum of Available Hours of each circuitNumber of circuits in the system x No. of Hours in a period
Capacity Factor % {MWh Generated or Transmitted} x 100%{Installed or Design Capacity x 365 days x 24 hours}
Load Factor % Energy Consumed (MWh)Max Power (MW) X Number of Hours within the period
TransmissionTechnical Loss
% {Total Metered Energy at the Point of Injection – Amount ofEnergy at Withdrawal Point}/Total Energy at Point of
Injection
Total DistributionSystem Losses
% {Energy Input into Distribution System – Energy Billed} X100%
Metered Energy Received into Distribution System
Reserve Margin % {Available Supply Capacity – Peak Demand} x 100%Available Supply Capacity
MW of Load ShedDue to ForcedOutages
MWh MWh shed during forced outages during period under reviewand reasons, provided by licensee
SAIFI No. Total Number of Customer Interruptions during period*Total Number of Connected Customers
SAIDI Minutes Sum of Duration of Customer Interruptions (Mins.)*Total Number of Connected Customers
CAIDI Minutes/Interruption
Sum of all Customer Interruption Duration*Total Number of Customer Interruptions
= SAIDI ÷ SAIFI
*: Recommends that RURA monitor these KPIs at distribution level, during initial phase of the programme.

18
Table 4-4. Definition of Efficiency KPIs.
Indicator Unit DefinitionNumber ofcustomers peremployee
Number Total Number of customers at end of periodTotal Number of employees at end of period
Installed capacityper employee
MW/Employee Total Installed Capacity at end of periodTotal Number of Employees at end of period
Energy generated,transmitted ordistributed peremployee
MWh/Employee Total Amount of Energy at end of periodTotal Number of Employees at end of period
Energy generated,transmitted ordistributed percustomer
MWh/Customer Total Amount of Energy at end of periodTotal Number of Customers at end of period
Km. of network percustomer
Km/Customer Total Km. of Network LengthTotal Number of Customers
Operating Cost peremployee
% Total Operating Cost (Excl. power purchases,depreciation & Interest Payment) x 100%
Total Number of employees at end of period
Table 4-5. Definition of Social Impact KPIs
Indicator Unit DefinitionNumber ofhouseholdselectrified annually
% Number of new domestic connections at end of year x 100%Total number of domestic connections for entire system
Number ofapplications for newconnections
Number Total number of applications: Domestic and non-domestic
Number ofapplicationsapproved
Number
Index
Total number of applications approved: Domestic and non-domestic defined by:
Acceptance Index = Number of Applications ApprovedNumber of Applications Submitted
Number of rejectedapplications
Number Total number of rejected applications with reasons7: Domesticand non-domestic
Connectivity Rate % (No. of Connected Households x Avge. Household Popul.)x100Total Population in the country
7 Will enable the regulator know whether there are specific barriers which hinder the connection of potentialcustomers, and which must be addressed.

19
5. Information Reporting RequirementsIn order to effectively monitor the licensees’ operational performance, RURA needs to developthe necessary information requirements, which must be supplied by the utility companies onquarterly basis, and in a specified format. This will make it possible for RURA to properlyassess the financial and operating performance of the utility companies using the KPIs andreduce the degree of information asymmetry between the regulator and the regulatedcompanies. The licensees are required to submit the data and other information in theprescribed format in both electronic form and in a hard copy report.
The recommended data requirements are summarized below in Table 5-1, while details foreach reporting item are annexed in Appendices A to J.
Table 5-1 Summary of Data Reporting by Licensees
Form Description Generation TransmissionSystem Operator
Distribution/Sales
1 Operational and TechnicalData (Quarterly)
√ √ √
2 Import and ExportTransactions (Quarterly)
√
3 Customer Data (Quarterly) √4 Purchases, Sales Billing and
Collection (Quarterly)√ √ √
5. Power Station Output(Quarterly)
√
6. Accounts Receivable(Quarterly)
√ √ √
20
APPENDICES.
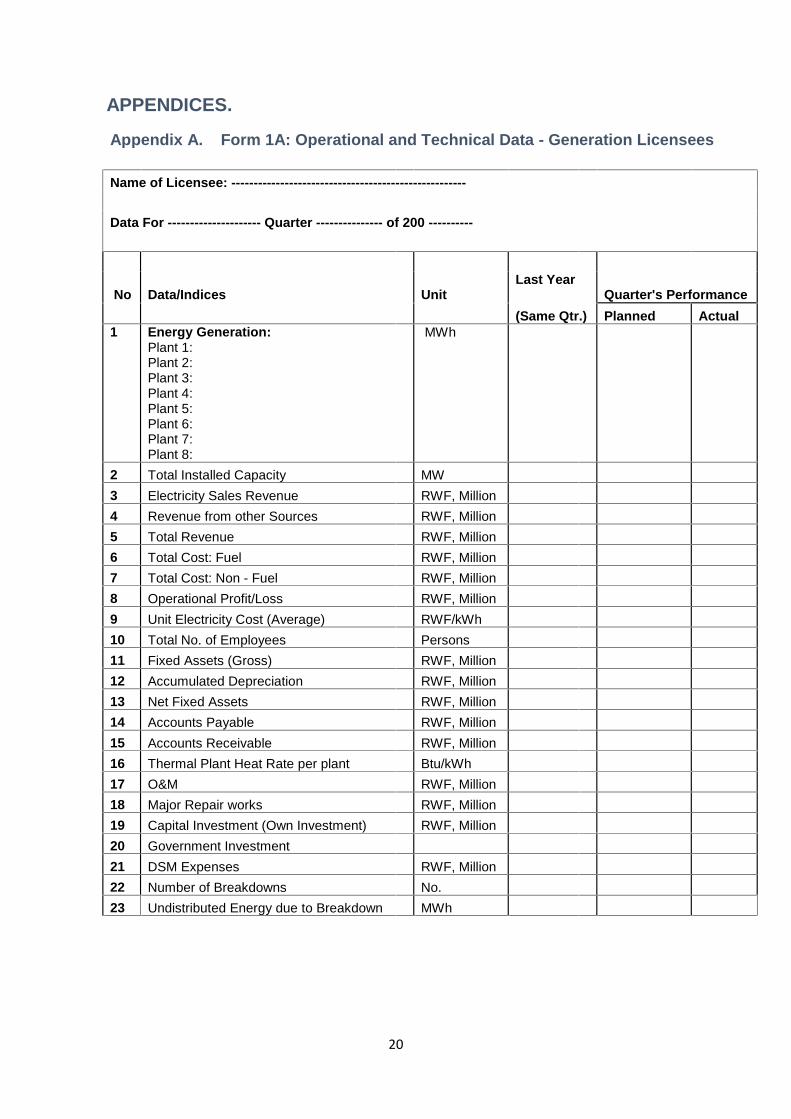
Appendix A. Form 1A: Operational and Technical Data - Generation Licensees
Name of Licensee: -----------------------------------------------------
Data For --------------------- Quarter --------------- of 200 ----------
No Data/Indices UnitLast Year
Quarter's Performance(Same Qtr.) Planned Actual
1 Energy Generation:Plant 1:Plant 2:Plant 3:Plant 4:Plant 5:Plant 6:Plant 7:Plant 8:
MWh
2 Total Installed Capacity MW3 Electricity Sales Revenue RWF, Million4 Revenue from other Sources RWF, Million5 Total Revenue RWF, Million6 Total Cost: Fuel RWF, Million7 Total Cost: Non - Fuel RWF, Million8 Operational Profit/Loss RWF, Million9 Unit Electricity Cost (Average) RWF/kWh10 Total No. of Employees Persons11 Fixed Assets (Gross) RWF, Million12 Accumulated Depreciation RWF, Million13 Net Fixed Assets RWF, Million14 Accounts Payable RWF, Million15 Accounts Receivable RWF, Million16 Thermal Plant Heat Rate per plant Btu/kWh17 O&M RWF, Million18 Major Repair works RWF, Million19 Capital Investment (Own Investment) RWF, Million20 Government Investment21 DSM Expenses RWF, Million22 Number of Breakdowns No.23 Undistributed Energy due to Breakdown MWh

21
Appendix B. Form 1B: Operational and Technical Data - TransmissionLicensees
Name of Licensee: -------------------------------------------------Data for ----------------------------Quarter of 200 ---------------
No. Data/Indices UnitLast Year(Same Qtr.)
CurrentQuarter
CurrentQuarter
Planned Actual
1Electricity Purchased fromDomestic Generators MWh
2
Average price of electricitypurchased from DomesticGenerators
MWh
3 Imported Electricity MWhSystem Peak Capacity MW
4 Price of imported electricity:a.b.c.
UScents/KWh
5 Exported Electricity MWh
6 Price of exported electricityUScents/KWh
7 Own/Substation Use MWh8 Transmission Network Loss MWh9 Transmission Network Loss %10 Electricity Sold MWh
11 O&MRWF,Million
12 Operational Profit/LossRWF,Million
13 Number of employees Persons
14 Gross Fixed AssetsRWF,Million
15 Accumulated DepreciationRWF,Million
16 Net Fixed AssetsRWF,Million
17 Current AssetsRWF,Million
18 Accounts Payable:RWF.Million
a. electricityb. Others
19 Accounts Receivable:RWF,
Milliona. electricityb. Others
20Number of Transmission systembreakdowns Number
21Breakdowns which affectedgeneration Number

22
22Breakdowns and undistributedenergy MWh
23Capital Investment(Own Investment)
RWF,Millions
24Government investment RWF,
Millions
25 System Peak Load MW
26Number of applications for newconnections Number
27Equivalent Load due to applicationsfor new connections MW
28 Number of approved applications No.29 Approved Load MW30 Number of rejected applications No.
Appendix C. Form 1C: Operational and Technical Data: Distribution/SalesLicensee
Name of Licensee:Data for --------------- Quarter of 200 -------------------------------------
No Data / Indices Unit Last Year Current Qtr. Current Qtr.(Same Qtr.) Planned Actual
1 Electricity Purchased: GridConnections (Conventional) MWh
2 Electricity Purchased: Off - Grid MWh
3Average Purchase Price: GridConnection RWF/KWh
4Average Purchase price: Offgrid MWh
5 Technical Losses MWh6 Technical Losses %7 Non-Technical MWh8 Non-Technical Losses %9 Electricity Sold MWh10 Electricity Billed and Sold RWF, Million11 Collection from Sales RWF, Million12 Average Selling Price RWF/kWh13 O&M Cost RWF, Million14 Operational Profit/Loss RWF, Million15 Number of employees Persons16 Gross Fixed Assets RWF, Million17 Accumulated Depreciation RWF, Million18 Net Fixed Assets RWF, Million19 Current Assets RWF, Million20 Working Capital RWF, Million21 Account Payable: RWF, Million
23
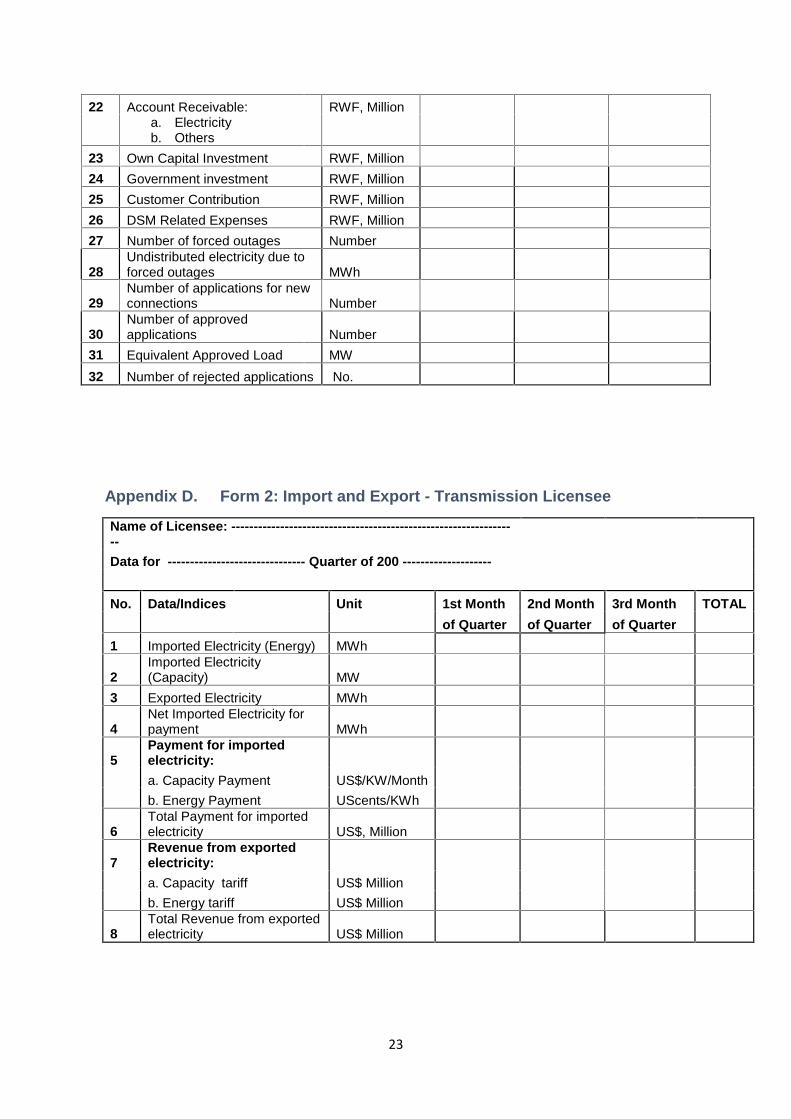
22 Account Receivable: RWF, Milliona. Electricityb. Others
23 Own Capital Investment RWF, Million24 Government investment RWF, Million25 Customer Contribution RWF, Million26 DSM Related Expenses RWF, Million27 Number of forced outages Number
28Undistributed electricity due toforced outages MWh
29Number of applications for newconnections Number
30Number of approvedapplications Number
31 Equivalent Approved Load MW32 Number of rejected applications No.
Appendix D. Form 2: Import and Export - Transmission Licensee
Name of Licensee: -----------------------------------------------------------------Data for ------------------------------- Quarter of 200 --------------------
No. Data/Indices Unit 1st Month 2nd Month 3rd Month TOTALof Quarter of Quarter of Quarter
1 Imported Electricity (Energy) MWh
2Imported Electricity(Capacity) MW
3 Exported Electricity MWh
4Net Imported Electricity forpayment MWh
5Payment for importedelectricity:a. Capacity Payment US$/KW/Monthb. Energy Payment UScents/KWh
6Total Payment for importedelectricity US$, Million
7Revenue from exportedelectricity:a. Capacity tariff US$ Millionb. Energy tariff US$ Million
8Total Revenue from exportedelectricity US$ Million

24
Appendix E. Form 3: Customer Data
Name of Licensee: -----------------------------------------------------Data for -------------- Quarter of 200 --------------------------------
No. Customer Class 1st Qtr. 2nd Qtr. 3rd Qtr. Total1. Domestic/Residential:
2. Non-Residential:
3. Industrial:a. Low Voltageb. Medium Voltagec. High VoltageTotal:
6. Billed Electricity:a. Domestic/Resid. (MWh)b. Non-Residential (MWh)c. Industrial (LV) - MWhd. Industrial (MV) - MWhe. Industrial (HV ) - MWh
6 Electricity Sales Collection:a. Domestic - MWhb. Non-Residential - MWhc. Industrial (LV) - MWhd. Industrial (MV) - MWhe. Industrial (HV ) - MWh

25
Appendix F. Form 4A: Data for Generation Plant Output, Sales, Billing andCollection.
Name of Licensee: -------------------------------------------------------------------------Data for --------------------- Quarter of 200 --------------------------------------------------
No. Data/Indices Unit 1st Month 2nd Month 3rd MonthPlanned Achieved Planned Achieved Planned Achieved
1ElectricityGenerated: MWhPlant 1:Plant 2:Plant 3:Plant 4:Plant 5Plant 6:Plant 7:Plant 8:
2
Average SellingPrice toTransmission RWF/KWh
3 Billing To: RWF,Milliona. TransmissionNetwork
4 Total Revenue: RWF,Milliona. Transmission
Networkb. Others
5RevenueCollection Rate %

26
Appendix G. Form 4B: Data for Transmission Licensee - Purchases, Sales,Billing and Collection
Data for ---------------------------------------- Quarter of 200 ------------------------------
No Data/Indices Unit 1st Month 2nd Month 3rd Month
Planned Achieved Planned Achieved Planned Achieved
1
Total ElectricityPurchased fromGeneration MWh
2 Technical Losses MWh3 Technical Losses %
4Electricity Transmittedand sold MWh
5Average TransmissionPrice RWF/KWh
6 Billed Electricity RWF,Million7 Collection RWF,Million8 Collection Rate %9 Payment to Generators RWF,Million
Appendix H. Form 4C: Data for Distribution Licensee - Purchases, Sales, Billing andCollection.
Data for --------------------- Quarter 0f 200 ------------------------------------
No Data/Indices Unit 1st Month 2nd Month 3rd Month
Planned Achieved Planned Achieved Planned Achieved
1 Electricity Purchased MWh
2 Technical Losses MWh
3 Technical Losses %
4 Commercial Losses MWh
5 Commercial Losses %
6 Distributed Electricity MWh
7 Average Price RWF/kWh
8 Billed Electricity RWF, Million
9 Collection RWF, Million
10 Collection Rate %
11Payment toTransmission RWF, MillionNetworkOperator/Generator

27
Appendix I. Form 5: Data on Accounts Receivable
Name of Licensee: -----------------------------------------------------Account Receivable for --------------------- Quarter of 200 ------
No. Account ReceivableAccountReceivable Beginning Balance Ending Balance
Changein
From:(Last Year)Million, RWF
(Current Period)Million, RWF
(Current Period)Million, RWF
CurrentPeriod.
1Residential/DomesticCustomers
2 Non-Residential
3 Industrial Customers:a. Low Voltageb. Medium Voltagec. High Voltage
4Others (i.e. StreetLighting)
Total (1+2+3+4)

28
Appendix J. Form 6: Data on Wholesale Market Transactions-Energy Balance
Name of Transmission Licensee (System Operator):
Wholesale Market data for ---------------- Quarter of 200 ---------------------------------
No Activity Energy Balance (MWh)1 Net System Generation Output:
Plant 1:Plant 2:Plant 3:Plant 4:Plant 5:Plant 6:Plant 7:Plant 8:
2 Sales to Transmission Licensee /System Operator
3 Transmission Network Losses
4 Sales to Distribution System
5 Distribution System Network Losses


