Performance evaluation of experimental storm water infiltration systems: integrating the building drainage system R. P.A. REIS (1), M. S. O. ILHA (2) 1. [email protected]2. [email protected]1. School of Civil Engineering of University of Goiás, Goiânia, GO, Brazil 2. Department of Architecture and Building Construction, School of Civil Engineering, Architecture and Urban Design, University of Campinas, Campinas, SP, Brazil, Abstract The occupation of urban areas produces significant impacts on the water balance of cities. As a consequence of impervious built-up areas, we can cite the increased surface runoff, which increases the occurrence of urban flooding. Aiming to reduce the impacts of urbanization, compensatory solutions to reduce impacts, such as the practices of Low Impact Development (LID), based on techniques of storm water infiltration have been widely proposed. However, the lack of technical expertise on the performance, operation and limitations of these storm water flow control devices integrated to the building drainage systems generate several questions regarding the form and efficiency of its application. This paper shows the methodology being used to evaluate the operational performance of on-site drainage systems implemented in an experimental area, located in the city of Campinas, state of Sao Paulo, Brazil. The performance evaluation of storm water infiltration systems is being done through the monitoring of geotechnical and hydrological parameters and comparison of the infiltration profiles and the hydrological characteristics of the systems. The infiltration profiles show the performance of the storm water infiltration systems; additionaly, they can help in selecting the best configuration of on-lot drainage systems. We also present the configuration of the rainwater building system to provide the largest volume for the on- lot drainage system and some preliminary values of soil water tension to establish a better understanding of water percolation in the studied systems. Keywords: Low impact development; source drainage; storm water infiltration; on-lot drainage. CIBW062 Symposium 2013 51
Transcript
Performance evaluation of experimental storm water infiltration systems: integrating the building drainage
system
R. P.A. REIS (1), M. S. O. ILHA (2) 1. [email protected] 2. [email protected] 1. School of Civil Engineering of University of Goiás, Goiânia, GO, Brazil 2. Department of Architecture and Building Construction, School of Civil Engineering, Architecture and Urban Design, University of Campinas, Campinas, SP, Brazil, Abstract The occupation of urban areas produces significant impacts on the water balance of cities. As a consequence of impervious built-up areas, we can cite the increased surface runoff, which increases the occurrence of urban flooding. Aiming to reduce the impacts of urbanization, compensatory solutions to reduce impacts, such as the practices of Low Impact Development (LID), based on techniques of storm water infiltration have been widely proposed. However, the lack of technical expertise on the performance, operation and limitations of these storm water flow control devices integrated to the building drainage systems generate several questions regarding the form and efficiency of its application. This paper shows the methodology being used to evaluate the operational performance of on-site drainage systems implemented in an experimental area, located in the city of Campinas, state of Sao Paulo, Brazil. The performance evaluation of storm water infiltration systems is being done through the monitoring of geotechnical and hydrological parameters and comparison of the infiltration profiles and the hydrological characteristics of the systems. The infiltration profiles show the performance of the storm water infiltration systems; additionaly, they can help in selecting the best configuration of on-lot drainage systems. We also present the configuration of the rainwater building system to provide the largest volume for the on-lot drainage system and some preliminary values of soil water tension to establish a better understanding of water percolation in the studied systems. Keywords: Low impact development; source drainage; storm water infiltration; on-lot drainage.
CIBW062 Symposium 2013
51
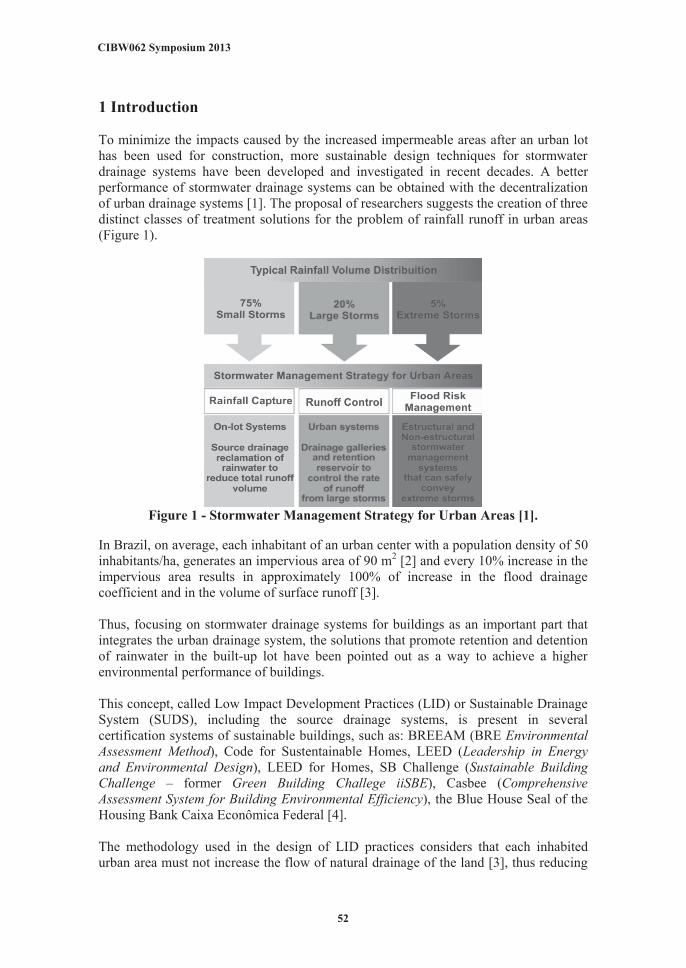
1 Introduction To minimize the impacts caused by the increased impermeable areas after an urban lot has been used for construction, more sustainable design techniques for stormwater drainage systems have been developed and investigated in recent decades. A better performance of stormwater drainage systems can be obtained with the decentralization of urban drainage systems [1]. The proposal of researchers suggests the creation of three distinct classes of treatment solutions for the problem of rainfall runoff in urban areas (Figure 1).
Figure 1 - Stormwater Management Strategy for Urban Areas [1].
In Brazil, on average, each inhabitant of an urban center with a population density of 50 inhabitants/ha, generates an impervious area of 90 m2 [2] and every 10% increase in the impervious area results in approximately 100% of increase in the flood drainage coefficient and in the volume of surface runoff [3]. Thus, focusing on stormwater drainage systems for buildings as an important part that integrates the urban drainage system, the solutions that promote retention and detention of rainwater in the built-up lot have been pointed out as a way to achieve a higher environmental performance of buildings. This concept, called Low Impact Development Practices (LID) or Sustainable Drainage System (SUDS), including the source drainage systems, is present in several certification systems of sustainable buildings, such as: BREEAM (BRE Environmental Assessment Method), Code for Sustentainable Homes, LEED (Leadership in Energy and Environmental Design), LEED for Homes, SB Challenge (Sustainable Building Challenge – former Green Building Challege iiSBE), Casbee (Comprehensive Assessment System for Building Environmental Efficiency), the Blue House Seal of the Housing Bank Caixa Econômica Federal [4]. The methodology used in the design of LID practices considers that each inhabited urban area must not increase the flow of natural drainage of the land [3], thus reducing
CIBW062 Symposium 2013
52
the flow poured in the urban drainage system, promoting its lower request. LID strategies are intended to preserve as much as possible the natural characteristics of the soil and of the original water balance [5], as well as to compensate the impacts caused by the reduction of infiltration rates and of evaporation and evapotranspiration, through drainage systems acting directly at the source of the problem. LID strategies include: bioretention systems, dry-wells, infiltration trenches, permeable pavements, green roofs, rain gardens, among others. Among the various LID practices, the solutions that induce the infiltration of rainwater into the soil have often been the most researched and employed. Despite the large number of researches in course, most of them, during their performance and operation, do not consider their integration with the building rainwater system. Thus, these relatively new tools are not yet fully consolidated; and because they involve a different knowledge about the traditional conception of stormwater drainage systems, there are still many questions in the technical field regarding its design, performance and operation. Therefore, the objective of this study is to present the methodology currently being used to evaluate the operational performance of five types of stormwater infiltration systems during simulated rainfall events, and also the preliminary performance results of one of the strategies investigated, the infiltration well. 2 Methods To evaluate the performance of stormwater infiltration systems integrated to building systems, a prototype was created in an experimental area of the University of Campinas (UNICAMP), located in the city of Campinas, SP – Brazil. The experiment has five distinct types of stormwater infiltration systems, being: 2 dry-wells, 2 rain gardens, 2 infiltration trenches, 1 ecodreno® and 2 modules of pervious pavements. The systems were implemented so as to receive the rainflow captured by an asbestos cement cover of 10 x 5 m, with a slope of 10%. The experiment also had centrifugal pumps with adjustable flow and ultrasonic meters for measuring the water flow in real time. These instruments allowed the simulation and measurement of rain flows of the project with a return period of 2 to 20 years. During the simulations the water is directed through pipes and valves up to a segment of the vertical conductor which is interconnected inside each infiltration system. The stormwater conduits are positioned to allow several assembling configurations that can be found specifically in building systems. Thus, it is possible to evaluate the flow conditions, reflux occurrence, overflow conditions, interference due to the proximity to systems, among others. For the assessment of the hydrological performance of the infiltration systems, all the units assessed are positioned to lead the overflowing water volume and the water volume that passes directly through the pipes, that is, which is not directed towards the infiltration system, to reservoirs with water level sensors. So, in addition to the
CIBW062 Symposium 2013
53
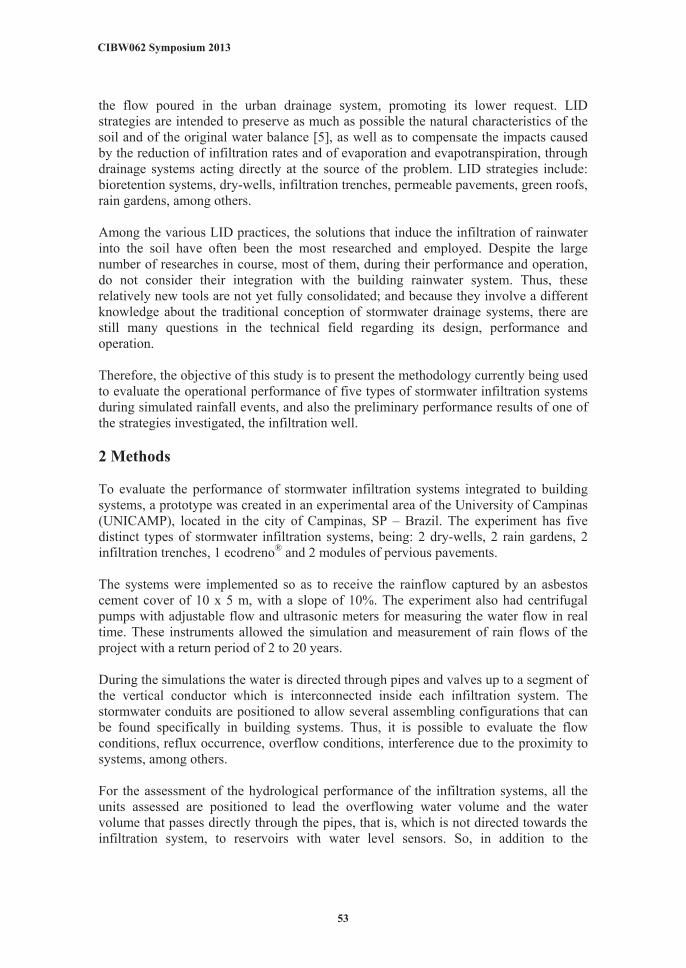
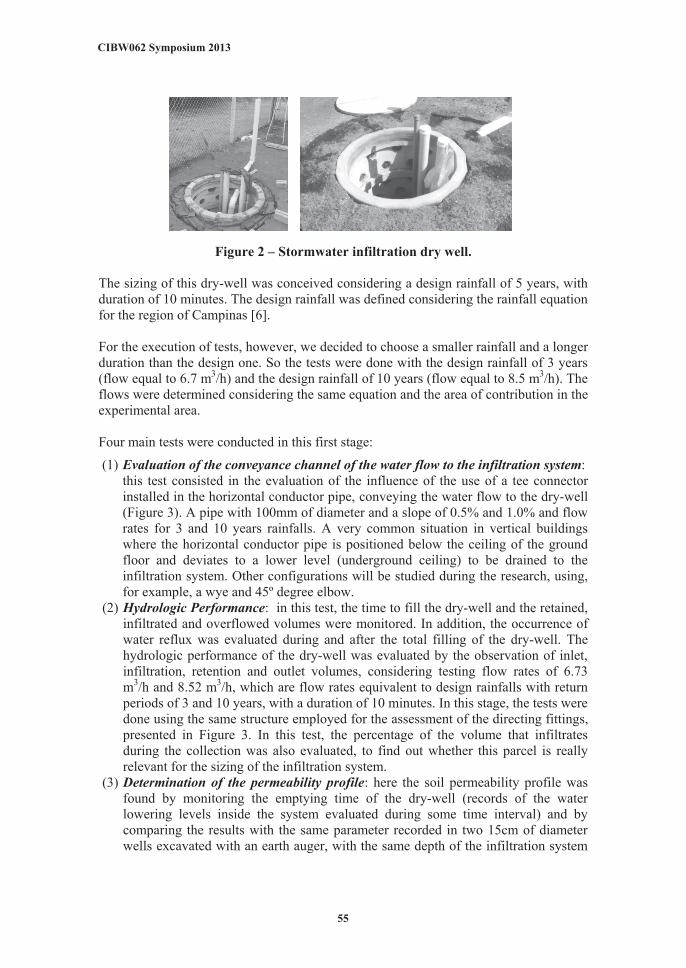
flowmeters it is possible to determine the inflow and overflow rates, and direct passage and infiltration volumes. The water level sensors positioned inside the infiltration systems also allow the determination of the infiltration rate (I) and of the permeability coefficient (k) of the experimental infiltration systems. For this purpose, during the tests, the filling and draining intervals of the systems are monitored. Aiming to simulate the worst functioning condition of the infiltration systems, the experimental units are filled and drained three times in a row, before each test, to increase the moisture and saturation degree of the soil in the region surrounding the infiltration systems. Thus, at the fourth filling procedure, the systems are monitored by water level sensors, soil moisture sensors and tensiometers. The water level sensors allow the determination of the volumes of water inflow and outflow, to estimate the velocity of draining and determine the profile of infiltration rate and soil permeability. The moisture sensors, positioned at the depths of 0.6, 1.0 and 1.5m monitor the soil conditions in the surrounding area of the systems in tracks placed 0.30, 0.90 and 1.20m of distance from the side wall of the infiltration systems. Finally, the tensiometers are positioned at different depths, according to the typology of the system being assessed, and they are also positioned in tracks spaced by 0.30, 0.90 and 1.20m from the side wall of the infiltration system. The tensiometers monitor pore water pressure in the soil, allowing the assess how its movement occurs in the surrounding area. The determination of the curve of the water movement in the soil is important to know how far the infiltrated water reaches and to define safety spacings from base foundations, neighbor lots located at a lower level, the spacing between infiltration systems, and others. Finally, a pluviometric station, implemented in the study area, also monitors the rainfall intensity parameters, relative moisture, temperature, wind velocity and direction, incidence of solar irradiation, evaporation and water retention in plant leaves. These parameters are monitored to observe their influence on the performance and sizing of the stormwater infiltration systems. 2.1 Preliminary tests conducted in the dry-well The system chosen to begin the tests was the stormwater dry-well. This experimental unit is composed of a cylindrical excavation with 1.50m of depth and1.10m of diameter (Figure 2). The side walls of the dry-well are composed by overlapped perforated concrete pipes, externally lined with geotextile fabric and filled with crushed rock aggregates with diameters between 9.5 and 19 mm at the sides, acting as an interface between the fabric and the soil. The bottom is also composed by a 50cm layer of clean granular material covered by a geotextile fabric.
CIBW062 Symposium 2013
54
Figure 2 – Stormwater infiltration dry well. The sizing of this dry-well was conceived considering a design rainfall of 5 years, with duration of 10 minutes. The design rainfall was defined considering the rainfall equation for the region of Campinas [6]. For the execution of tests, however, we decided to choose a smaller rainfall and a longer duration than the design one. So the tests were done with the design rainfall of 3 years (flow equal to 6.7 m3/h) and the design rainfall of 10 years (flow equal to 8.5 m3/h). The flows were determined considering the same equation and the area of contribution in the experimental area. Four main tests were conducted in this first stage:
(1) Evaluation of the conveyance channel of the water flow to the infiltration system: this test consisted in the evaluation of the influence of the use of a tee connector installed in the horizontal conductor pipe, conveying the water flow to the dry-well (Figure 3). A pipe with 100mm of diameter and a slope of 0.5% and 1.0% and flow rates for 3 and 10 years rainfalls. A very common situation in vertical buildings where the horizontal conductor pipe is positioned below the ceiling of the ground floor and deviates to a lower level (underground ceiling) to be drained to the infiltration system. Other configurations will be studied during the research, using, for example, a wye and 45º degree elbow.
(2) Hydrologic Performance: in this test, the time to fill the dry-well and the retained, infiltrated and overflowed volumes were monitored. In addition, the occurrence of water reflux was evaluated during and after the total filling of the dry-well. The hydrologic performance of the dry-well was evaluated by the observation of inlet, infiltration, retention and outlet volumes, considering testing flow rates of 6.73 m3/h and 8.52 m3/h, which are flow rates equivalent to design rainfalls with return periods of 3 and 10 years, with a duration of 10 minutes. In this stage, the tests were done using the same structure employed for the assessment of the directing fittings, presented in Figure 3. In this test, the percentage of the volume that infiltrates during the collection was also evaluated, to find out whether this parcel is really relevant for the sizing of the infiltration system.
(3) Determination of the permeability profile: here the soil permeability profile was found by monitoring the emptying time of the dry-well (records of the water lowering levels inside the system evaluated during some time interval) and by comparing the results with the same parameter recorded in two 15cm of diameter wells excavated with an earth auger, with the same depth of the infiltration system
CIBW062 Symposium 2013
55
evaluated and without wrapping. The results generate profiles of infiltration rates and profiles of the permeability coefficient [7].
(4) Monitoring of the soil water tension: for the evaluation of the water percolation front.
Figure 3 – Scheme of the test for the configuration of channels that convey water to the rainwater dry-well.
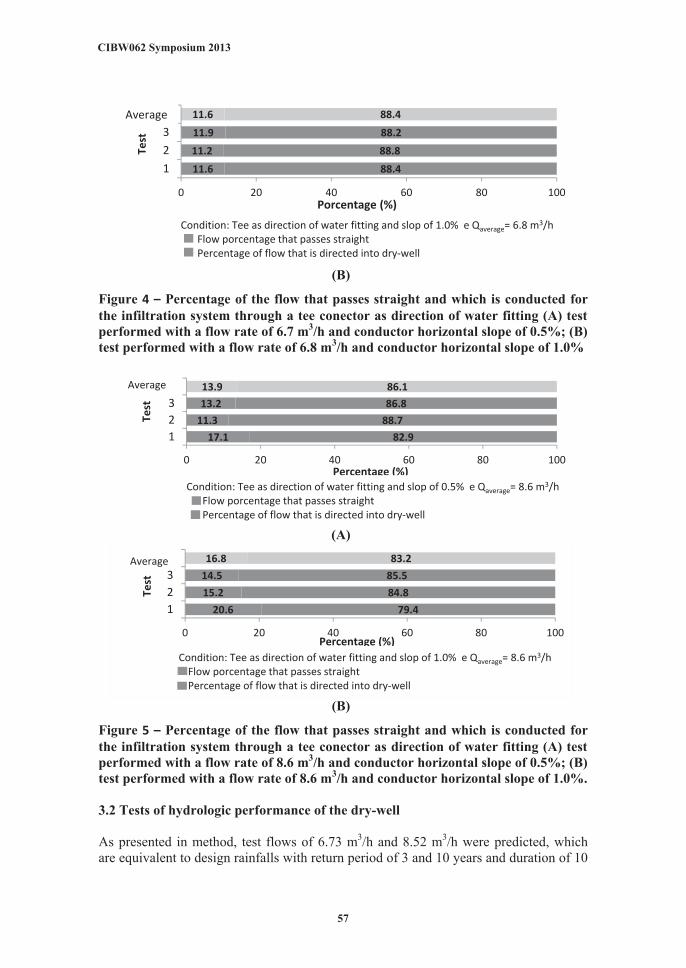
3 Results and Discussion 3.1 Evaluation of the water directing fittings to the infiltration system About 9 to 20% of the volume generated by simulated rainfall has not reached the infiltration system, considering the situations analyzed. So, in this case it is possible to say that the configuration of the directing fittings represents an important factor for the determination of the infiltrated volume (Figures 4 and 5). In view of this, we recommend that the conductors and fittings should always direct the preferential flow to the infiltration system and, from this point on, there should be a conveyance to the overflow channel. On the contrary, the infiltration system may not present the desired project performance, despite being correctly sized.
(A)
8.9
8.9
9.1
8.9
91.1
91.1
90.9
91.1
0 20 40 60 80 100
123
Média:
Porcentage (%)
Test
Condition: Tee as directing fitting and slop of 0,5% e Qaverage= 6,7 m3/hPorcentagem da vazão que passa direto
Average:
Condition: Tee as direction of water fitting and slop of 0,5% e Qaverage= 6,7 m3/hFlow porcentage that passes straightPercentage of flow that is directed into dry-well
CIBW062 Symposium 2013
56
(B)
Figure 4 – Percentage of the flow that passes straight and which is conducted for the infiltration system through a tee conector as direction of water fitting (A) test performed with a flow rate of 6.7 m3/h and conductor horizontal slope of 0.5%; (B) test performed with a flow rate of 6.8 m3/h and conductor horizontal slope of 1.0%
(A)
(B)
Figure 5 – Percentage of the flow that passes straight and which is conducted for the infiltration system through a tee conector as direction of water fitting (A) test performed with a flow rate of 8.6 m3/h and conductor horizontal slope of 0.5%; (B) test performed with a flow rate of 8.6 m3/h and conductor horizontal slope of 1.0%. 3.2 Tests of hydrologic performance of the dry-well As presented in method, test flows of 6.73 m3/h and 8.52 m3/h were predicted, which are equivalent to design rainfalls with return period of 3 and 10 years and duration of 10
11.611.211.911.6
88.488.888.288.4
0 20 40 60 80 100
123
Média
Porcentage (%)
Test
Condition: Tee as directing fitting and slop of 1,0% e Qaverage= 6,8 m3/hPorcentagem da vazão que passa diretoPorcentagem da vazão direcionada para o poço de infiltração
Condition: Tee as direction of water fitting and slop of 1.0% e Qaverage= 6.8 m3/hFlow porcentage that passes straightPercentage of flow that is directed into dry-well
Average
17.111.313.213.9
82.988.786.886.1
0 20 40 60 80 100
123
Média
Percentage (%)
Test
Condition: Tee connector with slope of 0.5% and Qmedium= 8.6 m3/hPorcentagem da vazão que passa diretoPorcentagem da vazão direcionada para o poço de infiltração
Condition: Tee as direction of water fitting and slop of 0.5% e Qaverage= 8.6 m3/hFlow porcentage that passes straightPercentage of flow that is directed into dry-well
Average
20.615.214.516.8
79.484.885.583.2
0 20 40 60 80 100
123
Média
Percentage (%)
Test
Condition: Tee as direction of water fitting and slop of 1.0% e Qaverage= 8.6 m3/hFlow porcentage that passes straightPercentage of flow that is directed into dry-well
Average
CIBW062 Symposium 2013
57
minutes. However, since the dry-well was capable of supporting more than 100% of both the project flows, without becoming entirely full, we decided to maintain the flow rate for another seven minutes, reaching a total of 17 minutes of test. Thus, it was possible to have a better assessment of the overflow conditions.
It is relevant to say that the overflow volume contemplates the volume that passed directly through the direction of water fitting and the real volume of overflow after the total filling of the dry-well. Figure 6 presents the progression of volumes discharged in the system (total inflow volume), overflown, retained and which passed directly during the filling.
(A)
(B)
Figure 6 – Simulation of the hydrologic performance of the rainwater dry-well. (A) Test conducted with a flow rate of 6.73 m3/h; (B) Test conducted with a flow rate of 8.52 m3/h;
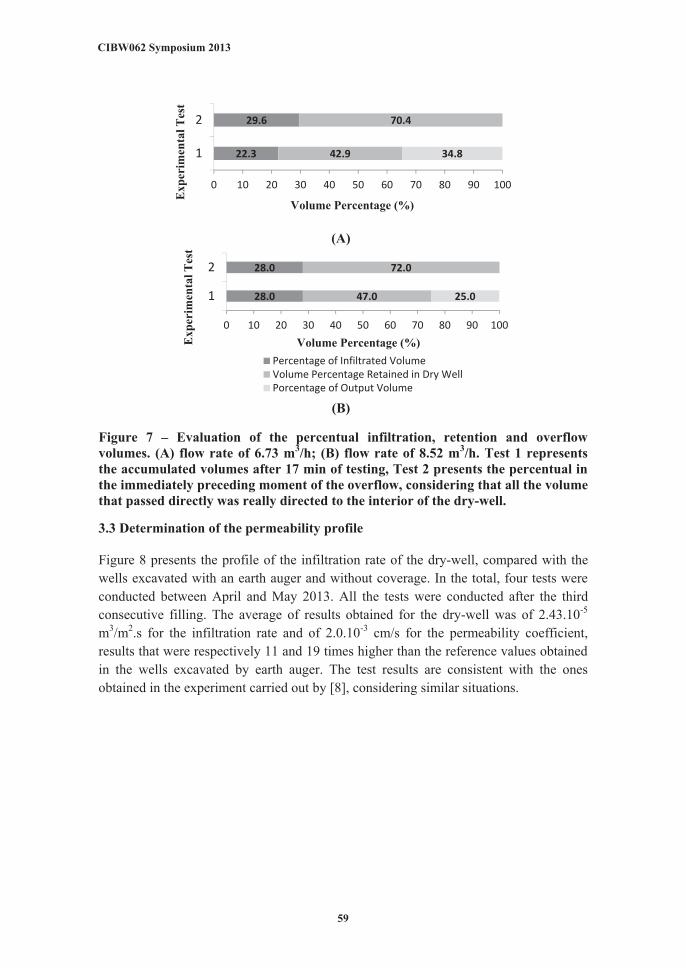
A considerable part of the volume (29.6 and 28.0%) infiltrated during the system filling (Figure 7). Therefore, we may suppose that the parcel of the infiltrated volume is a relevant value for the sizing of the infiltration system, even for a soil with a low infiltration rate like the one studied in this paper.
0
500
1000
1500
2000
2500
0 1 2 3 4 5 6 7 8 9 10 11 12 13 14 15 16 17
Vol
ume
(L)
Time (min)
Total Imput Volume (L)Retained Volume (L)Infiltrated Volume (L)Output Volume (L)
0
500
1000
1500
2000
2500
0 1 2 3 4 5 6 7 8 9 10 11 12 13 14 15 16 17
Vol
ume
(L)
Time (min)
Total Imput Volume (L)Retained Volume (L)Infiltrated Volume (L)Output Volume (L)
CIBW062 Symposium 2013
58
(A)
(B)
Figure 7 – Evaluation of the percentual infiltration, retention and overflow volumes. (A) flow rate of 6.73 m3/h; (B) flow rate of 8.52 m3/h. Test 1 represents the accumulated volumes after 17 min of testing, Test 2 presents the percentual in the immediately preceding moment of the overflow, considering that all the volume that passed directly was really directed to the interior of the dry-well.
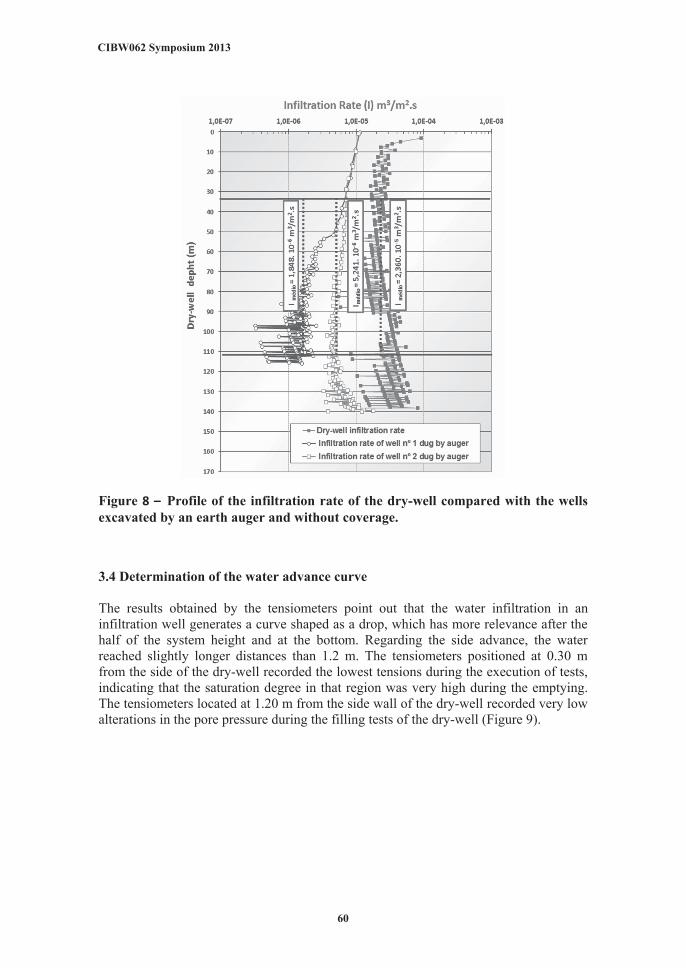
3.3 Determination of the permeability profile Figure 8 presents the profile of the infiltration rate of the dry-well, compared with the wells excavated with an earth auger and without coverage. In the total, four tests were conducted between April and May 2013. All the tests were conducted after the third consecutive filling. The average of results obtained for the dry-well was of 2.43.10-5 m3/m2.s for the infiltration rate and of 2.0.10-3 cm/s for the permeability coefficient, results that were respectively 11 and 19 times higher than the reference values obtained in the wells excavated by earth auger. The test results are consistent with the ones obtained in the experiment carried out by [8], considering similar situations.
22.3
29.6
42.9
70.4
34.8
0 10 20 30 40 50 60 70 80 90 100
1
2
Volume Percentage (%)
Exp
erim
enta
l Tes
t
28.0
28.0
47.0
72.0
25.0
0 10 20 30 40 50 60 70 80 90 100
1
2
Volume Percentage (%)Exp
erim
enta
l Tes
t
Percentage of Infiltrated VolumeVolume Percentage Retained in Dry WellPorcentage of Output Volume
CIBW062 Symposium 2013
59
Figure 8 – Profile of the infiltration rate of the dry-well compared with the wells excavated by an earth auger and without coverage.
3.4 Determination of the water advance curve The results obtained by the tensiometers point out that the water infiltration in an infiltration well generates a curve shaped as a drop, which has more relevance after the half of the system height and at the bottom. Regarding the side advance, the water reached slightly longer distances than 1.2 m. The tensiometers positioned at 0.30 m from the side of the dry-well recorded the lowest tensions during the execution of tests, indicating that the saturation degree in that region was very high during the emptying. The tensiometers located at 1.20 m from the side wall of the dry-well recorded very low alterations in the pore pressure during the filling tests of the dry-well (Figure 9).
CIBW062 Symposium 2013
60
Legenda: (A) Tensiometers located at 0.30 m from the side wall of the dry-well; (B) Tensiometers located at 0.90 m from the side wall of the dry-well; (C) Tensiometers located at 1.20 m from the side wall of the dry-well;
The number after the abbreviation "Tens.." indicates the installation depth of the tensiometer.
Figure 9 – Soil water tension generated at distinct depths and distances in the surrounding area of the dry-well
6 Conclusion Besides the adequate sizing of the dry-well, the configuration of the fittings that will direct this water to the system is important, since between 9 and 20% of the volume generated by the rainfall was not directed to the infiltration system in the situations analyzed. It is noteworthy that the system evaluated presented a higher performance than it was expected, being capable to retain water for a period between 40 and 50% longer than the one predicted in the project. This means that not only the volume generated by the rainfall that obstructs the contribution area is relevant in the sizing and that the infiltration parcel must also be considered. The profiles of infiltration generated indicate that the structure of the dry-well improved the performance of the system in relation to the direct infiltration in a well without coverage. Finally, the infiltrated water reached a slightly longer distance than the diameter of the infiltration unit, which is, for this condition, the recommended spacing for any other building systems that may be influenced by change in the soil moisture. The large number of uncertainties in the technical field regarding the functioning and performance of the rainwater infiltration systems integrated to the building systems, in many cases, prevent the Low Impact Development Practices to be more completely approached. The development of this research, based on the observation of the functioning in the field of the stormwater infiltration systems can help in the establishment of a numerical model and in the consolidation of more accurate criteria, which may be used for a better conception and implementation of these technologies in more sustainable built-up areas.
CIBW062 Symposium 2013
61
Acknowledgments Authors thanks CAPES – Coordination for the Improvement of Higher Education Personnel, FAPESP – Foundation for Research Support of the State of São Paulo and CNPq - National Council for Scientific and Technological Development for supporting this study.
7 References
1. Stephens KA, Maclean L - Re-inventing urban hydrology in british columbia: runoff volume management for watershed protection (2003). Available at: <http://www.epa.gov/owow/NPS/natlstormwater03/38Stephens.pdf>. Accessed on 2011, June 20.
2. Menezes, F. C. M e Tucci, C. E. M. Alteração na relação entre densidade habitacional x área impermeável: Porto Alegre – RS. Rega – revista Gestão de Água da América Latina. V. 9, N. 1, p.19-55, 2012.
3. Tucci C.E.M., Gestão de Águas Pluviais Urbanas. Programa de Modernização do Setor Saneamento. Secretaria Nacional de Saneamento Ambiental. Ministério das Cidades. V. 4, 194p. Brasília – DF, 2005.
4. Reis R.P.A., Ilha M.S.O., Teixeira P.C. Proposta de indicadores de sustentabilidade para avaliação de sistemas prediais hidráulico-sanitários. In: XII Simpósio nacional de Sistemas Prediais, 2011, Passo Fundo, RS. 2011.
5. Dietz, M.E. Low Impact Development Practices: A Review of Current Research and Recommendations for Future Directions. Water Air Soil Pollut. Springer Science. 351-363p. 2007.
6. Zuffo, A.C.; Leme,P.E. GRADEX e Santa Barbara: Método Híbrido para Cálculo de Vazão de Projeto para Macro Drenagem Urbana. In: XVI Simpósio Brasileiro de Recursos Hídricos, 2005, João Pessoa - Paraíba. 2005.
7. ABGE - Associação Brasileira de Geologia de Engenharia. Ensaios de Permeabilidade em Solos : Orientações para sua Execução no Campo: procedimentos – Boletim nº 4. São Paulo, 34p. 1996.
8. Reis R.P.A., Oliveira L.H., Sales M.M. Sistemas de drenagem na fonte por poços de infiltração de águas pluviais (On-lot drainage systems with rain water infiltration wells). Revista Ambiente Construído - Associação Nacional de Tecnologia do Ambiente Construído, V. 8, N. 2, p. 99-117, 2008.
CIBW062 Symposium 2013
62
8 Presentation of Author(s)
Ricardo Prado Abreu Reis is professor at the School of Civil Engineering of University of Goiás and PhD Student, Department of Architecture and Building Construction, School of Civil Engineering, Architecture and Urban Design, University of Campinas, Campinas, SP, Brazil.
Dr. Marina Sangoi de Oliveira Ilha is professor at the Department of Architecture and Building Construction, School of Civil Engineering, Architecture and Urban Design, University of Campinas, Campinas, SP, Brazil. She is the vice-dean of the School of Civil Engineering, Architecture and Urban Design since 2010 and the head of the Building Services Research Group.