15
SYMBIOSIS INTERNATIONAL UNIVERSITY Performance Evaluation of Indian Mutual Funds Ph.D Student: Shantanu Gokhale Guide: Dr. Madhvi Sethi April 2011 Ph.D Proposal

SYMBIOSIS INTERNATIONAL UNIVERSITY
Performance Evaluation of Indian Mutual Funds Ph.D Student: Shantanu Gokhale
Guide: Dr. Madhvi Sethi
April 2011
Ph.D Proposal
1
TABLE OF CONTENTS
Abstract 02
1. Introduction
1.1 Advantages of investing in mutual Funds 03
1.2 Sharing of Profits 03
1.3 History of Mutual Funds in India 03
1.4 Outlook for the Mutual Fund Industry 05
2. Significance of Performance Evaluation 06
2.1 The Performance Measurement Process 07
3. Literature Review
3.1 Peer Group Comparison 07
3.2 Risk Adjusted Performance Evaluation 08
3.3 Portfolio Evaluation based on Composition of Portfolio 08
3.4 Performance Evaluation in Indian Context 09
4. Research Objectives 09
5. Methodology
5.1 Introduction to Return Based Style Analysis 11
5.2 Graphical Representation of Proposed Event Study 12
5.3 Data 12
6. Possible Problems 13
7. Timeline for the Study 13
8. Benefits of the Study 13
9. References 14

2
ABSTRACT
Investments in Mutual Funds are expected to grow at the rate of 15%-25% in India in the
coming years. Keeping that in the background it is important to know and analyze if the
investments have performed below, above or as per expectations. Thus good investment
performance tools and techniques are extremely important.
Investment Performance Measurement methods quantify how much return the investment has
earned, how was it earned and what were the risks taken. Typically performance evaluation
of mutual funds is conducted using Sharpe’s Measure, Treynor’s Measure and Jensen’s
Measure. Each of these measures has limitations in terms of classification, composition and
survivorship bias. This results in inconsistent results. It is observed that the same manager
who appears successful in one peer group provider’s classes is unsuccessful against a
comparable peer group supplied by another provider.
None of the traditional methods are utilizing information related to composition of the
evaluated portfolio. Studies have indicated that 97% of fund returns can be explained by
asset allocation alone. In this context Returns Based Style Analysis (RBSA) was
introduced by William Sharpe. RBSA has shown that most managers are best benchmarked
as blends of styles.
RBSA is a statistical technique that identifies what combination of long positions in passive
indexes would have most closely replicated the actual performance of a fund over a specified
time period. The passive indexes selected typically represent distinct investment style within
particular asset classes. Sharpe considered 12 asset class (style) portfolios. His idea was to
regress fund returns on indices representing a range of asset classes. The regression
coefficient on each index would then measure the implicit allocation to that “style” (weight)
of the asset class in the portfolio. This will be the passive portfolio and its return would be
compared with the actual return from a portfolio.
If the difference in returns between the portfolio constructed out of passive indices and the
actual return from the active portfolio is found to be statistically significant, then it indicates
superior performance of the portfolio.
In this study performance of Indian mutual funds of various fund categories will be analyzed
using RBSA. The study will also analyze if there is any significant style difference
between mutual funds offered by Public Sector Units and Private Sector Mutual Funds
for 3 landmarks events.
Data for the study will be secondary and is available on various databases like Capital Line
and CMIE. Software tools like Excel and SPSS will be used for analysis.
Study is expected to indicate what types of funds have provided excess returns over their
style benchmarks and shall help investors make prudent choice while investing.

3
PERFORMANCE EVALUATION OF INDIAN MUTUAL FUNDS
In recent years, an increasing number of investors in India are investing in mutual funds.
A large amount of investor money is at stake. Thus it is very important to evaluate the
performance of mutual funds and analyze the use of new performance evaluation tools
for this purpose.
1. INTRODUCTION
Mutual funds are investment companies that collect funds from individual investors and
invest those funds in a potentially wide range of securities or other assets. Pooling of
assets is the key idea behind forming these investment companies. Each investor has a
claim to the portfolio established by the investment company in proportion to the amount
invested. These companies thus provide a mechanism for small investors to pool their
funds to get benefits of large scale investing.
1.1 Advantages of investing in mutual Funds
There are several advantages associated with this formal set up related to pooling of
funds. Some of them are as follows:
Diversification and divisibility:
By pooling their money, investment companies enable investors to hold fractional shares
of many different securities. They can act as large investors even if any individual
shareholder cannot.
Professional Management:
Investment companies employ security analysts and portfolio managers in their attempt
to achieve superior results for their investors.
Lower Transaction costs:
As trading is done in large blocks, investment companies can achieve substantial savings
on brokerage fees and commissions.
1.2 Sharing of Profits
Just as investment companies pool assets of individual investors, they also need to divide
claims to those assets among those investors. Investment companies issue units to the
investors in accordance with the amount of money invested by the investor. Investors of
mutual funds are known as unit holders. The value of each unit is called the Net Asset
Value per unit (NAV).
Net Asset Value/unit (NAV) = Assets – Liabilities
Number of units outstanding

4
1.3 History of Mutual Funds in India
The mutual fund industry in India started in 1963 with the formation of Unit Trust of
India (UTI), under the initiative of Government of India (GOI) and Reserve Bank of
India (RBI). The history of mutual funds in India can be broadly divided into four distinct
phases
Phase I – 1964-87
UTI was established on 1963 by an Act of Parliament. It was set up by the Reserve Bank
of India and functioned under the regulatory and administrative control of the Reserve
Bank of India. In 1978 UTI was de-linked from the RBI and the Industrial Development
Bank of India (IDBI) took over the regulatory and administrative control from RBI. The
first scheme launched by UTI was Unit Scheme 1964.
At the end of 1988 UTI had Rs.6,700 crores of assets under management.
Phase II – 1987-1993 (Entry of Public Sector Funds)
Since 1987 non- UTI, public sector mutual funds set up by public sector banks and Life
Insurance Corporation of India (LIC) and General Insurance Corporation of India (GIC)
came into existence. SBI Mutual Fund was the first non- UTI Mutual Fund established in
June 1987 followed by Canbank Mutual Fund (Dec 87), Punjab National Bank Mutual
Fund (Aug 89), Indian Bank Mutual Fund (Nov 89), Bank of India (Jun 90), Bank of
Baroda Mutual Fund (Oct 92). LIC established its mutual fund in June 1989 while GIC
set up its mutual fund in December 1990.
By the end of 1993, the mutual fund industry had assets under management of Rs.47,004
crores.
Phase III – 1993-2003 (Entry of Private Sector Funds)
In 1993 the Indian mutual fund industry went through a major change with the entry of
private sector mutual funds. This gave the Indian investors a wider choice of funds. ies.
The first Mutual Fund Regulations were introduced in 1993. All mutual funds except
UTI were to be registered and governed. Kothari Pioneer (now merged with Franklin
Templeton) was the first private sector mutual fund registered in July 1993.
The 1993 SEBI (Mutual Fund) Regulations were substituted by a more comprehensive
and revised Mutual Fund Regulations in 1996. The industry now functions under the
SEBI (Mutual Fund) Regulations 1996.
The number of mutual fund houses went on increasing, with many foreign mutual funds
setting up funds in India. The industry witnessed several mergers and acquisitions.
At the end of January 2003, there were 33 mutual funds with total assets of Rs. 1,21,805
crores. The Unit Trust of India with Rs.44,541crores of assets under management was
way ahead of other mutual funds.
Phase IV – since February 2003
In February 2003, the Unit Trust of India Act, 1963 was repealed. UTI was bifurcated
into two separate entities. One is the Specified Undertaking of the Unit Trust of India
5
with assets under management of Rs.29,835 crores as at the end of January 2003,
representing broadly, the assets of US 64 scheme, assured return and certain other
schemes. The Specified Undertaking of Unit Trust of India, functioning under an
administrator and under the rules framed by Government of India does not come under
the purview of the Mutual Fund Regulations.
The second is the UTI Mutual Fund, sponsored by SBI, PNB, BOB and LIC. It is
registered with SEBI and functions under the Mutual Fund Regulations. With the
bifurcation of the UTI and with the setting up of a UTI Mutual Fund set up as per SEBI
Mutual Fund Regulations, and with mergers taking place among different private sector
funds, the mutual fund industry has entered its current phase of consolidation and growth.
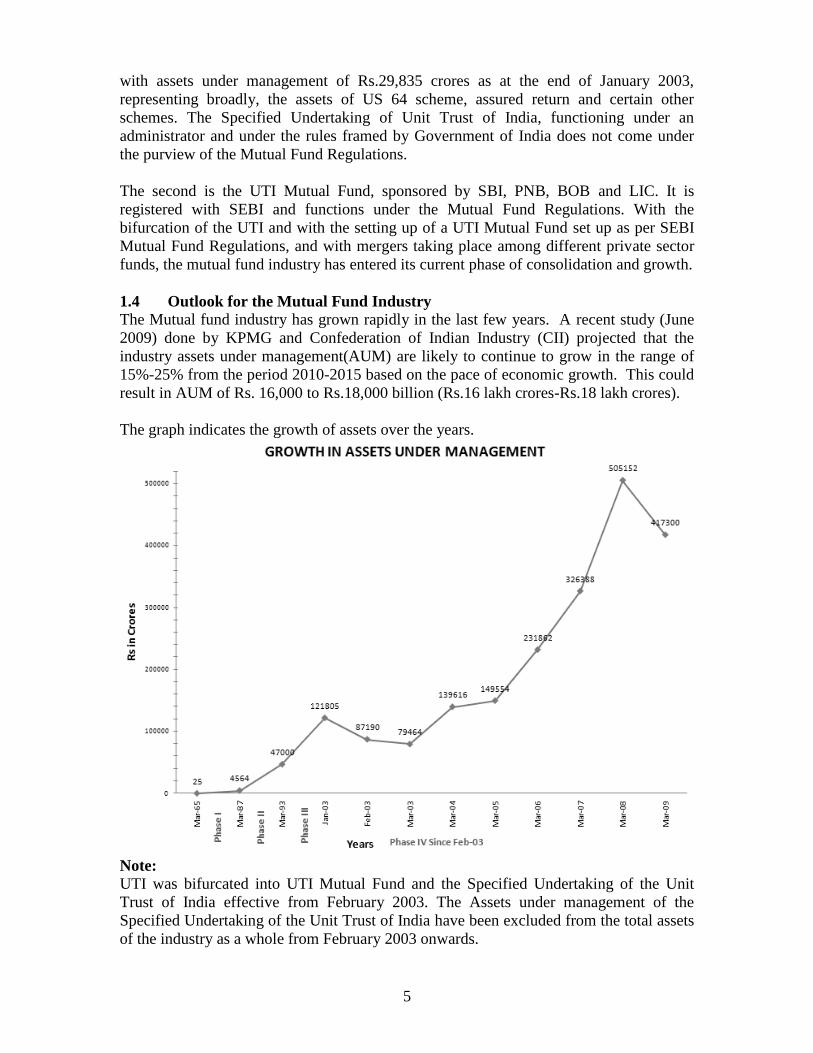
1.4 Outlook for the Mutual Fund Industry
The Mutual fund industry has grown rapidly in the last few years. A recent study (June
2009) done by KPMG and Confederation of Indian Industry (CII) projected that the
industry assets under management(AUM) are likely to continue to grow in the range of
15%-25% from the period 2010-2015 based on the pace of economic growth. This could
result in AUM of Rs. 16,000 to Rs.18,000 billion (Rs.16 lakh crores-Rs.18 lakh crores).
The graph indicates the growth of assets over the years.
Note:
UTI was bifurcated into UTI Mutual Fund and the Specified Undertaking of the Unit
Trust of India effective from February 2003. The Assets under management of the
Specified Undertaking of the Unit Trust of India have been excluded from the total assets
of the industry as a whole from February 2003 onwards.

6
2.0 SIGNIFICANCE OF PERFORMANCE EVALUATION
Investment Performance Measurement techniques quantify how much return was
earned, how it was earned and what risks were taken along the way. Performance
evaluation is a backward looking exercise (ex-post).
It is expected that the results obtained from performance measurement would be useful
for future decision making (ex-ante). Performance evaluation of Mutual Funds is of
interest to both investment (fund) managers and investors.
Investment managers measure their performance to help evaluate and control their
investment process. It also helps them in marketing the services offered by them and in
communicating with their clients effectively.
Investors use information derived from performance analysis to monitor their
investments. It helps in checking if the investment is on its way to achieve the goals set.
On the basis of such evaluation, goals can be reset and instructions can be provided for
asset allocation.
The large number of fund categories and the diversity in investment objectives within
these categories makes it difficult to gauge how the returns of different funds interact
with each other. Thus a conceptual framework is required to understand what a fund
manager is doing. Sharpe [1992] provides a framework to tackle this problem. Style
Analysis can provide information not available through commonly used peer group
comparison.
2.1 The Performance Measurement Process
Performance measurement is concerned with describing the results produced by the
investment in this case the portfolio. The process to measure the portfolio performance
can be described as follows:
Calculation of portfolio return
Comparison of these results to results of peers, market indices and other
benchmarks.
Calculation of risk taken to achieve the returns- important to measure both
absolute risk and the benchmark relative risk
Using statistical techniques to relate returns earned to risks taken
Identify sources of return and then measure the contribution to total return made
by these sources.
Compare the relative contribution made by the securities to total return and
benchmark return. Based on this comparison with the benchmark (passive market
return), one can decide if value was added by the portfolio manager in terms of
asset allocation and security selection decisions.
Present the results related to risk and return as per regulatory requirements and
industry norms.

7
3.0 LITERATURE REVIEW -BACKGROUND OF VARIOUS
PERFORMANCE EVALUATION TECHNIQUES
As discussed previously calculation of average portfolio returns is not good enough.
Returns need to be adjusted for risk before they can be compared.
3.1 Peer Group Comparison
The simplest way to adjust returns for risk would be to compare portfolio returns with
returns of other mutual funds with similar risk characteristics. The various classes (peer
groups) of funds that can be created could be balanced fund, growth fund, money market
funds and so on. The average returns of each fund are ordered within each class and each
portfolio receives a percentile ranking depending on relative performance within the
group. Such relative ranking could be displayed in a bar chart.
However such peer group comparison can be misleading. They have several biases
which cannot be corrected. Bleiberg [1986], Bailey[1992] and Ankrim[1998] have
identified several problems with peer groups. They discuss several biases that undermine
measurement based on peer groups. Some of these biases are Classification,
Composition, and Survivorship.
Classification bias results from classifying every fund in a pre specified peer group like
growth or balanced. However it is a well known fact that most mutual fund managers use
a blend of styles. It is quite likely that mutual funds could be incorrectly classified and
thus will not fit the actual style of the manager.
Composition bias comes from either concentrations of certain fund types in databases and
from small sample sizes. This can lead to either raising or lowering the bar for evaluation
purpose.
Survivorship bias results from the fact that certain funds due to bad performance get
terminated or merged with other funds and thus are no longer in the database. This leads
to skewing the results of performance studies to the higher side. Elton, Gruber, & Blake
[1996] showed that survivorship bias is larger in the small-fund sector than in large
mutual funds (presumably because small funds have a high probability of folding). They
estimate the size of the bias across the U.S. mutual fund industry as 0.9% per annum.
Survivorship bias as defined and measured by them is as follows: "Bias is defined as
average α for surviving funds minus average α for all funds" (Where α is the risk-adjusted
return over the S&P 500. This is the standard measure of mutual fund out-performance).
Numerous articles to this effect have been published over the years. Eley [2004]
observed that the same manager who appears successful in peer group provider’s classes
is unsuccessful against a comparable peer group supplied by another provider.
3.2 Risk Adjusted Performance Evaluation
Primarily because of the classification bias associated with peer group comparison, the
need for creating fund classes on amore quantitative basis was felt. Methods of risk
adjusted performance evaluation using mean-variance criteria were introduced
simultaneously with the capital asset pricing model (CAPM).

8
William Sharpe [1964] suggested the Sharpe’s Measure for measuring portfolio
performance, which is basically a reward to risk ratio. Reward is equal to the excess
return over and above the risk free rate and risk is the standard deviation of return.
Miller & Gehr [1978] pointed out that Sharpe’s ratio does have a sample size bias. They
reported a 9.6% upward bias for a sample size of n=10. Another shortcoming associated
with Sharpes ratio is that its numeric value is not easy to interpret. The difference in the
values of Sharpe’ ratios of 2 funds cannot be explained in an economically meaningful
way. Lehmann & Timmerman [2007] opined that it is simply not the case that managed
portfolio A is better than B if its Sharpe ratio is higher, because the distance to the
efficient frontier depends on portfolio alphas and residual variances and covariances, not
on the mean and variance of overall portfolio returns.
Treynor[1966] proposed the Treynor’s Measure, which is basically a reward to risk ratio.
Reward is equal to the excess return over and above the risk free rate and risk is the Beta
measure, which is a relative measure of risk.
The most widely used measure is the Jensen Measure proposed by Michael Jensen
[1968]. It is the intercept from a regression of the excess return of the managed portfolio
on the excess return of a benchmark portfolio. However, academics have pointed out
certain shortcomings. Roll [1978] showed the measure’s sensitivity to the choice of
benchmark portfolio. Jensen [1972] has shown that Jensen Measure may provide a
biased evaluation for market timers.
Ronald Surz [2006] pointed out the deficiencies of popular approaches which use peer
groups and indexes. He noted that each peer group has its own set of idiosyncratic
distortions.
3.3 Portfolio Evaluation based on Composition of Portfolio
None of the traditional methods are utilizing information related to composition of the
evaluated portfolio. Two methods have been proposed in this regard. One method is
referred to as Holding Based Style Analysis (HBSA) in which style of a fund is derived
by an actual examination of underlying data. This is a good method in terms of accuracy;
however the biggest drawbacks are timeliness and cost of data. Also availability of data
can be a problem. Grinblatt & Titman [1993] proposed the Performance Change
Measure which is calculated on the basis of changes in portfolio weights from period to
period. Although the method was found to eliminate biases which the previous methods
had, however it is known that data on holdings is available only on quarterly basis, and
therefore within the period transactions (changes) are ignored. This adds noise to the true
performance.
In this context Returns Based Style Analysis (RBSA) was introduced by William
Sharpe is found to be a useful tool. William Sharpe introduced this major innovation
1988, where he first recognized the role played by asset allocation. He pointed out that
95% of the variance in returns of a typical pension fund can be attributed to its asset mix.
This was based on a study by Brinson et al [1986] on the determinants of portfolio
performance. Sharpe 1992 again showed how style analysis can be employed to analyze
the performance of open end mutual funds during 1985-1989.

9
Lucas et al [1996] showed using Exposure distribution area graphs (EDAG) how
managers have to chart the estimated style over time. He pointed out the importance of
selecting appropriate passive indices (benchmarks) and stressed on having benchmarks
that are comprehensive and yet mutually exclusive. He stresses on the fact that RBSA is
an estimate. It is not directly tied to the actual holdings of a mutual fund.
Chen, Roll & Ross [1986] have conducted study related to macro economic factors that
affect portfolio performance. They considered various factors like industrial production,
Crude Oil Prices, Inflation, Term Structure and market indices in a multi factor model.
They found several variables to be significant in explaining expected stock returns
notably industrial production and changes in risk premium of assets.
3.4 Performance Evaluation in Indian Context
In the Indian scenario Guha Deb, Banerjee and Chakrabarti [2007] have conducted a
study on Indian mutual fund data for the period 2000-2005 on a sample 96 mutual funds.
Their study showed that only 18 funds exhibited positive excess returns over their style
benchmarks although none of them are statistically significant at 5% significance level.
Bhatacharjee & Roy have conducted studies using Performance Change Measure (PCM)
for a sample data of 2001-2004 for 50 funds. They found out that on average Indian
mutual funds do provide excess returns but only when unit of time period is longer.
Jayadev. M, [1996] have conducted studies on a few funds which indicated that the
growth funds studied did not outperform the benchmark market. Conventional measures
were used for this study. However the sample size chosen was too small.
Madhumathi R & Panwar, conducted a study on a sample of private sector and public
sector funds. It concluded that in terms of mean returns percentage no significant
difference was found between private sector and public sector funds. However, in terms
of standard deviation and average coefficient of variation there is a significant difference.
Data used was 2002-2005.
Kumar & Dash have done a study on the effect of macroeconomic variables on Indian
Mutual funds. Granger’s Causality Test was used for the analysis. They considered
macro economic factors like Crude Oil, MIBOR, inflation and value of the rupee via vis
the Dollar and the Euro. However, they concluded the factors were not sensitive enough
to draw a conclusion.
4. RESEARCH OBJECTIVES
A study by Brinson [1986] conducted on 82 mutual funds in the US indicated that 91.5%
variation in returns can be explained by the funds asset allocation to bills, bonds and
stocks. Later studies that considered asset allocation across a broader range of assets
classes found that as much as 97% of fund returns can be explained by asset allocation
alone. Thus it is very clear how important asset allocation is in determining the funds
total value.
RBSA proposed by William Sharpe is a statistical technique that identifies the
combination of long positions in passive indices that would have most closely replicated
the actual performance of a fund over a specified time period. The passive indexes

10
selected typically represent distinct investment style within particular asset classes.
Sharpe considered 12 asset class (style) portfolios.
Relative performance of equity mutual funds in India will be compared to their style
benchmarks. The idea is to figure out if the return is attributable to style or to
superior stock selection skills of the portfolio managers. This study will have the
following objectives:
To evaluate performance of mutual funds using style analysis to determine if any
funds have provided statistically significant excess return over their style
benchmarks.
To evaluate if there are any statistically significant relations between the types of
funds (category) and excess returns.
To evaluate fund performance sponsored by Public Sector entities and Private
Sector entities for any significant style differences.
To conduct an event study for 3 landmark events in the Indian mutual fund
industry to analyze for style differences before and after each event.
To evaluate fund performance for event wise style differences between funds
sponsored by public sector and private sector.
To evaluate for persistence in mutual fund performance over the study period.
To evaluate and analyze significant macroeconomic factors contributing to
portfolio returns.
5. METHODOLOGY
In this study, style analysis will be conducted on Indian equity mutual funds using
Sharpe’s RBSA method
5.1 Introduction to Return Based Style Analysis
In RBSA fund returns are regressed on indices representing a range of asset classes. The
regression coefficient on each index would then measure the implicit allocation to that
“style”. As funds are not allowed short selling, the regression coefficients are
constrained to be either zero or positive and to sum to 100%, so as to represent complete
asset allocation.
5.1.1 Model for Return Based Style Analysis The model to be used for RBSA is:
Rit = ai0 + bi1F1 + bi2F2+….+biNFn+ei
= ai0 + Σ biNFn + ei
for t = 1,2,……t
where Rit: return provided by the manager i at time t
F1, F2,… Fn: returns on asset classes 1, 2…n
bi1, bi2,.. bin: sensitivities of manager i’s returns to the return of asset classes 1,2,…n
and ei: manager i’s non factor related return

11
The goal is to find a relatively small number of asset classes and a way to determine bi1,
bi2, ….. biN that will provide values of ei that are relatively small for individual managers
and unrelated across managers.
This model can be considered as follows: manager of portfolio I is restricted to investing
a fraction bi,N of the fund given to him only (completely) in N asset classes. However
the manager will have the flexibility to pick securities from within each asset class. This
is a situation where as a retail investor you have a choice to give your funds to an active
manager or hold a passive portfolio with fractions bi,N invested in the N asset class
indices. The returns generated on the 2 strategies will be different.
The passive portfolio style will generate a return equal to Σ biNFn at time t, which can be
referred to as the ‘style benchmark return’. The active manager will generate a return
equal to Rit. The difference between the two will be captured by the intercept ai0 and the
error term ei together, typically referred to as α.
5.1.2 Statistical tools to be used for analysis
This difference α will be a result of different weights assigned to securities within an
asset class as compared to weights assigned in the corresponding asset class index. This
could be considered to be a representative of the portfolio manager’s superior market
timing and stock picking ability. The value of α has to be checked for statistical
significance by calculating the‘t’ statistic.
The R2 value of the regression would measure the percentage of return variability
attributed to the effects of security selection. The proportion of return variability (1- R2)
not explained by asset allocation can be attributed to security selection within asset
classes or market timing.
5.1.3 Asset Classes to be used for the Model
The asset classes chosen should have the following characteristics as far as possible:
1. Mutually exclusive (classes should not overlap with each other)
2. Exhaustive (all securities should fit in the set of asset classes)
3. Replicable or Invest-able (it should be possible to replicate the return of each
class at a relatively low cost)
4. Market capitalized
Some of the asset classes that may be used are as follows:
• GOI T-Bill Index
• GOI Bond Index 1-3 years maturity
• GOI Bond Index 3-8 years maturity
• GOI Bond Index >8 years maturity
• Nifty 500 index Growth stocks
• Nifty 500 index Value stocks
• Nifty small cap index
• S &P 500 index
• Nikkei 225 Index
• FTSE Eurotop 100

12
5.2 Graphical Representation of the proposed event study
A schematic diagram of the proposed study is shown below:
5.3 Data
The data to be used for the study will be secondary data. The study will cover the period
from 1993 to 2011. However, data collected will be from 1990 onwards. This will be
done so that a rolling period analysis can be done. In a rolling period analysis, statistics
for a fixed window of time is calculated, where with each new observation a new period
is added and an earlier period is dropped.
NAV values of various mutual funds and benchmark (index) values are available on
AMFI website and CMIE database. These values will be converted to monthly returns.
Information related to NAV values is also available on CAPITALINE database.
Benchmark (index values) is available on NSE website, S&P website, Nikkei website,
FTSE website
Event 1
1993
Private Sector
Funds allowed
(Mutual Funds
regulations
introduced)
Public Sector
Funds
Private Sector
Funds
Only
Public Sector
Funds
Event 3
2008
Financial
Crisis
Public Sector
Funds
Private Sector
Funds
Public Sector
Funds
Private Sector
Funds
Public Sector
Funds
Private Sector
Funds
Public Sector
Funds
Private Sector
Funds
Event 2
2003
UTI Act
repealed, UTI
bifurcated

13
Mutual funds from various style categories like Equity, Balanced Growth Funds, Value
Funds, Sector Funds, Money Market Funds, ULIP (Unit Linked Insurance Plan), Global
Funds, etc. would be selected for the analysis
Regression can be conducted using SPSS or EXCEL.
6. POSSIBLE PROBLEMS
In any statistical process data problems may go undetected and can lead to wrong
inferences. Typical problem that can be encountered while running a multiple regression
is multicollinearity, which would arise if style indices used in the regression have an
overlap.
Multiple Discriminant Analysis could be used first to classify funds in various types and
then regression analysis could be conducted.
7. MILESTONES (TIME LINE)
Activity Time
1. Literature Review & Data Collection May 2011- December 2011
2. Data Analysis for Phase 3 January 2012-June 2012
3. Data Analysis for Phase 1 & 2 July 2012-December 2012
4. Collation of information and analysis
leading to conclusions
January 2013-June 2013
5. Thesis Writing June 2013-December 2013
8. IMPORTANCE/BENEFITS OF THE STUDY
The study is expected to augment the standard portfolio performance evaluation
framework for mutual funds in India. This shall help investors to make a prudent choice
while selecting their investments in various available mutual funds.
Study is expected to indicate what types of funds have provided excess returns over the
style benchmarks. This shall help investors in choosing funds which could possibly
exceed the benchmark with their active style.

14
REERENCES
1. Investments, Bodie, Kane, Marcus, Mohanty, Tata McGraw Hill, 6th
edition
2. www.amfiindia.com k_for_20152009
3. Indian Mutual Fund Industry-The Future in a Dynamic Environment, Outlook for
2015, published by KPMG & CII, June 2009
4. Investment Performance Measurement, Bruce J. Feibel, John Wiley and Sons
5. Ankrim, Ernest M, “Peer-Relative Active Portfolio Performance: It’s Even Worse
Than We Thought.” The Journal of Portfolio Measurement, Summer 1998, pp. 6-11
6. Bailey Jeffrey V, “Are Manager universes Acceptable Performance Benchmarks?”
The Journal of Portfolio Management, Spring 1992, pp 9-13
7. Bleiberg Steve, “The Nature of the Universe.” Financial Analyst Journal,
March/April 1986, pp. 13-14
8. Brinson Gary, Hood Randolph & Beebower Gilbert, “Determinants of Portfolio
Performance,” Financial Analyst Journal, July/August 1986, pp. 39-44
9. Sharpe William, “Mutual Fund Performance,” Journal of Business, 39 (January 1966)
10. Miller Robert & Gehr, “Sample size bias and Sharpe’s Performance Measure: A
Note” Journal of Financial & Quantitative Analysis, December 1978, pp 943-946
11. Treynor Jack L., “How to rate Management Investment Funds.” Harvard Business
Review, 43(January-February 1966)
12. Jensen Michael C, “ The Performance of Mutual Funds in the Period 1945-1964,”
Journal of Finance, May 1968
13. Jensen Michael C, “Risk, the Pricing of Capital Assets and the Evaluation of
Investment Portfolios.” Journal of Business, April 1969
14. Roll Richard, “Ambiguity when performance is measured by the Securities Market
Line.” Journal of Finance, 33 September, pp-1051-69, 1978
15. Sharpe William F. “Asset Allocation: Management Style and Performance
Measurement” Journal of Portfolio Management, 1992,18, pp. 7-19
15. Sharpe William F. “Determining a Funds Effective Asset Mix” Investment
Management Review, December 1988, pp. 59-69
16. Ben Dor, Jagannathan and Meier, “Journal of Investment Management, Vol. I, No.1
2003”, pp.94-113
17. Guha Deb, Banerjee, Chakrabarti. “ Performance of Indian Equity Mutual Funds vis a
vis their style benchmarks: An Empirical Exploration”, http://ssrn.com/abstract=962827,
pp.1-17
18. McDermott John, “ Returns Based Style Analysis: An Excel Based Classroom
Exercise”, “Journal of Education for Business:85”2010, pp. 107-113
19. Rekenthaler, Gamber, Charlson. “Estimating Portfolio Style in US Equity Funds: A
comparative study of Portfolio Based Fundamental Style Analysis and Returns Based
Style Analysis” The Journal of Investing, Fall 2006, pp.25-33
20. Surz Ronald J. “A Fresh look at Investment Performance Evaluation” Journal of
Portfolio Management” Summer 2006, pp.54-65
21. Bhatacharjee, Roy. “ Fund Performance Measurement without Benchmark- a case of
select Indian Mutual Funds,” http://ssrn.com/abstract=962035, pp.1-10
22. Jayadev M., “ Mutual Fund Performance: An Analysis of monthly Returns,” Finance
India, Vol X No. 1, March 1996, pages 73-84
23. Panwar S & Madhumathi R., “Characteristics & Performance Evaluation of Selected
Mutual Funds in India”
24. Chen, Roll & Ross, “Economic Forces and the Stock Market”, Journal of Business,
vol 59, No.3, 1986


