Performance Evaluation of Marine Zoning in the Florida Keys National Marine Sanctuary Final Report Year 2 December 31, 2007 Florida Fish and Wildlife Conservation Commission Fish and Wildlife Research Institute South Florida Regional Laboratory 2796 Overseas Highway, Suite 119 Marathon, FL 33050
Transcript
Performance Evaluation of Marine Zoning in the Florida Keys National MarineSanctuary
Final Report Year 2
December 31, 2007
Florida Fish and Wildlife Conservation Commission
Fish and Wildlife Research InstituteSouth Florida Regional Laboratory2796 Overseas Highway, Suite 119
This project uses a multi-tiered approach to evaluate Marine Protected Areas(MPAs) in Florida Keys National Marine Sanctuary (FKNMS). The MPAs in FKNMSwere established to protect critical reef habitats from overexploitation, and to insure thesustainability of valuable marine resources. This study aims to address key issuesregarding the effectiveness of the Western Sambo Ecological Reserve (WSER) designfor protecting essential fish habitat, population structure, species diversity anddetermine the ecosystem connectivity of exploited predatory reef fishes (snappers andgroupers) and of spiny lobsters.
Lobsters were re-surveyed after a decade of protection in 13 MPAs, andmovement of sonic-tagged lobsters and finfish in Western Sambo Ecological Reserve(WSER) and across the offshore reserve boundary were tracked for one calendar year(June 2006-August 2007) with quarterly tagging. Additionally, visual surveys of reef fishwere completed to compare species diversity, density and size structure within themarine reserve to unprotected areas across the Florida Keys National MarineSanctuary (FKNMS). The following comprises the final report for all phases of theproject for the period October 2006 to September 2007.
We used timed surveys of spiny lobsters inside 13 marine reserve zones andtheir exploited reference areas (Table 1) in FKNMS during the closed fishing season of2006 to determine lobster size, sex, and abundance. Sampling was designed to testthe hypothesis that no-take zones would sufficiently protect lobsters so that lobsters inthese zones would become larger and more abundant than those in unprotected areas. We also surveyed lobsters in 3 of the reserves, WSER, Looe Key SPA (LKS), EasternSambo Research Reserve (ESB), and their reference areas in the fishery during theopen fishing season in September 2006. In July 2007, we surveyed lobsters in the 3aforementioned reserves/reference areas using area-based surveys.
From October 2006 through April 2007 we maintained the deployment of 45sonic receivers in a series of rings around large habitat features such as patch reefsand forereef inside Western Sambo Ecological Reserve (WSER) and a hardbottomoffshore bar located south and west of WSER (Figure 2). From June 2007 to August2007 we re-deployed 33 sonic receivers around and within the forereef of WSER(Figure 3, 4). The rational for this final deployment was to determine habitat usage andmovement patterns of spiny lobsters and finfish within the forereef. This deploymentwas designed to overcome the acoustic difficulties of receiving telemetry from forereeftagged animals
METHODS
Lobster Monitoring - Timed Surveys
Lobsters were surveyed at 13 MPAs and paired reference areas in the fisheryduring July 2006 (closed fishing season). Ten of the reserves are small SPAs in
FKNMS (Figure 1). These SPAs range in size from 28 to 147 ha (mean size 84 ha). One reserve, LKS, is a small, 115 ha, long-term SPA. Fifty hectares of the forereef atLKS 50 ha forereef has been protected since 1981 as Looe Key National MarineSanctuary. The protected area was enlarged as LKS in 1997. One reserve, CAR, is amedium-sized reserve. WSER is a large, 3000 ha reserve.
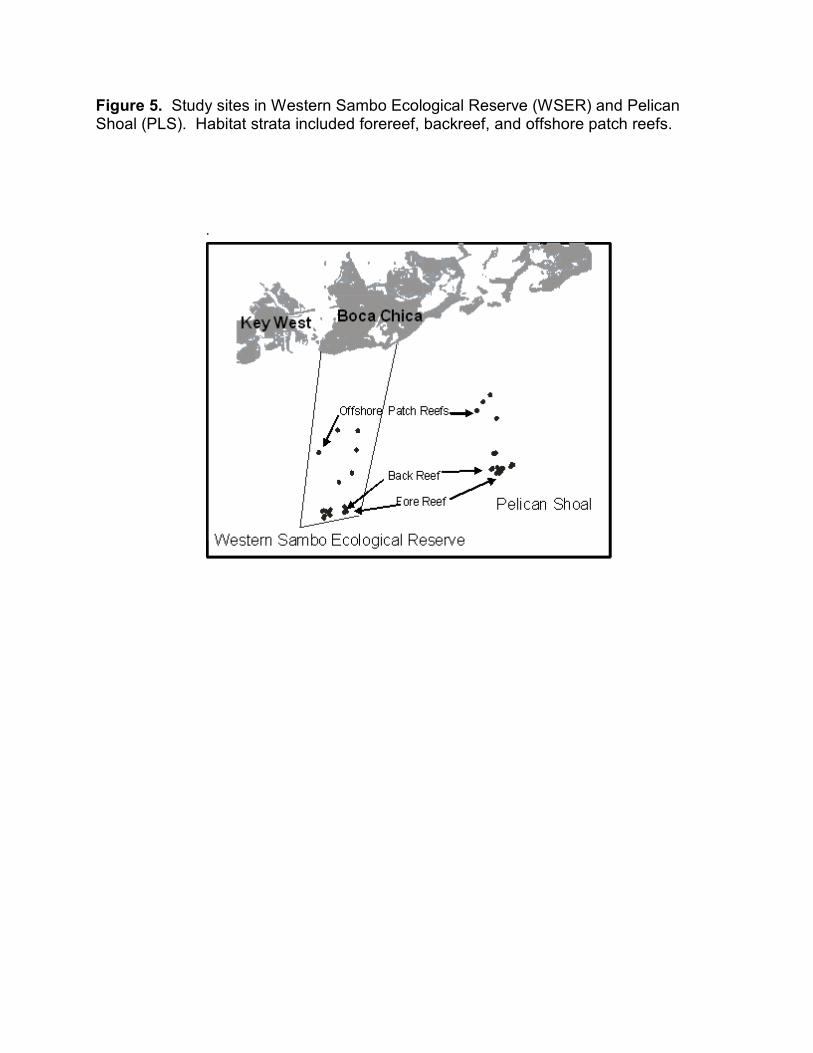
We stratified sampling within Western Sambo Ecological Reserve (WSER) byhabitat type because we expected each habitat to shelter a different size range of spinylobsters (Hunt et al., 1991). Strata included forereef, backreef, offshore patch reef(Figure 5). Three replicate surveys were conducted in each stratum. Surveys wereconducted in the dominant habitat within the 12 smaller reserves. We completed threereplicate surveys on the forereef at Carysfort/South Carysfort Reef SPA (CAR), and onesurvey in the remaining 11 reserves. We re-surveyed lobsters in WSER, EasternSambo Research Reserve (ESB), Looe Key SPA (LKS), and their paired referenceareas in September 2006 (open fishing season) (Table 2).
Divers surveyed spiny lobsters using 60-minute-timed-searches. Two teams ofdivers (consisting of one searcher and one catcher) searched for lobsters for 30minutes each. Data from the two teams were pooled and considered as one 60-minutesurvey. Lobsters observed by the catcher but not by the searcher were neither countednor captured. Time was kept by the searcher using a stopwatch that was turned offwhile lobsters were captured.
At the time of capture, each lobster was numbered, and sex and den depth wererecorded. All captured lobsters were brought to the boat where size, molt stage, andreproductive status of females (e.g. presence or absence and condition ofspermatophores and eggs) were recorded. Lobsters were returned alive to the area ofcapture. Lobsters that eluded capture were always included in abundance estimates,and, when possible, their sex and estimated-size were recorded.
Lobster Monitoring - Area Surveys
During July 2007, we surveyed lobsters in the 3 Lower Keys reserve/referencepairs using area-based surveys instead of timed surveys. Divers counted andestimated size of all lobsters in 25, 500 m areas on the forereef and backreef of2
WSER/PEL, and in 10 replicate 500 m areas on the forereef only at ESB/MSB, and2
LKS/MAR. In July 2004-2006, area-based surveys had been performed in WSER/PELonly.
In conjunction with area based surveys, we also collected approximately 50lobsters from each survey site. Captured lobsters were brought to the boat where werecorded lobster sex and size, and reproductive condition of females.
Fish Visual Surveys
From May to October 2007, five visual sampling trips per month were conducted
inside WSER, for a total of 30 sampling trips. Visual surveys are used at Florida Fishand Wildlife Research Institute, South Florida Regional Laboratory to collect abundanceand length-frequency data on fishes found over fringing reefs, patch reefs, and hardbottom areas in water meeting a minimum criterion of horizontal visibility. Surveys wereconducted according to the standard visual sampling protocol used in the Florida Keys. This technique employs the use of two divers using SCUBA gear. During visual surveysampling, fish within a standardized area are enumerated and have a length estimationassigned. Due to the often diminished visibility on inshore patch reefs within WSER,some surveys were conducted in less than 7m of horizontal visibility.
Sonic Tagging - Overview
Receivers were deployed in and nearby Western Sambo Ecological Reserve(WSER) nearly continuously from June 2006 to August 2007, and sonic tagged lobstersand fish were seeded into the area during four separate tagging periods. Prior todeployment, each VR2 sonic receiver was initialized in the laboratory using a computerand special probe and software provided by the manufacturer (VEMCO). A special tagwas then placed next to each receiver to insure that it was functioning probably. Duringquarterly maintenance when receivers were checked and serviced, we downloaded thedata from each recovered receiver while in the field using the same equipment andsoftware as in the laboratory. If the receiver required a battery replacement or if thereceiver’s data buffer was more than 1/3 full, we would re-initialize the receiver. Twiceduring this project (April 2007 and August 2007) all receivers were recovered andreturned to the laboratory. During recovery phases, receivers were returned to thelaboratory and cleaned prior to downloading. In the case of the August 2007 recovery,all receivers were placed into a large freshwater tank and “time stamped” with a singletransmitter prior to downloading. We “time stamp” receiver during deploymentswhenever receivers are place such that detection ranges overlap. The time stampallows us to precisely adjust the time field in the downloaded data as the clocks mayvary slightly between receivers. The time adjustment then permits us to accuratelyknow when one given tag transmission is detected by multiple receivers. Having thisinformation gives us a more reliable location estimate of tagged animals under theseconditions.
From June 2006 to April 2007, we deployed 45 sonic receivers in a series ofrings around large habitat features such as patch reefs (9.2 km ), the forereef (3.7 km )2 2
inside Western Sambo Ecological Reserve (WSER) and a hard bottom offshore bar(2.9 km ) located south and west of WSER (Figure 2). This deployment was designed2
to investigate broad scale movement patterns within this area. A total of three receiverswere lost (all outside just outside the boundaries of WSER), presumably toentanglement with anchor ropes, trap lines, or fishing lines.
In June 2007, we redeployed 33 sonic receivers because of the difficult acousticproperties found within the forereef zone of WSER. Twelve receivers wereconcentrated along grooves in the forereef near mooring balls 9 and 12 (Figure 3). Inaddition, three receivers were placed to the south of the grooves in deeper water (7-10
meters) (Figure 3). These receivers were placed to detect lobsters and fishes movingfrom the grooves for deeper water. Finally, a large ring of receivers encompassed theforeereef and “sentinel” receivers where placed one to two kilometers east and west ofthe main forereef deployment (Figure 4). We retrieved all 33 receivers on August 24,2007.
All VR2 sonic receivers were deployed on a concrete pad and pvc pipe mountingthat kept the receivers from 1.5 to 2 m off the bottom. All pads were placed over softbottom and for those receivers placed in “rings”, the inter-receiver distance was keptbetween 400 and 500 m apart.
Sonic Tagging -Lobster Sonic Tagging
The sonic tags used in this study were a VEMCO V16 4K coded pinger tag. Each tag’s dimensions were 16 mm diameter and 58 mm long. These tags are amongthe more powerful tags for their size with a power rating of 158 dB re :Pa at one meter. They have a four-digit code that is emitted (ping) in a randomized interval between 60and 183 seconds. The randomization of ping time reduces the probability of signalinterference between tags. Tags were activated in the laboratory two days prior to fielddeployment. The electrical lead ends of wires were trimmed and soldered and thencoated with a silicone sealant. The activation of each tag was confirmed by placing thetag next to a VR2 receiver.
To tag lobsters in the field, lobsters were captured by SCUBA divers using ticklesticks and nets. Lobsters to be fitted with a sonic tag were brought to the boat andplaced into a large tray partly filled with water. The tray allowed us to dry the top of thelobster carapace with a towel while the lobster could keep its gills wet. Tags wereaffixed to the carapace using an underwater plumbing repair epoxy. Although theepoxy will adhere on wet surfaces, we found that a damp surface permitted greateradhesion of the epoxy than a fully wet surface. A portion of the clay-like epoxy wasmolded by hand into a shape similar to the sonic tag. The epoxy was placed along thecarapace of the lobster, then the tag was pressed down into the epoxy with the emitterend of the tag resting next to the horns and posterior to the eyes. The epoxy wasfurther molded onto the carapace with special attention given to pressing the epoxyaround the spines to insure a secure fit. The lobster was retained in the holding tray forapproximately 15 minutes to permit sufficient hardening of the epoxy. Divers thenreturned each lobster to its den. We record the tagged lobster’s sex, carapace length,injuries, and reproductive status for females. The location and depth of the tagging siteis also recorded as well as marked by the boat’s GPS.
A total of 92 lobsters (including two Panulirus guttatus) were fitted with sonic tagsduring the course of this study. There were three “seedings” of 68 tagged lobstersduring the first deployment (June 2006 to April 2007) and one “seeding” of 24 taggedlobsters during the second deployment (June 2007 to August 2007).
Once the data are downloaded, data are combined into a single data set usingan application I wrote in Visual Basic for this purpose. Next this file is imported intoSPSS in order to remove any duplicate records that can exist if a single receiver isdownloaded more than once. Finally, the clean field data are imported into an Accessdatabase. This relational database contains other data tables such as the deploymentstatus of each receiver, data regarding the animals we tagged, and data regarding thetagging sites. From the relational database, using Access’ structured query language,we can develop datasets that focus on various aspects of the data such as “lobstersseeded in the fall on the offshore bar”. Data from the queries are ported primarily toSPSS or Arc View (ESRI) for spatial and temporal analysis. Spatial Analyst andTracking Analyst (ESRI) and Phil Hooges (1997) animal movement extension.
Sonic Tagging -Fish Sonic Tagging
Fish were tagged and released quarterly: in June 2006, October 2006, January2007 and June 2007. All fish were captured with hook and line gear (H & L) or fishtraps (Z trap) within patch reef and fore reef habitats of WSER and on the offshore barto the south of WSER. When necessary, excess air in the swim bladder was ventedwith a 16 gauge hypodermic needle after capture, and fish were immediately placed ina 60 liter tub filled with cooled aerated seawater. Once fish were stable anddemonstrated normal behavior and swimming posture, they were consideredcandidates for surgery. Fish were then placed inverted (ventral side up) in a V-shapedsurgical sling. A soft vinyl tube connected to a submersible pump was positioned in themouth to flush the gills with fresh seawater throughout the procedure. A small (20 - 25mm) incision was made with a sterilized scalpel posterior to the pelvic girdle and aVEMCO tag was implanted into the peritoneal cavity. The incision was closed with 4 - 5Ethicon surgical sutures (Ethicon Inc., Somerville, New Jersey) and then fish werepositioned dorsal side up in the sling for placement of conventional anchor tag into thedorsal musculature between the dorsal fin spines. Following the completion of surgery,length (total and fork) were recorded and fish were placed in a seawater recovery tankfor observation. Once recovered (3-15 minutes), fish were handed to a diver in thewater and the diver swam the fish down toward the bottom for release. Each fish wasobserved on the bottom for a few minutes, or until the fish swam out of visual range.
Movements of individual groupers and snappers were tracked using 45 sonicreceivers (VEMCO VR2; VEMCO Ltd., Nova Scotia, Canada) deployed in the WSERand along unprotected benthic habitat (offshore bar) to the south of the reserveboundary. The VEMCO VR2s functioned as passive listening stations and recorded theunique code, date and time of acoustically tagged fish that passed within the receiver'srange. VEMCO sonic tags (V9-2L, V13-1H, V16-3H, V16-4 H) each had a uniquenumerical digit code and transmitted at 69 kHz. Pinger signal minimum and maximumoff times ranged from 5 - 30 seconds to 40 - 120 seconds delay. This configurationallowed the tags to transmit information to the receivers for a period of approximately90 - 120 days and minimized the possibility of tag signal collisions. Each sonically-
tagged fish also received an external dart tag displaying the Fish and Wildlife ResearchInstitute (FWRI) phone number.
RESULTS and DISCUSSION
Lobster Monitoring
We counted a total of 2,423 spiny lobsters using timed surveys --1, 692 duringthe full census (46 hrs of search time) during the closed fishing season (July 2006), and731 in the abbreviated census (22 hrs of search time) during the open fishing season(September 2006).
Over the course of the 10-year study, we counted a total of 10,609 spiny lobsters(3,691 sub-legals, 6,355 legals, and 563 unknown size) at our sites in 362 surveysduring the closed fishing season. Lobsters ranged in size from 20 mm carapace length(CL) to 148 mm CL. The size of the largest lobster encountered increased from 110mm CL in 1997 to 148 mm CL in 2006. The 148 mm CL lobster was found in thefishery at Middle Sambo (MSB) between the reserves at Western Sambo (WSER) andEastern Sambo (ESB). Overall, legal-sized lobsters were significantly larger in reservesthan in the fishery reference areas (Kruskal-Wallis: p < 0.00005). Legal lobsters inreserves were largest on average in WSER, and smallest in the SPAs (Figure 6).
Lobster Size - Timed Surveys
There was no difference in size of legal-sized lobsters in reserves andreferences in 1997 (SPAs - ANOVA: F = 1.62, df = 1, p = 0.2; Carysfort -ANOVA: F =2.63, df = 1, p = 0.1; WSER - ANOVA: F = 0.05, df = 1, p = 0.8 ) except in small LKSwhere lobsters were larger than in reference (ANOVA: F = 4.7, df = 1, p < 0.05)(Figure7). There has been no increase in size of legal-sized lobsters following protection in the10 small SPAs, the small long-term SPA, or the medium-sized SPA (Figure 7 a-c). However, after one year of protection, legal-sized lobsters were significantly larger inthe large reserve than in the fishery and have lobster size has remained significantlylarger throughout the decade (Figure 7d).
Lobster Size - Size-Frequency Collections
We collected approximately 50 lobsters from the forereef of 3 Lower Keys sitepairs during July 2007. Additionally, approximately 50 lobsters were collected from thebackreef in WSER and PEL. A total of 444 lobsters were collected, 307 legal-sizedlobsters, and 137 sublegals. Mean size of legal-sized lobsters is shown in Figure 8. Lobsters in WSER were larger on average than in all other locations. However, thelargest lobster captured was a 146 mm CL male lobster found in Middle Sambo.
Lobster Abundance - Timed Surveys
Legal-sized lobsters are significantly more abundant in small SPAs than infishery (Figure 9a). In the small long-term SPA, there was no difference in abundanceof legal-sized lobsters between reserve and reference (Figure 9b). Legal-sized lobstersare significantly less abundant in the medium-sized reserve than in fishery (Figure 9c). In the large reserve, however, legal-sized lobsters significantly more abundant in thereserve than in the fishery, but there is no effect of year (Figure 9d). There aresignificantly more legal-sized lobsters on forereef and backreef than on patch reefswithin WSER.
Area-Based Surveys
We completed 140 area-based surveys in July 2007. Twenty-five surveys weredone in the forereef and backreef of WSER and PLS. Ten belt-transects were completed in the forereef of ESB and LKS and their references. Legal-sized lobsterswere more abundant in than in other SPAs/References (Figure 10).
Sonic Tagging
Overview
All together, the number of transmissions received by the sonic receivers exceed1.1 million hits over the course of this study. A total of three receivers were lost, alloutside WSER in the southeast corner of the study area. Receivers were presumablylost due to fishing activities. All receivers re-deployed during the summer of 2007 wererecovered.
Lobster Sonic Tagging
A total of 90 P. argus and 2 P. guttatus were tagged in four seedings betweenJune 2006 and June 2007 (Table 3). During the first three seedings, lobsters weretagged in Hawk Channel and the forereef of WSER, plus the offshore bar located justsouth of WSER. The final seeding (June 2007) focused on the forereef where thedifficulties of obtaining acoustic signals from this complex topography required aconcentration of receivers. Although in total, we tagged approximately half males andfemales, male lobsters for unknown reasons were difficult to find during October-November 2006.
In all, more than 580 thousand tag transmissions were recorded by the sonicreceivers over the course of the study. Every lobster with the exception of one of thePanulirus guttatus was detected at least once by a receiver. Useful tracking informationwas obtained from more than 95% of the lobsters released during this study. Althoughthere is no way to clearly distill these animal movement data results into a few tables, Ihave attempted to summarize some of the broader aspects of movements for the June
2006 - April 2007 deployment (Table 4) and June 2007 - August 2007 deployment(Table 4) and I will use these tables to organize some detailed results and discussion.
First seeding - June 2006- 30 lobsters tagged (29 P. argus and 1 P. guttatus).
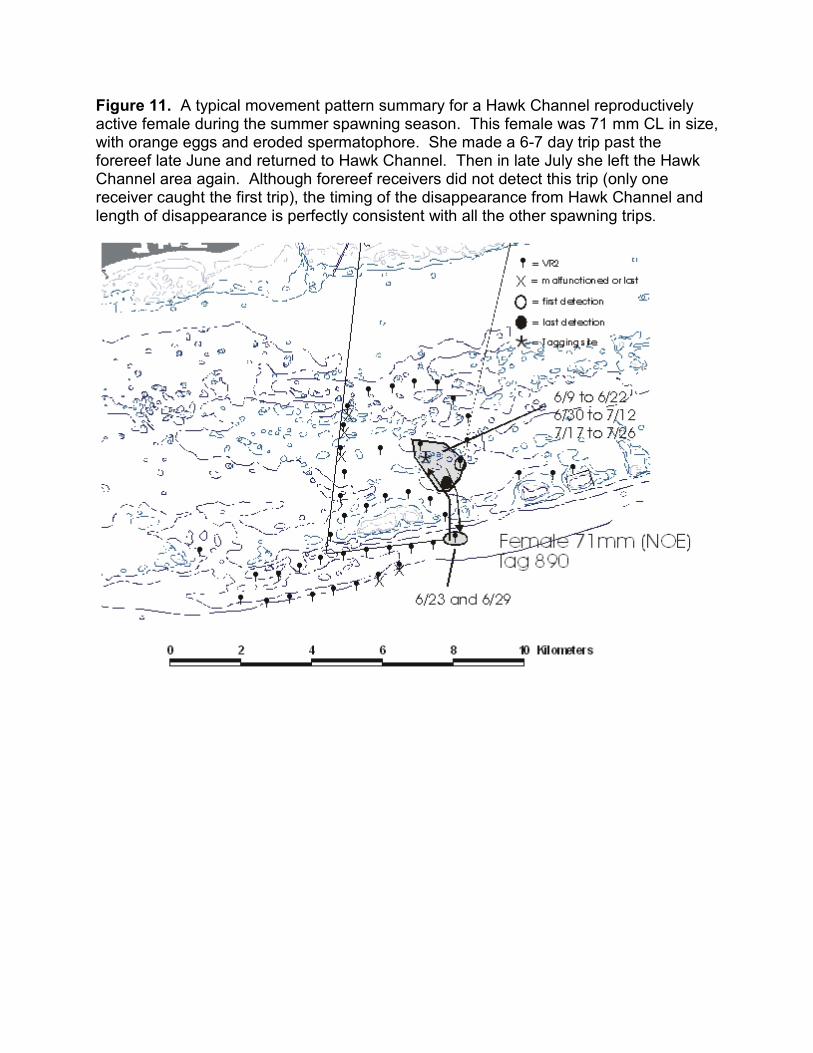
Principal movement patterns: (1) Hawk Channel females that were reproductively active exhibited a strongmigration pattern characterized by a nighttime rush through the forereef and intodeeper water probably beyond the southern boundary of WSER. The travelwould generally take two nights. Typically, these females remain approximately4-5 days then return to Hawk Channel (Figure 11 - representative chart).(2) Hawk Channel males predominately remain in Hawk Channel. Some makebroad lateral movements of perhaps greater than 1-2 kilometers, but they do notventure to the forereef or offshore bar.(3) Forereef movement patterns were not clear due to the rugose nature of theforereef and it’s effect on the sonic transmissions. Nevertheless, all twelvelobsters were detected by backreef or offshore bar receivers at least once. These movements are not reflected in Table 4. We now know after the specialforereef deployment in the summer of 2007 that these 2006 detections were partof daily movement patterns where both male and female lobsters may travelafter nightfall from the forereef to the backreef to feed. Detections by receiversto the south of the forereef represent either spawning movements by females ormovements between the offshore bar and forereef by males or females.(4) Offshore bar females that were reproductively active remained on theoffshore bar to spawn. By the end of the spawning season, half of the femalesmoved toward Hawk Channel, two into WSER and one outside WSER. In onecase, we were able to track a female moving from the offshore bar to the northhalf of WSER (Figure 12 ).
Second seeding - October - November 2006 - 20 lobsters tagged (all P. argus)
Principal movement patterns:(1) None of the female lobsters tagged were reproductively active and none ofthese lobsters made movements towards deep water as in the summer.(2) Only one lobster made a major change in position. This was a small 66 mmCL female lobster tagged in Hawk Channel. From October 12 to Novemberth
30 , she trekked from central Hawk Channel to the outside (southern portion) ofth
the offshore bar. In late December she moved to the forereef inside WSER.
Third seeding - February 2007 - 19 lobsters tagged (18 P. argus and 1 P.guttattus)
Principal movement patterns:(1) None of the female lobsters tagged were reproductively active and none ofthese lobsters made movements towards deep water as in the summer.
(2) Large shifts in location, unlike the late fall, became common again as onethird of the lobsters tagged in this seeding emigrated from the original location. Another small female (also 66 mm CL) trekked from Hawk Channel to theoffshore bar between February 8 to March second. Two females from theth
forereef migrated to the offshore bar. One offshore bar male migrated to HawkChannel and a forereef male migrated to the offshore bar then moved laterallyalong the forereef to the west sentinel receivers located approximately 2 km westof WSER.(3) The single P. guttatus was detected fewer than 10 times by a Hawk Channelreceiver closest to the release point. No other receivers detected this tag.
June 2007 - August 2007 forereef only deployment
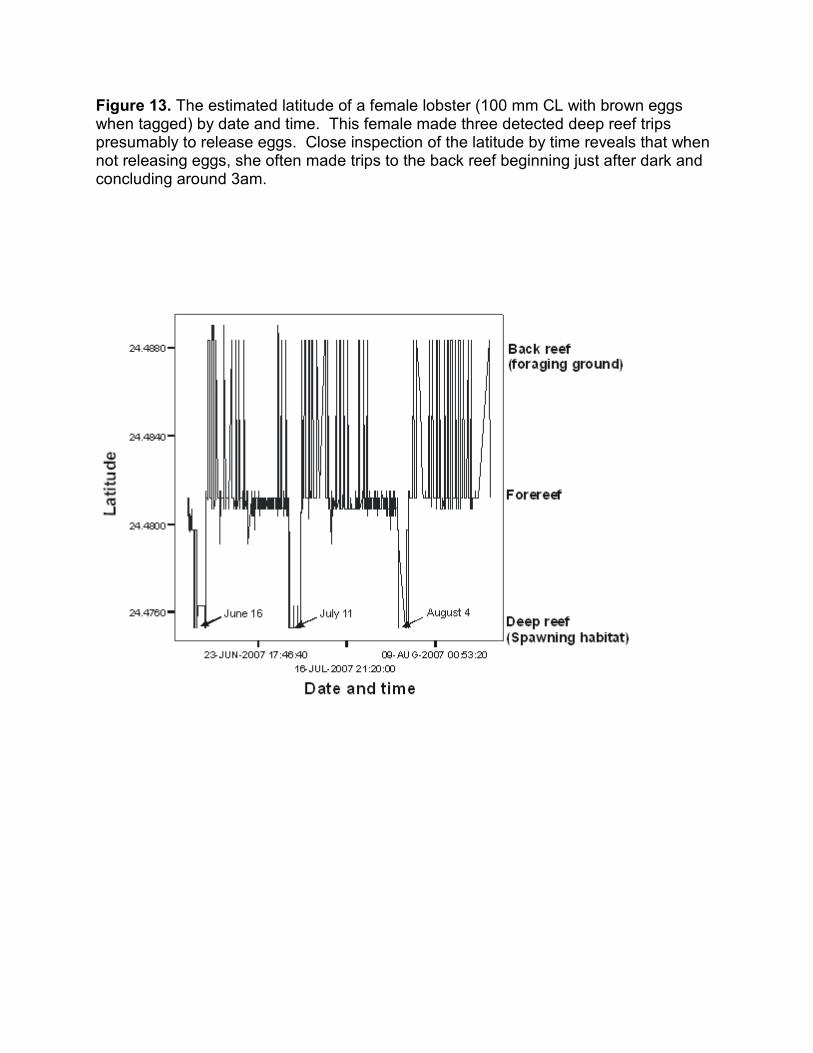
Fourth seeding - June 2007- 24 lobsters tagged (29 P. argus and 1 P. guttatus).The forereef was an acoustically difficult place to track tagged lobsters but thevery close positioning of the receivers within the grooves of the reef successfullyrevealed the movements of these lobsters.Principal movement patterns:(1) All ten reproductively active females made at least one deep water trippresumably to spawn (Table 4). Two of the ten made three detected trips(sample given in Figure 13). The reproductive migration typically lasts three tofive days whereupon each lobster returns to its “home” groove on the forereef. When multiple trips are detected, the time between trips ranged between 23 and32 days with a mode of 25 days.(2) Daily movement patterns typically involved movement from a groove on theforereef beginning shortly after dusk. By midnight lobsters reach a foragingground which is often the back reef but can also be another regional of theforereef. Lobsters rarely ventured near our deep reef receivers unless spawning. These daily movement patterns are reminiscent of daily movement patternsobserved in Hawk Channel lobsters in studies conducted with closely packedsonic receivers (Bertelsen and Hornbeck, in review).
Fish Visual Surveys
All sites surveyed in 2007 are presented in Table 5. Data are presently beingproofed and entered from these surveys.
Fish Sonic Tagging
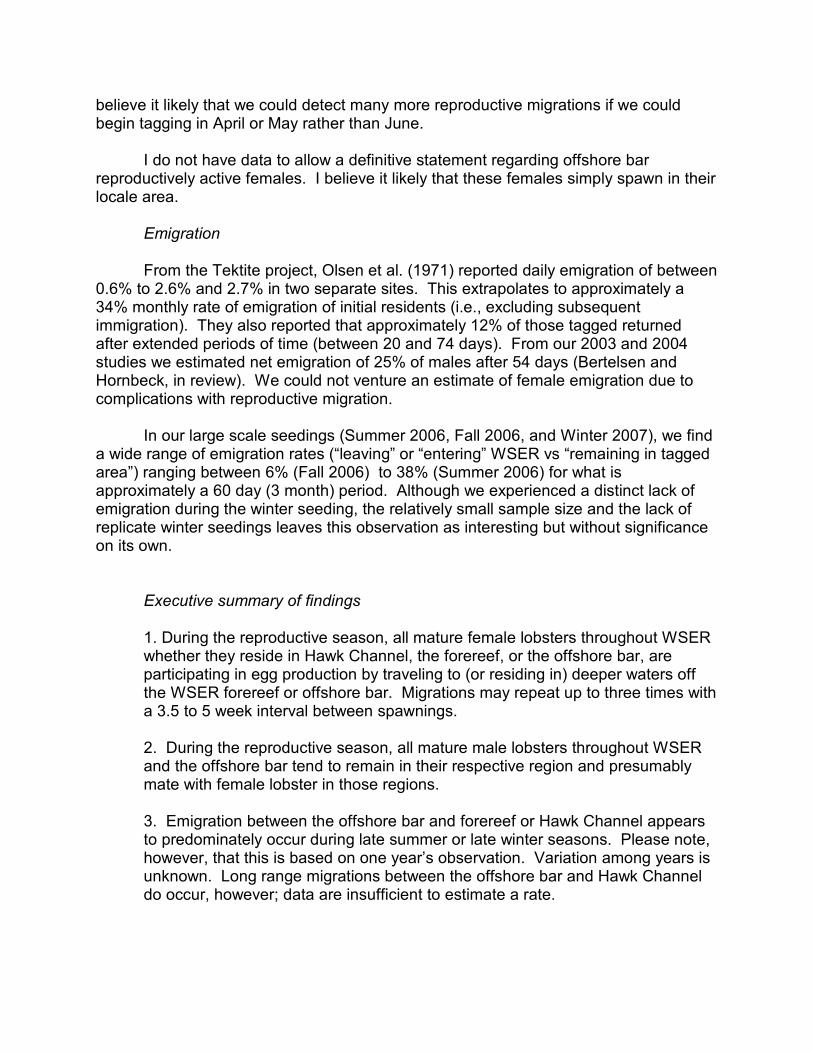
Forty eight fish were successfully implanted with acoustic tags and releasedbetween June 2006 and June 2007 (Table 6). Catch per unit effort (CPUE) for taggedfish are reported for each quarter in Table 7. The majority of reef fish speciesacoustically tagged were seranids: twenty six red grouper, Epinephelus morio, fiveNassau grouper, Epinephelus striatus, seven black grouper, Mycteroperca bonaci, tworock hind, Epinephelus adscensionis, one goliath grouper, Epinephelus itajara and onegag grouper, Mycteroperca microlepsis. In addition, two yellowtail, Ocyurus chrysurus,
one mutton snapper, Lutjanus analis, one gray snapper, Lutjanus griseus, one cobia,Rachycentron canadum, and one blacktip shark, Carcharhinus limbatus, were alsotagged. Mean size of all snappers and groupers tagged is summarized in Figure 14.
A summary of frequency of signal detections by fish and by VR2s is presented inTables 8,9. Preliminary analyses indicate that groupers that were captured on HawkChannel patch reefs appeared to remain on patch reefs (see Report 1 for preliminaryinformation on home range estimates). The large reserve design (30 km2) appearseffective in providing adequate protection of patch reef habitat for these fish. However,fish captured in the fore reef zone and from the deeper offshore bar exhibitedsignificant movement between these habitats. Fish that utilized the fore reef zoneoften moved across the southern reserve boundary to and from the open fishing area ofthe offshore bar.
Two examples of individual fish movements captured and released in the forereef zone are presented below. The first case is a Nassau grouper (tag 868; 480 mmTL) tagged on February 8, 2007 and last detected on April 18, 2007. This fish wasperiodically detected on offshore bar receivers as indicated by the mean daily latitudeposition in Figure 15. Detections were generally within range of the fore reef receiversbut occasionally this fish was also detected on offshore bar receivers, indicatingmovement to the south, across the southern reserve boundary. The second case is ablack grouper (tag 1319; 760 mm TL) tagged on October 18, 2006 and last detected onFebruary 15, 2007. This fish also exhibited movements outside the reserve boundaryalong the offshore bar (Figure 16). This fish was continuously present near the centerof the fore reef and offshore bar receivers, with four receivers recording 92.1% of thetotal pings detected. However, approximately 6.2% of detections were recorded for ashort period (November 9 - 15, 2007) on receivers to the west of the reserve along thenorth side of the offshore bar.
To improve resolution on habitat usage and fine scale details of movements,future work will focus on the spur and groove sections of the fore reef (see array designin Figures 2,3) and integrate these results with the broad-scale movements establishedin the WSER and offshore bar.
CONCLUSIONS and MANAGEMENT CONSIDERATIONS
Lobster Monitoring
The 10 small SPAs are partially effective reserves because legal-sized lobstersare larger and more abundant than in fishery, but there has been no increase in size orabundance over time. The small long-term LKS SPA is a partially effective reservebecause legal-sized lobsters generally larger in reserve than in fishery but they are lessabundant in reserve than in fishery, even after 25 years of protection. The medium-sized CAR SPA is a partially effective reserve because legal-sized lobsters larger inreserve than in fishery - but they are significantly less abundant there than in reservethan in fishery. Western Sambo Ecological Reserve is functioning as an effective
reserve for spiny lobsters as evidenced by the increase and abundance of legal-sizedlobsters relative to the fishery. We have also observed evidence of “spillover” of largelobsters from reserve to the fishery.
Small and medium-sized reserves in FKNMS provide a small amount ofprotection to spiny lobsters. Increased reserve longevity (LKS) or reserve size when asingle habitat is protected (CAR) does not provide increased lobster protection. WSERis an effective reserve because it encompasses a large area of diverse lobster habitatsincluding patch reefs as well as forereef/backreef which lobsters utilize differently duringdifferent seasons and life stages. Effective reserves for spiny lobsters must protecthabitat for multiple life-stages of lobsters and take into account lobster reproductivebehavior in addition to foraging behavior.
Sonic Tagging
Lobster Sonic Tagging
Please note: In this last discussion and review of our work with sonic technology,spiny lobsters in the Western Sambo Ecological Reserve, I’m going to utilize some ofthe findings that come from our earlier study (2003, 2004) where sonic receivers weredeployed in a close grid pattern in Hawk Channel that permitted us to track lobsters witha fairly high degree of precision but without knowing movement patterns that exceededa kilometer or two (Bertelsen et al. 2000). In the current project, receivers were placedfar apart which allow us to detect departures and arrivals over many kilometers butwithout knowing smaller scale movements. Both sets of studies provide essential butdifferent views about how lobsters utilize WSER.
Our view of the spatial requirements, movement patterns, and how spiny lobstersuse their environment has changed greatly since the nineteen twenties when P. arguswas considered a “sluggish” animal but perhaps capable of long distant movements andlikely incapable of returning to the same den “except by accident” (Crawford & de Smidt1922). Perhaps one of the most important studies that began to change this view wasthe Tektite project of the late 1960's and early 1970's. In the Virgin Islands, a scientificteam worked with the underwater habitat that now is located on Conch reef and theymade extensive use of sonic tags. They found that lobsters had repetitive paths andtimings that would lead individual lobsters on a journey of up to a kilometer away fromtheir daytime den to feed, then the lobsters would unerringly return to the same den(Cooper & Herrnkind, 1971; Herrnkind & McLean, 1971; Herrnkind et al. 1975; Olsen etal., 1971). In the Tektite project, Herrnkind also made an first attempt to quantifyemigration from their study site.
Daily movements:
Spiny lobsters in Hawk Channel and forereef have somewhat analogous dailypatterns of movement basic on the earlier study in Hawk Channel and our last seedingin this project. In both the forereef and Hawk Channel, lobsters emerge from daytime
shelters after dusk and begin to travel toward foraging grounds. For forereef lobsters,this is typically the backreef zone as first described by Hunt et al., 1991 from large scalediver observation based project at Looe Key. We also found that lobsters sometimestravel laterally to forage and at other times they do not travel much at all. The finding,that sometimes lobsters stay near their den, supports Herrnkind’s observations fromTektite where they observed some individuals remaining near their den sometimes. Hawk Channel lobsters also generally travel up to a kilometer at times to “favorite”foraging areas. Both forereef and Hawk Channel lobsters reach their foraging areas bymidnight and around 3 am both return to the same forereef groove or patch reef to pickout a daytime shelter. That lobsters return to the same groove or patch reef is atendency, not a “law” and as Herrnkind found during Tektite, we also found suddenunpredictable changes in denning preference and sometimes, lobsters left the area alltogether.
Because we did not have the resources and time to tightly pack receivers on theoffshore bar, I cannot postulate on daily movement patterns for these lobsters. I havelittle doubt that these lobsters exhibit somewhat analogous daily movement patterns.
Reproductive migrations:
One principal new findings we made with these sonic studies is that egg bearingfemales in Hawk Channel and the forereef migrate to deeper waters south of theforereef to release eggs. I first speculated that female lobsters used deep water tospawn based on the incidence of late stage eggs found on egg bearing lobsters in deepwater during a late 1990's fecundity study (Bertelsen et al., 2000).
Hawk Channel egg bearing females typically leave for deep water near midnight,suddenly turning south moving at nearly 500 m per hour. These trips generally take twodays to complete. After 4-5 days, these lobsters typically return to their home patchreef. We found two occasions, however, where the female lobster stayed in the deepwater then began to wander through the forereef or offshore bar. Another exception tothis reproductive migration is that we found two or three egg bearing females (thesedata are not 100% definitive) that did not migrate but remained in Hawk Channel wellbeyond the time the eggs would have been released. I have speculated these non-migrating females are “naive” and that the clutch we observed may be their first.
Forereef egg bearing females also move to deeper water to spawn. During ourfinal summer 2007 seeding, the overall number of tag detections by all receivers verynearly 50% female and 50% male. The receiver located in deep water near theoffshore bar directly south of the seeding detected more than 95% female lobsters. One new finding we made with this project was that we detected three distinctmigrations for two of the ten reproductively active tagged forereef females. We haveobserved three egg masses for lobsters kept in the laboratory (T. Matthews - FWC,pers. comm.) and this is the first field confirmation of that observation. Becauseweather and water conditions forced us to start tagging well into the spawning season, I
believe it likely that we could detect many more reproductive migrations if we couldbegin tagging in April or May rather than June.
I do not have data to allow a definitive statement regarding offshore barreproductively active females. I believe it likely that these females simply spawn in theirlocale area.
Emigration
From the Tektite project, Olsen et al. (1971) reported daily emigration of between0.6% to 2.6% and 2.7% in two separate sites. This extrapolates to approximately a34% monthly rate of emigration of initial residents (i.e., excluding subsequentimmigration). They also reported that approximately 12% of those tagged returnedafter extended periods of time (between 20 and 74 days). From our 2003 and 2004studies we estimated net emigration of 25% of males after 54 days (Bertelsen andHornbeck, in review). We could not venture an estimate of female emigration due tocomplications with reproductive migration.
In our large scale seedings (Summer 2006, Fall 2006, and Winter 2007), we finda wide range of emigration rates (“leaving” or “entering” WSER vs “remaining in taggedarea”) ranging between 6% (Fall 2006) to 38% (Summer 2006) for what isapproximately a 60 day (3 month) period. Although we experienced a distinct lack ofemigration during the winter seeding, the relatively small sample size and the lack ofreplicate winter seedings leaves this observation as interesting but without significanceon its own.
Executive summary of findings
1. During the reproductive season, all mature female lobsters throughout WSERwhether they reside in Hawk Channel, the forereef, or the offshore bar, areparticipating in egg production by traveling to (or residing in) deeper waters offthe WSER forereef or offshore bar. Migrations may repeat up to three times witha 3.5 to 5 week interval between spawnings.
2. During the reproductive season, all mature male lobsters throughout WSERand the offshore bar tend to remain in their respective region and presumablymate with female lobster in those regions.
3. Emigration between the offshore bar and forereef or Hawk Channel appearsto predominately occur during late summer or late winter seasons. Please note,however, that this is based on one year’s observation. Variation among years isunknown. Long range migrations between the offshore bar and Hawk Channeldo occur, however; data are insufficient to estimate a rate.
4. None of the sonic data collected during this project and two previous projectssupport a correlation between movement rates and moon phase. In addition,reproductive migrations by female lobsters is not influenced by moon phase. Spawning by different individuals occur at any lunar phase and when multiplespawning events are detected by an individual, these events typically occur atdifferent lunar phases.
5. There is no evidence to suggest that WSER acts as a “magnet”, concentratinglobsters from surrounding areas. Over the course of a year, for the lobsters wecould track and identify a fate, five of 18 lobsters tagged on the offshore bar, leftthe offshore bar (27%) and nine of 38 WSER forereef and Hawk Channellobsters left WSER (24%) (Table 4).
Fish sonic tagging
Understanding the spatial dynamics and habitat usage of fishes is critical tounderstanding the efficacy of marine reserves and their role in supporting fisheries. Recreational and commercial fishing pressure has depleted populations of largepredatory reef fishes and caused unprecedented global changes in coral reefecosystems (Starr et al., 2005). In the Florida Keys, recent population stockassessments have identified thirteen grouper, seven snapper and two grunt species ascurrently over-fished (Ault et al., 1998). Numerous species of groupers and snappersare particularly susceptible to over exploitation because they form large spawningaggregations at predictable times and locations. Targeted fishing effort by fishermen inthese areas has resulted in the disappearance (10%) or decline (65%) of 280 knownaggregations worldwide (Cornish, 2005).
The WSER provides protection for a variety of cross-shelf habitats, i.e. seagrass,
hard bottom, patch reefs & fore reef, which theoretically provides protection forontogenetic related habitat shift movements for fishes from settlement through the adultstage. Preliminary information from acoustic telemetry suggests that groupers capturedand released on patch reefs, remained on patch reef habitat. However, the southernboundary of the WSER does not extend beyond 18 m depth and likely does not providerefuge for migratory spawning movements. Although the WSER and the adjacentoffshore bar have not been documented as fish spawning habitat, nine probablespawning sites for four species of snappers have been identified in the vicinity of theWSER (9 – 98 m depth) (Lindemann et al., 2000). Analyses of acoustical data do notyet substantiate migratory movements related to spawning events. However, groupersthat utilized the fore reef zone moved across the southern reserve boundary to andfrom the deeper offshore bar, including the endangered Nassau grouper Epinephelusstriatus.
Although temporal and spatial patterns of spawning behavior of most snappersand groupers are not well documented in the Florida Keys, habitat near the WSER (theoffshore bar south of Western Dry Rocks [12 – 37 m depth]) is a known aggregationsite for gray snapper Lutjanus griseus and mutton snapper L. analis (Lindemann et al.,
2000). Effective conservation of exploited reef fishes requires that deeper reefs and thetiming of spawning migration patterns be incorporated into fisheries management plans(Starr et al., 2005). Therefore, we recommend that the southern boundary of theWSER be extended to the south to protect the deeper offshore bar habitat. Additionally,placement of a marine reserve at Western Dry Rocks reef incorporating the offshorebar area should be reviewed and species specific seasonal spawning closures shouldbe considered in future management plans.
REFERENCES
Ault, J.S., Bohnsack, J.A. and Meester, G. (1998) A retrospective (1979-1995)multispecies assessment of coral reef fish stocks in the Florida Keys. Fish. Bull.96:395-414.
Bertelsen, R.D.; Hunt, J.H; Muller, R. 2000: Final Report: Spiny Lobster SpawningPotential and Population Assessment: A Monitoring Program for the SouthFlorida Fishing Region. NOAA Report : FO518-96-99
Cooper, R.; Herrnkind, W. 1971: Ecology and population dynamics of the spiny lobster,Panulirus argus, of St. John Island, U.S.V.I. Pages 34-57 inScientists-in-the-Sea. J. W. Miller, J. G. VanDerwalker, and R. A. Waller, editors.U.S. Department of the Interior, Washington, DC.
Cornish, A. S. (2005) Development and Summary of Global Spawning AggregationDatabase. Society for the Conservation of Reef Fish Spawning Aggregations.www.scrfa.org. pp 16.
Herrnkind, W. F.; McLean, R. 1971: Field studies of orientation, homing, and massemigration in the spiny lobster, Panulirus argus. Annals of the New YorkAcademy of Sciences 188:359-377.
Herrnkind, W. F.; Redig, M. X. 1975: Preliminary study of establishment of denresidency by the spiny lobster, Panulirus argus, at Grand Bahama Island. HydroLab J. 3, 96–101.
Herrnkind, W.F.; Vanderwalker, J; Barr, L. 1975: Population dynamics, ecology, andbehavior of spiny lobster, Panulirus argus, of St. John, U.S. Virgin Islands:habitation and pattern of movements. Results of the Tektite Program, Vol. 2. Nat.Hist. Mus. Los Ang. Cty. Sci. Bull. 20: 31-45.
Hooge, P.N. ; Eichenlaub, B. 2000: Animal movement extension to Arcview. ver. 2.0.Alaska Science Center - Biological Science Office, U.S. Geological Survey,Anchorage, AK, USA.
Hunt JH, Matthews TR, Forcucci D, Hedin B, Bertelsen RD (1991) Managementimplications of trends in the population dynamics of the Caribbean spiny lobster,Panulirus argus, at Looe Key National Marine Sanctuary. Final Report to NOAA
Lindemann, K.C., Pugliese, R., Waugh, G.T. and Ault, J.S. (2000) Developmentalpatterns within a multispecies reef fishery: management applications foressential fish habitats and protected areas. Bull. Mar. Sci. 66(3):929-956.
Olsen, D. A.; Hernkind, W.F.; Koblick, I.G. 1972: Ecological Study for the Developmentof Lobster Management Techniques", PRINUL Special Report #1, Sea GrantStudy 101pp.
Starr, R.M., Sala, E., Ballesteros, E. and Zabala, M. (2007) Spatial dynamics of theNassau grouper Epinephelus striatus in a Caribbean atoll. Mar. Ecol. Prog. Ser.343:239-249. doi: 10.3354/meps06897
Table 1. Lobster Monitoring Sites. Sanctuary Zones (reserves) and their referenceareas.
Ocyurus chrysourus 2/20/2007 Outer Bar 36 550 2155 V16-3H
Ocyurus chrysurus 10/11/2006 Outer bar 52 370 880 V9-2L
Rachycentron canadum 10/12/2006 Outer bar 65 780 1276 V16-3H
Table 7. CPUE for all fish tagged.
Tagged June 2006ZONE Effort GEAR Catch CPUE
(hrs) (# fish) (fish hr )-1
Patch 7.84 H&L 6 0.77
Patch 21.68 Trap 7 0.32
Fore reef 3.75 Trap 0 0.00
Outer bar 3.90 Trap 0 0.00
All Zones 37.17 both 13 0.35
Tagged fish Oct/Nov 2006ZONE HOURS GEAR # of fish CPUE
(hrs) (# fish) (fish hr )-1
Patch 0.80 H &L 5 6.25
Patch 2.78 Trap 0 0.00
Fore reef 2.50 H &L 2 0.80
Fore reef 4.05 Trap 5 1.23
Outer bar 5.70 H &L 2 0.35
Outer bar 33.27 Trap 3 0.09
All Zones 49.10 both 17 0.35
Tagged fish Jan/Feb 2007ZONE HOURS GEAR # of fish CPUE
(hrs) (# fish) (fish hr )-1
Patch 3.12 H&L 5 1.60
Fore reef 3.18 H&L 5 1.57
Outer bar 18.04 traps 1 0.06
Outer bar 4.75 H&L 0 0.00
All Zones 29.09 both 11 0.38
Table 8. Frequency of detections of tagged fish by individual VR2 listening stations forJune 2006 – April 2007.
VR2 Frequency Percent Valid
Percent
Cumulative Percent
2311 389 0.09 0.09 0.09
2312 881 0.20 0.20 0.29
2314 4899 1.11 1.11 1.40
2315 7661 1.74 1.74 3.14
2316 7323 1.66 1.66 4.80
2317 892 0.20 0.20 5.00
2318 12 0.00 0.00 5.01
2319 61707 14.01 14.01 19.01
2320 26 0.01 0.01 19.02
2323 439 0.10 0.10 19.12
2324 932 0.21 0.21 19.33
2325 15391 3.49 3.49 22.83
2326 1479 0.34 0.34 23.16
2327 128 0.03 0.03 23.19
2328 33722 7.65 7.65 30.85
2329 3740 0.85 0.85 31.69
2330 8011 1.82 1.82 33.51
2331 1909 0.43 0.43 33.95
2332 17 0.00 0.00 33.95
4207 109320 24.82 24.82 58.77
4209 123 0.03 0.03 58.79
5115 35685 8.10 8.10 66.89
5116 1346 0.31 0.31 67.20
5117 162 0.04 0.04 67.24
5118 105 0.02 0.02 67.26
5120 3048 0.69 0.69 67.95
5121 843 0.19 0.19 68.14
5123 67753 15.38 15.38 83.52
5124 8723 1.98 1.98 85.50
7149 5632 1.28 1.28 86.78
7151 46 0.01 0.01 86.79
7154 362 0.08 0.08 86.87
7155 10219 2.32 2.32 89.19
7160 28 0.01 0.01 89.20
7245 785 0.18 0.18 89.38
7246 3520 0.80 0.80 90.18
7247 153 0.03 0.03 90.21
7248 21550 4.89 4.89 95.10
7249 1939 0.44 0.44 95.54
7250 19627 4.46 4.46 100.00
Total 440527 100 100
Table 9. Frequency of detections for individual tagged fish between June 2006 – April 2007.
Code Frequency Percent Valid Percent Cumulative
Percent
863 558 0.13 0.13 0.13
864 3703 0.84 0.84 0.97
865 2286 0.52 0.52 1.49
866 4204 0.95 0.95 2.44
867 8737 1.98 1.98 4.42
868 18502 4.20 4.20 8.62
869 2438 0.55 0.55 9.18
880 2983 0.68 0.68 9.85
881 19 0.00 0.00 9.86
882 50 0.01 0.01 9.87
1202 1762 0.40 0.40 10.27
1203 46 0.01 0.01 10.28
1204 1352 0.31 0.31 10.59
1205 555 0.13 0.13 10.71
1209 285 0.06 0.06 10.78
1213 17078 3.88 3.88 14.65
1216 46 0.01 0.01 14.67
1217 1014 0.23 0.23 14.90
1218 67719 15.37 15.37 30.27
1219 13647 3.10 3.10 33.37
1220 172 0.04 0.04 33.40
1273 4680 1.06 1.06 34.47
1274 1473 0.33 0.33 34.80
1275 12025 2.73 2.73 37.53
1276 16 0.00 0.00 37.53
1277 37492 8.51 8.51 46.05
1278 1189 0.27 0.27 46.32
1279 68276 15.50 15.50 61.81
1280 13 0.00 0.00 61.82
1316 127 0.03 0.03 61.85
1317 52441 11.90 11.90 73.75
1318 178 0.04 0.04 73.79
1319 30408 6.90 6.90 80.69
1320 4678 1.06 1.06 81.75
1321 14877 3.38 3.38 85.13
1322 16096 3.65 3.65 88.79
1323 28455 6.46 6.46 95.25
2155 12186 2.77 2.77 98.01
2158 5669 1.29 1.29 99.30
2159 3092 0.70 0.70 100.00
Total 440527 100 100
Figure 1. Lobster Monitoring Sites in Florida Keys National Marine Sanctuary
Figure 2. Sonic receiver deployment sites; first deployment; (June 2006 - April 2007)within and around Western Sambo Ecological Reserve. The circles around thedeployment site indicate the approximate range of detection (~300 m) of VR2 receiverswith V16 sonic tags. The sonic receivers were arranged into three interlocking rings orzones.
Figure 3. A detailed view of the forereef groove receivers; second deployment; (June -August 2007) and the two mooring balls where we based tagging operations.
Figure 4. Wide view of the forereef receivers; second deployment; (June - August2007).
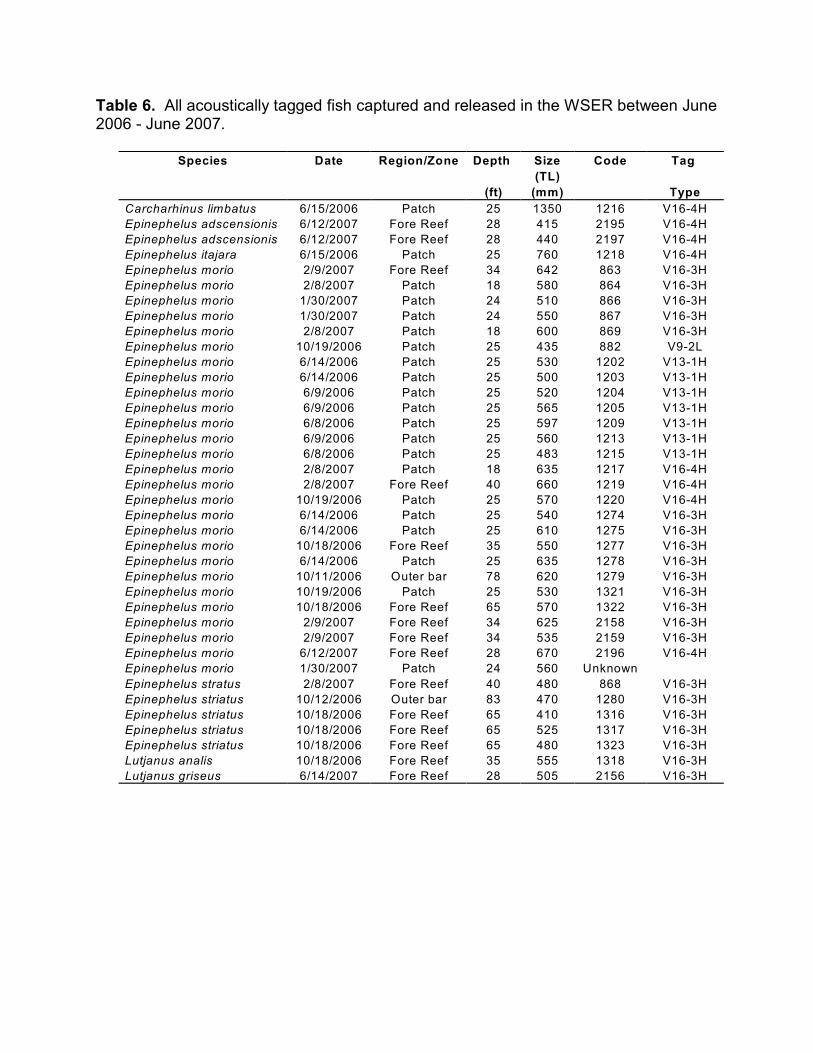
Figure 5. Study sites in Western Sambo Ecological Reserve (WSER) and PelicanShoal (PLS). Habitat strata included forereef, backreef, and offshore patch reefs.
.
Figure 6. Size of legal-sized lobsters in Florida Keys National Marine Sanctuary, duringthe closed fishing season (July) 1997-2006. Reserves are shown in black; referencesare shown in gray.
Figure 7. Size of legal-sized lobsters by year. a) 10 small SPAs; b) small long-termLKS reserve; c) medium-sized CAR SPA; d) large WSER reserve. Light bars =reserves; dark bars = references.
Figure 8. Size of legal-sized spiny lobsters collected in three reserves/references inFlorida Keys National Marine Sanctuary, July 2007. WSER/PEL = Western SamboEcological Reserve/Pelican Shoal; ESB/MSB = Eastern Sambo/Middle Sambo;LKS/MAR = Looe Key SPA/Maryland Shoal.
Figure 9. Abundance of legal-sized lobsters by year. a) 10 small SPAs; b) smalllong-term LKS SPA; c) medium-sized CAR SPA; d) large WSER reserve. Light bars =reserves; dark bars = references.
Figure 10. Area-based abundance estimates for legal-sized spiny lobsters in threereserves/references in Florida Keys National Marine Sanctuary, July 2007. WSER/PEL= Western Sambo Ecological Reserve/Pelican Shoal; ESB/MSB = EasternSambo/Middle Sambo; LKS/MAR = Looe Key SPA/Maryland Shoal.
Figure 11. A typical movement pattern summary for a Hawk Channel reproductivelyactive female during the summer spawning season. This female was 71 mm CL in size,with orange eggs and eroded spermatophore. She made a 6-7 day trip past theforereef late June and returned to Hawk Channel. Then in late July she left the HawkChannel area again. Although forereef receivers did not detect this trip (only onereceiver caught the first trip), the timing of the disappearance from Hawk Channel andlength of disappearance is perfectly consistent with all the other spawning trips.
Figure 12. One of the tagged offshore bar females traveled through the entiredeployment of sonic receivers from south to north. This migration took placepresumably after all spawning had been completed This was a 75 mm CL female withorange eggs and eroded spermatophore at the time of tagging (6/9/06). The migrationinto Hawk Channel took place in the first week of August and covered more than 6 km.
Figure 13. The estimated latitude of a female lobster (100 mm CL with brown eggswhen tagged) by date and time. This female made three detected deep reef tripspresumably to release eggs. Close inspection of the latitude by time reveals that whennot releasing eggs, she often made trips to the back reef beginning just after dark andconcluding around 3am.
Figure 14. Mean total length (+/- 1 sd) of snapper and groupers tagged betweenJune 2006 – June 2007 with the number (n) of fish per species.
Figure 15. Mean latitude position per hour for tag 868 E. striatus (480 mm TL) taggedin the fore reef zone indicating movement across the WSER boundary into open fishingzone.
Figure 16. Estimated location of tag 1319 M. bonaci (760 mm TL) between October2006 – February 2007 with frequency of detection by VR2 receivers in fore reef andoffshore bar areas.