Page 1
PERFORMANCE EVALUATION OF POWER
TRANSMISSION SYSTEM IN BANGLADESH
IN PARTIAL FULFILMENT OF THE REQUIREMENT FOR THE DEGREE
OF MASTER OF SCIENCE IN ELECTRICAL AND ELECTRONIC
ENGINEERING
BY
MD. DARA ABDUS SATTER
ID: 102237-P
DEPARTMENT OF ELECTRICAL AND ELECTRONIC ENGINEERING
DHAKA UNIVERSITY OF ENGINEERING AND TECHNOLOGY
January, 2018
Gazipur, Bangladesh
Page 2
DHAKA UNIVERSITY OF ENGINEERING AND
TECHNOLOGY, GAZIPUR
PERFORMANCE EVALUATION OF POWER
TRANSMISSION SYSTEM IN BANGLADESH
By
Md. Dara Abdus Satter
ID: 102237-P
Supervisor
Dr. Md. Raju Ahmed
Professor
Department of Electrical and Electronic Engineering
IN PARTIAL FULFILMENT OF THE REQUIREMENT FOR THE DEGREE
OF MASTER OF SCIENCE IN ELECTRICAL AND ELECTRONIC
ENGINEERING
January, 2018
Gazipur, Bangladesh
Page 3
Page | ii
The thesis titled “Performance Evaluation of Power Transmission System in Bangladesh” submitted
by Md. Dara Abdus Satter, Student ID: 102237P, Session: 2010-2011 has been accepted as satisfactory
in partial fulfilment for the degree of Master of Science in Electrical & Electronic Engineering on
January 30, 2018.
BOARD OF EXAMINERS
1 ………………….………………………… (Prof. Dr. Md. Raju Ahmed) Head of the Department Department of Electrical & Electronic Engineering Dhaka University of Engineering & Technology, Gazipur
Chairman
(Supervisor) & Member (Ex-officio)
2 ………………….………………………… (Prof. Dr. M. Bashir Uddin) Department of Electrical & Electronic Engineering Dhaka University of Engineering & Technology, Gazipur
Member
3 ………………….………………………… (Prof. Dr. Md. Anwarul Abedin) Department of Electrical & Electronic Engineering Dhaka University of Engineering & Technology, Gazipur
Member
4 ………………….………………………… (Prof. Dr. Md. Saifuddin Faruk) Department of Electrical & Electronic Engineering Dhaka University of Engineering & Technology, Gazipur
Member
5 ………………….………………………… (Prof. Dr. Pran Kanai Saha) Department of Electrical & Electronic Engineering Bangladesh University of Engineering & Technology, Dhaka
Member (External)
Page 4
Page | iii
CERTIFICATION
This is to certify that this thesis work entitled "Performance Evaluation of Power Transmission
System in Bangladesh" submitted by Md. Dara Abdus Satter bearing ID 102237 (P) is a
bonafide thesis work carried out under the supervision and guidance of Professor Dr. Md. Raju
Ahmed and fulfilling the nature and standard required for the partial fulfilment of the degree
of Master of Science in Electrical and Electronic Engineering. The work embodied in this
thesis has not been submitted elsewhere for a degree.
(Md. Dara Abdus Satter)
Student ID: 102237-P
Department of Electrical and Electronic Engineering
Dhaka University of Engineering and Technology, Gazipur
Page 5
Page | iv
ACKNOWLEDGEMENT
I will forever be grateful to the almighty Allah, the king of kings, for giving me grace to
complete this research work. I am very grateful for the unrivalled support I enjoyed from my
amiable supervisor, Professor Dr. Md. Raju Ahmed. His guidance, encouragement and
constructive criticisms of the research work at every stage made it a success. I am also greatly
indebted to Professor Dr. M Shamsul Alam, of Daffodil International University, for his
valuable suggestion and direction to accomplish the study. I am grateful to Engr. Md. Imdadul
Islam, Executive Director, operation and planning of the power grid company of Bangladesh,
for providing advice and support along with necessary data from various departments of PGCB
during whole study period.
My special thanks go to all staff and faculty members, especially Professor Dr. Md. Bashir
Uddin, Professor Dr. Md. Anwarul Abedin and Professor Dr. Md. Saifuddin Faruk of the
Department of Electrical and Electronic Engineering, Dhaka University of Engineering and
Technology, Gazipur.
I cannot but mention the support and encouragement I enjoyed from my family members, very
especially from my parents and wife Mufti Minna. I will also like to mention the
encouragements from my friends and colleagues. I am also grateful to all the batch mates
of the M. Sc, Electrical and Electronic Engineering ‘10 batch.
Page 6
Page | v
ABSTARCT
Availability of electric power has been the most powerful vehicle for facilitating economic,
industrial and social developments of any nation. Electric power is transmitted by means of
transmission lines which deliver bulk power from generating stations to load centers and
consumers. Therefore it is essential to check the performance of power transmission network.
This research efforts to develop the framework and define parameters, which can be used to
evaluate the operational (financial and technical) performance of Bangladesh power
transmission system. A set of performance indicators are selected and used to evaluate the
performance of the Power Grid Company of Bangladesh (PGCB). The selected key
performance parameter comprises system availability indicators (Transmission line and
transformer availability, system average frequency of outages of transmission line and
transformer), transmission system power quality indicators (transmission losses, voltage and
frequency deviation index), supply security indicators (energy not supplied, system minutes
lost), transmission system asset utilization indicators (capacity factor, transmission
transformer utilization factor), financial indicators (Current ratio, interest and debt service
coverage ratio etc.), commercial indicators (account receivable days, revenue growth rate, bad
debts etc.), maintenance cost related indicators and social impact indicators. All these KPI’s
have specific standard equations to measure their value. This thesis also evaluates the selected
key performance indicators (KPIs) during last three fiscal years (2013-2014 to 2015-2016) of
Bangladesh Power Transmission Grid. The obtained results are analyzed and explained in
terms of KPIs. By analyzing these results a company can monitor the trend of different KPIs,
take necessary actions, plan for future expansion, set targets for upcoming years and
comparison can be made with international benchmarks. Ultimately which will help to
improve the transmission system performance. This research may be used as a guideline to
formulate a development plan for Bangladesh power transmission system standardization.
Page 7
Page | vi
TABLE OF CONTENTS
CERTIFICATION ................................................................................................................................ iii
ACKNOWLEDGEMENT .................................................................................................................... iv
ABSTARCT ...........................................................................................................................................v
LIST OF FIGURES ................................................................................................................................x
LIST OF TABLES ............................................................................................................................... xi
LIST OF ABBREVIATIONS ............................................................................................................. xii
CHAPTER 1 INTRODUCTION ...........................................................................................................1
1.1 Prologue ..........................................................................................................................................1
1.2 Literature Review ...........................................................................................................................1
1.3 Problem Statement ..........................................................................................................................4
1.4 Research Objective .........................................................................................................................4
1.5 Possible Outcome ...........................................................................................................................5
1.6 Thesis Outline .................................................................................................................................5
CHAPTER 2 PRESENT STATUS OF BANGLADESH POWER SYSTEM ......................................6
2.1 Introduction.....................................................................................................................................6
2.2 Bangladesh Power System at a Glance ...........................................................................................7
2.3 Electricity Generation .....................................................................................................................8
2.3.1 Generation Capacity ..............................................................................................................9
2.3.2 Forecasted Demand .............................................................................................................11
2.3.3 Generation Planning ............................................................................................................13
2.3.4 Maximum Generation ..........................................................................................................14
2.4 Electricity Distribution .................................................................................................................15
2.5 Electricity Transmission ...............................................................................................................15
2.5.1 Geo Map of Bangladesh Power Transmission Network ......................................................17
2.5.2 Transmission Grid Network.................................................................................................18
2.5.3 Transmission Lines ..............................................................................................................19
2.5.3.1 400 kV transmission lines .....................................................................................19
2.5.3.2 230 kV Transmission Lines ..................................................................................19
Page 8
Page | vii
2.5.3.3 132 kV Transmission Lines ..................................................................................20
2.5.4 Grid Substations ...................................................................................................................25
2.6 Cross Border Electricity Trade .....................................................................................................28
2.7 Steps Taken for Enhancing Power Sector in Bangladesh .............................................................29
2.8 Summary .......................................................................................................................................30
CHAPTER 3 SELECTED KEY PERFORMANCE INDICATORS (KPIS) FOR BANGLADESH
POWER TRANSMISSION SYSTEM .................................................................................................32
3.1 Introduction...................................................................................................................................32
3.2 Identification of Key Performance Indicators (KPIs) ...................................................................32
3.3 Proposed Key Performance Indicators .........................................................................................33
3.3.1 Technical Performance Indicators .......................................................................................34
3.3.2 Financial and Commercial Performance Indicators .............................................................35
3.3.3 Efficiency Performance Indicators ......................................................................................36
3.3.4 Social Impact KPIs ..............................................................................................................36
3.4 Definition of Key Performance Indicators ....................................................................................37
3.4.1 Technical KPIs .....................................................................................................................37
3.4.1.1 Transmission Line Interruption Duration per Year ..............................................37
3.4.1.2 Overall System Unavailability – Transmission Lines ..........................................37
3.4.1.3 Transmission Line Availability ............................................................................38
3.4.1.4 Substation Transformer Interruption Duration per Year ......................................38
3.4.1.5 System Transmission Transformer Unavailability ...............................................38
3.4.1.6 Transmission Transformer Availability ................................................................39
3.4.1.7 System Average Frequency of Outages of Transmission Line per Year ..............39
3.4.1.8 System Average Frequency of Outages of Substation Transformer per Year ......39
3.4.1.9 System Average Frequency of Outages per km....................................................40
3.4.1.10 Average Circuit Outage Duration (ACOD) ........................................................40
3.4.1.11 Average Transformer Outage Duration (ATOD) ...............................................40
3.4.1.12 Transmission Losses ...........................................................................................41
3.4.1.13 Force Outage Rate (FOR) ...................................................................................41
Page 9
Page | viii
3.4.1.14 Energy Not Supplied (ENS) ...............................................................................41
3.4.1.15 Average Interruption Time (AIT) .......................................................................42
3.4.1.16 System Minute Loss (SML) ...............................................................................42
3.4.1.17 System Average Interruption Frequency Index (SAIFI) ....................................42
3.4.1.18 System Average Interruption Duration Index (SAIDI) ......................................42
3.4.1.19 Customer Average Interruption Duration Index (CAIDI) ..................................43
3.4.1.20 Transmission Transformer Utilization Factor ....................................................43
3.4.1.21 Capacity factor (CF) ...........................................................................................43
3.4.1.22 Overall Reliability of System .............................................................................44
3.4.1.23 Incremental Cost per Unit Incremental Energy Transmission (IC/IET) .............44
3.4.1.24 Voltage Deviation Index (VDI) ..........................................................................44
3.4.1.25 Frequency Deviation Index (FDI) ......................................................................44
3.4.2 financial and Commercial KPIs ...........................................................................................45
3.4.2.1 Main camp service profit margin ..........................................................................45
3.4.2.2 Total assets turnover rate ......................................................................................45
3.4.2.3 Sales Growth Rate (SGR) .....................................................................................45
3.4.2.4 Return on RAB .....................................................................................................45
3.4.2.5 Current Ratio ........................................................................................................46
3.4.2.6 Gearing Ratio ........................................................................................................46
3.4.2.7 Interest Service Coverage Ratio ...........................................................................46
3.4.2.8 Debt Service Coverage Ratio ...............................................................................46
3.4.2.9 Accounts Receivable Days ...................................................................................47
3.4.2.10 Bad Debts ...........................................................................................................47
3.4.2.11 Working Capital .................................................................................................47
3.4.2.12 Operating Cost/Sales ..........................................................................................47
3.4.2.13 Revenue Growth rate ..........................................................................................48
3.4.2.14 EBIT or Operating margin ..................................................................................48
3.4.2.15 Transmission Line Maintenance Cost Index (OHTLMCI) .................................48
3.4.2.16 Substation Maintenance Cost Index (SSMCI) ....................................................48
Page 10
Page | ix
3.4.3 Efficiency KPIs ....................................................................................................................49
3.4.3.1 Installed Capacity per employee ...........................................................................49
3.4.3.2 Energy Transmitted Per Employee .......................................................................49
3.4.3.3 Kilometer of Network per Employee ...................................................................49
3.4.3.4 Operating Cost per Employee ...............................................................................49
3.5 Categorize the indicators according to importance .......................................................................50
3.6 Summary .......................................................................................................................................52
CHAPTER 4 CALCULATION AND ANALYSIS IN TERMS OF KPI ...........................................53
4.1 Introduction...................................................................................................................................53
4.2 Calculation and Analysis of Technical KPIs ................................................................................53
4.3 Analysis of Financial and Commercial KPIs ................................................................................69
4.4 Analysis of Efficiency KPIs .........................................................................................................74
4.5 Analysis of Social Impact KPIs ....................................................................................................75
4.6 Overview of the KPI .....................................................................................................................76
4.7 Suggestions to improve .................................................................................................................79
4.8 Summary .......................................................................................................................................80
CHAPTER 5 CONCLUSION AND RECOMMENDATION ............................................................81
5.1 Conclusions...................................................................................................................................81
5.2 Recommendations .........................................................................................................................83
PUBLICATIONS .................................................................................................................................85
REFERENCES .....................................................................................................................................86
APPENDICES ......................................................................................................................................90
Appendix A: Frequency and Voltage quality control ...................................................................90
Appendix B: Outage of Sub-Station Equipment due to Emergency Outages...............................92
Appendix C: Outage of Transmission lines due to Emergency Outages ......................................95
Appendix D: Outage of Sub-Station due to Schedule Outages ....................................................99
Appendix E: Outage of Transmission Lines due to Scheduled Outages ....................................101
Appendix F: Maximum & Minimum Voltages of Grid Sub-Stations ........................................103
Appendix G: Sub-Station Maximum Load .................................................................................106
Appendix H: Transmission System Data ....................................................................................111
Page 11
Page | x
LIST OF FIGURES
Figure No. Title Page No.
Figure 2.1 Power Sector Structure ............................................................................................ 8
Figure 4.1 Transmission line availability (FY 2015-16) ........................................................ 56
Figure 4.2 Transformer availability (FY 2015-16) ................................................................. 56
Figure 4.3 Line and Transformer Availability ........................................................................ 57
Figure 4.4 ACOD and ATOD ................................................................................................. 58
Figure 4.5 Trend of Outages Frequency ................................................................................. 61
Figure 4.6 Force Outage Rate ................................................................................................. 62
Figure 4.7 Trend in SAIFI ...................................................................................................... 62
Figure 4.8 Trend in SAIDI ...................................................................................................... 63
Figure 4.9 Transmission Loss (FY 2015-16) .......................................................................... 63
Figure 4.10 Trends of Transmission Losses ........................................................................... 65
Figure 4.11 Substation Loss .................................................................................................... 66
Figure 4.12 Capacity factor ..................................................................................................... 68
Figure 4.13 Profit margin ........................................................................................................ 70
Figure 4.14 Trend in current ratio ........................................................................................... 70
Figure 4.15 Trend in interest and debt service coverage ratio ................................................ 71
Figure 4.16 Tendency of asset turnover rate and sales growth rate ........................................ 72
Figure 4.17 Accounts receivable ............................................................................................. 72
Figure 4.18 Trends of working capital and operating cost/sales. ........................................... 73
Figure 4.19 Revenue growth rate ............................................................................................ 73
Figure 4.20 Installed capacity and km of network per employee ........................................... 74
Figure 4.21 Energy Transmitted per Employee ...................................................................... 75
Figure 4.22 Operating cost per employee ............................................................................... 75
Page 12
Page | xi
LIST OF TABLES
Table No. Title Page No.
Table 2.1 Present Installed Generation Capacity (owner wise) ..............................................................9
Table 2.2 Installed Capacity of BPDB Power Plants (fuel type) ..........................................................10
Table 2.3 Installed Capacity of BPDB Power Plants (plant type) ........................................................10
Table 2.4 Dreaded Capacity of BPDB Power Plants as on January 2018 ............................................11
Table 2.5 Demand Forecast 2010-2030 ................................................................................................12
Table 2.6 Sector wise short term Power Generation Plan ....................................................................13
Table 2.7 Long term Generation planning ............................................................................................14
Table 2.8 Eleven year maximum generation ........................................................................................14
Table 2.9 Distribution line by company wise (up to FY 2015-2016) ...................................................15
Table 2.10 Summary of the power development plan up to 2020 ........................................................30
Table 3.1 Technical KPIs .....................................................................................................................34
Table 3.2 Financial and Commercial KPIs ...........................................................................................35
Table 3.3 Efficiency KPIs ....................................................................................................................36
Table 3.4 Efficiency KPIs ....................................................................................................................36
Table 4.1 Transmission Line Availability (June’ 16) ...........................................................................54
Table 4.2 Substation Availability (June’ 16) ........................................................................................54
Table 4.3 Interruption duration of transmission lines ...........................................................................55
Table 4.4 Transformer outage duration ................................................................................................55
Table 4.5 Availability Indicators ..........................................................................................................57
Table 4.6 ACOD and ATOD ................................................................................................................58
Table 4.7 Interruption due to substation equipment .............................................................................59
Table 4.8 Interruption due to transmission line problem ......................................................................59
Table 4.9 Reliability KPIs ....................................................................................................................60
Table 4.10 Force Outage Rate ..............................................................................................................61
Table 4.11 Calculated Loss (FY 2013-14) ...........................................................................................64
Table 4.12 Calculated Loss (FY 2014-15) ...........................................................................................64
Table 4.13 Supply security indicators ..................................................................................................67
Table 4.14 Financial Indices .................................................................................................................69
Table 4.15 Commercial Indices ............................................................................................................71
Table 4.16 Efficiency indicators ...........................................................................................................74
Table 4.17 Satisfactory KPIs ................................................................................................................77
Table 4.18 Below Standard KPIs .........................................................................................................78
Page 13
Page | xii
LIST OF ABBREVIATIONS
AC Alternating Current
ACOD Average Circuit Outage Duration
AHP Analytic Hierarchy Process
AID Average Incident Duration
AIT Average Interruption Time
APSCL Ashuganj Power Station Company Ltd
ATOD Average Transformer Outage Duration
ATR Asset Turnover rate
BDT Bangladeshi Taka
BERC Bangladesh Electricity Regulatory Commission
BPDB Bangladesh Power Development Board
CAIDI Customer Average Interruption Duration Index
CAIFI Customer Average Interruption Frequency Index
CEA Canadian Electric Association
CPGCBL Coal based Power Generation Company Bangladesh Ltd
CZPDC Central Zone Power Distribution Company Ltd
DC Direct Current
DESCO Dhaka Electric Supply Company Ltd
DPDC Dhaka Power Division Company Ltd
EBIT Earnings Before Interest and Tax
EGCB Electricity Generation Company of Bangladesh
ENS Energy Not Supplied
FCO Frequency of Transmission Circuit Outages
FDI Frequency Deviation Index
FTO Frequency of Transformer Outages
FVSI Fast voltage stability index
GDP Gross Domestic Product
GOB Government of Bangladesh
HFO Heavy Fuel Oil
HSD High Speed Diesel
HVDC High Voltage Direct Current
IPPs Independent Power Producers
Page 14
Page | xiii
KPA Key Performance Area
KPI Key Performance Indicator
kWHr Kilo Watt- hour
LDC Load Dispatch Center
LOLE LOSS-OF-LOAD-EXPECTATION
LOLP LOSS-OF LOAD PROBABILITY
MIS Management Information System
MPEMR Ministry of Power, Energy and Mineral Resources
MVA Mega Volt Ampere
MW Mega Watt
NWPGCL North West Power Generation Company Ltd
NWZPDCL North West Zone Power Distribution Company Ltd
NZPDC North Zone Power Distribution Company Ltd
OETC Oman Electric Transmission Company
OHTLMCI Overhead Transmission Line Maintenance Cost Indicator
PGCB Power Grid Company of Bangladesh Ltd.
PSMP Power System Master Plan
RAB Regulatory asset base
RE Reciprocating Engine
REB Rural Electrification Board
RPCL Rural Power Company Ltd
SAIDI System Average Interruption Duration Index
SAIFI System Average Interruption Frequency Index
SARI System Average Restoration Index
SGR Sales Growth Rate
SISI System Average Interruption Severity Index
SMCI Substation Maintenance Cost Indicator
SSMCI System Substation Maintenance Cost Indicator
SZPDC South Zone Power Distribution Company Ltd
TB-BM Bus minutes of load interruption
TB-LPLP Bus based transmission loss of load probability
TL-AIDI Transmission lines Average Interruption Duration Index
TL-AIFI Transmission lines Average Interruption Frequency Index
Page 15
Page | xiv
TLMCI Transmission Line Maintenance Cost Indicator
T-LPLP Transmission loss of load probability
TR-AIDI Transformer Average Interruption Duration Index
TR-AIFI Transformer Average Interruption Frequency Index
T-SM System minutes of load interruption due to transmission
VCPI voltage collapse proximity indicators
VDI Voltage Deviation Index
WASP Weigh Automatic System Planning Package
WZPDCO West Zone Power Distribution Company Ltd
Page 16
Page | 1
CHAPTER 1
INTRODUCTION
1.1 PROLOGUE
In today’s modern and energy-hungry world electrical power is one of the most important
issues for sustainable development. It is also required to ensure reliable and affordable
transportation of electrical power from generation to the end users sometimes termed as
prosumer. That is why, power system network is the critical backbone of modern society.
Bangladesh, officially People republic of Bangladesh, is a large populated country and its
current population is 160.995642 million (as per world bank data up to 2015) [1]. Though
total energy consumption per GDP tends to decrease until the middle of the 2020s, it is
expected to turn upward and, in 2041, reach the same level as the actual figure in 2014
(3.42 toe/million BDT) [2]. Bangladesh established a master plan towards achieving the
overall energy sector policy goal. The forecasted/projected demand in 2041 using GDP
Elasticity method (base case) is 51000MW [2]. There need a huge development in power
system to meet this demand. As transmission system is one of the vital parts of power
system, it is essential to assess, monitor and evaluate the performance. By this way we can
rationalize the current efficiency and plan for future.
The objective of this research is to develop the framework and define parameters, which
can be used to evaluate the operational (financial and technical) performance of Bangladesh
power transmission system. In power system master plan 2016 [2] key performance areas
have been selected. Based on energy policy goal, these areas are encourage investment,
growth and financial sustainability of resources, ensure sustainable use of resources and
ensure safe, reliable and security of energy. From these point of view key performance
indicators need to be selected considering financial, commercial, technical, efficiency and
social impact aspect for power transmission system.
1.2 LITERATURE REVIEW
Electricity transmission companies normally measure their performance by using various
types of qualitative and quantitative assessments. They measure achievements of their
Page 17
Page | 2
objectives through monitoring number of performance indicators. Performance Indicators
are the parameters that are related to transmission lines or transformers availability, service
continuity or voltage wave. The indicators for the present technical performance of the
transmission system are useful when planning the future developments to ensure a high
degree of reliability of the transmission system.
Reliability is considered to be a key element in power system operation and planning. The
term ‘power system reliability’ can be defined as a measure of the ability of an electric
power system to provide acceptable electricity supply [3].
Methods for power system reliability evaluation have been developed over the past 40 years
[4–6]. B. Porretta et al. selected adequacy indices T-LPLP (Transmission loss of load
probability), TB-LPLP (Bus based transmission loss of load probability), T-SM (System
minutes of load interruption due to transmission), TB-BM (Bus minutes of load
interruption) in 1991 [7].
CIGRE Study Committee C2 and JWG B3/C2-14 Task Force 02 recommended the Key
Performance Indicators [8] as System Availability Indicators (e.g. Energy Not Supplied
(ENS), Average Interruption Time (AIT), System Minute Lost (SML), Reliability
Indicators (e.g. System Average Interruption Frequency Index (SAIFI), Customer Average
Interruption Frequency Index (CAIFI)), Service Quality Indicators (e.g. System Average
Interruption Duration Index (SAIDI), Customer Average Interruption Duration Index
(CAIDI), Average Incident Duration (AID) etc.), maintenance quality indicators (e.g.
OHTLMCI, SSMCI).
Samir and Hamed used the indicators SAIFI, SAIDI, SARI and SISI by way of performance
evaluation of transmission system in Egypt [9]. Reducing the values of SAIFI and SAIDI
over years reflect the improvement of the interruption performance. Higher the value of
SARI indicates the supply restoration required long time.
Oman Electric Transmission Company (OETC) analyze Operational and Safety
performance, Financial Performance, System Availability and transmission losses as
evaluation performance indicators [10]. Analyzing these indicators they found their system
availability 99.23%, reliability of the system 99.994% and average interruption time 34
minutes in the year 2013 [11].
Page 18
Page | 3
In some cases more specifically indicators for only transmission line and transformers such
as TR-AIFI (Transformer Average Interruption Frequency Index), TR-AIDI (Transformer
Average Interruption Duration Index), TL-AIFI (Transmission lines Average Interruption
Frequency Index), TL-AIDI (Transmission lines Average Interruption Duration Index) are
used to examine transmission system performance. Also requirements of reliability indices
SAIFI, SAIDI and CAIFI threshold defined as “Each one for the twelve months ending on
the second assessment date is less than the three years average” [12].
On the other hand, some cases voltage stability indices such as Line stability index (Lmn),
Fast voltage stability index (FVSI), Line stability factor (Lqp) and voltage collapse
proximity indicators (VCPI) are taken into account for performance evaluation [13]. With
respect to increase in load, line with highest index will be treated as the critical line.
Siqueira and Souza [14] make analysis on interruption frequencies, interruption duration,
Expected demand not supplied (EDNS), Loss of load probabilities (LOLP), Loss of load
expectation (LOLE), CAIFI, CAIDI, Loss of customer probability (LOCP) for evaluating
performance.
At the same time Jako kilter et al. mentioned to evaluate harmonics, flicker, unbalance,
voltage dips and swells, interruptions as benchmarking indices [15]. They recommended to
calculate 95th percentile value of all site indices for harmonics, flicker and unbalance. In
[16], evaluation index system discussed from two point of view, operational or technical
efficiency and economic efficiency. These two are also sub-categorized as Index of
operation efficiency, reliability, equipment utilization, coordination, business efficiency
and social benefits. These index are evaluated by Analytic hierarchy Process (AHP),
increasing the results through consecutive years means the evaluation ranking is fine,
tending to on “good” level [17-18].
Public Utilities Commission of Sri Lanka set performance indicators for measuring the
performance of electrical power transmission system by using various types of qualitative
and quantitative assessments [19]. The commission using Transmission system availability
indicators (e.g. Transmission line interruption duration per year), power quality indicators
(e.g. Frequency and Voltage excursions), supply security indicators (e.g. ENS, SML), asset
utilization and maintenance cost indicators (e.g. TLMCI, SMCI). In Australia, Average
Circuit Outage Duration (ACOD), Frequency of Transmission Circuit Outages (FCO),
Page 19
Page | 4
Average Transformer Outage Duration (ATOD), Frequency of Transformer Outages
(FTO), SAIDI and SAIFI are using as KPI of transmission system performance [20].
1.3 PROBLEM STATEMENT
It is a well-known empirical evidence that electric power grids are inherently prone to
frequent disturbances of different sizes. System and network performance standards are
important issues in modern power system as they ensure the efficient and secure
functioning of the power system and appropriate quality of electricity supply. Therefore
there is a demand for common indicators that enable system operators and others to evaluate
their performance. These indicators measure the reliability of electric power service and
reflect operational problems. Moreover, they can also be used as a tool to compare or
benchmark the power system performance among utilities.
In many countries they have some standard methods to evaluate the performance of
transmission system [21-22]. However, in Bangladesh there is no systematic methods for
evaluating and planning the power transmission system. For that reason research is needed
to develop systematic ways and specific indicators to evaluate the performance of power
transmission system for its standardization and optimal operation of power transmission
system, as well as sustainable development which is the main objective of this research.
This thesis is intended to identify the key performance indicators and their definitions
which are currently used worldwide to assess the technical and financial performance of
transmission systems.
1.4 RESEARCH OBJECTIVE
Through systematic methods, a set of indicators will be determined to evaluate and
standardize the power transmission system to improve the technical and financial
performance.
The specific aims of this research are summarized as follows:
a) To study the structure and status of power transmission system of Bangladesh.
Page 20
Page | 5
b) To review the standard indicators used for performance evaluation of power
transmission system.
c) To identify the key performance indicators (KPIs) for Bangladesh power
transmission system.
d) Finally assess the performance in terms of KPIs with respect to benchmark.
1.5 POSSIBLE OUTCOME
There is no systematic and cumulative methods to evaluate the power transmission system
performance of Bangladesh. It is expected that, a guideline will be available as an output
of this research to formulate a development plan for Bangladesh power transmission system
standardization and this will play an important role in the sustainable development of
energy sector. And as this is the very first research in Bangladesh under this area, this will
work as pioneer for transmission system evaluation and planning.
1.6 THESIS OUTLINE
This thesis consists of five chapters, and the main content of each chapter is described as
follows:
Chapter 1: This chapter introduces the background of key performance indicators for
transmission system evaluation, statement of the problem, objectives and possible outcome
of the research.
Chapter 2: This chapter mainly deals with the present situation and future planning of
Bangladesh power system. Detail of transmission system is described in this chapter.
Chapter 3: The definition and rationale of the selected key performance indicators for
transmission system evaluation is presented in this chapter. The equations for proposed
parameters are given briefly in this section.
Chapter 4: The analysis of calculated result, tables and figures are demonstrated in terms
of key performance indicators (KPIs) in this portion.
Chapter 5: The findings of the study and recommendations are given in this chapter.
Page 21
Page | 6
CHAPTER 2
PRESENT STATUS OF BANGLADESH POWER SYSTEM
2.1 INTRODUCTION
Bangladesh is a country in South Asia. It has made great strides in improving the lives of
its people since gaining independence in 1971.
Bangladesh's energy infrastructure is quite small, insufficient and poorly managed. The per
capita energy consumption in Bangladesh is one of the lowest (407 KWh) in the world [25].
Bangladesh has small reserves of oil and coal, but very large natural gas resources.
Commercial energy consumption is mostly natural gas (around 66%), followed by oil,
hydropower and coal.
Electricity is the major source of power for most of the country's economic activities.
Bangladesh's installed electric generation capacity including Captive Power has increased
to 13,846 + 2,200 = 16,046 MW (as on December’ 2017) [2]; only three-fourth of which is
considered to be ‘available. Present generation of electric power in Bangladesh is not
sufficient to meet the consumers growing demand. So it is not possible to ensure a constant
supply of electric power to all consumers throughout the country. Only 76% of the
population has access to electricity with a per capita availability of 407 kWh per annum,
which is low compared to other developing countries. Problems in the Bangladesh's
electric power sector include corruption in administration, high system losses and delays in
completion of new plants, low plant efficiency, erratic power supply, electricity theft,
blackouts, and shortages of funds for power plant maintenance. Overall, the country's
generation plants have been unable to meet system demand over the past decade. Moreover
the demand is increasing day by day. It is essential to set up more generating station for
over demanding load. Shortage of power is serious problem and strong barrier for the
development of our country. Government of Bangladesh (GOB) has so many limitations to
set up sufficient power station. The current GOB has given top priority to development of
the sector considering its importance in overall development of the country. The GOB has
set the goal of providing electricity to all citizens by 2021. So it is necessary to have a deep
look on transmission system to carry this extra power efficiently.
Page 22
Page | 7
2.2 BANGLADESH POWER SYSTEM AT A GLANCE
Different utilities are working under the guidance of Power Division, Ministry of Power,
Energy and Mineral Resources (MPEMR). Under the jurisdiction of the Ministry of Power,
Energy and Mineral Resources (MPEMR), the Power Division (PD) oversees the whole
electricity utility [23]. It has six generation, one transmission and five distribution entities.
Electricity is generated by the Bangladesh Power Development Board (BPDB), a company
spun off from BPDB, Independent Power Producers (IPPs) and private power producers.
Generated electricity is supplied via the Power Grid Company of Bangladesh’s (PGCB)
power grid and then distributed by Dhaka Power Distribution Company (DPDC) and Dhaka
Electricity Supply Company (DESCO); BPDB and West Zone Power Distribution
Company Limited (WZPDCL) and Palli Bidyuit Samity (PBS) [24]. The organogram of
the power sector of Bangladesh is shown in Fig. 2.1. As transmission system is linking
between generation and distribution, the transmission licensees need to be concerned about
both the generation and distribution as well as transmission system.
Generation:
Bangladesh Power Development Board (BPDB)
Ashuganj Power Station Company Limited (APSCL)
Electricity Generation Company of Bangladesh (EGCB)
North West Power Generation Company Limited (NWPGCL)
Rural Power Company Limited (RPCL)
Coal based Power Generation Company Bangladesh Limited (CPGCBL)
Independent Power Producers (IPPs)
Joint Venture
B-R Power Gen Limited
Transmission:
Power Grid Company of Bangladesh Limited (PGCB)
Distribution:
Bangladesh Power Development Board (BPDB)
Dhaka Electric Supply Company Limited (DESCO)
Dhaka Power Division Company Limited (DPDC)
Page 23
Page | 8
Rural Electrification Board (REB) through
Rural Electric Co-operatives called Palli Bidyut Samati (PBSs),
West Zone Power Distribution Company Limited (WZPDCO)
North West Zone Power Distribution Company Limited (NWZPDCL)
Formation Stage:
North Zone Power Distribution Company Limited (NZPDC)
South Zone Power Distribution Company Limited (SZPDC)
Central Zone Power Distribution Company Limited (CZPDC)
Figure 2.1 Power Sector Structure
2.3 ELECTRICITY GENERATION
Electrification of the capital city Dhaka began in 1901, only 19 years after New York and
13 years after London, by the then Nawab Khwaja Ahsanullah [26]. Later, an Electricity
Directorate was established in East Pakistan in 1948. There were few Steam Turbines in
Siddhirganj (maximum size 10MW), Chittagong and Khulna area at that time. In 1962, 40
MW Kaptai hydro-electric project was installed a 132kV transmission line between Dhaka
and Chittagong was commissioned. In 1971, after the independence of Bangladesh only
Page 24
Page | 9
3% of the population had access to electricity. It has been increased to 59.6% in 2012 [27].
However, 79 % percent of the connected consumers suffer from load-shedding, and 60%
of the consumers face low voltage supply [28].
2.3.1 GENERATION CAPACITY
The total generation capacity of Bangladesh is now 16,046 MW in December, 2017.
Bangladeshi Power sector is mainly divided by two sector, Public and private. The installed
generation capacity of the public sector is 7701 MW that is 56% of the total installed
capacity. On the other hand, it is 6145 in case of private sector that is 44% of the total
installed capacity [4]. The reasons for lower peak generation with respect to generation
capacity is (a) Some plants are out of operation for maintenance, rehabilitation and
overhauling (b) Capacity of some plants derated due to aging and (c) gas shortage. The
owner wise generation capacity mix as on December 2017 is given in Table 2.1.
Table 2.1 Present Installed Generation Capacity (owner wise)
Public Sector Installed Generation Capacity (MW)
BPDB 4627
APSCL 1508
EGCB 622
NWPGCL 718
RPCL 77
BPDB-RPCL JV 149
Subtotal 7,701 (56%)
Private Sector
IPPs 3245
SIPPs (BPDB) 99
SIPPs (REB) 251
15 YR. Rental 169
3/5 YR. Rental 1721
Power Import 660
Subtotal 6,145 (44%)
TOTAL 13,846
Page 25
Page | 10
Also the generation capacity by fuel and plant type is given in Table 2.2 and 2.3
respectively. Though the installed capacity is 16, 046 MW, due to several causes it is
derated to 13, 147 MW which is listed in Table 2.4.
Table 2.2 Installed Capacity of BPDB Power Plants (fuel type)
Plant Type Total Capacity (in MW) Percentage in total
developed power
Gas 8934.00 64.52
HSD 880.00 6.36
HFO 2889.00 20.87
Coal 250.00 1.81
Hydro 230.00 1.66
Imported 660.00 4.77
Renewable 3.00 0.02
Total 13846.00 100%
Table 2.3 Installed Capacity of BPDB Power Plants (plant type)
Plant Type Total Capacity (in MW) Percentage in total
developed power
Steam Turbine (ST) 2194.00 19.12 %
Gas Turbine (GT) 1105.00 9.07 %
Combined Cycle 4959.00 30.29 %
Reciprocating Engine (RE) 4695.00 35.21%
Hydro 230.00 1.75 %
Imported 660.00 4.56 %
Solar PV 3.00 0.02
Total 13846.00 100%
Page 26
Page | 11
Table 2.4 Dreaded Capacity of BPDB Power Plants as on January 2018 [29]
Type Total Capacity (in MW) (%) Percentage in total
developed power
Coal 170.00 1.29 %
F. Oil 0.00 0 %
Gas 8161.00 62.07 %
HFO 2792.00 21.24 %
HSD 1134.00 8.63 %
Hydro 230.00 1.75 %
Imported 660.00 5.02 %
Total 13147.00 100 %
2.3.2 FORECASTED DEMAND
Demand of electricity is increasing rapidly due to enhanced economic activities in the
country with sustained GDP growth. At present growth of demand is about 10% [30] which
is expected to be more in the upcoming year. The maximum demand FY14-15 was 10283
MW [31] (as per PSMP 2010). The electricity development is required to be accelerated to
increase access and attain economic development. According to PSMP- 2016 Study year-
wise peak demand forecast is given in Table 2.5.
Page 27
Page | 12
Table 2.5 Demand Forecast 2010-2030
Fiscal Year Peak Demand (MW)
2010 6,454
2011 6,765
2012 7,518
2013 8,349
2014 9,268
2015 10,283
2016 11,405
2017 12,644
2018 14,014
2019 15,527
2020 17,304
2021 18,838
2022 20,443
2023 21,993
2024 23,581
2025 25,199
2026 26,838
2027 28,487
2028 30,134
2029 31,873
2030 33,708
Page 28
Page | 13
2.3.3 GENERATION PLANNING
Generation Planning is the most important part of the power system and the reliability of
the whole power system depends largely on the reliability of power generating system [3].
The generation in the system should be such that it can supply the demand at all times under
the outage of normal maintenance and forced outage. To develop generation addition
sequence Power System Master Plan of 2016 used PC-based WASP (Weigh Automatic
System Planning Package) and PDPAT software. This software determines least-cost
generation addition sequences based upon the load characteristics, schedule maintenance,
forced outage, and reliability level plant cost etc. The least cost generation addition
sequence includes peak and base load plants of optimum unit size. Since then BPDB has
been using PC-based WASP for generation planning. Annual LOLP (LOSS-OF LOAD
PROBABILITY) of 2% is being used as reliability criteria. The equivalent to about 8
days/year of LOLE (LOSS-OF-LOAD-EXPECTATION).
Indigenous natural gas, coal, nuclear, cross-border trade and hydro resources are mainly
considered for generation planning as fuel. In case of generation plant sitting regional
balance in generation is being given due importance. Other factors such as availability of
fuel, cooling water, transportation of heavy equipment, proximately to grid network and
load center etc. are also considered for plant sitting. Short term and long term generation
planning is given in Table 2.6 and 2.7 respectively [5].
Table 2.6 Sector wise short term Power Generation Plan
Year 2016 2017 2018 2019 2020 2021 Total
Public
sector 1015 1875 1289 1987 2011 750 8927
Privet
sector 481 213 1404 1402 1224 2658 7382
Imported 100 - 500 - - 400 1000
Total 1596 2088 3193 3389 3235 3808 17309
Page 29
Page | 14
Table 2.7 Long term Generation planning
Year Capacity (MW)
2021 24000
2031 40000
2041 60000
2.3.4 MAXIMUM GENERATION
The maximum generation of Bangladesh illustrated in Table 2.8 was 4130 MW in 2007 on
August 17 whereas, it was 7485 MW on 30 June, 2016. The maximum generation of the
history in Bangladesh was 9507 MW on October 18, 2017 [8].
Table 2.8 Eleven year maximum generation
Maximum generation in 2017 9507.00 MW as on 18/10/2017
Maximum generation in 2016 7485.00 MW as on 30/06/2016
Maximum generation in 2015 7349.00 MW as on 13/08/2015
Maximum generation in 2014 6886.00 MW as on 13/07/2014
Maximum generation in 2013 6254.00 MW as on 12/07/2013
Maximum generation in 2012 5999.00 MW as on 01/08/2012
Maximum generation in 2011 4925.50 MW as on 23/08/2011
Maximum generation in 2010 4698.5 MW as on 20/08/2010
Maximum generation in 2009 4296 MW as on 18/09/2009
Maximum generation in 2008 4036.7 MW as on 19/09/2008
Maximum generation in 2007 4130 MW as on 17/09/2007
Maximum generation in history 9507.00 MW as on 18/10/2017
Page 30
Page | 15
2.4 ELECTRICITY DISTRIBUTION
There are 5 Distribution companies in Bangladesh – Bangladesh Power Development
Board (BPDB), Bangladesh Rural Electrification Board (BREB), Dhaka Electric Supply
Company Ltd. (DESCO), Dhaka Power Distribution Company Ltd. (DPDC) and West
Zone Power Distribution Company Ltd. (WZPDC). GOB has taken several project in
different sector to provide electricity to the more consumer with its growing generation. At
present the total distribution line is 384000 circuit kilometer under this 5 companies [5].
The detail of distribution line is given in Table 2.9.
Table 2.9 Distribution line by company wise (up to FY 2015-2016)
Company Name Distribution Line
(Circuit km)
BPDB 41919
BREB 295309
DESCO 4319
DPDC 4698
WZPDC 10936
Total 357118
2.5 ELECTRICITY TRANSMISSION
Power Grid Company of Bangladesh (PGCB) is solely responsible for Operation,
Maintenance and Development of the transmission system of the Country for distribution
of generated electricity. The main operating function of PGCB is wheeling of energy from
BPDB power stations and Generation Companies to Distribution entities utilizing
transmission network. PGCB gets its energy wheeling charge from its clients (distribution
entities) at the rate fixed by Bangladesh Electricity Regulatory Commission (BERC).
Page 31
Page | 16
The PGCB took over about 1144 circuit km of 230 kV lines, 5255 circuit km of 132 kV
lines, six 230/132 kV substation and 63 number of 132/33 kV substations from BPDB and
DESA in different phases [32]. Transmission lines of the company up to June, 2016 stood
at 220.70 circuit km of 400 kV lines, 3185.166 circuit km of 230 kV lines, 6486.83 circuit
km of 132 kV lines and 1 no’s of 400 kV HVDC Back to Back Station, 1 number of
400/230kV substation, one 400/132kV substation, 19 numbers of 230/132 kV substation
and 91 numbers 132/33 KV substation. The company has taken infrastructure development
projects for further development of its operation.
Page 32
Page | 17
2.5.1 GEO MAP OF BANGLADESH POWER TRANSMISSION NETWORK
Page 33
Page | 18
2.5.2 TRANSMISSION GRID NETWORK
Page 34
Page | 19
2.5.3 TRANSMISSION LINES
Transmission system consists of transmission lines and substations. The list of transmission
lines along with length is illustrated in this section [33].
2.5.3.1 400 KV TRANSMISSION LINES
SN Name of Lines Length in
Route km
Length in
Circuit Km
No. of
Circuit Name Size Date of Commissioning
1
HVDC Bheramara-
Bangladesh Border
(Baharampur)
27.35 54.70 Double Twin Finch 1113 MCM 5th October 2013
2 Aminbazar-Meghnaghat 55.00 110.00 Double Quad Egret 636 MCM Commissioned at 230kV,
28th June 2014
3 Comilla(S)- Bangladesh
Border 28.00 56.00 Double Twin Finch 1113 MCM
Commissioned at 132kV,
21th December 2015
Total 110.35 220.70
2.5.3.2 230 KV TRANSMISSION LINES
SN Name of Lines Length in
Route km
Length in
Circuit Km
No. of
Circuit Name Size Date of Commissioning
1 Ghorasal-Ishurdi 175.00 350.00 Double Mallard 795 MCM
2 Tongi - Ghorasal 27.00 54.00 Double Mallard 795 MCM
3 Ghorasal - Ashuganj 44.00 88.00 Double Mallard 795 MCM
4 Raojan - Hathazari 22.50 45.00 Double Twin 300
sq.mm
5 Ashuganj - Comilla North 79.00 158.00 Double Finch 1113 MCM
6 Ghorasal - Rampura 50.00 100.00 Double Twin
Mallard
2x795
MCM
7 Rampura - Haripur 22.00 44.00 Double Twin
Mallard
2x795
MCM
8 Haripur - Meghnaghat 12.50 25.00 Double Twin
Mallard
2x795
MCM
9 Meghnaghat - Hasnabad 24.50 49.00 Double Twin
Mallard
2x795
MCM
10 Comilla North - Hathazari 151.00 302.00 Double Finch 1113 MCM
11 AES, Haripur - Haripur 2.40 4.80 Double Finch 1113 MCM
12 Comilla North - Meghnaghat 58.00 116.00 Double Twin
Mallard
2x795
MCM
Page 35
Page | 20
SN Name of Lines Length in
Route km
Length in
Circuit Km
No. of
Circuit Name Size Date of Commissioning
13 Tongi-Aminbazar 25.20 50.40 Double Twin
AAAC
37/4.176
mm.
14 Aminbazar-Hasnabad 21.50 43.00 Double Twin
AAAC
37/4.176
mm.
15 Siddhirganj 210 MW P/S -
Haripur 1.50 1.50 Single ACSR 600 sq. mm.
16 Ashuganj - Sirajganj 144.00 288.00 Double Twin
AAAC
37/4.176
mm. 23rd November 2007
17 Khulna-Bheramara HVDC 176.50 353.00 Double Twin
AAAC
37/4.176
mm. LILO: 5th October 2013
18 Bheramara HVDC-Ishurdi 10.10 20.20 Double Twin
AAAC
37/4.176
mm.
19 Bogra-Barapukuria 106.00 212.00 Double Twin
AAAC
37/4.176
mm. 28th June 2008
20 Sirajganj-Bogra 72.50 145.00 Double Twin
AAAC
37/4.176
mm. 31st December 2008
21 Ishurdi-Baghabari 55.00 110.00 Double Twin
AAAC
37/4.176
mm.
22 Baghabari-Sirajganj 38.00 76.00 Double Twin
AAAC
37/4.176
mm. 24th April 2009
23 Fenchuganj-Bibiyana 33.19 67.37 Double Twin
Mallard
2x795
MCM
05-10-2012 Single ckt,
31-08-2012 Single ckt.
24 Bibiyana-Comilla(N) 153.55 307.00 Double Twin
Mallard
2x795
MCM 24-10-2012 Single ckt.
25 Aminbazar-Old Airport (O/H) 3.58 7.15 Double Twin
Mallard
2x795
MCM 19-Nov-13
26 Aminbazar-Old Airport (U/G) 4.01 8.03 Double XLPE 2000 sq.
mm. 19-Nov-13
27 Siddhirganj-Maniknagar 11.00 22.00 Double Twin
Mallard
2x795
MCM 17-May-14
28 Bhola-Barisal 62.50 125.00 Double Twin
Mallard
2x795
MCM 18-Jun-15
Total 1586.02 3171.45
2.5.3.3 132 KV TRANSMISSION LINES
SN Name of Lines Length in
Route km
Length in
Circuit Km
No. of
Circuit Name Size Date of Commissioning
1 Shahjibazar-Brahmanbaria 57 114 Double Grosbeak 636 MCM 11th Feb 2011
2 Brahmanbaria-Ashuganj 16.5 33 Double Grosbeak 636 MCM 11th Feb 2011
Page 36
Page | 21
SN Name of Lines Length in
Route km
Length in
Circuit Km
No. of
Circuit Name Size Date of Commissioning
3 Ashuganj-Ghorasal 45.32 90.64 Double Grosbeak 636 MCM
4 Ghorasal-Narsingdi 13.35 13.35 Single Grosbeak 636 MCM
5 Narsingdi-Haripur 34.33 34.33 Single Grosbeak 636 MCM
6 Ghorasal-Bhulta 29.1 29.1 Single Grosbeak 636 MCM
7 Bhulta-Haripur 15.25 15.25 Single Grosbeak 636 MCM
8 Haripur-Siddhirganj 2 4 Double Grosbeak 636 MCM
9 Shahjibazar-Srimangal 36.2 72.4 Double Grosbeak 636 MCM
10 Srimangal-Fenchuganj 49 98 Double Grosbeak 636 MCM
11 Fenchuganj-Fenchuganj PS 3.66 14.64 Four Grosbeak 636 MCM
12 Fenchuganj-Sylhet 31.7 63.4 Double Grosbeak 636 MCM
13 Sylhet-Chhatak 32.9 65.8 Double Grosbeak 636 MCM
14 Kaptai-Hathazari 45 90 Double Grosbeak 636 MCM
15 Hathazari-Feni 85.4 170.8 Double Grosbeak 636 MCM
16 Feni-Comilla (N) 66 132 Double Grosbeak 636 MCM
17 Comilla (N)- Daudkandi 55 110 Double Grosbeak/A
AAC 636 MCM 31st Dec 2010
18 Daudkandi-Sonargaon 61.7 123.4 Double Grosbeak/A
AAC 636 MCM
19 Sonargaon-Haripur 15 30 Double Grosbeak/A
AAC 636 MCM 31st Dec 2010
20 Haripur-Siddhirganj 2.25 4.5 Double Grosbeak 636 MCM
21 Khulshi-Halishahar 13 26 Double Grosbeak 636 MCM
22 Comilla (N)-Chandpur 77.5 77.5 Single Linnet +
Grosbeak
(336.4 +
636) MCM
23 Comilla (N)-Comilla (S) 16 16 Single Grosbeak 636 MCM
24 Comilla (S)-Chandpur 62 62 Single Linnet 336.4 mCM
25 Ashuganj-Kishoreganj 52 104 Double Grosbeak 636 MCM
26 Kishoreganj-Mymensingh 59 118 Double Grosbeak 636 MCM
27 Mymensingh-Jamalpur 55 110 Double Grosbeak 636 MCM
28 Madunaghat-Sikalbaha 16.5 16.5 Single Grosbeak 636 MCM
29 Madunaghat-TKC 8.5 8.5 Single Grosbeak 636 MCM
30 TKC-Sikalbaha 8.5 8.5 Single Grosbeak 636 MCM
31 Sikalbaha-Dohazari 32 64 Double Grosbeak 636 MCM
32 Sikalbaha-Juldah 7.5 7.5 Single AAAC 804 sq.mm
33 Juldah-Halishahar 8 8 Single AAAC 804 sq.mm
34 Khulshi-Baroaulia 15 15 single Grosbeak 636 MCM
35 Khulshi-AKSML 11 11 single Grosbeak 636 MCM
36 AKSML-Baroaulia 4 4 single Grosbeak 636 MCM
37 Madunaghat-Khulshi 13 13 Single Grosbeak 636 MCM
38 Madunaghat-Khulshi 13 13 Single Grosbeak 636 MCM
39 Kaptai-Chandraghona 11.5 23 Double Grosbeak 636 MCM
Page 37
Page | 22
SN Name of Lines Length in
Route km
Length in
Circuit Km
No. of
Circuit Name Size Date of Commissioning
40 Chandraghona-Madunaghat 27 54 Double Grosbeak 636 MCM
41 Madunaghat-Hathazari 10.2 20.4 Double Grosbeak 636 MCM
42 Hathazari-Baroaulia 11 22 Double Grosbeak 636 MCM
43 Dohazari-Cox's Bazar 87 174 Double Grosbeak 636 MCM
44 Feni-Chowmuhani 32 64 Double Grosbeak 636 MCM
45 Baroaulia- Kabir Steel 4 4 Single Grosbeak 636 MCM
46 Mymensingh-Netrokona 34 68 Double Grosbeak 636 MCM
47 Goalpara-Khulna (C) 1.5 3 Double AAAC 804 MCM
48 Khulna (C)-Noapara 22.8 45.6 Double AAAC 804 MCM
49 Noapara-Jessore 27.9 55.8 Double AAAC 804 MCM
50 Jessore-Jhenaidah 47.5 95 Double AAAC 804 MCM
51 Jhenaidah-Kustia 43 86 Double AAAC 804 MCM
52 Kustia-Bheramana 23 46 Double AAAC 804 MCM
53 Bheramara PGCB-Ishwardi 10 20 Double AAAC 804 MCM
54 Ishwardi-Natore 42 84 Double AAAC 804 MCM
55 Natore-Bogra 61 122 Double AAAC 804 MCM
56 Bogra-Palashbari 50 100 Double AAAC 804 MCM
57 Palashbari-Rangpur 52 104 Double AAAC 804 MCM
58 Rangpur-Saidpur 41.5 83 Double AAAC 804 MCM
59 Saidpur-Purbasadipur 24.5 49 Double AAAC 804 MCM
60 Purbasadipur-Thakurgaon 45 90 Double AAAC 804 MCM
61 Goalpara-Bagerhat 45 45 Single AAAC 804 MCM
62 Barisal-Bhandaria 49 49 Single HAWK 477 MCM
63 Bhandaria-Bagerhat 40 40 Single HAWK 477 MCM
64 Bagerhat-Mongla 28 28 Single HAWK 477 MCM
65 Barisal-Patuakhali 38.2 38.2 Single Grosbeak 636 MCM
66 Bheramara PGCB-Faridpur 105 210 Double HAWK 477 MCM
67 Faridpur-Madaripur 65.5 131 Double HAWK 477 MCM
68 Madaripur-Barisal 59 118 Double HAWK 477 MCM
69 Rajshahi-Natore 37 37 Single HAWK 477 MCM
70 Ishwardi-Baghabari 63 63 Single HAWK 477 MCM
71 Baghabari-Shahjadpur 5 5 Single HAWK 477 MCM
72 Ishwardi-Pabna 18 18 Single Grosbeak 636 MCM
73 Pabna-Shahjadpur 41 41 Single Grosbeak 636 MCM
74 Bogra-Sirajganj 66 132 Double Grosbeak 636 MCM
75 Sirajganj-Shahjadpur 34 34 Single Grosbeak 636 MCM
76 Sirajganj-Baghabari 39.7 39.7 Single Grosbeak 636 MCM
77 Rajshahi-Chapai Nawabganj 48 96 Double Grosbeak 636 MCM
78 Rangpur-Lalmonirhat 38 38 Single Grosbeak 636 MCM
79 Bogra-Naogaon 44 88 Double Grosbeak 636 MCM
80 Kabirpur-Tangail 51 102 Double Grosbeak 636 MCM
Page 38
Page | 23
SN Name of Lines Length in
Route km
Length in
Circuit Km
No. of
Circuit Name Size Date of Commissioning
81 Tongi-Mirpur 17 17 Single Grosbeak 636 MCM
82 Tongi-Uttara 14.5 14.5 Single Grosbeak 636 MCM
83 Uttara-Mirpur 8.5 8.5 Single Grosbeak 636 MCM
84 Mirpur-Aminbazar 7 14 Double Grosbeak 636 MCM
85 Aminbazar-Kallayanpur 4 8 Double Grosbeak 636 MCM
86 Hasnabad-Lalbagh 30 30 Single Grosbeak 636 MCM
87 Kamrangirchar-Lalbagh 2.6 2.6 Single Grosbeak 636 MCM
88 Kallayanpur-Kamrangirchar 11 11 Single Grosbeak 636 MCM
89 Kallayanpur-Keraniganj 20 20 Single Grosbeak 636 MCM 15th July 2011
90 Hasnabad-Keraniganj 13.6 13.6 Single Grosbeak 636 MCM
91 Tongi-New Tongi 0.5 1 Double Grosbeak 636 MCM
92 Hasnabad-Sitalakhya 12.6 12.6 Single Grosbeak 636 MCM
93 Madanganj-Sitalakhya 4 4 Single Grosbeak 636 MCM
94 Hasnabad-Shyampur 21 21 Single Grosbeak 636 MCM
95 Shyampur-Haripur 30 30 Single Grosbeak 636 MCM
96 Madanganj-Haripur 12.4 12.4 Single Grosbeak 636 MCM
97 Siddhirganj-Ullon 16 32 Double Grosbeak 636 MCM
98 Haripur-Matuail 5.65 5.65 Single Grosbeak 636 MCM
99 Maniknagar-Matuail 16 16 Single Grosbeak 636 MCM
100 Siddhirganj-Maniknagar 10 10 Single Grosbeak 636 MCM
101 Maniknagar-Bangabhaban 3 6 Double Cu.Cable 240 sq.mm
102 Maniknagar-Narinda 5 10 Double Cu.Cable 240 sq.mm
103 Ullon-Dhanmondi 5.5 11 Double Cu.Cable 240 sq.mm
104 Ullon-Dhanmondi 5.5 11 Double XLPE 500 sq.mm
105 Tongi-Kabirpur 22.5 45 Double Grosbeak 636 MCM
106 Kabirpur-Manikganj 32 64 Double Grosbeak 636 MCM
107 Ullon-Rampura 4 8 Double Grosbeak 636 MCM
108 Rampura-Bashundhara 8 16 Double Grosbeak 636 MCM
109 Bashundhara-Tongi 11 22 Double Grosbeak 636 MCM
110 Rampura-Moghbazar 4.5 9 Double Grosbeak 636 MCM
111 Ghorasal-Joydevpur 28 56 Double Grosbeak 636 MCM
112 Baghabari-Shahjadpur 5.5 5.5 Single Grosbeak 636 MCM
113 Chandpur-Chowmuhani 68 136 Double Grosbeak 636 MCM
114 Barapukuria-Rangpur 42 84 Double Grosbeak 636 MCM
115 Barapukuria-Saidpur 36 72 Double Grosbeak 636 MCM
116 Madaripur-Gopalganj 45 45 Single AAAC 804 MCM
117 Khulna (C)-Khulna(S) 9 18 Double Twin
AAAC
37/4.176
mm.
118 Khulna(S)-Satkhira 47 47 Single AAAC 804 MCM
119 Rajshahi-Natore 40 40 Single Grosbeak 636 MCM
120 Rampura-Gulshan 3.3 6.6 Double XLPE 800 sq.mm
Page 39
Page | 24
SN Name of Lines Length in
Route km
Length in
Circuit Km
No. of
Circuit Name Size Date of Commissioning
121 Sikalbaha-Bakulia 4 8 Double Grosbeak 636 MCM
122 Juldah-Shahmirpur 6 12 Double Grosbeak 636 MCM
123 Khulshi-Bakulia 15 30 Double Grosbeak 636 MCM
124 Haripur-Maniknagar 13 13 Single Grosbeak 636 MCM
125 Joydevpur-Kodda PP 8 16 Double Grosbeak 636 MCM
126 Kodda PP-Kabirpur 10 20 Double Grosbeak 636 MCM
127 Sikalbaha-Shahmirpur 9 18 Double Grosbeak 636 MCM
128 Khulshi-Halishahar (Open
atKhulshi) 13 13 Single Grosbeak 636 MCM
129 BograOld-BograNew 1.5 3 Double Twin
AAAC
37/4.176
mm.
130 Ashuganj-Shahjibazar 53 53 Single Grosbeak 636 MCM 31st August 2009
131 Khulna (S) -Gallamari 4.2 8.4 Double Grosbeak 636 MCM 16th November 2009
132 Naogaon-Niyamatpur 46 46 Single AAAC 804 MCM 2nd January 2010
133 Aminbazar-Savar 15.8 31.6 Double Grosbeak 636 MCM 23rd April 2010
134 Jhenaidah-Magura 26.5 26.5 Single Grosbeak 636 MCM 11th June 2010
135 Jhenaidah-Chuadanga 39.3 39.3 Single Grosbeak 636 MCM 15th October 2010
136 Naogaon-Joypurhat 46.2 46.2 Single Grosbeak 636 MCM 9th November 2010
137 Thakurgaon-Panchagarh 45 45 Single AAAC 636 MCM 25th Dec 2010
138 Sonargaon S/S to Megnaghat
Rental PP 5 10 Double Grosbeak 636 MCM 15th March 2011
139 Shiddhirganj to Siddhirganj
Dutch Bangla PP 2.4 2.4 Single Grosbeak 636 MCM 26th June 2011
140 Goalpara-Khulna © 2.4 2.4 Single XLPE 22th march 2011
141 Noapara PP to Noapara Ss 1.6 1.6 Single Grosbeak Grosbeak 30th Jan 2011
142 Daudkandi PP to Daudkandi
ss 1.3 1.3 Single Grosbeak Grosbeak 1st july 2011
143 Gopalganj PP to Gopalganj ss 1.2 1.2 Single Grosbeak Grosbeak 25th july 2011
144 Shiddhirganj desh energy PP
to Siddhirganj ss 2.5 2.5 Single Grosbeak Grosbeak 26th july 2011
145 Faridpur PP to Faridpur -
Bheramara PGCB 1 1 Single Grosbeak Grosbeak 9th july 2011
146 Bera PP to Baghabari -
Ishwardi line 4.5 4.5 Single Grosbeak Grosbeak 8th july 2011
147 Amnura PP to Rajshahi-
Chapai 12.6 12.6 Single Grosbeak Grosbeak 9th july 2011
148 Madanganj-Munsiganj 4 8 Double Grosbeak Grosbeak
149 Old Airport-Cantonment 6.99 13.98 Double XLPE 800 sq.mm 19-Nov-13
150 Fenchuganj- Kulaura 25 50 Double Grosbeak 636 MCM
Single ckt Commissioned
at 21th July 2014 and
line-2 23rd August 2014
Page 40
Page | 25
SN Name of Lines Length in
Route km
Length in
Circuit Km
No. of
Circuit Name Size Date of Commissioning
151 Jamalpur- Sherpur 20 40 Double Grosbeak 636 MCM Single ckt Commissioned
at 14th July 2014
152 Old Airport-Sajmasjid 8.294 16.588 Double XLPE 800 sq.mm Commissioned at 22nd
November 2014
153 Rampura-Madertek 4.5 9 Double XLPE 500 sq.mm Commissioned at 15th
June 2015
154 Comilla(N)- Comilla(S) 19 38 Double Grosbeak 636 MCM Commissioned at 21th
December 2016
155 Goalpara-Bagerhat New 45 90 Double Grosbeak 636 MCM Commissioned at 11th
April 2016
156
230 Comilla(N)- Hathajari
Double Ckt AKSPL S/S IN-
OUT
13 Double
157
230 Comilla(N)- Hathajari
Double Ckt BSRM S/S IN-
OUT
0.72 Double
Total 3994.89 6500.55
2.5.4 GRID SUBSTATIONS
Substations under Power Grid Company of Bangladesh (PGCB) [34] are listed below:
400 KV SUBSTATIONS
Sl.
No Name of Grid Substation
Transformer Capacity
(MVA)
Total Capacity
(MVA) GMD Grid Circle
1
Bheramara HVDC Back to Back
Station 1 x 500 500 HVDC HVDC
2 HVDC 3x201 603 HVDC HVDC
3 Bibiyana 312/416/520 520 HVDC HVDC
230/132 KV SUBSTATIONS
Sl.
No Name of Grid Substation
Transformer Capacity
(MVA)
Total Capacity
(MVA) GMD Grid Circle
1 Maniknagar 2x300 600 Dhaka(Center) Dhaka South
2 Hasnabad 3x225(10x75) 675 Dhaka(South) Dhaka South
3 Siddhirganj 2x300 600 Dhaka(East) Dhaka South
4 Meghnaghat Switching Dhaka(East) Dhaka South
5 Rampura 3x225(10x75) 675 Dhaka(Center) Dhaka South
6 Haripur 3x225(10x75) 675 Dhaka(East) Dhaka South
7 Agargaon 2x300 600 Dhaka(North-West) Dhaka North
8 Aminbazar 3x225 675 Dhaka(North-West) Dhaka North
Page 41
Page | 26
Sl.
No Name of Grid Substation
Transformer Capacity
(MVA)
Total Capacity
(MVA) GMD Grid Circle
9 Tongi 3x225(10x75) 675 Dhaka(North) Dhaka North
10 Hathazari 4x150 600 Chittagong(North) Chittagong
11 BSRM 2 x 130/140 280 Chittagong(Private) Chittagong
12 AKSML 1 x 80, 2x 130/150 380 Chittagong(Private) Chittagong
13 Fenchuganj 1x300 300 Srimangal Comilla
14 Comilla(N) 2x225 450 Comilla Comilla
15 Khulna(S) 2x225(7x75) 450 Khulna Khulna
16 Barisal North (3x75/100)x2 600 Khulna Khulna
17 Sirajganj (Switching) Bogra Bogra
18 Bogra 2x225(7x75) 450 Bogra Bogra
19 Barapukuria 2x225 450 Rangpur Bogra
20 Ishwardi 3x225 675 Ishwardi HVDC
21 Baghabari 1x225(4x75) 225 Ishwardi HVDC
132/33 KV SUBSTATIONS
Sl.
No Name of Grid Substation
Transformer Capacity
(MVA)
Total Capacity
(MVA) GMD Grid Circle
1 Bhulta 1x35/50, 1x50/75 125 Dhaka(East) Dhaka South
2 Hasnabad 3x66/100 300 Dhaka(South) Dhaka South
3 Munsiganj 2x50/75 150 Dhaka(South) Dhaka South
4 Ullon 3x35/50 150 Dhaka(Center) Dhaka South
5 Sonargaon 2x50/75 150 Dhaka(East) Dhaka South
6 Siddhirganj 2x50/83.3 166.6 Dhaka(East) Dhaka South
7 Gulshan 2x80/120 240 Dhaka(Center) Dhaka South
8 Shyampur 4x50/75 300 Dhaka(South) Dhaka South
9 Narsindhi 1x50/75 75 Dhaka(East) Dhaka South
10 Maniknagar 2x50/75 150 Dhaka(Center) Dhaka South
11 Kallyanpur 3x50/75 225 Dhaka(North-West) Dhaka North
12 Joydebpur 2x35/50+1x80/120 220 Dhaka(North) Dhaka North
13 Netrokona 1x25/33+ 2x25/41 115 Mymensingh Dhaka North
14 Manikganj 3x35/50 150 Aricha Dhaka North
15 Jamalpur 3x25/41 123 Mymensingh Dhaka North
16 Satmasjid 2x80/120 240 Dhaka(N-W) Dhaka North
17 Tongi 3x50/75 225 Dhaka(North) Dhaka North
18 Kishoreganj 1x15/20+2x25/41 102 Mymensingh Dhaka North
19 New Tongi 2x50/75 150 Dhaka(North) Dhaka North
20 Savar 2x50/75 150 Dhaka(North-West) Dhaka North
21 Mirpur 1x35/50, 2x50/75 200 Dhaka(North-West) Dhaka North
22 Tangail 2x50/75 150 Dhaka(North) Dhaka North
23 Vhasantek 2x80/120 240 Dhaka(N-W) Dhaka North
24 Kabirpur 2x50/75, 1x50/83 233 Dhaka(North) Dhaka North
25 Mymensingh 3x50/75 225 Mymensingh Dhaka North
Page 42
Page | 27
Sl.
No Name of Grid Substation
Transformer Capacity
(MVA)
Total Capacity
(MVA) GMD Grid Circle
26 Agargaon 2x80/120 240 Dhaka(N-W) Dhaka North
27 Sherpur 2x35/50 100 Mymensingh Dhaka North
28 Codda 3x65/80 240 Mymensingh Dhaka North
29 Madunaghat 2x25/41 82 Madunaghat Chittagong
30 Halishahar 2x44.1/63, 1x48/64 190 Chittagong(Center) Chittagong
31 Chandraghona 2x15/20 40 Madunaghat Chittagong
32 Khulsi 2 x 80/120 240 Chittagong(North) Chittagong
33 Shahmirpur 2x48/64 128 Chittagong(Center) Chittagong
34 Dohazari 2x 50/75 150 Madunaghat Chittagong
35 Bakulia 2 x 48/64+1 x 50/75 203 Chittagong(Center) Chittagong
36 Hathazari 2x50/75 150 Chittagong(North) Chittagong
37 Baroaulia 2x48/64 128 Chittagong(North) Chittagong
38 Cox's bazar 2x25/41 82 Madunaghat Chittagong
39 Julda 1x48/64 64 Chittagong(Center) Chittagong
40 AKSPL 1 x 25/30 30 Chittagong (Private) Chittagong
41 BSRM 1 x 64/80 80 Chittagong (Private) Chittagong
42 T K Complex 1 x 50/75 75 Chittagong (Private) Chittagong
43 MSL 1 x 25/30 30 Chittagong (Private) Chittagong
44 SSML 1 x 25/30 30 Chittagong (Private) Chittagong
45 KSRM 2 x 35/50 50 Chittagong (Private) Chittagong
46 Comilla(S) 2x50/75, 2x25/41 232 Comilla Comilla
47 Chhatak 2x15/20, 1x25/41 81 Srimangal Comilla
48 Chowmuhoni 1x25/41,2x50/75 191 Comilla Comilla
49 Fenchuganj 1x15/20, 1x25/41 61 Srimangal Comilla
50 Shahjibazar 2x25/41 82 Srimangal Comilla
51 Chandpur 2x50/75 150 Comilla Comilla
52 Brahmanbaria 3x25/41 123 Srimangal Comilla
53 Comilla(N) 2x50/75 150 Comilla Comilla
54 Sylhet 2x25/41, 1x50/83 165 Srimangal Comilla
55 Kulaura 2x25/41 82 Srimangal Comilla
56 Feni 2x25/41 82 Comilla Comilla
57 Srimangal 3x15/20 60 Srimangal Comilla
58 Daudkandi 2x50/75 150 Comilla Comilla
59 Goalpara 2x12.5/16.67 33 Khulna Khulna
60 Gopalganj 2x25/41 82 Faridpur Khulna
61 Patuakhali 2x15/20, 1x25/41 81 Barisal Khulna
62 Faridpur 2x50/75 150 Faridpur Khulna
63 Bagerhat 2x25/41 82 Khulna Khulna
64 Khulna( C ) 3x48/64 192 Khulna Khulna
65 Barisal 2x50/75 150 Barisal Khulna
66 Satkhira 2x25/41 82 Khulna Khulna
Page 43
Page | 28
Sl.
No Name of Grid Substation
Transformer Capacity
(MVA)
Total Capacity
(MVA) GMD Grid Circle
67 Madaripur 3x25/41 123 Faridpur Khulna
68 Mongla 2x25/41 82 Khulna Khulna
69 Noapara 2x15/20,44.1/63 103 Khulna Khulna
70 Bhandaria 2x25/41 82 Barisal Khulna
71 Gallamari 2x25/41 82 Khulna Khulna
72 Saidpur 2x25/41,1x35/50 132 Rangpur Bogra
73 Joypurhat 2x25/41 82 Bogra Bogra
74 Chapai Nawabganj 3x15/20,1x25/41 101 Rajshahi Bogra
75 Rangpur 2x50/75,2x10/13.3 176.6 Rangpur Bogra
76 Barapukuria 2x25/41+2x15/20 122 Rangpur Bogra
77 Natore 2x25/41+1x35/50 132 Rajshahi Bogra
78 Naogaon 2x50/75,1x25/41 191 Rajshahi Bogra
79 Purbasadipur 1x25/41+2x15/20+1x50/75 156 Rangpur Bogra
80 Panchagorh 2x25/41 82 Rangpur Bogra
81 Sirajganj 2x25/41+1x15/20+1x35/50 152 Bogra Bogra
82 Lalmonirhat 2x12.5/16.66+4x15/20 113 Rangpur Bogra
83 Niymatpur 2x35/50 100 Rajshahi Bogra
84 Rajshahi 2x50/75,1x35/50 200 Rajshahi Bogra
85 Palashbari 2x25/41+3x15/20 142 Bogra Bogra
86 Thakurgaon 2x25/41 82 Rangpur Bogra
87 Bogra 2x25/41,2x50/75 232 Bogra Bogra
88 Amnura 1x35/50 50 Rajshahi Bogra
89 Jhenaidah 2x25/41 82 Jhenaidah HVDC
90 Chuadanga 2x25/41 82 Jhenaidah HVDC
91 Pabna 2x50/75 150 Ishwardi HVDC
92 Kushtia 2x50/75 150 Jhenaidah HVDC
93 Bheramara PGCB 25/41x2=82 82 Jhenaidah HVDC
94 Shahajadpur 2x15/20+1x35/50+25/41x1 131 Ishwardi HVDC
95 Magura 2x25/41 82 Jhenaidah HVDC
96 Ishwardi 2x10/13.3,1x25/41 81 Ishwardi HVDC
97 Jessore 2x15/20+1x25/41 163.3 Jhenaidah HVDC
2.6 CROSS BORDER ELECTRICITY TRADE
Energy trade including electricity trade with neighbors has tremendous potential for
unlocking Bangladesh's long-term energy constraints in a cost-effective manner. It is very
encouraging for the country people that necessary steps have already been made to initiate
power trade with India.
Page 44
Page | 29
In the short to medium term 560 MW HVDC grid connectivity through Bheramera-
Baharampur [35] has been already in operation. Moreover, 100 MW power is also imported
from Tripura. This cross-border trading with India opens up possibility for power trading
with Nepal and Bhutan as well. A negotiation for power trading with Myanmar is also going
on. Under this process 500 MW hydro power will be traded by 2018 from Myanmar.
2.7 STEPS TAKEN FOR ENHANCING POWER SECTOR IN BANGLADESH
Present Government of Bangladesh has made vision and policy statement regarding power
sector improvement. It is GOB's constitutional responsibility to provide electricity to the
people. In the vision statement it is mentioned that providing access to affordable and
reliable electricity to the majority of the people of Bangladesh by 2020 is a national goal of
the next millennium. For that purpose GOB issued its vision and policy statement on power
sector reforms with the following objectives:
1. To make electricity available to all citizens on demand by the year 2020.
2. Making the power sector financially viable and able to facilitate economic growth.
3. Introducing new corporate culture in the power sector entities and increasing the sector's
efficiency.
4. Improving the reliability and quality of electricity supply.
5. To deliver quality electricity at reasonable and affordable prices with professional service
excellence.
6. To provide specialized skilled services in Operation and Maintenance with outstanding
performance in generation, transmission and distribution for promoting competition among
various power sector entities.
7. To follow international standard and adopt modem technology and practices in power
generation activities.
8. To ensure improved and satisfactory services to the consumers.
A summary of power development plan is stated in Table 2.10.
Page 45
Page | 30
Table 2.10 Summary of the power development plan up to 2020
Year
2004-2005 2005-2007 2008-2012 2013-2020
Installed Capacity,
MW 5,025 6.441 9,666 17,765
Peak Demand, MW 3,743 5,368 7,887 14,600
Net Generation,
MKWh 20,932 26,651 39,157 76,545
Transmission Line,
Km 4,038 4,898 7,180 8,396
Capacity of S/S MVA
(a) 230/132 KV
(b) 132/33 KV
4,150 5,950 11,575 19,075
7,644 9,642 17,920 27,367
Distribution Line, Km 2,42,832 2,66,375 3,45,530 4,77,558
No. of Consumers,
million 8.84 9.03 12.75 20.76
No. of Village
Electrified 47,848 52,071 69,571 84,000
Per Capita Generation,
KWh 158 190 260 450
Access to Electricity 38% 47% 65% 100%
Investment
Requirement, (billion
Tk)
0 115 307 575
2.8 SUMMARY
Power transmission system is briefly described in this chapter. As transmission system is
bridging the two major parts, generation and distribution of power system these are also
Page 46
Page | 31
discussed to better understand the necessity of transmission system performance
evaluation. At present Bangladesh transmission system consists of 188 number of lines
with total length of 9892.7 circuit kilometers and 121 grid substations having capacity of
26039.5 MVA.
Page 47
Page | 32
CHAPTER 3
SELECTED KEY PERFORMANCE INDICATORS (KPIS)
FOR BANGLADESH POWER TRANSMISSION SYSTEM
3.1 INTRODUCTION
System and network performance standards are important issues in modern power system
as they ensure the efficient and secure functioning of the power system and appropriate
quality of electricity supply. Therefore there is a demand for common indicators that enable
system operators and others to evaluate their performance. These indicators measure the
reliability of electric power service and reflect operational problems. Moreover, they can
also be used as a tool to compare or benchmark the power system performance among
utilities and generation plants.
The Power Grid Company of Bangladesh (PGCB) is required to continuously monitor and
evaluate the operational performance (i.e. technical and financial) of the transmission
system, towards achieving the overall energy policy goals of the Government of the People
Republic of Bangladesh. This chapter is intended to identify the key performance indicators
and their definitions which are currently used worldwide to assess the technical and
financial performance of transmission systems.
3.2 IDENTIFICATION OF KEY PERFORMANCE INDICATORS (KPIS)
The energy policy goals presented in the Final Draft Energy Policy (2016) are as follows:
Increasing the supply of power generation in line with expected demand;
Creating an enabling environment from increased private sector participation in
energy supply and service provision;
Encouraging and incentivizing more rational, efficient use of energy in public
institutions, and amongst industrial and household end-users;
Ensuring the sustainability of energy exploration, extraction, supply and
consumption so as to prevent damage to the environment and habitats;
Page 48
Page | 33
Promoting safe, efficient and competitive production, procurement, transportation
and distribution of energy;
The above energy policy goals have been used to identify the following Key Performance
Areas (KPAs), for which Key Performance Indicators (KPIs) would be developed to
monitor and assess the performance of the transmission system. Based on the Energy Policy
goals, the following KPAs related to utility operations are identified:
Achieve an efficient sector through higher Productive and Allocative efficiencies;
Encourage investment, growth and financial sustainability of resources;
Ensure sustainable use of resources;
Ensure safe, reliable and security of electrical power supply;
Keep in mind these KPAs the selection of the KPIs would also take cognizance of data
reliability, impact of KPI on performance, whether the KPI can be controlled by the
company, whether indicator is measurable and whether indicator is output-based. The KPIs
have therefore been selected to cover these matters related to the following operational
areas of the transmission system:
Technical;
Financial and Commercial;
Efficiency;
For effective performance monitoring, the KPIs have been categorized as benchmarking
KPIs and tracking KPIs. Benchmarking KPIs refer to indicators which can be benchmarked
based on best industry practice and Tracking KPIs refer to KPIs which are difficult to
benchmark during the initial period of implementation of the performance management.
These indicators can however be tracked over a period.
3.3 PROPOSED KEY PERFORMANCE INDICATORS
The GOB is committed to ensuring access to affordable and reliable electricity for all
citizens by 2021. So KPIs are selected by considering comprehensive energy development
strategy of the GOB. At the initial phase of performance analysis, the selected KPIs need
to be benchmarked carefully for system performance monitoring.
Page 49
Page | 34
3.3.1 TECHNICAL PERFORMANCE INDICATORS
The technical KPIs selected for performance evaluation and monitoring are summarized in
Table 3.1.
Table 3.0
Table 3.1 Technical KPIs
Indicator Remarks
Transmission Line Interruption Duration per Year Benchmark
Overall System Unavailability – Transmission Lines Benchmark
Transmission Line Availability Benchmark
Substation Transformer Interruption Duration per Year Benchmark
System Transmission Transformer Unavailability Benchmark
Transmission Transformer Availability Benchmark
System Average Frequency of Outages of Transmission Line Benchmark
System Average Frequency of Outages of Substation Transformer Benchmark
System Average Frequency of Outages per km Benchmark
Average circuit outage duration Track
Average transformer outage duration Track
Transmission Losses Benchmark
Force Outage Rate (FOR) Track
Energy Not Supplied (ENS) Track
Average Interruption Time (AIT) Track
System Minute Loss (SML) Track
System Average Interruption Duration Index (SAIDI) Benchmark
System Average Interruption Frequency Index (SAIFI) Benchmark
Customer Average Interruption Duration Index (CAIDI) Track
Transmission Transformer Utilization Factor Track
Capacity Factor Benchmark
Overall Reliability of System Benchmark
Incremental Cost per Unit Incremental Energy Transmission Track
Voltage Deviation Index (VDI) Benchmark
Frequency Deviation Index (FDI) Benchmark
Page 50
Page | 35
3.3.2 FINANCIAL AND COMMERCIAL PERFORMANCE INDICATORS
The proposed financial and commercial KPIs for assessing and monitoring the performance
of the licensee are given in Table 3.2.
Table 3.2 Financial and Commercial KPIs
Indicator Remarks
Main camp service profit margin Track
Total Assets Turnover Rate Track
Sales Growth Rate (SGR) Track
Return on RAB Benchmark
EBIT or Operating margin Track
Current Ratio Benchmark
Gearing Ratio Benchmark
Interest Service Coverage Ratio Benchmark
Debt Service Coverage Ratio Benchmark
Accounts Receivable Days Benchmark
Bad Debts Benchmark
Working Capital Track
Operating Cost/Sales Benchmark
Revenue Growth rate Track
Transmission Line Maintenance Cost Index (OHTLMCI) Track
Substation Maintenance Cost Index (SSMCI) Track
Page 51
Page | 36
3.3.3 EFFICIENCY PERFORMANCE INDICATORS
The selected KPIs for monitoring operational efficiency of transmission system are given
in Table 3.3.
Table 3.3 Efficiency KPIs
Indicator Remarks
Energy transmitted per employee Track
Km of Network per employee Track
Operating Cost Per Employee Track
3.3.4 SOCIAL IMPACT KPIS
The proposed KPIs for assessing the social impact of utility performance are shown in
Table 3.4.
Table 3.4 Efficiency KPIs
Indicator Remarks
Number of applications for new connections Track
Number of applications approved per year Track
Number of applications rejected per year Track
Page 52
Page | 37
3.4 DEFINITION OF KEY PERFORMANCE INDICATORS
3.4.1 TECHNICAL KPIS
3.4.1.1 TRANSMISSION LINE INTERRUPTION DURATION PER YEAR
This measures the average time duration (in hour) per year where the transmission line is
not available in service.
UDL =∑ ∑ Hi,j
kti=1
NLj=1
NL (3.1)
Where; UDL = Annual Unavailable Duration (in hours) of a Transmission Line
Hi, j = Duration of Outage “i”, that affected Transmission Line “j” (in hours)
NL = Total number of Transmission Lines
kt = Total number of Outages of Transmission Line “j” during the reported year
3.4.1.2 OVERALL SYSTEM UNAVAILABILITY – TRANSMISSION LINES
This measures the average fraction of time (expressed in percent) that Transmission Lines
are unavailable and disconnected from the Transmission System.
SUL =∑ ∑ Hi,j
kti=1
NLj=1
NL ∗ 8760x100
(3.2)
Where; SUL = System Unavailability (Transmission Lines)
Hi, j = Duration of Outage “i”, that affected Transmission Line “j” (in hours).
NL = Total number of Transmission Lines
kt = Total number of Outages of Transmission Line “j” during the reported year
Page 53
Page | 38
3.4.1.3 TRANSMISSION LINE AVAILABILITY
SAL = (100 - SUL) % (3.3)
Where; SAL = Transmission Line Availability
SUL = System Unavailability (Transmission Lines)
3.4.1.4 SUBSTATION TRANSFORMER INTERRUPTION DURATION PER YEAR
This measures the average time duration (in hour) per year where a single substation
transformer is not available in service.
UDT =∑ ∑ Hi,j
kti=1
NTj=1
NT
(3.4)
Where; UDT = Annual Unavailable Duration (in hours) of a Substation Transformer
Hi, j = Duration of Outage “i”, that affected Substation Transformer “j” (in hours)
NT = Total number of Substation Transformers
kt = Total number of Outages of Substation Transformer “j” during the reported year
3.4.1.5 SYSTEM TRANSMISSION TRANSFORMER UNAVAILABILITY
This can be measured taking the fraction of time (expressed in percent) that Transmission
Transformers are unavailable and disconnected from the Transmission System or by
considering the extent of which the power transformer capacity remained unavailable.
SUT =∑ ∑ Hi,j
kti=1 ∗ CjNL
j=1
TC ∗ 8760x100
(3.5)
Where; SUT = System Unavailability (Substation Transformer)
Hi, j= Duration of Outage “i”, that affected Transmission Transformer “j” (in hours)
Cj= Capacity of Transmission Transformer “j” (in MVA)
Page 54
Page | 39
NT = Total number of Transmission Transformers
kt = Total number of Outages of Transmission Transformer “j” during the reported year
TC = Total Installed Capacity of Substation Transformers (in MVA)
3.4.1.6 TRANSMISSION TRANSFORMER AVAILABILITY
SAT = (100 – SUT) % (3.6)
Where; SAT = Transmission Transformer Availability
SUL = System Unavailability (Substation Transformer)
3.4.1.7 SYSTEM AVERAGE FREQUENCY OF OUTAGES OF TRANSMISSION LINE PER
YEAR
This measures the number of interruptions per year per transmission line of the system.
SAFOL =∑ NOj
NLj=1
NL
(3.7)
Where; SAFOL = System Average Frequency of Outages of Transmission Line per Year
NOj = Number of Outages of Transmission Line “j” during the reported year
NL = Total number of Transmission Lines
3.4.1.8 SYSTEM AVERAGE FREQUENCY OF OUTAGES OF SUBSTATION TRANSFORMER
PER YEAR
This measures the number of interruptions per year per substation transformer of the
system.
SAFOT =∑ NOj
NLj=1
NL
(3.8)
Page 55
Page | 40
Where;
SAFOT = System Average Frequency of Outages of Substation Transformer per Year
NOj = Number of Outages of Transmission Transformer “j” during the reported year
NL = Total number of Transmission Transformers
3.4.1.9 SYSTEM AVERAGE FREQUENCY OF OUTAGES PER KM
This measures the average number of Outages per km of Transmission Lines (Expressed in
number of outages per 100 km of lines)
SAFO_L100 =∑ NOj
NLj=1
∑ LONGjNLj=1
100⁄
x100 (3.9)
Where; SAFO_L100 = System Average Frequency of Outages per 100 km
NOj = Number of Outages of Transmission Line “j” during the reported year
NL = Total number of Transmission Lines
LONGj = Length of Transmission Line “j”
3.4.1.10 AVERAGE CIRCUIT OUTAGE DURATION (ACOD)
ACOD measures the average length of transmission network outages.
ACOD =Sum of Transmission Circuit Outage Minutes
Sum of Transmission Outage (3.10)
3.4.1.11 AVERAGE TRANSFORMER OUTAGE DURATION (ATOD)
ATOD measures the average length of a subset of transmission outages, being those caused
by transformer issues.
ATOD =Sum of Transmission Transformer Outage Minutes
Sum of Transmission Outage (3.11)
Page 56
Page | 41
3.4.1.12 TRANSMISSION LOSSES
Transmission loss level gives an indication of the network operation management of line
losses and efficiency. Even though line losses are caused by the physical properties of the
transmission system, they can nevertheless be controlled through good operational and
management practice, as well as good network design.
Transmission loss
=
{Total metered Energy at the point of Injection − Amount of Energy at
Withdrawal Point}
Total Energy at Point of Injectionx100%
(3.12)
3.4.1.13 FORCE OUTAGE RATE (FOR)
FOR reflects the reliability of equipment, especially transmission lines and transformations
[16].
FOR =tfor
T (3.13)
Where; tfor = force outage duration of equipment;
T = whole operation duration of the equipment in the year.
3.4.1.14 ENERGY NOT SUPPLIED (ENS)
It measures the summation of energy not supplied (interrupted power x duration) due to
interruptions excluding network losses [15].
ENS = ∑ PDi ∗ Hi
kt
i=1
(3.14)
Where; PDi = Power disconnected by transmission circuit interruption “i” (in MW)
𝐻𝑖 = Duration of interruption “i” (in hours)
kt = Total number of interruptions during the reported year
Page 57
Page | 42
3.4.1.15 AVERAGE INTERRUPTION TIME (AIT)
This indicator is recommended by Unipede for use with transmission grids. AIT measures
the total number of minutes that power supply is interrupted during the year.
AIT =8760x60xENS
Annual Electricity demand (MWh) (3.15)
3.4.1.16 SYSTEM MINUTE LOSS (SML)
The system minute is calculated from the quotient
SML =Estimated Energy Not Supplied ∗ 60
System Peak Demand (MW) (3.16)
3.4.1.17 SYSTEM AVERAGE INTERRUPTION FREQUENCY INDEX (SAIFI)
This indicator, which is recommended by the IEEE, measures the average number of
interruptions experienced by each point. All planned and unplanned interruptions are used
in calculating the index. This indicator can be calculated as follows:
SAIFI =Number of Interruption During One Year
Number of Connection points (3.17)
Generally it is calculated in each voltage level.
3.4.1.18 SYSTEM AVERAGE INTERRUPTION DURATION INDEX (SAIDI)
This indicator, also recommended by the IEEE, measures the yearly average interruptions
duration per customer. The following formula is employed for calculating SAIDI.
SAIDI =∑ Duration Of Interruption (Minutes)One Year
0
Number of Connection points (3.18)
The same notes mentioned above for SAIFI are also applicable here for SAIDI.
Page 58
Page | 43
3.4.1.19 CUSTOMER AVERAGE INTERRUPTION DURATION INDEX (CAIDI)
CAIDI measures the yearly average duration of interruptions normalized per affected
customer. An affected customer for transmission licensee is one who experience at least
one interruption during the year. It is represented by the following equation.
CAIDI = SAIDI
SAIFI=
Sum of all customer interruption duration
Total number of customer interruptions (3.19)
3.4.1.20 TRANSMISSION TRANSFORMER UTILIZATION FACTOR
This measures the extent utilization of the transmission transformers with respect to their
rated capacities. It is the ratio of the maximum load on a transformer to its rated capacity
and is represented by the equation below.
𝑈𝐹𝑃𝑘 = ∑ 𝑃𝑗
𝑁𝑇𝑗=1
∑ 𝐶𝑗𝑁𝑗1
𝑥100% (3.20)
Where; UFPk = Transmission Transformer Utilization Factor
Pj = Recorded Peak Load of Transformer “j” (MVA) during reported period
NT = Total number of Substation Transformer
Cj = Rated Capacity of Transformer “j” (MVA)
3.4.1.21 CAPACITY FACTOR (CF)
The KPI gives indication of actual electricity transmitted or wheeled, relative to the
maximum it could wheel at continuous full power operation during the same period. It thus
measures the actual output relative to its potential output. It is defined by
Capacity Factor =MWh transmitted
Designed Capacity x 8760x100% (3.21)
Page 59
Page | 44
3.4.1.22 OVERALL RELIABILITY OF SYSTEM
The overall Reliability of Supply for transmission system is calculated using the formula:
1 − (ENS
Total energy that would have been supplied by the transmission system) x100 (3.22)
Where,
ENS = Estimated Unsupplied Energy due to unavailability of transmission circuits.
3.4.1.23 INCREMENTAL COST PER UNIT INCREMENTAL ENERGY TRANSMISSION
(IC/IET)
This indicator may represent as follows:
Per Unit Energy Transmission Cost in current year −Per Unit Energy Transmmission Cost in last Year
Energy Transmitted in current year −Energy Transmitted in last year
(3.23)
3.4.1.24 VOLTAGE DEVIATION INDEX (VDI)
This KPI can be calculated for tracking the deviation of voltage during a specific period. It
is defined as follows:
VDI% =Number of Hours that Voltage is out of Range During Period
Number of Hours of that Period (3.24)
3.4.1.25 FREQUENCY DEVIATION INDEX (FDI)
Also frequency deviation index can be calculated using following formula:
FDI% =Number of Hours that Frequency is out of Range During Period
Number of Hours of that Period (3.25)
To ensure quality power the system frequency need to maintain at 50 Hz ± 2%.
Page 60
Page | 45
3.4.2 FINANCIAL AND COMMERCIAL KPIS
3.4.2.1 MAIN CAMP SERVICE PROFIT MARGIN
This indicator reflects the profitability of the power grid [16].
PM =Pcore
Inetx100% (3.26)
Where; PM is the profit margin of the core business, Pcore is the profits of the core business,
Inet is the total net income.
3.4.2.2 TOTAL ASSETS TURNOVER RATE
This indicator reflects the operational capability of the power grid.
ATR =Inet
AT (3.27)
Where; ATR is the assets turnover rate, AT is the total assets.
3.4.2.3 SALES GROWTH RATE (SGR)
This indicator measures the output economic efficiency growth of the power system and
reflects the capacity development of the power grid.
SGR =SGn
SGn−1x100% (3.28)
Where; SGR is the sales growth rate, SGn is the increased sales income this year, SGn-1 is
the increased sales income last year.
3.4.2.4 RETURN ON RAB
This indicator is used to ascertain whether the licensee has earned a reasonable return on
its regulatory asset base (RAB). This is computed using EBIT or the operating profit.
Page 61
Page | 46
Return on RAB =Operating Profit or EBIT
Average RABx100% (3.29)
3.4.2.5 CURRENT RATIO
It gives an indication of a company’s ability to meet its short-term financial obligations. It
can be determined by the following formula:
Current ratio =Current Asset
Current liabilities (3.30)
3.4.2.6 GEARING RATIO
It gives an indication of the financial structure of the company regarding the amount of debt
in the capital structure of the firm. It can be measured by:
Gearing Ratio =Long Term Debt
Total Capital (3.31)
3.4.2.7 INTEREST SERVICE COVERAGE RATIO
This gives an indication whether the company has the capacity to pay its interest payments
on its debt. It also measures the number of times a company would be able to make interest
payments on its debts. It therefore gives an index of the financial strength of the company.
It is defined by:
Interest Service Coverage ratio =Operating Profit or EBIT
Interest Payment (3.32)
3.4.2.8 DEBT SERVICE COVERAGE RATIO
It gives an indication of the company’s capacity to meet its interest and principal payments.
This KPI gives an indication of the cash producing ability of the company to cover its debt
payment. A higher debt service cover ratio implies it is more likely for the company to
obtain a loan.
Page 62
Page | 47
Debt Service Coverage ratio =Operating Profit or EBIT
Interest Payment + Principle Payment (3.33)
3.4.2.9 ACCOUNTS RECEIVABLE DAYS
This KPI gives the number of days it takes the company to collect its receivables. It is
therefore a good performance indicator for measuring the company’s revenue collection
effectiveness.
Accounts receivable =Accounts Receivable at end of period x 365 days
Total Electricity Sales for period (3.34)
3.4.2.10 BAD DEBTS
This KPI gives an indication of receivables which have been written off. The indicator is
therefore crucial in the company’s management of outstanding accounts. It therefore
measures the commercial effectiveness of the utility company.
Bad debts =Bad Debt Written Off During Period
Total Revenue for Periodx100% (3.35)
3.4.2.11 WORKING CAPITAL
This KPI is present by the following formula. The operating cost is calculated excluding
power purchase, depreciation and interest payment.
Working Capital =Current Asset − Current liabilities
Total Operating Costx100% (3.36)
3.4.2.12 OPERATING COST/SALES
This is an important indicator because it measures the overall operating efficiency of the
company. For the network sector (i.e. transmission and distribution), this ratio is influenced
by the network characteristics, population density etc. and therefore this benchmark may
Page 63
Page | 48
have to be ‘fine-tuned’ after the initial year of operationalizing the performance
management system.
Operating Cost/Sales =Total Operating Cost
Total Sales Revenuex100% (3.37)
3.4.2.13 REVENUE GROWTH RATE
Revenue growth rate is defined by the following equation
Revenue growth rate = Total revenue yeart+1 − Total revenue year
Total revenue yeart𝑥 100% (3.38)
3.4.2.14 EBIT OR OPERATING MARGIN
Operating margin is calculated using the equation below.
EBIT = {Revenue − (Electricity Purchase + O & M)}x100%
Revenue (3.39)
3.4.2.15 TRANSMISSION LINE MAINTENANCE COST INDEX (OHTLMCI)
This KPI indicates the annual maintenance cost of transmission lines per route length. It
is calculated as follows:
TLMCI =Transmission Line Maintenance Cost
Route Length (km) (3.40)
The OHTLs maintenance works include mainly live line washing and line patrolling.
3.4.2.16 SUBSTATION MAINTENANCE COST INDEX (SSMCI)
This includes all costs within all substations fences and can be calculated as follows:
SSMCI =Sub Station Equipment Maintenance Cost
No. Of CBs + 2xNo. Of Transformers (3.41)
Page 64
Page | 49
The substation maintenance activities include, but not limited to the followings: Daily,
routine, monthly, quarterly, annual, preventive, predictive, break down and emergency
maintenance work for grid stations (including maintenance of all equipment like
transformers, circuit breakers, 220 kV, 132 kV and 33 kV cables (incomer feeders), CT’s,
VT’s, lightning arrester, relays, air conditioning systems, fire systems, etc.) in addition to
civil maintenance works.
3.4.3 EFFICIENCY KPIS
3.4.3.1 INSTALLED CAPACITY PER EMPLOYEE
Installed capacity per employee is the ratio of installed capacity and number of employee.
The unit of this KPI is MW/Employee. It is defined by the following equation.
Installed capacity per employee =Total Installed capacity at end of period
Total Number of employees at end of period (3.42)
3.4.3.2 ENERGY TRANSMITTED PER EMPLOYEE
This is the ratio of total transmitted energy and total employee. MWh/Employee is its
unit.
Energy Transmitted Per Employee
=Total amount of transmittedenergy at end of period
Total Number of employees at end of period
(3.43)
3.4.3.3 KM OF NETWORK PER EMPLOYEE
𝑘𝑚 𝑜𝑓 𝑛𝑒𝑡𝑤𝑜𝑟𝑘 𝑝𝑒𝑟 𝑒𝑚𝑝𝑙𝑜𝑦𝑒𝑒 =𝑇𝑜𝑡𝑎𝑙 𝑙𝑒𝑛𝑔𝑡ℎ 𝑜𝑓 𝑛𝑒𝑡𝑤𝑜𝑟𝑘 𝑖𝑛 𝑘𝑚
𝑇𝑜𝑡𝑎𝑙 𝑁𝑢𝑚𝑏𝑒𝑟 𝑜𝑓 𝑒𝑚𝑝𝑙𝑜𝑦𝑒𝑒𝑠 (3.44)
3.4.3.4 OPERATING COST PER EMPLOYEE
The ratio of operating cost and employee is defined as operating cost per employee and it
is represent as percentage value.
Page 65
Page | 50
Operating cost per employee
=Total Operating Cost (excluding power purchase, depreciation and interest)
Total Number of employees at end of period𝑥100
(3.45)
3.5 CATEGORIZE THE INDICATORS ACCORDING TO IMPORTANCE
All the proposed key performance indicators are relevant for Bangladesh power
transmission system as they have been selected considering the socio-economic
requirements of the country. But Bangladesh is a developing country. It is difficult to
ruminate all these indicators at the starting stage of system evaluation and standardization.
Rather than these may be classify according to their significance of relevancy. At initial
stage the following KPIs may be grouped as the top most important.
Transmission Line Availability
Transmission Transformer Availability
System Average Frequency of Outages of Transmission Line
System Average Frequency of Outages of Substation Transformer
System Average Frequency of Outages per km
Average circuit outage duration
Average transformer outage duration
Transmission Losses
Energy Not Supplied (ENS)
System Minute Loss (SML)
Voltage Deviation Index (VDI)
Frequency Deviation Index (FDI)
Current Ratio
Interest Service Coverage Ratio
Debt Service Coverage Ratio
Accounts Receivable Days
Bad Debts
Working Capital
Return on RAB
Page 66
Page | 51
Then in second phase the key performance indicators need to be analyzed and developed
are considered as second most important for Bangladesh power transmission system. These
are given below.
Average Interruption Time (AIT)
System Average Interruption Duration Index (SAIDI)
System Average Interruption Frequency Index (SAIFI)
Customer Average Interruption Duration Index (CAIDI)
Overall Reliability of System
Capacity Factor
Transmission Transformer Utilization Factor
Force Outage Rate (FOR)
Main camp service profit margin
Total Assets Turnover Rate
Sales Growth Rate (SGR)
Gearing Ratio
Operating Cost/Sales
Revenue Growth rate
For better and complete understanding of the system the following KPIs may be considered
at last level. These indicators are also important to measure the performance of the system.
Transmission Line Maintenance Cost Index (OHTLMCI)
Substation Maintenance Cost Index (SSMCI)
Incremental Cost per Unit Incremental Energy Transmission
Energy transmitted per employee
Km of Network per employee
Operating Cost Per Employee
Number of applications for new connections
Number of applications approved per year
Number of applications rejected per year
Number of people injured during a year
Number of people recovered form injury
Page 67
Page | 52
3.6 SUMMARY
The identified key performance indicators are defined in this section. The technical key
performance indicators selected are Transmission Line and Transformer Availability,
System Average Frequency of Outages of Transmission Line and Substation Transformer,
Average Circuit and Transformer Outage Duration, Transmission Losses, Force Outage
Rate, Energy Not Supplied, System Average Interruption Duration Index, System Average
Interruption Frequency Index, Transmission Transformer Utilization Factor, Capacity
Factor, Overall Reliability of System, Voltage Deviation Index, Frequency Deviation Index
and very new Incremental Cost per Unit Incremental Energy Transmission. The financial
and commercial KPIs are Main Camp Service Profit Margin, Assets Turnover Rate, Sales
Growth Rate, Current Ratio, Gearing Ratio, Interest Service Coverage Ratio, Debt Service
Coverage Ratio, Accounts Receivable Days, Bad Debts, Working Capital, Operating
Cost/Sales, Revenue Growth rate. By analyzing these parameters any licensee can easily
understand their performance in terms of both technical and economical aspect.
Page 68
Page | 53
CHAPTER 4
CALCULATION AND ANALYSIS IN TERMS OF KPI
4.1 INTRODUCTION
Recommended parameters are calculated for Bangladesh Transmission System during last
three fiscal years (FY). The analysis of last three year will offer better outcomes in the
performing services of transmission grid. Results of calculated indicators are summarized
in this section. These results may be used to evaluate the performance of PGCB. And by
analyzing the track of these KPIs, sustainable development and effective expansion plan
can be made for the Transmission System.
4.2 CALCULATION AND ANALYSIS OF TECHNICAL KPIS
The selected KPIs are analyzed from different point of views for better understanding.
These are subdivided into availability indicators, reliability indicators, power quality
indicators, supply security indicators and system asset utilization indicators.
Availability of a Transmission System is expressed as a function of the Transmission
Circuit Outages or Interruptions and it is evaluated using indicators that measure the
number of outages and their durations. Availability Indicators could be measured in terms
of the scheduled (planned) and forced outages separately or in term of overall outages.
These interruptions also could be classified as transient interruptions, long interruptions
(eg. More than 3 minutes) and short interruption (eg. Less than 3 minutes) according to
their duration. Also the Transmission Line availability indices could be measured
categorized in terms of transmission voltage. In this research availability of a Transmission
system is assessed through Overall Performance Indicators.
For calculating availability of transmission line and transformer at first the overall
unavailability of circuit and substation is calculated using formula 4.1 and 4.2 considering
interruption duration of circuit and substation transformer.
𝑆𝑈𝐿 =∑ ∑ 𝐻𝑖,𝑗
𝑘𝑡𝑖=1
𝑁𝐿𝑗=1
𝑁𝐿 ∗ 8760𝑥100 (4.1)
Page 69
Page | 54
𝑆𝑈𝑇 =∑ ∑ 𝐻𝑖,𝑗
𝑘𝑡𝑖=1 ∗ 𝐶𝑗𝑁𝐿
𝑗=1
𝑇𝐶 ∗ 8760𝑥100 (4.2)
Then the availability is determined using equation 4.3 and 4.4.
SAL = (100 - SUL) % (4.3)
SAT = (100 – SUT) % (4.4)
Availability of transmission line and substation calculated for the month of June 2016 is
given in Table 4.1 and 4.2. The data collected for this purpose are given in appendix.
Table 4.0 Table 4.1 Transmission Line Availability (June’ 16)
S/N Circle Name
Total Line
Length
(Ckt-Km)
Total Unserved
(Ckt-Km-Hr)
Types of Interruption Availability
% Forced Scheduled
Time Time
1 Dhaka (North) 1668.42 12.80 12:53:00 31:38:00 99.9989
2 Dhaka (South) 990.29 248.83 39:56:00 24:21:00 99.9651
3 Comilla 2159.74 717.60 14:44:00 83:57:00 99.9600
4 Chittagong 917.00 174.00 72:18:43 471:02:53 99.9900
5 Khulna 1098.13 274.30 2:13:58 30:33:00 99.9653
6 Bogra 1784.68 0.00 0:00:00 15:17:00 99.9600
7 HVDC 1028.00 0.00 2:42:00 11:07:12 100.0000
Total 9646.26 1,427.53 144:47:41 667:56:05 99.9750
Table 4.2 Substation Availability (June’ 16)
S/N Circle Name
Total S/S
Capacity
(MVA)
Total Unserved
Energy (MWh)
Types of Interruption Availability
% Forced Scheduled
Time Time
1 Dhaka (North) 5058.00 0.00 71:55:00 331:21:00 99.9943
2 Dhaka (South) 5031.00 0.00 0:33:00 64:59:00 99.9960
3 Comilla 2961.30 84.08 7:33:00 778:26:00 99.9813
4 Chittagong 3062.00 24.08 25:00:00 4:00:00 99.9900
5 Khulna 2374.32 0.00 11:40:48 56:18:36 100.0000
6 Bogra 3145.60 0.00 2:57:00 21:46:00 100.0000
7 HVDC 2526.30 1511.00 8:51:36 0:00:00 99.8500
Total 24158.52 1,619.16 128:30:24 1256:50:36 99.9787
Page 70
Page | 55
Retrieved data from appendix B, C, D, E for interruption duration, for lines and transformer,
is listed in Table 4.3 and 4.4 respectively.
Table 4.3 Interruption duration of transmission lines
2015-16 2014-15 2013-14
Forced Scheduled Forced Scheduled Forced Scheduled
Month Time Time Month Time Time Month Time Time
Jul-15 241:56:13 541:07:24 July'14 37:19:09 550:44:24 July'13 67:45:00 705:53:00
Aug-15 82:59:00 373:22:48 Aug'14 64:34:46 561:41:48 Aug'13 72:25:00 114:03:12
Sep-15 93:08:00 742:38:00 Sep'14 461:29:12 524:35:36 Sep'13 228:34:24 805:59:48
Oct-15 73:37:13 1191:59:52 Oct'14 106:35:24 484:03:12 Oct'13 119:46:36 2452:41:00
Nov-15 36:10:12 2390:28:00 Nov'14 201:33:48 2780:04:12 Nov'13 42:55:00 1858:37:28
Dec-15 55:41:58 4363:02:24 Dec'14 412:45:36 2779:25:00 Dec'13 51:25:00 1092:11:00
Jan-16 58:05:24 2456:58:24 Jan'15 23:46:48 1532:03:48 Jan'14 66:14:00 1040:27:12
Feb-16 43:15:09 549:38:48 Feb'15 33:55:12 1923:26:36 Feb'14 377:03:36 763:28:36
Mar-16 80:29:48 137:56:48 Mar'15 75:32:47 657:42:12 Mar'14 656:15:00 465:56:36
Apr-16 159:38:24 404:34:12 Apr'15 2112:20:36 376:19:12 Apr'14 114:11:48 1575:26:36
May-16 126:58:36 590:44:48 May'15 1112:22:37 245:46:12 May'14 53:16:24 628:40:00
Jun-16 144:47:41 667:56:05 June'15 96:31:58 444:49:48 June'14 69:24:24 1224:23:12
S. Total 1196:47:38 14410:27:33 S. Total 4738:47:53 12860:42:00 S. Total 1919:16:12 12727:47:40
Total 15607:15:11 Total 17599:29:53 Total 14647:03:52
Table 4.4 Transformer outage duration
2015-16 2014-15 2013-14
Month Forced Scheduled
Month Forced Scheduled
Month Forced Scheduled
Time Time Time Time Time Time
Jul-15 130:24:59 880:58:36 July'14 50:14:24 286:42:24 July'13 17:31:00 513:52:00
Aug-15 66:26:49 645:19:48 Aug'14 61:54:48 5892:32:48 Aug'13 20:17:09 48:42:36
Sep-15 39:17:58 181:06:24 Sep'14 156:48:00 347:25:00 Sep'13 77:03:36 258:46:24
Oct-15 32:56:48 653:00:24 Oct'14 304:19:57 383:19:00 Oct'13 44:52:48 478:37:48
Nov-15 54:52:00 2106:00:12 Nov'14 96:44:48 1548:04:36 Nov'13 21:20:00 1315:49:36
Dec-15 50:26:13 1622:07:24 Dec'14 19:09:00 1237:21:24 Dec'13 11:40:48 1134.26:56
Jan-16 143:00:22 1622:13:00 Jan'15 310:25:12 1312:18:36 Jan'14 12:36:00 1634:21:36
Feb-16 158:03:13 1344:56:24 Feb'15 202:03:48 695:31:00 Feb'14 28:08:27 1523:16:24
Mar-16 75:52:30 372:12:00 Mar'15 157:28:00 1314:02:12 Mar'14 87:09:15 635:40:12
Apr-16 145:31:24 195:14:12 Apr'15 577:37:24 251:56:48 Apr'14 241:28:36 243:29:00
May-16 106:23:48 1263:35:12 May'15 190:33:10 366:45:24 May'14 85:21:24 322:21:48
Jun-16 128:30:24 1256:50:36 June'15 82:14:00 391:05:24 June'14 67:48:00 889:04:36
Total 1131:46:28 12143:34:12 Total 2209:32:31 14027:04:36 Total 715:17:03 7864:02:00
Page 71
Page | 56
Measured availability of transmission line and transformer for each month of the fiscal year
2015-2016 is presented in Fig. 4.1 and 4.2. Figure 4.0
Figure 4.1 Transmission line availability (FY 2015-16)
Figure 4.2 Transformer availability (FY 2015-16)
Page 72
Page | 57
Table 4.5 shows the overall availability KPIs calculated during FY 2013-14, 2014-15 and
2015-16. The higher the value, better the performance.
Table 4.5 Availability Indicators
KPIs 2013-14 2014-15 2015-16
Transformer Availability 99.95% 99.98% 99.99%
Transmission Line
Availability 99.98% 99.97% 99.98%
Availability KPIs are calculated considering all emergency and scheduled interruptions or
outages of PGCB. Fig. 4.3 shows the trend in transmission line and transformer availability
indicators. From figure it is seen that, the availability of transmission transformer has been
increased over consecutive three years. On the other hand, transmission lines availability is
decreased in FY 2014-15 than FY 2013-14 and again increased in FY 2015-16. As per
Australian Competition and Consumer Commission (ACCC) and IEEE 1366 standard, for
good performance of any licensee, the target is 99.66% and internationally accepted initial
benchmark for network availability is 95% [18] for both the line and transformer, which is
already exceeded by PGCB.
Figure 4.3 Line and Transformer Availability
During last financial year the overall availability of India, Bhutan and Oman was 99.72,
94.36 and 99.23 respectively [11], [36]. Transmission line and transformer availability of
Srilanka is 99.78 and 98.93 respectively in last year. At the same time the availability of
Page 73
Page | 58
line and transformer varies from 93.58 to 98.18 and 92.02 to 97.52 respectively for the case
of Ireland. So the availability of Bangladesh grid is comparatively higher. That means
PGCB satisfy the criteria for availability parameters.
Average circuit and transformer outage duration are also considered as availability
parameters. Calculations of average circuit and transformer outage duration is given in
Table 4. 6.
Table 4.6 ACOD and ATOD
KPIs 2013-14 2014-15 2015-16
ACOD (Min) 908 749 778
ATOD (Min) 531 691 661
Fig. 4.4 displays the trend in ACOD and ATOD. It has been observed that average outage
or interruption duration for transmission circuit is in decreasing trend. In contrast to that,
transformer outage duration is in increasing tendency. These two are tracking parameter.
For better and standard performance both ACOD and ATOD should be in decreasing trend.
It is also observed that in case of ACOD Bangladesh is highest among SARC countries in
last year, where the second highest is Srilanka (594 min) and in case of ATOD PGCB is
lowest, where the first is Srilanka with 2765 minutes.
Figure 4.4 ACOD and ATOD
System average frequency of outages for transmission lines and transformers are treated as
reliability indicators. These are calculated considering scheduled, forced and external
outages of the system. Number of interruption recovered from the collected data are
presented in Table 4.7 and 4.8.
Page 74
Page | 59
Table 4.7 Interruption due to substation equipment
FY 2013-14 FY 2014-15 FY 2015-16
Month Forced Scheduled Month Forced Scheduled Month Forced Scheduled
July'13 22 26 July'14 31 24 Jul-15 52 39
Aug'13 34 34 Aug'14 30 43 Aug-15 48 52
Sep'13 51 58 Sep'14 33 36 Sep-15 34 39
Oct'13 25 80 Oct'14 37 41 Oct-15 27 91
Nov'13 27 189 Nov'14 31 147 Nov-15 35 242
Dec'13 19 116 Dec'14 19 138 Dec-15 28 127
Jan'14 21 87 Jan'15 47 66 Jan-16 39 94
Feb'14 21 45 Feb'15 43 61 Feb-16 28 80
Mar'14 43 48 Mar'15 23 57 Mar-16 50 71
Apr'14 63 48 Apr'15 51 42 Apr-16 55 52
May'14 44 25 May'15 65 41 May-16 71 83
June'14 47 49 June'15 54 31 Jun-16 67 86
Total 417 805 Total 464 727 Total 534 1056
Table 4.8 Interruption due to transmission line problem
FY 2013-14 FY 2014-15 FY 2015-16
Month Forced Scheduled Month Forced Scheduled Month Forced Scheduled
July'13 27 23 July'14 40 26 Jul-15 110 52
Aug'13 78 19 Aug'14 50 36 Aug-15 86 56
Sep'13 84 45 Sep'14 80 25 Sep-15 57 35
Oct'13 39 42 Oct'14 70 63 Oct-15 44 59
Nov'13 27 264 Nov'14 112 263 Nov-15 34 251
Dec'13 22 205 Dec'14 40 275 Dec-15 37 379
Jan'14 18 161 Jan'15 32 104 Jan-16 25 276
Feb'14 29 124 Feb'15 52 64 Feb-16 53 107
Mar'14 118 80 Mar'15 48 64 Mar-16 110 27
Apr'14 88 66 Apr'15 148 68 Apr-16 95 51
May'14 73 43 May'15 124 44 May-16 134 72
June'14 52 47 June'15 71 57 Jun-16 79 36
Total 655 1119 Total 867 1089 Total 864 1401
Page 75
Page | 60
Then using these data SAFOL for fiscal year 2015-16 is calculated by the following
equation
𝑆𝐴𝐹𝑂𝐿 =∑ 𝑁𝑂𝑗
𝑁𝐿𝑗=1
𝑁𝐿 (4.5)
=2265
309
= 7.33
Using same methods, measured values for system average frequency of outages for
transmission lines and transformers are shown in Table 4. 9.
Table 4.9 Reliability KPIs
KPIs 2013-14 2014-15 2015-16
SAFOL 6.26 6.54 7.33
SAFOT 11.63 10.82 14.32
SAFO_L100 18.58 20.35 22.9
Tracking of System Average Frequency of Outage for transmission line and transformer
are shown in Fig. 4.5. According to international standard, the range for SAFOL and SAFOT
are 0, 70 and 0, 50 respectively [37]. Also the standard for system average frequency of
outage per kilometers (usually defined per 100 kilometers) is 5, 0 outages/100 km/year.
Though it is seen that the frequency of interruption is swelling over the years, which is not
desired. Although the outage frequency lies between the limits. On the other hand, average
frequency of outages per 100 km is very high compare to the standard and also from
Srilanka which is only 2.91 in last year.
Page 76
Page | 61
Figure 4.5 Trend of Outages Frequency
Force outage rate is one of the reliability indicator. It is a tracking parameter and calculated
by the following formula
𝐹𝑂𝑅 =𝑡𝑓𝑜𝑟
𝑇 (4.6)
For FY 2015-16, Force outage duration of transmission line is 1196:47:38 and
Force outage duration of transformer equipment is 1131:46:28;
So, total force outage duration is 2328.57 hour.
𝐹𝑂𝑅 =2328.57
8760= 0.27
By the same way it has been calculated for three years are given in Table 4.10.
Table 4.10 Force Outage Rate
KPI 2013-14 2014-15 2015-16
FOR 0.30 0.79 0.27
Tracking of Force Outage Rate is represented in Fig. 4.6. It is found very high in FY 2014-
15 with compare to other years, which is abnormal. Though there is no benchmark, the
lower the value of FOR the better the performance of the system. In case of Srilanka the
FOR is 0.22.
Page 77
Page | 62
Figure 4.6 Force Outage Rate
SAIFI and SAIDI are treated as reliability KPI. Fig. 4.7 and 4.8 represents the trend in
SAIFI and SAIDI respectively. To maintain international standard, SAIFI or SAIDI for the
twelve month ending on the second assessment date has to less than the three years average.
According to IEEE 1366, 2001 the target of SAIFI is 1.0, it should be consists between 1
to 5 interruptions per year which is a far from the calculated values. For SAIDI the cap is
90, which is not comparable with the calculated values as this is too high. For Romania the
SAIFI and SAIDI is found 4.96 and 519 respectively. So, in terms of SAIFI and SAIDI the
system is not good.
Figure 4.7 Trend in SAIFI
0
0.1
0.2
0.3
0.4
0.5
0.6
0.7
0.8
0.9
2013-14 2014-15 2015-16
FO
R
Fiscal Year
Page 78
Page | 63
Figure 4.8 Trend in SAIDI
To assess the performance of a transmission system not only the availability or reliability
but also the quality of power must be considered. Power quality indicators shows how the
transmission line parameters comply with the defined standards.
Transmission loss is one of the power quality indicators, which KPI indirectly indicates the
efficiency of the transmission grid. Transmission losses is also calculated by PGCB. This
is calculated from the difference of energy import and export, and represented as
percentage. In this study loss has been calculated from the data collected from two sources.
Figure 4.9 Transmission Loss (FY 2015-16)
Page 79
Page | 64
Firstly as per the difference of total import and export, measured loss for FY 2015-16 is
presented in Fig. 4.9. In this way calculated losses for other two fiscal years are listed in
Table 4.11 and 4.12.
Table 4.11 Calculated Loss (FY 2013-14)
Month Import Energy
wheeled Difference
Monthly
Tx Loss %
Cu.
Import
Cu.
Energy
Wheeled
Difference Cumulative
Tx Loss %
July'13 3,599.15 3,499.28 99.872 2.77 3,599.15 3,499.28 99.87 2.77
Aug'13 3,285.57 3,191.13 94.443 2.87 6,884.72 6,690.41 194.32 2.82
Sep'13 3,314.46 3,221.12 93.340 2.82 10,199.18 9,911.52 287.66 2.82
Oct'13 3,055.39 2,966.80 88.595 2.90 13,254.57 12,878.32 376.25 2.84
Nov'13 2,576.06 2,509.95 66.112 2.57 15,830.64 15,388.27 442.36 2.79
Dec'13 2,497.10 2,435.95 61.144 2.45 18,327.73 17,824.22 503.51 2.75
Jan'14 2,673.62 2,595.31 78.31 2.93 21,001.35 20,419.53 581.82 2.77
Feb'14 2,580.68 2,509.55 71.13 2.76 23,582.03 22,929.08 652.95 2.77
Mar'14 3,380.53 3,274.77 105.754 3.13 26,962.56 26,203.86 758.70 2.81
Apr'14 3,785.93 3,678.33 107.598 2.84 30,748.48 29,882.19 866.30 2.82
May'14 3,688.09 3584.745 103.34 2.80 34,436.57 33,466.93 969.64 2.82
June'14 3,639.24 3536.721 102.522 2.82 38,075.81 37,003.65 1,072.16 2.82
Total 38,075.81 37,003.65 1072.1601 2.82 38,075.81 37,003.65 1,072.16 2.82
Table 4.12 Calculated Loss (FY 2014-15)
Month Import Energy
wheeled Difference
Monthly
Tx Loss %
Cu.
Import
Cu.
Energy
Wheeled
Difference Cumulative
Tx Loss %
July'14 3,953.47 3,839.55 113.922 2.88 3,953.47 3,839.55 113.92 2.88
Aug'14 3,726.97 3,648.48 78.488 2.11 7,680.44 7,488.03 192.41 2.51
Sep'14 3,557.01 3,467.31 89.697 2.52 11,237.45 10,955.34 282.11 2.51
Oct'14 3,437.37 3,342.53 94.841 2.76 14,674.82 14,297.87 376.95 2.57
Nov'14 2,866.36 2,785.38 80.98 2.83 17,541.18 17,083.25 457.93 2.61
Dec'14 2,723.44 2,644.78 78.657 2.89 20,264.61 19,728.03 536.59 2.65
Jan'15 2,870.67 2,789.44 81.23 2.83 23,135.28 22,517.47 617.82 2.67
Feb'15 2,824.29 2,743.41 80.882 2.86 25,959.58 25,260.88 698.70 2.69
Mar'15 3,720.06 3,613.24 106.822 2.87 29,679.64 28,874.12 805.52 2.71
Apr'15 3,475.16 3,367.36 107.8 3.10 33,154.80 32,241.48 913.32 2.75
May'15 4,027.18 3909.84 117.343 2.91 37,181.98 36,151.32 1,030.66 2.77
June'15 4,018.22 3908.61 109.61 2.73 41,200.20 40,059.93 1,140.27 2.77
Total 41,200.20 40,059.93 1140.272 2.77 41,200.20 40,059.93 1,140.27 2.77
Page 80
Page | 65
Trends in transmission losses are shown in fig 4.10. World-wide accepted transmission loss
is less than 3%. From graph it has been observed that transmission losses are in fluctuating
trend though the threshold is not breached. This calculation is done according to the data
collected from PGCB head office in terms of total energy import and export.
Figure 4.10 Trends of Transmission Losses
The loss is related with the length and type of transmission lines. According to the definition
[38], [39], most of all lines of PGCB are short as per length, but long as per voltage level,
which is contradictory. From these point of view, if we consider this as long transmission
lines (line length > 150km and voltage level > 100kV) then loss is actually high with
compared to long transmission lines like in India, which is 4.2% in last year. Also
transmission losses found for Srilanka and Pakistan in last financial year was 3.60 and 2.73
respectively. Though Srilanka still could not meet the limit, Pakistan is maintaining losses
below 3% from the year 2014.
In contrast to that, transmission loss found more than 5 % according to the data collected
from different substations. Substation loss calculated for two sample is given in Fig. 4.11.
From the figure it has been found that simply substation loss is greater than 15 % for two
sample and the variation is abnormal. Whereas transmission loss is the combination of both
the line loss and substation loss. So, there is a major mismatch between two data. Which
indirectly prove that PGCB calculate the loss in a thumb rule rather than using standard
process.
Page 81
Page | 66
Figure 4.11 Substation Loss
Frequency deviation index (FDI) is another indicator for ensuring quality power. Frequency
variation is the deviation of frequency beyond a certain range from the nominal supply
frequency. Any frequency excursions outside these limits for a defined duration or more
(eg. 60 Seconds) could be recorded as frequency limit violations. As per PGCB documents
(appendix A) LDC is responsible for maintaining the system frequency at 50 Hz ± 2% to
ensure quality power to the customer, though there found no data to measure this indicator.
Frequency deviation indices can be defined to find the number of time or duration that the
system frequency goes beyond the allowable range.
To figure out the extent of frequency excursions, frequency ranges can be also defined; (If
the nominal frequency is f) as follows,
1. Normal State: The Transmission System frequency is within the limit of (f ± 1%)
2. Alert State: The Transmission System frequency is beyond the normal operating limit
but within (f ± 2%)
3. Emergency State: There is generation deficiency and frequency is below (f - 2%)
Voltage deviation index (VDI) is another important indices for quality power. Voltage
variation is the deviation of voltage in a certain range. Voltage deviations can be identified
by monitoring the bus bar voltages of the grid substations. As per the quality management
system document (appendix A) PGCB is committed to control voltage within desired level
Page 82
Page | 67
(230kV ± 10% and 132kV ±10%) to ensure quality power. If grid voltages comes down
below the required level, capacitor banks which are connected with 33 kV bus are switched
on automatically, if this is not enough then the capacitor switched on manually, if this step
is not enough generation of MVAR of running generating units are increased, if this step is
also not enough then load control is imposed in the respective areas where voltage is low.
If the grid voltage goes high beyond the required level, there is a different procedure to
remove this. PGCB maintain data only for maximum and minimum voltage (appendix F),
but not the number of hours that the voltage is out of range is measured, which is also
important.
Power system security is the ability of the system to withstand sudden disturbances. To
secure the supply the transmission system must be able to deliver the power even under
abnormal or faulty conditions. ENS, SML, overall reliability are considered system security
indicators. Measured data for energy not supplied, system minute loss and overall reliability
are given in Table 4.13.
Table 4.13 Supply security indicators
KPIs 2013-14 2014-15 2015-16
ENS (MWh) 10458.5 13698.97 17572.76
SML (minutes) 67.70 79.93 92.44
Reliability (%) 99.97253257 99.96675 99.963205
Energy not supplied gives an estimation of the energy not supplied to the connected load
due to the interruption of transmission circuits over a year. Energy not supplied is very high
with compare to the standard and any other countries of the world. The standard is 15 x 10-
5 of the total supplied energy. From calculation it is found three times higher than the
standard. Though for countries like Srilanka and Oman it is 3091.6 MWh and 2027 MWh
respectively, for the developed countries like UK and Ireland it is only 105.01 MWh and
100 MWh respectively. System minutes lost index measures the severity of each system
disturbance relative to the size of the system, in terms of duration of total system wide
blackout. One system minute indicates an equivalent of total system interruption, with the
magnitude of total system peak, for one minute. When this index for a specific incident is
greater than one minute, that incident can be normally classified as a major interruption.
System minute loss is also very high where for Ireland system minute loss is only 0.049. It
Page 83
Page | 68
is seen that, energy not supplied and system minute lost both are in increasing trend, which
represent the ineffectiveness of the system. Reliability means the quality of being
trustworthy. Reliability of a system covers all aspects of ability of the transmission system
to perform its intended function of providing an adequate supply of electrical energy with
reasonable assurance of continuity and quality. In case of overall reliability the standard is
99.9999 and value for reference countries Oman and Romania is 99.994 and 99.999964
respectively. From the analysis it has been observed that the overall reliability of the system
is decreasing over the years, which may cause major blackout in near future. PGCB need
to keep attention to reduce ENS and SML KPIs and increase system reliability.
Asset which directly involve in transmission supply system are very critical for the secure
operation are transmission line and grid substation transformer. Therefore they must be
utilized productively by keeping records of their loading capacities.
Capacity factor, transformer utilization factor are considered as asset utilization indicators.
Transmission transformer asset utilization factor is measured about 60% using the data
from appendix G. Capacity factor tendency is shown in Fig. 4.12. It is found that capacity
factor is about 25%, which mean that only 25% energy is wheeled relative to the maximum
it could wheel at continuous full power operation, though it is increasing slowly.
International benchmark for both transmission and distribution is more that 80%.
Figure 4.12 Capacity factor
21
21.5
22
22.5
23
23.5
2013-14 2014-15 2015-16
Cap
acit
y f
acto
r (%
)
Fiscal Year
Capacity Factor
Page 84
Page | 69
4.3 ANALYSIS OF FINANCIAL AND COMMERCIAL KPIS
Financial and commercial KPIs are equal important to evaluate a system performance. Like
technical KPIs, financial indicators are also calculated using collected data from several
sources of PGCB along with their annual reports [40–42] using specific formula.
As example, the process of measuring debt service coverage ratio for the year 2015-16 is
shown below.
𝐷𝑒𝑏𝑡 𝑆𝑒𝑟𝑣𝑖𝑐𝑒 𝐶𝑜𝑣𝑒𝑟𝑎𝑔𝑒 𝑟𝑎𝑡𝑖𝑜 =Operating Profit or EBIT
Interest Payment + Principle Payment (4.7)
=8517521484
3770190914
= 2.26
In a same process current ratio is calculated by the following equation
𝐶𝑢𝑟𝑟𝑒𝑛𝑡 𝑟𝑎𝑡𝑖𝑜 =Current Asset
Current liabilities
(4.8)
= 17926021935.00
5786529433.00= 3.09
Using these specific equations calculated financial indicators are given in Table 4.14.
Table 4.14 Financial Indices
Parameters 2013-14 2014-15 2015-16
Profit margin (869) 594 448
Return on RAB 4.96 5.53 6.27
Current ratio 0.81 2.58 3.09
Interest service coverage ratio 2.01 2.33 3.92
Debt service coverage ratio 1.11 1.45 2.26
Profit margin is a tracking parameter. For any operator profitability matrices are important
because they highlight points of weakness in the operational model and enable year to year
Page 85
Page | 70
performance comparison. It indirectly shows the company’s financial condition and
prospects of growth. Tendency of main camp service profit margin is shown in Fig. 4.13
which represent abnormal behavior of profit of the company. Every operator have a target
to increase their profit margin.
Figure 4.13 Profit margin
Return on RAB indicator used to ascertain whether the company has earned a reasonable
return on its regulatory asset base. According to international benchmark, return on RAB
have to be greater than 5%. Though it was less in 2013-14, this meet the standard in last
two years.
Fig. 4.14 demonstrates the trend in Current ratio. It gives an indication of the company’s
ability to meet its short term obligations. The value of current ratio is 0.40 and 0.99 for
India and Pakistan respectively. According to international benchmark Current Ratio
should be greater than 1.5 [43] which found satisfactory in FY 2014-15 and 2015-16 for
PGCB.
Figure 4.14 Trend in current ratio
-900
-700
-500
-300
-100
100
300
500
700
2013-14 2014-15 2015-16
Pro
fit
Marg
in (
%)
Fiscal Year
0
0.5
1
1.5
2
2.5
3
3.5
2013-14 2014-15 2015-16
Rat
io
Fiscal Year
Page 86
Page | 71
Interest service coverage ratio (ISCR) serves to measure the company’s ability to meet its
interest payments. The higher the ratio, the more financially stable the company. ISCR less
than 1 suggests the inability of company’s profit serve its interest debts. Basically it is a
tool to judge the capacity of borrower to repay the interest on the loan. Debt service
coverage ratio (DSCR) is slightly more comprehensive. This metrics assess the ability of
the company to meet its minimum principle and interest payments. The higher DSCR
implies it is more likely for the company to obtain a loan. It is more robust indicator of a
company’s financial fitness. Interest and debt service coverage ratio is shown in Fig. 4.15.
The benchmark for interest service coverage ratio and debt service coverage ratio is greater
than 2 and 1.5 respectively. Though both are in increasing trend but these meet the standard
on FY 2015-16 only.
Figure 4.15 Trend in interest and debt service coverage ratio
Table 4.15 shows the calculated commercial parameters during FY 2013-14, 2014-15 and
2015-16.
Table 4.15 Commercial Indices
Indicators 2013-14 2014-15 2015-16
Asset turnover rate (%) (0.25) 0.84 0.89
Sales growth rate (%) 1.49 0.84 5.07
Accounts receivable Days 59.1 60 69.6
Working capital (%) (47.38) 114 156.2
Operating cost/sales (%) 74.8 77.3 61.08
Revenue growth rate (%) 10 8 35
Page 87
Page | 72
Asset turnover rate measures the ability of company to use its assets to generate sales. From
Fig. 4.16 it is observed that, the asset turnover rate has been increased over consecutive
three years. This indicates that, the operational capability of the company is increasing,
however it was negative in FY 2013-14. At the same period sales growth rate are also in
increasing pattern means that the output economic efficiency of the company is growing
[16]. Sales growth rate is a rate at which the company is growing its sales year over year.
Figure 4.16 Tendency of asset turnover rate and sales growth rate
Account receivable days gives the number of days it takes the company to collect its
receivable. Fig. 4.17 displays the trend in accounts receivable days. According to
international benchmark it should be less than 30 days [43]. But for PGCB, it is too high
and also increasing over the years which represents company’s ineffectiveness in revenue
collection.
Figure 4.17 Accounts receivable
50
55
60
65
70
2013-14 2014-15 2015-16
Day
s
Fiscal Year
Page 88
Page | 73
Working capital is a common measure of company’s liquidity, efficiency and overall
health. Positive working capital indicates that a company is able to pay off its short-term
liabilities almost immediately. Negative indicates a company is unable to do so. Working
capital is a tracking parameter and which shows that company’s capital is increasing though
it was negative in FY 2013-14. Fig. 4.18 represents the trend in working capital and
operating cost/sales. On the other hand, operating cost/sales is an operating ratio, shows the
efficiency of company’s management. The smaller the ratio, the greater the operator’s
ability to generate profit. From the result it is found decreasing throughout the years is a
good sign, nevertheless operating cost/sales is too high whereas the standard is less than
20% is still too far to reach for PGCB.
Figure 4.18 Trends of working capital and operating cost/sales.
Tracking status of revenue growth rate is reveals in Fig. 4.19. It is seen that, percentage of
revenue growth has a dramatic changes between FY 2013-14 to 2015-16. This is better than
India for which revenue growth rate is 20%.
Figure 4.19 Revenue growth rate
0
10
20
30
40
2013-14 2014-15 2015-16
Gro
wth
Rat
e (%
)
Fiscal Year
Page 89
Page | 74
4.4 ANALYSIS OF EFFICIENCY KPIS
In terms of the employee of the licensee these are categorized as service efficiency
parameters. Though these are not considered importantly in developing countries like
Bangladesh, but employee satisfaction as well as social impact KPIs are taken as vital issues
in the developed countries. Performance indicators calculated for showing efficiency of
transmission licensee are given in Table 4.16.
Table 4.16 Efficiency indicators
Parameters 2013-14 2014-15 2015-16
Installed Capacity per Employee 8.466116 9.088954 9.326096
Energy Transmitted per Employee 16.07472 16.8887 19.19479
km of Network per Employee 4.052737 4.051341 4.056036
All efficiency indicators are tracking parameter. Trend of installed capacity per employee
and km of network per employee are given in Fig. 4.20. It has been observed that installed
capacity per employee is growing slowly, on the other hand km of network per employee
is found constant over the consecutive years. Though there is no benchmark, it is better to
keep these parameters constant.
Figure 4.20 Installed capacity and km of network per employee
0
2
4
6
8
10
2013-14 2014-15 2015-16
MW
/Km
Fiscal Year
Installed Capacity per Employee Km of Network per Employee
Page 90
Page | 75
Operating cost and energy transmitted per employee is shown in Fig. 4.21 and 4.22. These
indicators are rapidly increasing throughout the years. There need to maintain a correlation
between employee and other parameters. Better if these KPIs maintain a constant standard
set by the licensee.
Figure 4.21 Energy Transmitted per Employee
Figure 4.22 Operating cost per employee
4.5 ANALYSIS OF SOCIAL IMPACT KPIS
Performance indicators related with social effect are also important for network evaluation.
Though third world countries are not very much aware with social affect, these plays a
14
15
16
17
18
19
20
2013-14 2014-15 2015-16
MkW
h
Fiscal Year
260000000
270000000
280000000
290000000
300000000
310000000
320000000
330000000
2013-14 2014-15 2015-16
Mil
lio
n T
k
Fiscal year
Page 91
Page | 76
significant roles for performance analysis in developed countries. Power grid can contribute
to sustainable development, can damage prospects for sustainable development, or, because
grid infrastructure may cover thousands of kilometers, have both types of impacts in
separate places and among separate peoples.
The “E7” Group of utilities describes some of the social benefits of grid networks as
“Optimized electric power systems should improve reliability and quality of service, while
allowing lower tariffs. Lower electricity rates, achieved through regional electricity
cooperation and integration, will foster increased regional growth. The interconnection of
isolated electric power networks throughout a region will enhance rural electrification
programs. Local needs of individuals, families, communities and businesses will be better
met through the increased availability of electricity”. In order to assure that of grid
interconnection results in sustainable development in the region, capacity building may
often be necessary to assure that benefits (and costs) of interconnection are properly
accounted for, and to assure that the interconnection is operated in such a way as to
contribute to sustainable development.
At present PGCB is not considering and keeping data related with these KPIs. But near
future it is necessary to preserve data, calculate and analyze these indicators.
4.6 OVERVIEW OF THE KPI
The selected indicators are calculated and analyzed to evaluate the performance of
Bangladesh power transmission system. A huge data have been collected from several
sources of PGCB and processed to measure the KPIs. Form analysis it has been observed
that performance of PGCB is good in terms of some indicators and not satisfactory with
respect to some indicators. Satisfactory and substandard indicators are listed with their
calculated values in Table 4.17 and 4.18 respectively.
Page 92
Page | 77
Table 4.17 Satisfactory KPIs
KPIs Results
Remarks FY 2013-14 FY 2014-15 FY 2015-16
Transmission Line
Availability (%) 99.98 99.97 99.98 Good
Transformer
Availability (%) 99.95 99.98 99.99 Good
FOR 0.30 0.79 0.27 Satisfactory
ACOD (Minutes) 908 749 778 Satisfactory
Overall Reliability of
System 99.9725 99.9667 99.9632 Satisfactory
ATR (%) (0.25) 0.84 0.89 Satisfactory
SGR (%) 1.49 0.84 5.07 Good
Return on RAB 4.96 5.53 6.27 Satisfactory
Current Ratio 0.81 2.58 3.09 Satisfactory
ISCR 2.01 2.33 3.92 Good
DSCR 1.11 1.45 2.26 Satisfactory
Working Capital (%) (47.38) 114 156.2 Satisfactory
Revenue Growth rate (%) 10 8 35 Good
Page 93
Page | 78
Table 4.18 Below Standard KPIs
KPIs Results
Remarks FY 2013-14 FY 2014-15 FY 2015-16
ENS (MWh) 10458.5 13698.97 17572.76 Not
Satisfactory
SML (Minutes) 67.60 79.93 92.44 Not
Satisfactory
SAIDI (Minutes) 9108 12609 9469 Not
Satisfactory
SAIFI (Number) 19.58 19.55 21.07 Not
Satisfactory
CAIDI 465.16 644.96 449.40 Not
Satisfactory
Transmission Transformer
Utilization Factor (%) 36.7 48.9 60.3
Not
Satisfactory
Capacity Factor (%) 21.7 22.4 23 Not
Satisfactory
SAFOL (Number) 6.26 6.54 7.33 Not
Satisfactory
SAFOT (Number) 11.63 10.82 14.32 Not
Satisfactory
SAFO_L100 (Number) 18.58 10.82 14.32 Not
Satisfactory
ATOD (Minutes) 531 691 661 Not
Satisfactory
Transmission Losses 2.82 2.77 2.86 Not
Satisfactory
Main Camp Service Profit
Margin (869) 594 448
Not
Satisfactory
Accounts Receivable Days 59.1 60 69.6 Not
Satisfactory
Operating Cost/Sales 74.8 77.3 61.08 Not
Satisfactory
Page 94
Page | 79
4.7 SUGGESTIONS TO IMPROVE
From analysis only a very few key performance indicators are found good. Most of the
indicators are satisfactory and below satisfactory. There are a lot of options to improve
further in case of satisfactory indicators. Also special concentration is required to develop
the KPIs which are not satisfactory.
Energy not supplied (ENS), System minute loss (SML), System average interruption
duration index (SAIDI), System average interruption frequency index (SAIFI), Customer
average interruption duration index (CAIDI), System average frequency of outage of
transmission line and transformer all the indicators are related to the outage of lines and
transformer. To make these KPIs good there is no other way to reduce outages. So, the
factors influencing outages need to be developed. Protection system is an internal parameter
to reduce outages. By developing switchgear and protection system these indicators may
be improved.
Many possibilities exist for improving the efficiency as well as transmission loss of the
grid’s system. However, market and policy restraints make some solutions more practical
than others. Advances in higher temperature superconducting technology have reduced
cooling requirements, also reducing their cost of operation. The city of Essen, Germany,
installed a liquid nitrogen-cooled 0.6 mile superconducting cable (the longest in the world
at the time it was installed in 2014) that connects two large transformers. In addition to
nearly eliminating electricity loss, the cable can transport five times more power.
Superconducting cables could also eliminate the need to step up transmission voltages and
make expensive equipment such as transformers no longer necessary. So, this is one of the
solutions though it takes time for implement in Bangladesh. High voltage direct current
transmission lines offer greater efficiencies over the more typical alternating current (AC)
lines. However, the relatively high cost of this approach makes it most practical for long
distance transmission. By avoiding contradiction with transmission line classifications,
length of all the high voltage line need to recheck and modify. Flexible AC Transmission
Systems, or FACTS, can help increase the efficiency of existing power transmission
systems by maintaining acceptable voltage limits. This technology adjusts the amount of
power injected into or absorbed by the power system. FACTS allow AC lines to be loaded
more heavily, increase reliability of the transmission system and mitigate power
Page 95
Page | 80
oscillations. These systems require new control technologies, but do not require any change
to the transmission system materials.
There are only three ways that profit margins can be increased: Increasing revenues and
maintaining costs; maintaining revenues and decreasing costs; and increasing revenues and
decreasing costs. It is better for PGCB to go for the third one considering all aspects of the
country. Both the PGCB and its customer are government’s organization or company. It is
easy to develop a memorandum of understanding between PGCB and distribution
companies under the guidance of ministry to optimize the account receivables.
4.8 SUMMARY
The selected indicators are calculated for Bangladesh transmission system for the fiscal
year 2013-14, 2014-15 and 2015-16 in this chapter. The calculated values are compared
with international standard and reference countries. Mainly Srilanka and India is considered
as reference. In some cases Pakistan, Oman, Jordan, Romania and Bhutan are also
compared. From the analysis a suggestion is developed to standardize the power
transmission system of Bangladesh.
Page 96
Page | 81
CHAPTER 5
CONCLUSION AND RECOMMENDATION
5.1 CONCLUSIONS
It is concluded that the majority of utilities measure their performance by means of cost
evaluation and the final outcome i.e. grid availability and reliability. In order to improve
on this outcome, most utilities (about 60%) already go further by making use of indicators
to evaluate performance. Furthermore, many companies use some form of benchmarking
to compare their indicators or to set targets for their indicators. They also use the trend of
their own indicators when setting targets. However, in Bangladesh there is no systematic
methods to evaluate power transmission system performance.
This thesis has investigated a number of key performance indicators which are classified
as technical key performance indicators subdivided as availability indicators, transmission
system power quality indicators, supply security indicators, transmission system asset
utilization indicators; financial indicators; commercial indicators; efficiency indicators and
social impact indicators. From a lot, total 43 parameters are selected analyzing the prospect
of Bangladesh power system. Some indicators are categorized as benchmarking and some
are tracking.
In terms of availability KPIs, the performance of Bangladesh transmission grid is good, as
the availability for transmission line and transformer both found more than 99.66% in
recent year, which is the limit for good licensee. Also the initial benchmark for line and
transformer availability is 95%. As availability is high force outage rate found is low (0.27
in last FY). System average frequency of outages for transmission line and transformer
(SAFOL and SAFOT) are also found in between standard benchmark range, though these
are in increasing trend. But average frequency of outages per 100 kilometers is very high
compare to international benchmark, which is 5, 0 outages/100 kilometers/year. Where,
SAFO_L100 measured is 18.53, 20.35 and 22.9 respectively for fiscal year 2013-14, 2014-
15 and 2015-16. According to SAIFI and SAIDI, study have found that there is a huge
difference from the standard. As SAFO, SAIDI, SAIFI are treated as reliability KPIs, the
transmission system is said unreliable.
Page 97
Page | 82
Transmission losses is the KPI measured by all licensee to evaluate their performance. In
this study losses have been calculated using data from two sources. According to the data
collected from the MIS, PGCB, the loss measured in terms of the difference of import
energy and wheeled energy, is found 2.82, 2.77 and 2.86% respectively in fiscal year 2013-
14, 2014-15 and 2015-16. If it is less than 3%, then the system might be said best according
to international benchmark, but there found major miss match between the calculated
values. The loss is related with the length and type of transmission lines. According to the
definition, most of all lines of PGCB are short as per length, but long as per voltage level,
which is contradictory. From these point of view, if we consider this as long transmission
lines (line length > 150km and voltage level > 100kV) then loss is actually high which is
found from this study. The calculated loss as per data collected from different grid circle
and substation is found more than 9%. So, it may be conclude that PGCB calculate the loss
using thumb rule rather than standard process. As per appendix F, PGCB is responsible for
maintain voltage within desired level (230kV ± 10% and 132kV ± 10%) and frequency at
50 Hz ± 2% to ensure quality power to the customer. But there is no record where these
parameters can be justified. So, in terms of power quality indicators the performance of the
grid is low. It has been found from the study that, the energy not supplied (ENS) and system
minutes lost (SML) indicators are increasing over the consecutive years. Also the overall
reliability is decreasing. Which indirectly indicates the insecurity of the supply of the
transmission system.
Different financial ratios have been calculated to understand the performance of the system.
Current ratio is found 0.81, 2.58 and 3.09 respectively in FY 2013-14, 2014-15 and 2015-
16. As per international benchmark it is satisfactory. Current ratio is also better than the
neighboring countries like India and Pakistan, which was 0.40 and 0.99 respectively. Also
interest and debt service coverage ratios and return on RAB are meet the standard in the
last year. But the profit behavior of the company is abnormal. From all point of view, the
financial strength of the company is declared as strong.
The company shows a dramatic development in revenue growth in recent years but in case
of accounts receivable and operating cost/sales it could not full fill the benchmark.
Although operational capability, output economic efficiency, working capital of the
company has been increasing, though the licensee is not completely said to be commercially
viable.
Page 98
Page | 83
To assess the performance of the system only increment of profit or availability could not
assure that the company is doable from all aspects. Analysis of all these indicators can
assists system planners to make a reasonable understanding to reinforcement and expansion
planning.
These KPIs and measured data may provide a useful tool for evaluating the operational and
financial performance as well as future planning of Bangladesh transmission system. As
generation is increasing with aggregate demand, the wheeling revenue as well as profit will
increase. The analysis of last three years will offer better outcomes in the performing
services of transmission grid. Also the suggestions can be implemented for better
performance. Changing performance standard, the adjustment of limits allowed, will lead
to an improvement of the quality of transmission system. The obtained results from this
study will serve as a guide for setting benchmarks for standardization of Bangladesh
transmission grid. Which will be helpful to make the company viable from financial,
commercial as well as technical aspects.
5.2 RECOMMENDATIONS
This research recommended to use proposed key performance indicators for PGCB. Since
there is no systematic parameters. Hence by using proposed parameters it has been shown
that performance evaluation and planning can be more easily described. Also it is required
for PGCB to reserve data for calculating gearing ratio, transmission line maintenance cost
index, substation maintenance cost index and bad debt indices. There are still so many areas
in which detail study is required.
There is a major miss match between data collected from different sources. Such as, the
data collected regarding the capacity of grid substation from grid circle and planning
department found a difference of about 1000 MVA. Most of the good utilities reserve the
data for study and analysis. CEA of Canada reserve their data for 25 long years. So this is
also important to find the ways how the Bangladeshi utilities can record the reliable data.
Technical and economic matters are interrelated, so it is necessary to put more emphasis
on engineering economics related study.
From the analysis it is observed that still PGCB has so many areas to develop, especially
accounts receivable days and operating cost indices, as these are very high compared with
Page 99
Page | 84
other utility companies throughout the world, over and above standard. Research can be
done on how to reduce these indicators. Research should be gone about harmonics, flicker
and unbalance. More study is required to reduce the losses, increase the reliability and
security of the system. Also it is suggested to go for energy audit in every year as like
financial audit.
Page 100
Page | 85
PUBLICATIONS
[1] Md. Dara Abdus Satter and Md. Raju Ahmed, “Performance Evaluation of Power
Transmission System in Bangladesh” in 2017 4th IEEE International Conference on
Advances in Electrical Engineering (ICAEE), 28-30 September, 2017, pp. 587–592.
[2] Md. Dara Abdus Satter and Md. Raju Ahmed, “Standard Indices of Power
Transmission System Evaluation: Financial and Commercial Point of View” in 2nd
IEEE International Conference on Electrical & Electronic Engineering (ICEEE), 27-
29, December 2017, Paper ID 114.
[3] Md. Dara Abdus Satter and Md. Raju Ahmed, “Technical and Economic performance
assessment of Bangladesh Power Grid using Key Performance Indicators (KPIs)”
submitted for review in an international peer reviewed Journal.
Page 101
Page | 86
REFERENCES
[1] World Bank Group, “Bangladesh Data.” [Online]. Available:
http://data.worldbank.org/country/bangladesh. [Accessed: 17-Mar-2017].
[2] “Power System master Plan-2016” Power Division, Ministry of Power, Government
of People Republic of Bangladesh.
[3] R. N. Allan and Billinton, Reliability Evaluation of Power Systems. Springer Science
& Business Media, 2013.
[4] A. Kutjuns and Z. Krishans, “Method of transmission power networks reliability
estimation,” in 7th WSEAS International Conference on Electric Power Systems, High
Voltages, Electric Machines, pp. 21–23, 2007.
[5] Y. Merkurjevs, Z. Krishans, I. Oleinikova, and A. Mutule, “Estimation Method of
Power System Sufficient for 5-10 years Horizon,” in Power Tech, 2007 IEEE
Lausanne, pp. 1870–1874, 2007.
[6] Z. Deng and C. Singh, “A new approach to reliability evaluation of interconnected
power systems including planned outages and frequency calculations,” IEEE Trans.
Power Syst., vol. 7, no. 2, pp. 734–743, May 1992.
[7] B. Porretta, D. L. Kiguel, G. A. Hamoud, and E. G. Neudorf, “A comprehensive
approach for adequacy and security evaluation of bulk power systems,” IEEE Trans.
Power Syst., vol. 6, no. 2, pp. 433–441, 1991.
[8] F. Bodrogi, E. M. Carlini, L. Simoens, J. Maire, R. Delpet, H. Hoekstra, T Melkersson,
M. Allison, “Evaluation of Methods and Key Performance Indicators for
Transmission Maintenance,” in Session C2-201, CIGRE, Paris, France, 2004.
[9] S. E. El-Arab and H. Zarzoura, “Reliability Evaluation for the Egyptian Transmission
and Sub-Transmission Networks,” in Power Tech, IEEE Lausanne, pp. 1723–1725,
2007.
Page 102
Page | 87
[10] O. H. Abdalla, M. A. Thani, M. A. Wardi, K. A. Quidi, S. A. Farsi, I A. Balushi, S.
A. Mahdhoori, “Key Performance Indicators of a Transmission System,” in
Proceedings of the 5th IEEE GCC CIGRE International Conference, Riyadh, KSA,
2009.
[11] OETC, “Oman Electricity Transmission Company - Transmission System
Performance.” [Online]. Available: https://www.omangrid.com. [Accessed: 17-Mar-
2017].
[12] H. Elsalmawy, S. Abdullah, K. Youssef, and S. Hussen, “Elementary Evaluation of
Reliability Indices for Power System in Egypt,” in the 21st International Conference
on Electricity Distribution (CIRED), Frankfurt, vol. Paper No 0191, pp. 1–4, 2011.
[13] P. Rajalakshmi and M. Rathinakumar, “A comparison of transmission line voltage
stability indices,” in 2nd IEEE International Conference on Advances in Electrical,
Electronics, Information, Communication and Bio-Informatics (AEEICB), pp. 44–48,
2016.
[14] I. P. Siqueira and B. A. Souza, “Estimating performance and risk in electric power
systems,” in 9th IEEE/IAS International Conference on Industry Applications
(INDUSCON), pp. 1–6, 2010.
[15] J. Kilter, S. Elphick, J. van Coller, D. Vujatovic, H. Renner, and F. Van Erp,
“Benchmarking of Power Quality Performance in Transmission Systems-CIGRE WG
C4. 27 perspective,” in 17th IEEE International Conference on Harmonics and
Quality of Power (ICHQP), pp. 949–954, 2016.
[16] Y. Fang, X. Wang, H. Yan, L. Wei, X. Wu, C. Dang, Y. Zhang, “The evaluation index
system and method of economic and operation efficiency for the power transmission
system containing intermittent energy,” in 2016 IEEE International Conference on
Electricity Distribution (CICED), China, pp. 1–6, 2016.
[17] P. Kongmany, S. Premrudeepreechacharn, and K. Charoenpatcharakij, “Transmission
system reliability evaluation in the Central-1 and Northern regions of the Lao PDR in
corresponding to transmission system development plan,” in IEEE Power and Energy
Engineering Conference, 2009. APPEEC 2009. Asia-Pacific, pp. 1–4, 2009.
Page 103
Page | 88
[18] Y. Miao, W. Luo, W. Lei, P. Zhang, R. Jiang, and X. Deng, “Power supply reliability
indices computation with consideration of generation systems, transmission systems
and sub-transmission systems’ load transfer capabilities,” in 2016 IEEE PES Asia-
Pacific Power and Energy Engineering Conference (APPEEC), pp. 1840–1844, 2016.
[19] Public Utilities Commission of Sri Lanka, “Performance Measurements of Generation
and Transmission Systems,” Sri Lanka, 2016.
[20] ACIL Tasman Pty Ltd, “Proposed electricity industry performance indicators,”
Australia, ABN 68 102 652 148, Jul. 2012.
[21] S. Gheorghe and C. Stanescu, “Performance of services achieved by transmission and
distribution system operators in Romanian power grid,” in Development and
Application Systems (DAS), 2016 International Conference on, pp. 121–125, 2016.
[22] R. F. Khelifa and K. Jelassi, “An energy monitoring and management system based
on key performance indicators,” in Emerging Technologies and Factory Automation
(ETFA), 2016 IEEE 21st International Conference on, pp. 1–6, 2016.
[23] “Ministry of Power, Energy and Mineral Resources,” [Online]. Available:
http://www.mpemr.gov.bd/. [Accessed: 22-Apr-2017].
[24] “Sector Structure, Power Division-Government of the People’s Republic of
Bangladesh,” [Online]. Available: http://www.powerdivision.gov.bd. [Accessed: 21-
Apr-2017].
[25] S. Islam and M. Z. R. Khan, “A Review of Energy Sector of Bangladesh,” Energy
Procedia, vol. 110, pp. 611–618, March 2017.
[26] M. K. Mujeri, T. T. Chowdhury, S. Shahana “Energy Sector in Bangladesh: An
agenda for reforms,” the International Institute for Sustainable Development.
[27] M. Z. Hossian and M. Rasheduzzman, "Performance of the Power Sector of
Bangladesh: Governance Failures and Remedial Measures," Transparency
International Bangladesh (TIB).
[28] “Sustainable Energy for All (SE4ALL) database from World Bank,” World Bank.
Page 104
Page | 89
[29] “Power Generation,” [Online]. Available: http://www.bpdb.gov.bd/bpdb/index.php
[Accessed: 09-Jan-2018].
[30] “Annual Report 2015-16,” Bangladesh Power Development Board, 2016.
[31] “Annual Report 2014-15,” Bangladesh Power Development Board, 2015.
[32] “PGCB: Power Grid Company of Bangladesh Limited,” [Online]. Available:
https://www.pgcb.org.bd/PGCB/. [Accessed: 07-Jan-2018].
[33] PGCB: Power Grid Company of Bangladesh Limited, “transmission_line,” [Online].
Available: https://pgcb.org.bd. [Accessed: 22-Apr-2017].
[34] PGCB: Power Grid Company of Bangladesh, “substations” [Online]. Available:
https://pgcb.org.bd/PGCB/Sub Station. [Accessed: 22-Apr-2017].
[35] “PGCB: Power Grid Company of Bangladesh Limited,” [Online]. Available:
https://www.pgcb.org.bd/PGCB/ongoing_project_details. [Accessed: 07-Jan-2018].
[36] “Annual report 2015-2016,” Power Grid Corporation of India Limited.
[37] “Transmission Performance Standards Code,” Energy & Minerals Regulatory
Commission of Jordan.
[38] W. D. Stevenson, Element of Power System Analysis, 4th ed. McGraw-Hill book
company.
[39] V. K. Mehta and R. Mehta, Principles of power Systems, 4th ed. S. Chand.
[40] “Annual report 2013-2014.” Power Grid Company of Bangladesh.
[41] “Annual report 2014-2015.” Power Grid Company of Bangladesh.
[42] “Annual report 2015-2016.” Power Grid Company of Bangladesh.
[43] W. Gboney, “Performance Evaluation, Monitoring and Assessment of Utility
Companies, and Development of key Performance Indicators,” Rwanda Utilities
Regulatory Authority, November 2014.
Page 105
Page | 90
APPENDICES
Appendix A: Frequency and Voltage quality control
Page 107
Page | 92
Appendix B: Outage of Sub-Station Equipment due to Emergency Outages (Sample June 2016)
QF-LDC-23
POWER GRID COMPANY OF BANGLADESH LTD Information Management Division, LDC, Dhaka.
Outage of Sub-Station Equipment due to Tripping/Emergency Maintenance
Month: June 2016
Name of the Equipment Name Start Finish Duration Type of
Cause Unserved Unserved Remarks
Sub-station Date and Time
Date and Time
outage Load (MW)
Energy (MWH)
Dhaka (North) Grid Circle :
Aminbazar 230/132 kV Transformer -T2 01/06/16 08:32
01/06/16 08:48
0:16:00 T Tripped showing differential relay
0.00 0.00 No interruption
Joydevpur 132/33 kV Transformer -T2 01/06/16 23:31
02/06/16 00:14
0:43:00 T Tripped showing differential relay
10.00 7.17 Power interruption
Kabirpur 132/33 kV Transformer -T1 08/06/16 11:34
08/06/16 12:35
1:01:00 E/O Due to Oil leakage
30.00 30.50 Power interruption
Mymensingh 132/33 kV Transformer -T1 11/06/16 22:32
12/06/16 00:07
1:35:00 E/O Due to red-hot maintenance
50.00 79.17 Power interruption
Kallyanpur 132/33 kV Transformer- T2 12/06/16 15:41
14/06/16 16:59
49:18:00 E/O Due to Oil leakage
0.00 0.00 No interruption
Aminbazar 230/132 kV Transformer -TR3 14/06/16 10:01
14/06/16 11:48
1:47:00 E/O
Due to red hot maintenance 0.00 0.00 No interruption
Satmosjid 132/33 kV Transformer -T2
15/06/15 10:56
15/06/15 12:19
1:23:00 E/O
Due to Oil leakage 0.00 0.00 No interruption
Mymensingh 132/33 kV Transformers -T1 & T2
23/06/16 20:59
23/06/16 21:10
0:11:00
T
Tripped showing O/C relay 90.00 16.50 Power interruption
Kabirpur 132/33 kV Transformer -T3 23/06/16 21:35
23/06/16 22:33
0:58:00 E/O
Due to red hot maintenance 50.00 48.33 Power
interruption
Satmosjid 132/33 kV Transformer -T1 25/06/16 15:12
25/06/16 15:25
0:13:00
T
Tripped showing differential realy
64.00 13.87 Power interruption
Total : 57:25:00 Unserved Energy: 181.67
Dhaka (South) Grid Circle :
Maniknagar 132/33 kV Transformer -GT2 12/06/16 06:15
12/06/16 10:48
4:33:00 Due to basber protection relay 0.00 0.00 No interruption
Hasnabad 230/132 kV Transformer -TR2 12/06/16 07:34
12/06/16 17:10
9:36:00
T
Tripped showing 87T & 86T relay
0.00 0.00 No interruption
Haripur 132 kV bus- 2 & 3
17/06/16 10:02
17/06/16 12:47
2:45:00 E/O
Due to red hot maintenance 0.00 0.00 No interruption
Hasnabad 132/33 kV Transformer -T2 25/06/16 05:58
25/06/16 06:20
0:22:00 T
Tripped showing O/C relay 25.00 9.17 Power interruption
Sonargaon 132/33 kV Transformers -T1 29/06/16 21:33
29/06/16 21:52
0:19:00 T
Tripped showing O/C relay 55.00 17.42 Power interruption
132/33 kV Transformer -T2 29/06/16 21:33
29/06/16 22:12
0:39:00 T
Total : 18:14:00 Unserved Energy: 26.58
Page 108
Page | 93
Chittagong Grid Circle :
Juldah 132 kV main bus 03/06/16 06:54
03/06/16 11:25
4:31:00 E/O Due to red hot maintenance 15.00 67.75 Power interruption
Madunaghat 132/33 kV Transformers- T2 13/06/16 08:42
13/06/16 08:50
0:08:00 T
Tripped showing winding temperature high
0.00 0.00 No interruption
Hathazari 230/132 kV Transformer -MT4 13/06/16
14:07 13/06/16
15:55 1:48:00
E/O Due to red-hot maintenance
0.00 0.00 No interruption
Baraulia 132/33 kV Transformer -T1 22/06/16 22:37
23/06/16 02:30
3:53:00 T Tripped showing E/F & differential relay 70.00 271.83 Power interruption
Total : 10:20:00 Unserved Energy: 339.58 Comilla Grid Circle :
Comiila(S) 132/33 kV Transformers -T1 &T2
15/06/16 07:12
15/06/16 08:05
0:53:00
E/O Due to red hot maintenance
40.00 35.33 Power interruption
Sylhet 132/33 kV Transformers -T2 19/06/16 06:42
19/06/16 08:03
1:21:00 E/O Due to red-hot maintenance
0.00 0.00 No interruption
Daudkandi 132/33 kV Transformer -GT3 22/06/16 09:07
22/06/16 09:42
0:35:00 T
Tripped showing E/F relay 0.00 0.00 No interruption
Feni 132/33 kV Transformer -T1 24/06/16 12:10
24/06/16 12:23
0:13:00 T
Tripped showing O/C relay 57.00 12.35 Power interruption
Total : 3:02:00 Unserved Energy: 47.68 Khulna Grid Circle :
Khulna ( C ) 132/33 kV Transformer -T1 07/06/16 14:20
07/06/16 14:30
0:10:00 T
Tripped showing O/C relay 0.00 0.00 No interruption
132/33 kV Transformer -T2 07/06/16 14:20
07/06/16 14:31
0:11:00 T
0.00 0.00 No interruption
132/33 kV Transformers- T1 & T2
12/06/16 01:44
12/06/16 01:45
0:01:00
T
Tripped showing Over voltage 0.00 0.00 No interruption
Gopalganj 132/33 kV Transformer -T2 12/06/16 02:40
12/06/16 02:45
0:05:00 T
Tripped showing Over voltage relay 0.00 0.00 No interruption
132/33 kV Transformer -T2 12/06/16 06:13
12/06/16 07:05
0:52:00 T
10.00 8.67 Power interruption
132/33 kV Transformers -T2 12/06/16 07:43
12/06/16 08:33
0:50:00 T
Tripped showing Over voltage 0.00 0.00 No interruption
Khulna ( C ) 132/33 kV Transformers- T2 12/06/16 04:52
12/06/16 10:48
5:56:00 T
Tripped showing inst.E/F relay 0.00 0.00 No interruption
Golapara 132/33 kV Transformers -T5 12/06/16 07:11
12/06/16 14:07
6:56:00 T
Tripped showing differentai relay 0.00 0.00 No interruption
Bhandaria 132/33 kV Transformers -T1 &T2
17/06/16 08:02
17/06/16 08:05
0:03:00
T Tripped showing not healthy relay
20.00 1.00 Power interruption
Bagerhat 132/33 kV Transformer -T1 19/06/16 14:05
19/06/16 14:12
0:07:00 T
Tripped showing E/F relay 0.00 0.00 No interruption
132/33 kV Transformer -T2 19/06/16 14:05
19/06/16 14:13
0:08:00 T
Tripped showing inst.E/F relay 38.00 5.07 Power interruption
Madaripur 132/33 kV Transformer -T3 29/06/16 12:34
29/06/16 16:25
3:51:00 T
Tripped showing inst.B-phase & O/C relay
0.00 0.00 No interruption
Total : 19:10:00 Unserved Energy: 14.73
HVDC Grid Circle :
132/33 kV Transformers -T1 & T2
04/06/16 06:28
04/06/16 06:41
0:13:00
T
Tripped showing O/C relay 40.00 8.67 Power interruption
Jessore 132/33 kV Transformers -T1 12/06/16 14:51
12/06/16 15:00
0:09:00
T Tripped showing E/F relay
10.00 1.50 Power interruption
Page 109
Page | 94
132/33 kV Transformers-T2 12/06/16 14:51
12/06/16 15:02
0:11:00 T
0.00 0.00 No interruption
Ishurdi 230 kV bus breaker 17/06/16 10:05
17/06/16 15:59
5:54:00 E/O
Due to Oil leakage 0.00 0.00 No interruption
Jessore 132/33 kV Transformers -T1 & T2
23/06/16 20:55
23/06/16 21:12
0:17:00
T
Tripped showing O/C relay 10.00 2.83 Power interruption
Shahjadpur 132/33 kV Transformer -T1 24/06/16 08:40
24/06/16 14:10
5:30:00 E/O
Due to Oil leakage 0.00 0.00 No interruption
Total : 12:14:00 Unserved Energy: 13.00 Bogra Grid Circle:
Saidpur 132/33 kV Transformer -T2 01/06/16 13:10
01/06/16 13:25
0:15:00 E/O
Due to Oil leakage 0.00 0.00 No interruption
Thakurgaon 132/33 kV Transformers -T1 & T2
07/06/16 10:05
07/06/16 11:33
1:28:00 E/O Due to red hot maintenance 30.00 44.00 Power interruption
Naogaon 132/33 kV Transformers -T1 & T2
12/06/16 01:15
12/06/16 01:30
0:15:00
T Tripped showing E/F relay 64.00 16.00 Power
interruption
Total : 1:58:00 Unserved Energy: 60.00
Others :
Matuail 132/33 kV Transformer GT-2 06/06/16 11:34
06/06/16 12:02
0:28:00 E/O Due to red hot maintenance 5.00 2.33 Power interruption
Ghorasal 132/33 kV Transformer -T1 22/06/16 11:16
22/06/16 12:36
1:20:00 E/O
Due to red hot maintenance 66.00 88.00 Power
interruption
Total : 0:28:00 Unserved Energy: 2.33
Total outage period of Sub-station Equipment : 122:51:00 Hours
T = Tripping
E/O = Emergency Outage Executive Engineer
Information Management Division
LDC, PGCB, Dhaka.
Page 110
Page | 95
Appendix C: Outage of Transmission lines due to Emergency Outages (Sample June 2016)
OF-LDC-24
Power Grid Company of Bangladesh Ltd Information Management Division, LDC, Dhaka.
Outage of Transmission lines due to Tripping/Emergency Maintenance Month: June 2016
Name of the Equipment Name Start Finish Duration Type
of Cause Unserved Unserved Remarks
Sub-station
Date & Time
Date & Time
Outage Load (MW)
Energy (MWH)
Dhaka (North) Grid Circle :
Tongi Tongi-Kabirpur 132 kV line-1 & 2 06/06/16
09:03 06/06/16
09:18 0:15:00
T Tripped showing O/C relay 148.00 37.00 Power
interruption
Kabirpur Kabirpur-Manikganj 132 kV line-1 06/06/16
09:03 06/06/16
09:33 0:30:00
T Tripped showing dist.relay 0.00 0.00 No interruption
Jamalpur Jamalpur-Mymensingh 132 kV line-2
06/06/16 12:57
06/06/16 13:25
0:28:00 E/O Due to red hot maintenance 0.00 0.00 No interruption
Basundhara Basundhara-Tongi 132 kV line-2
09/06/16 16:53
09/06/16 20:14
3:21:00 T
Tripped showing dist.relay 0.00 0.00 No interruption
Kishoreganj Kishoreganj-Ashuganj 132 kV line-2
17/06/16 06:07
17/06/16 10:14
4:07:00 E/O Due to red hot maintenance 0.00 0.00 No interruption
Ghorashal-Ashuganj 230 kV line-2
22/06/16 22:32
23/06/16 00:27
1:55:00 T
Tripped showing dist.relay 0.00 0.00 No interruption
Ghorasal Ghorasal-Tongi 230 kV line-1
26/06/16 11:20
26/06/16 11:56
0:36:00 T
Tripped showing dist.relay 550.00 330.00 Power
interruption
Ghorashal-Tongi 230 kV line-2
26/06/16 11:20
26/06/16 16:56
5:36:00 T
0.00 0.00 No interruption
Tongi Tongi-Kabirpur 132 kV line-2
26/06/16 11:20
26/06/16 12:16
0:56:00 T
Tripped showing dist.relay 0.00 0.00 No interruption
Kabirpur Kabirpur-Manikganj 132 kV line-1 26/06/16
11:20 26/06/16
12:17 0:57:00
T Tripped showing dist.relay 0.00 0.00 No interruption
Mirpur Mirpur-Aminabzar 132 kV line-1 27/06/16 17:30
27/06/16 22:38
5:08:00 T
Tripped showing dist.relay 190.00 95.00 Power interruption
Mirpur-Aminabzar 132 kV line-2 27/06/16 17:30
27/06/16 18:00
0:30:00 T
Total : 24:19:00 Unserved Energy: 462 MWH
Dhaka (South) Grid Circle :
Rampura Rampura-Basundhara 132 kV line-2 05/06/16 05:59
05/06/16 07:12
1:13:00 E/O Due to red hot maintenance 0.00 0.00 No interruption
Rampura-Basundhara 132 kV line-1 & 2
08/06/16 13:19
08/06/16 13:32
0:13:00 T
Tripped showing dist.relay 0.00 0.00 No interruption
Haripur Haripur-Ullon 132 kV line-2
10/06/16 06:13
10/06/16 10:42
4:29:00 E/O Due to red hot maintenance 0.00 0.00 No interruption
Ghorasal Ghorashal-Bhulta 132 kV line
11/06/16 11:21
11/06/16 13:43
2:22:00 T
Tripped remote protection relay 0.00 0.00 No interruption
Hasnabad Hasnabad-Lalbagh 132 kV ine
11/06/16 11:16
11/06/16 11:53
0:37:00 T
Tripped showing dist.relay 0.00 0.00 No interruption
Page 111
Page | 96
Haripur Haripur-Shyampur 132 kV line
11/06/16 11:08
11/06/16 11:44
0:36:00 T
Tripped showing dist.relay 0.00 0.00 No interruption
Siddhirganj Siddhirganj-DBL 132 kV line
11/06/16 11:12
11/06/16 12:38
1:26:00 T
Tripped showing O/C & E/F relay 0.00 0.00 No interruption
Haripur Haripur-Bhulta 132 kV line 16/06/16 02:07
16/06/16 08:55
6:48:00 T
Tripped showing dist.relay 85.00 578.00 Power
interruption
Ullon Ullon-Siddhirganj 132 kV line-2
19/06/16 14:16
19/06/16 14:27
0:11:00 T
Tripped showing dist.relay 0.00 0.00 No interruption
Siddhirganj Siddhirganj-Maniknagar 230 kV line-1 18/06/16
18:25 18/06/16
18:35 0:10:00
T Tripped showing dist.relay
0.00 0.00 No interruption
Siddhirganj-Maniknagar 230 kV line-1 18/06/16
21:57 18/06/16
22:04 0:07:00
T Tripped showing differential relay
0.00 0.00 No interruption
Meghnaghat Meghnaghat-Haripur 230 kV line-2
25/06/16 10:35
25/06/16 12:35
2:00:00 E/O Due to red hot maintenance 0.00 0.00 No interruption
Joydevpur Joydevpur-Ghorasal 132 kV line-1 & 2
26/06/16 11:20
26/06/16 11:28
0:08:00 T
Tripped showing differential E/F relay 0.00 0.00 No interruption
Joydevpur-Ghorasal 132 kV line-1 & 2
26/06/16 11:39
26/06/16 12:09
0:30:00 T
Tripped showing differential E/F relay 0.00 0.00 No interruption
Total : 20:50:00 Unserved Energy: 578.00 MWH
Chittagong Grid Circle :
Kaptai Kaptai-Madunaghat 132 kV line-2 11/06/16 02:09
11/06/16 02:17
0:08:00 T
Tripped showing E/F relay 17.00 2.27 Power interruption
Madunaghat Madunaghat-Khulshi 132 kV line-1
17/06/16 16:30
17/06/16 16:52
0:22:00 T
Tripped showing dist.relay 0.00 0.00
No interruption
Khulshi Khulshi-AKSML 132 kV line
17/06/16 22:32
17/06/16 22:49
0:17:00 T
Tripped showing E/F relay 0.00 0.00 No interruption
Khulshi-AKSML 132 kV line
17/06/16 22:30
17/06/16 22:50
0:20:00 T
Tripped showing E/F relay 0.00 0.00 No interruption
Hathazari Hathazari-BSRM 132 kV line
17/06/16 10:38
17/06/16 10:50
0:12:00
T Tripped showing backup protection relay
0.00 0.00 No interruption
Bakulia Bakulia-Khulshi 132 kV line
29/06/16 00:10
29/06/16 00:22
0:12:00 T
Tripped showing dist.relay 0.00 0.00 No interruption
Hathazari Hathazari-Abul Khair 132 kV line
30/06/16 13:50
30/06/16 14:16
0:26:00 T
Tripped showing dist.relay 0.00 0.00 No interruption
Total : 1:57:00 Unserved Energy: 2.27 MWH
Comilla Grid Circle :
Feni Feni-Chowmuhani 132 kV line-1 & 2 03/06/16 20:36
03/06/16 20:42
0:06:00 T
Tripped showing O/C relay 0.00 0.00 No interruption
Comilla(S) Comilla(S) -Chandpur 132 kV line 03/06/16
20:37 03/06/16
20:44 0:07:00
T Tripped showing DOC relay 0.00 0.00 No interruption
Comilla(N) Comilla(N)-Meghnaghat 230 kV line-2 07/06/16
12:13 07/06/16
12:25 0:12:00
T Tripped showing dist.relay 0.00 0.00 No interruption
Chandpur Chandpur-Chowmuhani 132 kV line-2 10/06/16
22:55 10/06/16
23:05 0:10:00
T Tripped showing E/F.relay 60.00 10.00 Power
interruption
Feni Feni-Comilla(N) 132 kV line 11/06/16 12:15
11/06/16 12:33
0:18:00 T
Tripped showing dist.relay 0.00 0.00 No interruption
Comilla(N) Comilla(N)-Chandpur 132 kV line 11/06/16
12:28 11/06/16
12:46 0:18:00
T Tripped showing dist.relay 0.00 0.00 No interruption
Ashuganj Ashuganj-Comilla(N) 230 kV line-1 23/06/16 14:35
23/06/16 16:27
1:52:00 E/O
Due to red hot maintenance 0.00 0.00 No interruption
Kulaura Kulaura-Fenchuganj 132 kV line-1 27/06/16
01:20 27/06/16
02:19 0:59:00
E/O Due to bursting of PT
0.00 0.00 No interruption
Page 112
Page | 97
Shahjibazar
Shahjibazar-Sreemongal 132 kV line-2
29/06/16 10:25
29/06/16 14:16
3:51:00 E/O
Due to red hot maintenance 0.00 0.00 No interruption
Total : 7:53:00 Unserved Energy: 10.00 MWH
Khulna Grid Circle :
Bagerhat Bagerhat-Bhandaria 132 kV line 03/06/16 14:32
03/06/16 14:39
0:07:00 T Tripped showing DRE2 relay 14.00 1.63 Power interruption
Barisal-Bhandaria 132 kV line 03/06/16 14:32
03/06/16 14:40
0:08:00 T
Tripped showing dist.relay 0.00 0.00 No interruption
Barisal Barisal-Bhandaria 132 kV line 05/06/16 11:04
05/06/16 11:28
0:24:00 T
Tripped showing dist.relay 0.00 0.00 No interruption
Barisal-Patuakhali 132 kV line 11/06/16 15:32
11/06/16 17:08
1:36:00 T
Tripped showing E/F.relay 0.00 0.00 No interruption
Barisal-Patuakhali 132 kV line 12/06/16 02:57
12/06/16 06:18
3:21:00 T
Tripped showing O/C & E/F.relay 0.00 0.00 No interruption
Bagerhat-Goalpara 132 kV line-1 12/06/16 01:52
12/06/16 02:48
0:56:00 T
Tripped showing dist.relay 0.00 0.00 No interruption
Bagerhat Bagerhat-Goalpara 132 kV line-2 12/06/16 05:20
12/06/16 05:53
0:33:00 T
Tripped showing dist.relay 0.00 0.00 No interruption
Bagerhat-Mongla 132 kV line 12/06/16 06:17
12/06/16 08:10
1:53:00 T
Tripped showing dist.relay 10.00 18.83 Power interruption
Gopalganj Gopalganj S/S-Gopalganj P/S 132 kV line
20/06/16 09:50
20/06/16 10:51
1:01:00
E/O Due to red hot maintenance
0.00 0.00 No interruption
Bagerhat Bagerhat-Bhandaria 132 kV line 24/06/16 11:34
24/06/16 11:40
0:06:00 T
Tripped showing O/C .relay 0.00 0.00 No interruption
Bagerhat-Bhandaria 132 kV line 24/06/16 11:52
24/06/16 12:02
0:10:00 T
Tripped showing O/C .relay 0.00 0.00 No interruption
Madaripur Madaripur-Barisal (N) 132 kV line-2 25/06/16 13:05
25/06/16 13:10
0:05:00 T
Tripped showing dist.relay 0.00 0.00 No interruption
Total : 10:20:00 Unserved Energy: 20.47 MWH
HVDC Grid Circle :
Jessore Jessore-Jhenidah 132 kV line-2 11/06/16 10:15
11/06/16 13:02
2:47:00 T
Tripped showing dist.relay 0.00 0.00 No interruption
Ishurdi Ishurdi-Bheramara 132 kV line-2 13/06/16 18:34
13/06/16 18:40
0:06:00 T
Tripped showing dist.relay 0.00 0.00 No interruption
Bheramara Bheramara-Kustia 132 kV line-1 24/06/16
06:23 24/06/16
12:57 6:34:00
E/O Due to red hot maintenance
0.00 0.00 No interruption
Bheramara-Faridpur 132 kV line-1 24/06/16
11:34 24/06/16
11:59 0:25:00
T Tripped showing dist.relay 0.00 0.00 No interruption
Shahjadpur Shahjadpur-Baghabari 132 kV line-1 & 2
28/06/16 20:07
28/06/16 20:41
0:34:00 T
Tripped showing dist.relay 0.00 0.00 No interruption
Total : 9:52:00 Unserved Energy: 0.00 MWH
Bogra Grid Circle :
Bogra Bogra-Sireganj 230 kV line-2 09/06/16 09:04
09/06/16 11:07
2:03:00 E/O Due to red hot maintenance 0.00 0.00 No interruption
Natore Natore-Bogra 132 kV line-2
12/06/16 21:52
12/06/16 23:46
1:54:00 T
Tripped showing O/C & E/F.relay 0.00 0.00 No interruption
Rajshahi Rajshahi-C.nawbganj 132 kV line-2 13/06/16
00:06 13/06/16
00:12 0:06:00
T Tripped showing differential relay 0.00 0.00 No interruption
Bogra Bogra-Natore 132 kV line-2 13/06/16
21:16 13/06/16
22:27 1:11:00
T Due toCt control cable fault 0.00 0.00 No interruption
Page 113
Page | 98
Rajshahi Rajshahi-Natore 132 kV line-1 29/06/16
09:35 29/06/16
12:05 2:30:00
E/O Due to red hot maintenance
0.00 0.00 No interruption
Bogra-Palashbari 132 kV line-1 30/06/16
10:03 30/06/16
11:55 1:52:00
E/O Due to red hot maintenance
0.00 0.00 No interruption
Bogra Bogra-Palashbari 132 kV line-1 30/06/16
12:11 30/06/16
14:01 1:50:00
E/O
0.00 0.00 No interruption
Bogra-Palashbari 132 kV line-2 30/06/16
13:28 30/06/16
14:16 0:48:00
T Tripped showing dist.relay 0.00 0.00 No interruption
Palashbari Palashbari-Rangpur 132 kV line-2 30/06/16
13:28 30/06/16
14:03 0:35:00
T Tripped showing dist.relay
0.00 0.00 No interruption
Total : 12:49:00 Unserved Energy: 0.00 MWH
Others :
Haripur Haripur-Matuail 132 kV line 15/06/15 12:14
15/06/15 12:25
0:11:00 T
Tripped showing dist.relay 0.00 0.00 No interruption
Total : 0:11:00 Unserved Energy: 0.00 MWH
Total outage period of Sub-station Equipment : 88:11:00 Hours
T = Tripping
E/O = Emergency Outage Executive Engineer
Information Management Division
LDC, PGCB, Dhaka.
Page 114
Page | 99
Appendix D: Outage of Sub-Station due to Schedule Outages (Sample June 2016)
Page: 1/1 QF-LDC-25
POWER GRID COMPANY OF BANGLADESH LTD Information Management Division, LDC, Dhaka.
Outage of Sub-Station Equipment due to Schedule Maintenance/Project Work
Month: June 2016
Name of the Equipment name Start Finish Duration Type of
Cause Unserved Unserved Remarks
Sub-station Date and Time
Date and Time
outage
Load (MW)
Energy (MWH)
Dhaka (North) Grid Circle :
132/33 kV Transformer T3 21/06/15 11:37 21/06/15 12:56 1:19:00 S/O
Due to CT loop problem 25.00 32.92 Power
interruption
Mymensingh 132/33 kV Transformer T1 25/06/16 07:20 25/06/16 09:43 2:23:00 S/O
Due to maintenance work 25.00 59.58 Power interruption
132/33 kV Transformer T3 26/06/16 07:23 26/06/16 08:26 1:03:00 S/O Due to maintenance work 0.00 0.00 No interruption
Total : 4:45:00 Unserved Energy: 92.50 MWH
Dhaka (South) Grid Circle :
Rampura 230/132 kV Transformer TR-3 03/06/16 06:50 04/06/16 16:05 33:15:00 S/O Due to replacement work 0.00 0.00 No interruption
Maniknagar 230/132 kV Transformer T-02 10/06/16 10:36 10/06/16 15:04 4:28:00 S/O Due to tap changer mainteance work 0.00 0.00 No interruption
230/132 kV Transformer T-02 11/06/16 10:48 11/06/16 15:34 4:46:00 S/O Due to tap changer mainteance work 0.00 0.00 No interruption
Ramprura 230/132 kV Transformer TR3 12/06/16 12:22 12/06/16 12:52 0:30:00 S/O Due to removing CT
Satmosjid 132/33 kV Transformer T2 14/06/15 10:37 14/06/15 12:45 2:08:00 S/O Due to abnormal noise 0.00 0.00 No interruption
Total : 45:07:00
Unserved Energy:
0.00 MWH
Chittagong Grid Circle :
Shahmirpur 132/33 kV Transformer T-2 03/06/16 10:05 03/06/16 12:58 2:53:00 S/O Due to Delta test 0.00 0.00 No interruption
Total : 2:53:00 Unserved Energy: 0.00 MWH
Comilla Grid Circle :
Comilla(S) 132/33 kV Transformer T2 01/06/16 21:07 01/06/16 21:32 0:25:00 S/O Due to removing of bird nest 0.00 0.00 No interruption
Fenchuganj 230/132 kV Transformer AT-2 03/06/16 07:10 03/06/16 10:24 3:14:00 S/O Due to NGR maintenance work 0.00 0.00 No interruption
Bibiyana 230 kV bus-B 04/06/16 11:26 04/06/16 12:45 1:19:00 S/O Due to reconnection 0.00 0.00 No interruption
Barisal (N) 230/132 kV Transformer TR2 21/06/15 08:50 21/06/15 16:11 7:21:00 S/O Due to project work 0.00 0.00 No interruption
230/132 kV Transformer T1 24/06/16 07:29 24/06/16 07:29 0:00:00 S/O Due to project work 0.00 0.00 No interruption
Total 12:19:00 Unserved Energy : 0.00 MWH
Khulna Grid Circle :
Barisal (N) 230/132 kV Transformer T2 01/06/16 12:05 01/06/16 12:25 0:20:00 S/O Due to protection test 0.00 0.00 No interruption
Barisal 132/33 kV Transformer T2 13/06/16 14:44 13/06/16 14:59 0:15:00 S/O Due to DS problem 10.00 2.50 Power interruption
230/132 kV Transformer T1 24/06/16 07:29 24/06/16 18:32 11:03:00 S/O Due to NGR maintenance work 0.00 0.00 No interruption
Barisal(N) 230/132 kV Transformer TR2 28/06/16 08:16 28/06/16 08:16 0:00:00 S/O Due to project work 0.00 0.00 No interruption
Total : 11:38:00 Unserved Energy : 2.50 MWH
Page 115
Page | 100
HVDC Grid Circle :
Total : 0:00:00 Unserved Energy: 0.00 MWH
Bogra Grid Circle:
Natore 132/33 kV Transformer T3 09/06/35 07:35 09/06/35 11:20 3:45:00 S/O Due to protection test 0.00 0.00
Total 3:45:00 Unserved Energy : 0.00 MWH
Others :
S/O
Total 0:00:00 Unserved Energy : 0.00 MWH
Total outage period of Sub-Station equipment due to schedule
maintenance: 80:27:00 Hours Executive Engineer S/O=Schedule Outage
Information Management Division
LDC, PGCB, Dhaka.
Page 116
Page | 101
Appendix E: Outage of Transmission Lines due to Scheduled Outages (Sample June 2016)
Page: 1/1 QF-LDC-26
POWER GRID COMPANY OF BANGLADESH LTD Information Management Division, LDC, Dhaka.
Outage of Transmission Lines due to Scheduled Maintenance/Project Work
Month: June 2016
Name of the Equipment name Start Finish Duration Type of
Cause Unserved Unserved Remarks
Sub-station Date and Time
Date and Time
outage Load (MW)
Energy (MWH)
Dhaka (North) Grid Circle :
Kabirpur Kabirpur-Manikganj 132 kV line-2 18/06/16 06:09 18/06/16 14:02 7:53:00 S/O Due to project work 65.00 512.42 Power interruption
Mirpur Mirpur-Aminabzar 132 kV line-1 19/06/16 15:51 19/06/16 16:24 0:33:00 S/O Due to sky wire removing work 0.00 0.00 No interruption
Tangail Tangail-Kabirpur 132 kV line-1 20/06/16 06:40 20/06/16 19:55 13:15:00 S/O Due to project work 0.00 0.00 No interruption
Kabirpur Kabirpur-Maniknganj 132 kV line-1 20/06/16 11:56 20/06/16 13:42 1:46:00 S/O Due to changing of CT 0.00 0.00 No interruption
Kabirpur-Maniknganj 132 kV line-2 21/06/16 07:16 21/06/16 17:44 10:28:00 S/O Due to project work 0.00 0.00 No interruption
Total : 33:55:00 Unserved Energy: 512.42 MWH
Dhaka (South) Grid Circle :
Rampura Rampura-Basundhara 132 kV line-2 08/06/16 14:13 08/06/16 19:48 5:35:00 S/O Due to project work 88.00 491.33 Power interruption
Narsingdi Narsingdi-Ghorashal 132 kV line 25/06/16 08:49 25/06/16 13:19 4:30:00 S/O Due to installation wprk 0.00 0.00 No interruption
Ghorasal Ghorashal-Tongi 230 kV line-2 28/06/16 04:49 28/06/16 07:55 3:06:00 S/O Due to CB maintenance 0.00 0.00 No interruption
Total : 13:11:00 Unserved Energy: 491.33 MWH
Chittagong Grid Circle :
Dohazari Dohazari-Cox'sbazar 132 kV line-1 27/06/16 17:43 27/06/16 18:45 1:02:00 S/O Due to project work
Dohazari-Cox'sbazar 132 kV line-2 27/06/16 17:43 27/06/16 18:43 1:00:00 S/O 40.00 40.00 Power interruption
Total : 2:02:00 Unserved Energy: 40.00 MWH
Comilla Grid Circle :
Comilla (N)-Bibiyana 230 kV line-2 03/06/16 06:45 03/06/16 06:50 0:05:00 S/O Due to project work 0.00 0.00 No interruption
Comiila(N) Comiila(N)-Bibiyana 230 kV line-2 04/06/16 06:51 04/06/16 19:22 12:31:00 S/O Due to project work 0.00 0.00 No interruption
Comiila(N)-Bibiyana 230 kV line-2 05/06/16 06:59 05/06/16 18:56 11:57:00 S/O Due to new power plant connection 0.00 0.00 No interruption
Comilla(S) Comilla(S) -Surjonagar 132 kV line-1 26/06/16 14:50 26/06/16 16:05 1:15:00 S/O Due to removing wire 0.00 0.00 No interruption
Total : 25:48:00 Unserved Energy: 0.00 MWH
Khulna Grid Circle :
Bhola Bhola-Barisal (N) 230 kV line-2 14/06/16 14:47 14/06/16 16:23 1:36:00 S/O Due to project work 0.00 0.00 No interruption
Bhola-Barisal (N) 230 kV line-2 19/06/16 10:09 19/06/16 15:59 5:50:00 S/O Due to development work 0.00 0.00 No interruption
Barisal (N) Barisal (N)-Bhola 230 kV line-2 20/06/16 09:46 20/06/16 16:52 7:06:00 S/O Due to development work 0.00 0.00 No interruption
Total : 14:32:00 Unserved Energy: 0.00 MWH
HVDC Grid Circle :
Bheramara Bheramara-Faridpur 132 kV line-1 08/06/16 09:44 08/06/16 16:04 6:20:00 S/O Due to project work 0.00 0.00 No interruption
Bheramara-Faridpur 132 kV line-2 24/06/16 06:23 24/06/16 12:54 6:31:00 S/O Due to development work 0.00 0.00 No interruption
Total : 12:51:00 Unserved Energy: 0.00 MWH
Bogra Grid Circle :
Page 117
Page | 102
Rajshahi Rajshahi-C.nawabganj 132 kV line-2 04/06/16 14:05 04/06/16 16:06 2:01:00 S/O Due to maintenance work 0.00 0.00 No interruption
Total : 2:01:00 Unserved Energy: 0.00 MWH
Others :
Total : 0:00:00 Unserved Energy: 0.00 MWH
Total outage period of Transmission Lines due to schedule Executive Engineer
maintenance: 104:20:00 Hours
Information Management Division
S/O=Schedule Outage
LDC, PGCB, Dhaka.
Page 118
Page | 103
Appendix F: Maximum & Minimum Voltages of Grid Sub-Stations (Sample June 2016)
QF-LDC-35
POWER GRID COMPANY OF BANGLADESH LTD.
Information Management Division, LDC, Dhaka.
Maximum & Minimum Voltages of Grid Sub-Stations.
June 2016
Rated Maxm Date
Minm Date
SL. Substation Voltage Voltage Hour Voltage Hour Remarks
No. 230 KV Substation kV kV kV
1 Ghorasal 230 222 1 Jun-16 01:00 212 1 Jun-16 16:00
2 Ishurdi 230 235 4 Jun-16 18:30 216 9 Jun-16 22:00
3 Ashuganj 230 235 11 Jun-16 11:00 225 1 Jun-16 11:00
4 Serajganj 230 230 3 Jun-16 01:00 211 1 Jun-16 15:00
5 Baghabari 230 227 17 Jun-16 14:00 210 9 Jun-16 21:00
6 Barapukuria 230 232 11 Jun-16 07:00 212 13 Jun-16 21:00
7 Bogra 230 230 24 Jun-16 08:00 206 9 Jun-16 22:00
8 Khulna South 230 240 12 Jun-16 08:00 208 9 Jun-16 22:00
9 Rampura 230 219 10 Jun-16 10:00 202 1 Jun-16 13:00
10 Haripur 230 216 10 Jun-16 09:00 200 28 Jun-16 13:00
11 Hasnabad 230 218 10 Jun-16 13:00 200 29 Jun-16 14:00
12 Aminbazar 230 216 10 Jun-16 08:00 197 2 Jun-16 15:00
13 Tongi 230 216 11 Jun-16 11:00 197 2 Jun-16 16:00
14 Comilla (N) 230 227 10 Jun-16 18:00 212 1 Jun-16 09:00
15 Hathazari 230 222 9 Jun-16 20:00 207 1 Jun-16 13:00
16 Megnaghat 230 221 10 Jun-16 09:00 203 29 Jun-16 15:00
17 Fenchuganj 230 237 10 Jun-16 09:00 218 1 Jun-16 12:00
18 Siddhirganj 230 234 3 Jun-16 05:00 208 28 Jun-16 13:00
19 Maniknagar 230 231 4 Jun-16 03:00 207 27 Jun-16 12:00
20 Old Airport 230 216 10 Jun-16 13:00 193 1 Jun-16 19:00
21 Barisal 230 247 12 Jun-16 08:00 212 24 Jun-16 15:00
22 AKSML 230 223 9 Jun-16 18:30 201 5 Jun-16 21:00
23 BSRM 230 224 12 Jun-16 03:00 208 2 Jun-16 15:00
132 kV Substation
1 Siddhirganj 132 140 3 Jun-16 05:00 127 13 Jun-16 11:00
2 Munsiganj 132 139 12 Jun-16 19:00 127 13 Jun-16 19:00
3 Megnaghat 132 137 7 Jun-16 19:30 13 1 Jun-16 11:00
4 Shyampur 132 135 3 Jun-16 21:00 120 13 Jun-16 11:00
5 Bhulta 132 131 12 Jun-16 18:30 112 6 Jun-16 11:00
6 Madanganj 132 138 11 Jun-16 01:00 126 27 Jun-16 11:00
7 Shitalakhya 132 137 7 Jun-16 19:00 123 29 Jun-16 15:00
8 Rahim Steal 132 136 4 Jun-16 06:00 127 13 Jun-16 12:00
9 Matuail 132 137 12 Jun-16 19:00 125 27 Jun-16 11:00
10 Ghorasal 132 135 1 Jun-16 06:00 126 6 Jun-16 12:00
11 Narsinghdi 132 137 11 Jun-16 11:00 126 2 Jun-16 12:00
12 Haripur (SBU) 132 138 3 Jun-16 05:00 126 28 Jun-16 11:00
13 Ullon 132 136 18 Jun-16 06:00 123 28 Jun-16 11:00
14 Hasnabad 132 136 14 Jun-16 04:00 124 1 Jun-16 11:00
15 Magbazar 132 133 14 Jun-16 06:00 120 1 Jun-16 11:00
16 Maniknagar 132 135 18 Jun-16 06:00 121 27 Jun-16 13:00
17 Bangabhaban 132 135 18 Jun-16 06:00 121 27 Jun-16 13:00
18 Narinda 132 135 18 Jun-16 06:00 121 27 Jun-16 13:00
19 Dhanmondi 132 136 18 Jun-16 6:00 121 21 Jun-16 14:00
20 Lalbag 132 131 14 Jun-16 5:00 116 29 Jun-16 15:00
21 Madartek 132 135 14 Jun-16 6:00 120 1 Jun-16 11:00
22 Mirpur 132 132 14 Jun-16 3:00 114 1 Jun-16 19:30
23 Kalyanpur 132 135 14 Jun-16 2:00 121 29 Jun-16 14:00
24 Gulshan 132 135 14 Jun-16 6:00 119 1 Jun-16 14:00
25 Uttara 132 132 14 Jun-16 2:00 116 29 Jun-16 14:00
26 Kamrangirchar 132 133 14 Jun-16 3:00 120 1 Jun-16 13:00
27 Savar 132 134 14 Jun-16 5:00 120 28 Jun-16 11:00
28 Bhasantec 132 133 14 Jun-16 04:00 118 29 Jun-16 15:00
29 Agargaon 132 134 14 Jun-16 4:00 119 29 Jun-16 15:00
30 Satmosjid 132 133 14 Jun-16 04:00 119 29 Jun-16 15:00
31 Tongi 132 138 26 Jun-16 12:00 122 2 Jun-16 16:00
32 Kabirpur 132 139 11 Jun-16 11:00 116 5 Jun-16 16:00
33 Basundhara 132 130 2 Jun-16 04:00 117 11 Jun-16 10:00
34 Manikganj 132 138 11 Jun-16 11:00 120 1 Jun-16 23:00
35 Joydevpur 132 139 11 Jun-16 11:00 120 30 Jun-16 22:00
36 New Tongi 132 138 26 Jun-16 12:00 118 2 Jun-16 16:00
37 Tangail 132 133 1 Jun-16 05:00 112 30 Jun-16 21:00
38 Mymensing 132 132 11 Jun-16 09:00 110 20 Jun-16 01:00
39 Kishorganj 132 132 4 Jun-16 06:00 110 20 Jun-16 15:00
40 Netrokona 132 133 11 Jun-16 11:00 110 20 Jun-16 18:00
41 Jamalpur 132 132 11 Jun-16 09:00 105 20 Jun-16 01:00
Page 119
Page | 104
42 Sherpur 132 132 11 Jun-16 09:00 103 25 Jun-16 02:00
43 Srimongal 132 141 11 Jun-16 17:00 133 1 Jun-16 14:00
44 Shahjibazar 132 140 2 Jun-16 06:00 133 8 Jun-16 18:30
45 Fenchuganj 132 140 10 Jun-16 13:00 132 1 Jun-16 16:00
46 Kulaura 132 139 10 Jun-16 10:00 132 1 Jun-16 10:00
47 Sylhet 132 137 4 Jun-16 03:00 131 1 Jun-16 19:00
48 Chhatak 132 137 10 Jun-16 13:00 130 1 Jun-16 13:00
49 Comilla (South) 132 137 17 Jun-16 06:00 124 27 Jun-16 14:00
50 Comilla (North) 132 135 9 Jun-16 19:30 126 5 Jun-16 13:00
51 Chandpur 132 137 12 Jun-16 07:00 107 5 Jun-16 19:30
52 Feni 132 129 17 Jun-16 10:00 113 4 Jun-16 15:00
53 Chowmuhani 132 133 12 Jun-16 08:00 116 4 Jun-16 15:00
54 Ashuganj 132 139 11 Jun-16 12:00 128 20 Jun-16 10:00
55 Daudkandi 132 136 9 Jun-16 20:00 124 28 Jun-16 13:00
56 Brahminbaria 132 137 2 Jun-16 07:00 127 19 Jun-16 18:00
57 Madanhat 132 138 9 Jun-16 19:30 125 5 Jun-16 14:00
58 Hathazari 132 134 9 Jun-16 18:30 125 1 Jun-16 10:00
59 Khulshi 132 140 11 Jun-16 19:00 127 2 Jun-16 12:00
60 Halishahar 132 136 9 Jun-16 22:00 122 5 Jun-16 14:00
61 Baraulia 132 134 11 Jun-16 03:00 120 5 Jun-16 14:00
62 Sikalbaha 132 135 3 Jun-16 19:30 120 5 Jun-16 14:00
63 Dohazari 132 134 10 Jun-16 03:00 121 4 Jun-16 14:00
64 Cox's Bazar 132 134 6 Jun-16 20:00 120 1 Jun-16 14:00
65 Chandraghona 132 135 8 Jun-16 19:30 125 1 Jun-16 11:00
66 Kaptai 132 135 9 Jun-16 20:00 125 1 Jun-16 11:00
67 Abul Khaer Steel. 132 133 11 Jun-16 19:30 118 5 Jun-16 14:00
68 Bakulia 132 133 3 Jun-16 19:00 121 2 Jun-16 12:00
69 Julda 132 135 12 Jun-16 02:00 120 5 Jun-16 14:00
70 TK Chemical 132 138 9 Jun-16 19:00 123 5 Jun-16 13:00
71 Modern Steel 132 134 10 Jun-16 18:00 122 2 Jun-16 12:00
72 Shahmirpur 132 135 26 Jun-16 19:00 121 2 Jun-16 12:00
73 Goalpara 132 140 12 Jun-16 07:00 121 9 Jun-16 22:00
74 Khulna Central 132 140 8 Jun-16 11:00 122 9 Jun-16 22:00
75 Noapara 132 140 12 Jun-16 07:00 113 9 Jun-16 22:00
76 Jessore 132 139 25 Jun-16 18:00 110 9 Jun-16 22:00
77 Jhenaidah 132 137 12 Jun-16 04:00 103 9 Jun-16 22:00
78 Bottail 132 138 13 Jun-16 01:00 110 24 Jun-16 07:00
79 G.K.Project 132 138 1 Jun-16 04:00 125 5 Jun-16 21:00
80 Faridpur 132 138 13 Jun-16 06:00 120 8 Jun-16 14:00
81 Madaripur 132 141 12 Jun-16 08:00 120 9 Jun-16 22:00
82 Gopalganj 132 150 24 Jun-16 12:00 119 18 Jun-16 12:00
83 Bagerhat 132 145 12 Jun-16 06:00 110 11 Jun-16 17:00
84 Mongla 132 140 12 Jun-16 06:00 116 9 Jun-16 22:00
85 Satkhira 132 141 12 Jun-16 07:00 120 7 Jun-16 22:00
86 Gallamari 132 140 12 Jun-16 06:00 122 9 Jun-16 22:00
87 Magura 132 135 13 Jun-16 05:00 105 8 Jun-16 08:00
88 Chuadanga 132 137 13 Jun-16 01:00 106 9 Jun-16 23:00
89 Barisal 132 141 12 Jun-16 06:00 125 10 Jun-16 01:00
90 Patuakhali 132 140 12 Jun-16 07:00 115 24 Jun-16 15:00
91 Bhandaria 132 142 12 Jun-16 06:00 120 9 Jun-16 22:00
92 Ishurdi 132 137 19 Jun-16 18:00 125 11 Jun-16 02:00
93 Natore 132 137 19 Jun-16 16:00 125 30 Jun-16 01:00
94 Bogra 132 137 11 Jun-16 08:00 120 12 Jun-16 21:00
95 Noagaon 132 134 19 Jun-16 16:00 117 30 Jun-16 21:00
96 Rajshahi 132 137 9 Jun-16 18:00 123 11 Jun-16 15:00
97 Chapai Nawabganj 132 135 9 Jun-16 18:00 120 22 Jun-16 21:00
98 Amnura 132 139 18 Jun-16 18:30 0 28 Jun-16 21:00
99 Pabna 132 132 23 Jun-16 12:00 120 9 Jun-16 22:00
100 Shahjadpur 132 138 4 Jun-16 18:30 130 2 Jun-16 13:00
101 Serajganj 132 134 9 Jun-16 19:00 119 29 Jun-16 15:00
102 Niyamatpur 132 133 11 Jun-16 08:00 115 6 Jun-16 20:00
103 Joypurhat 132 135 11 Jun-16 07:00 116 30 Jun-16 21:00
104 Rangpur 132 130 11 Jun-16 07:00 110 5 Jun-16 21:00
Page 120
Page | 105
105 Lalmonirhat 132 130 11 Jun-16 08:00 104 12 Jun-16 21:00
106 Saidpur 132 130 11 Jun-16 07:00 109 12 Jun-16 20:00
107 Purbasadipur 132 132 11 Jun-16 08:00 107 30 Jun-16 21:00
108 Thakurgaon 132 130 7 Jun-16 08:00 106 13 Jun-16 21:00
109 Palashbari 132 134 11 Jun-16 07:00 112 9 Jun-16 22:00
110 Barapukuria 132 132 11 Jun-16 07:00 112 13 Jun-16 20:00
111 Panchagarh 132 127 11 Jun-16 07:00 95 30 Jun-16 21:00
Executive Engineer
Information Management Division
LDC, PGCB, Dhaka.
Page 121
Page | 106
Appendix G: Sub-Station Maximum Load (Sample June 2016)
QF-MIS-08
POWER GRID COMPANY OF BANGLADESH LTD.
Sub-Station Maximum Load
Month: June-16
A. 400/230 kV Sub-Station.
Circle Sl No
Sub-Station Name
Sub-Station Capacity (MVA)
Current Month Previous Month This Month Last Year Maxm Load Received
Till-to-date
Maxm Load (MW)
Date Time Maxm Load (MW)
Date Time Maxm Load (MW)
Date Time Maxm Load (MW)
Date Time
HVDC 1 HVDC 3x201=603 459 19.06.16 20:00 461 22.05.16 08:30 454 04.06.15 01:00 481 01.01.15 14:00
Comilla 2 Bibiyana 312/416/520 358 10.6.16 14:57 352 12.5.16 10:00 384 19.12.15 23:00
B. 230/132KV Sub-Station.
Dhaka ( South)
1 Haripur 3x(3x75)=675 324 03.06.16 22:00 444 25.05.16 20:00 411 30.06.15 07:00 558 25.02.15 18:30
2 Shiddirganj 2x300=600 232 26.06.16 13:00 236 12.05.16 10:00 218 29.06.15 15:00 236 21.04.16 16:00
3 Rampura 3x225=675 540 11.06.16 10:00 510 14.05.16 12:00 555 07.06.15 15:00 615 07.04.16 12:00
4 Maniknagar 2x300=600 232 27.06.16 14:00 224 05.05.16 16:00 230 29.06.15 15:00 232 27.06.16 14:00
5 Hasnabad 3x225=675 304 01.06.16 07:00 325 05.05.16 06:00 330 30.06.15 05:00 365 24.05.15 00:00
Dhaka ( North )
6 Aminbazar 3x(3x75)=675 431 25.06.16 21:00 388 17.05.2016 23:00 444 01.06.2015 00:00 461 06.05.15 21:00
7 Agargoan 2x(180/240/300)=600 244 25.06.16 21:00 242 17.05.2016 19:00 170 20.06.2015 20:00 244 25.06.16 21:00
8 Tongi 3x(3x75)=675 435 02.06.16 21:00 420 29.05.2016 19:00 405 08.06.2015 18:00 450 03.11.13 18:30
Comilla 9 Comilla(N) (3x75)x2=450 268 23.06.16 13:00 322 01.05.16 18:30 297 24.06.15 05:00 385 28.07.14 00:00
10 Fenchuganj 1x225/300=300 192 02.06.16 07:00 250 14.5.16 06:00 266 29.6.15 15:00 303 11.9.13 11:00
Chittagong 11 Hathazari 4 x 60/150=600 440 02.06.16 11:00 116 03.05.16 11:00 472 08.06.15 19:30 488 16.07.15 13:00
Chittagong (Private) 12 BSRM 2 x 130/140=280 102.3 18.06.16 10:00 97 23.05.16 13:00 0 102.3 18.06.16 10:00
13 AKSML 1 x 80, 2x
130/150=380 199.6 03.06.16 16:00 194.3 29.05.16 12:00 0 204.3 19.01.16 19:00
Bogra 14 Barapukuria (3x75)x2=450 360.0 29.06.16 20:00 346.0 02.05.16 19:30 396.0 25.06.15 22:00 396.0 25.06.15 22:00
15 Bogra (3x75)x2=450 318.0 15.06.16 21:00 346.0 10.04.16 06:00 218.0 30.06.15 22:00 346.0 10.04.16 06:00
HVDC 16 Ishurdi 3x(3x75)=675 465 29.06.16 05:00 450 29/05/16 01:00 390 6.09.15 8:00 510 2.06.15 09:00
17 Baghabari 1x3x75=225 100 26.06.16 15:00 75 01.05.15 12:00 80 13/6/15 05:00 150 14/04/16 09:00
Khulna
18 Khulna South
3x75x2=450 324 10.06.16 14:00 360 13.05.16 4:00 362 29.06.15 22:00 430 08.05.15 1:00
19 Barisal North
(3x75/100)x2=600 80 06.06.16 12:00 88 21.05.16 21:30 - - - 200 17.08.15 0:00
Page: 09 of 42
Page 122
Page | 107
QF-MIS-08
POWER GRID COMPANY OF BANGLADESH LTD.
Sub-Station Maximum Load Month: June-16
C.132/33KV Sub-Station
Circle Sl No
Sub-Station Name
Sub-Station Capacity (MVA)
Current Month Previous Month This Month Last Year Maxm Load Received
Till-to-date
Maxm Load (MW)
Date Time Maxm Load (MW)
Date Time Maxm Load (MW)
Date Time Maxm Load (MW)
Date Time
Dhaka (South)
1 Siddhirganj 2X50/83.3=166.6 122 04.06.16 15:00 118 31.05.16 12:00 120 01.06.15 12:00 126 10.07.14 09:00
2 Shaympur 4X50/75=300 167 29.06.16 12:00:00 149 11.05.16 00:00 138 07.06.15 00:00 167 29.06.16 12:00
3 Bhulta 1X35/50+1X50/75=125 85 15.06.16 02:00:00 75 30.05.15 21:00 73 24.06.15 2:00:00 85 15.06.16 02:00
4 Narsingdi 1x50/75=75 66 19.06.16 22:00 62 14.05.16 00:00 55 08.06.15 22:00 67 30.03.14 20:00
5 Ullon 3X35/50=150 101 28.06.16 20:00 92 16.05.16 19:00 104 20.06.15 20:00 118 08.07.97 18:30
6 Maniknagar 2X50/75=150 98 26.06.16 14:00 96 05.05.16 16:00 108 07.06.15 19:30 110 08.07.97 20:00
7 Hasnabad 3X66/100=300 162 16.06.16 20:00 156 05.05.16 20:00 160 23.06.15 22:00 168 26.06.14 22:00
8 Gulshan 2X80/120=240 152.00 28.06.16 15:00 153.00 12.05.16 13:00 157.60 08.06.15 16:00 160.2 17.09.15 11:00
9 Munshigonj 2X50/75=150 114 29.06.16 21:00 106 14.05.16 22:00 108 07.06.15 20:00 114 29.06.16 21:00
10 Sonargaon 2x50/75=150 58 19.06.16 21:00 51 08.05.16 20:00 44 24.06.15 19:30:00 67 01.06.13 20:00
1 Tongi 3X50/75=225 115 30.06.2016 22:00 109 31.05.2016 19:00 94 01.06.2015 22:00 115 30.06.2016 22:00
Dhaka (North)
2 New Tongi 2X50/75=150 120 16.06.2016 10:00 111 18.05.2016 12:00 97 07.06.2015 09:00 120 16.06.2016 10:00
3 Kabirpur 50/83+2X50/75=233 178 01.06.2016 19:00 173 12.05.2016 11:00 164 09.06.2015 15:00 178 01.06.2016 19:00
4 Tangail 2X50/75=150 141 13.06.2016 21:00 139 08.05.2016 20:00 131 03.06.2015 20:00 146 23.03.16 18:30
5 Joydebpur 2X35/50+1X80/120=220 180 15.06.2016 20:00 152 10.05.2016 18:00 146 27.06.2015 19:30 180 15.06.2016 20:00
6 Kallyanpur 3X50/75=225 123 25.06.2016 22:00 111 11.05.2016 19:00 171 01.06.2015 22:00 172 29.04.14 19:00
8 Mirpur 2X50/75+35/50=200 102 04.06.2016 19:30 101.5 11.05.2016 19:00 86.5 09.06.2015 20:00 139.5 21.06.13 19:30
9 Savar 2x50/75=150 110 26.06.2016 22:00 102 08.05.2016 21:00 96 08.06.2015 19:00 110 26.06.2016 22:00
11 Agargaon 2x80/120=240 56 25.06.2016 19:30 57 12.05.2016 13:00 25 08.06.2015 19:30 57 12.05.2016 13:00
12 Vhasantech 2x80/120=240 120 29.06.2016 20:00 117 17.05.2016 19:00 120 09.06.2015 21:00 123 11.04.16 15:00
13 Satmasjid 2x80/120=240 78 04.06.2016 00:00 74 17.05.2016 20:00 30 21.06.2015 21:00 78 04.06.2016 00:00
14 Mymensingh 3x50/75=225 165 05.06.2016 19:30 173 24.05.2016 19:30 157 06.06.2015 21:00 183 22.04.16 20:00
15 Jamalpur 3x25/41=123 77 05.06.2016 05:00 78 06.05.2016 20:00 97 30.06.2015 19:30 115 25.04.14 20:00
16 Kishoreganj 1x15/20+2x25/41=102 60 29.06.2016 17:00 67 16.05.2016 08:00 54 03.06.2015 20:00 67 16.05.2016 8:00
17 Netrokona 1x25/33+ 2x25/41=115 55 17.06.2016 21:00 55 01.05.2016 20:00 60 18.06.2015 20:00 70 19.03.16 7:00
18 Sherpur 2x35/50=100 50.75 10.06.2016 02:00 56.5 12.05.2016 20:00 27.62 04.06.2015 21:00 64.57 22.04.16 1:00
19 Manikganj 3x35/50=150 85 10.06.2016 21:00 82 09.05.2016 19:30 74 20.06.2015 20:00 92 13.04.16 19:00
Page: 10 of 42
Page 123
Page | 108
QF-MIS-08
POWER GRID COMPANY OF BANGLADESH LTD.
Sub-Station Maximum Load
Month: June-16
B.132/33KV Sub-Station.
Circle Sl No
Sub-Station Name
Sub-Station Capacity (MVA)
Current Month Previous Month This Month Last Year Maxm Load Received
Till-to-date
Maxm Load (MW)
Date Time Maxm Load (MW)
Date Time Maxm Load (MW)
Date Time Maxm Load (MW)
Date Time C
om
illa
1 Comilla (N ) 2 x 50/75=150 176 24.06.16 21:00 169 01.05.16 18:30 44 06.06.15 21:00 176 24.06.16 21:00
2 Comilla (S ) 2 x 25/41& 2 x 50/75=232 108 17.06.16 21:00 112 10.05.16 19:00 169 18.06.15 03:00 177 05.07.15 19:30
3 Feni 2 x 25/41=82 109 30.06.16 21:00 88 01.05.16 18:30 100 02.06.15 19:00 114 17.04.11 19:30
4 Chowmuhoni 1 x 25/41& 2 x 50/75 172 28.06.16 03:00 162 12.05.16 02:00 153 02.06.15 23:00 172 28.06.16 03:00
5 Chandpur 2 x 50/75=150 90 28.06.16 01:00 86 17.05.16 23:00 81 24.06.15 19:00 90 01.04.14 20:00
6 Daudkandi 2 x 50/75=150 78 27.06.16 03:00 78 27.05.16 23:00 53 21.06.15 19:30 78 27.05.16 23:00
7 B.Baria 3 x 25/41=123 90 02.06.16 19:30 84 1.5.16 19:00 84 24.6.15 22:00 90 02.6.16 19:30
8 Shahjibazar 2 x 25/41=82 68 28.06.16 21:00 60 26.5.16 19:00 52 16.6.15 21:00 68 28.6.16 21:00
9 Srimongal 3 x 15/20=60 38 04.06.16 21:00 32 18.5.16 19:00 34 4.6.15 19:30 38 01.04.14 19:30
10 Kulaura 2 x 25/41=82 38 30.6.16 21:00 33 24.5.16 19:00 37 20.6.15 19:00 39 07.07.15 21:00
11 Fenchugonj 1 x 15/20 + 1 x 25/41=61 41 25.6.16 19:00 35 23.5.16 20:00 38 20.6.15 22:00 50 18.06.13 19:30
12 Sylhet 2 x 25/41 + 1 x 50/83=165 152 30.6.16 21:00 139 24.5.16 20:00 139 17.6.15 20:00 152 30.6.16 21:00
13 Chatak 2 x 15/20 + 1 x 25/41=81 50 24.6.16 21:00 45 26.5.16 19:30 45 18.6.15 21:00 50 24.6.16 21:00
Chitta
go
ng
1 Hathazari 2 x 50/75=150 101 26.06.16 21:00 91 15.05.16 21:00 93 09.06.15 18:30 101 26.06.16 21:00
2 Baraulia 2 x 48/64=128 82 27.06.16 1:00 98 27.05.16 01:00 108 07.06.15 02:00 118 07.06.15 02:00
3 Khulshi 2 x 80/120=240 132 15.06.16 15:00 132 31.05.16 15:00 123 17.06.15 17:00 132 15.06.16 15:00
4 Halishahar 1 x 48/64, 2 x 48/63=190 141 23.06.16 15:00 133 11.05.16 12:00 122 11.06.15 21:00 150 05.04.14 21:00
5 Bakulia 2 x 48/64+1 x 50/75 =203 114 21.06.16 19:30 111 26.05.16 19:00 104 08.06.15 19:00 114 21.06.16 19:30
6 Julda 1 x 48/64=64 23 22.06.16 03:00 19 04.05.16 10:00 25 08.06.15 07:00 30 20.09.15 10:00
7 Shahmirpur 2 x 48/64=128 27.5 05.06.16 00:00 26.1 14.05.16 00:00 19 03.06.15 19:00 30.7 12.09.15 18:00
8 Madunaghat 2x 25/41=82* 59.7 01.06.16 20:00 62.2 01.05.16 18:00 59.1 30.06.15 21:00 62.2 01.05.16 18:00
9 Chandraghona 2 x 15/20=40 29 23.06.16 19:00 29 27.05.16 19:30 30.4 01.06.15 20:00 32 25.03.16 18:30
10 Dohazari 2x 50/75=150 84 27.06.16 20:00 76 06.05.16 22:00 66 02.06.15 03:00 84 27.06.16 20:00
11 Cox’s Bazar 2 x 25/41=82 59 23.06.16 20:00 65 01.05.16 20:00 58 10.06.15 20:00 65 01.05.16 20:00
Chitta
go
ng
(Private
)
12 AKSPL 1 x 25/30=30 13 23.06.16 09:00 18 16.05.16 21:00 23.8 07.06.15 22:00 25 06.04.16 21:00
13 BSRM 1 x 64/80=80 56 29.06.16 13:00 56 23.05.16 13:00 50 09.06.15 09:00 58 04.04.16 12:00
14 T K Complex 1 x 50/75=75 11.6 30.06.16 11:00 10.2 01.05.16 21:00 8.2 13.06.15 15:00 11.6 30.06.16 11:00
15 MSL 1 x 25/30=30 21 28.06.16 00:00 18 26.05.16 18:00 16 07.06.15 10:00 21 28.06.16 00:00
16 SSML 1 x 25/30=30 9 03.06.16 00:00 12 29.05.16 03:00 13 09.06.15 08:00 15 19.10.15 05:00
17 KSRM 2 x 35/50=100 36 25.06.16 16:00 36 05.05.16 07:00 0 37 27.01.16 00:00
Note: *33kV RPCL Load Added. Shikalbaha & Kaptai totallly controlled by PDB Page: 11 of 42
Page 124
Page | 109
QF-MIS-08
POWER GRID COMPANY OF BANGLADESH LTD.
Sub-Station Maximum Load Month: June-16
B.132/33 kV Sub-Station.
Circle Sl No
Sub-Station Name
Sub-Station Capacity (MVA)
Current Month Previous Month This Month Last Year Maxm Load Received
Till-to-date
Maxm Load (MW)
Date Time Maxm Load (MW)
Date Time Maxm Load (MW)
Date Time Maxm Load (MW)
Date Time
Bogra
1 Natore 2x25/41+1x35/50=132 85.0 30.06.16 21:00 86.0 09.04.16 19:00 77.0 06.06.15 21:00 86.0 29.03.16 19:30
2 Rajshahi 2x50/75+1x35/50=200 134.0 08.06.16 21:00 133.0 21.04.16 21:00 114.0 07.06.15 20:00 134.0 08.06.16 21:00
3 chapai-Nababgoanj
1x25/41+3x15/20=101 62.0 30.06.16 21:00 62.0 15.04.16 19:30 65.0 03.06.15 22:00 79.0 24.03.15 21:00
4 Naogaon 2x50/75+1x25/41=191 102.0 30.06.16 22:00 108.0 15.04.16 20:00 82.0 20.06.15 22:00 108.0 25.03.16 20:00
5 Niamotpur 2x35/50=100 46.0 29.06.16 21:00 78.0 14.04.16 21:00 58.0 19.06.15 21:00 86.0 23.03.16 19:00
6 Amnura 1x35/50=50 31.0 30.06.16 19:30 28.0 16.04.16 21:00 18.0 20.06.15 19:00 31.0 30.06.16 19:30
7 Bogra 2x25/41+2x50/75=232 210.0 30.06.16 22:00 219.0 11.04.16 19:30 183.0 01.06.15 20:00 219.0 11.04.16 19:30
8 Palashbari 2x25/41+3x15/20=142 82.0 21.06.16 21:00 86.0 14.04.16 19:00 63.0 30.06.15 22:00 86.0 14.04.16 19:00
9 Sirajgonj 2x25/41+1x15/20+1x35/50=152 80.0 29.06.16 20:00 78.0 10.04.16 20:00 62.0 08.06.15 21:00 80.0 29.06.16 20:00
10 Joypurhat 2x25/41=82 33.0 10.06.16 19:30 36.0 05.04.16 19:00 29.0 16.06.15 19:30 36.0 05.04.16 19:00
11 Rangpur 2x50/75+2x10/13.3=176.6 106.0 28.06.16 23:00 103.0 10.05.16 21:00 89.0 30.06.15 21:00 106.0 28.06.16 23:00
12 Saidpur 2x25/41+1x35/50=132 88.0 06.06.16 20:00 84.0 24.05.16 19:30 76.0 19.06.15 20:00 94.0 06.04.16 19:30
13 Purbasadipur 1x25/41+2x15/20+1x50/75=156 79.0 26.06.16 20:00 75.0 25.05.16 21:00 71.0 17.06.15 21:00 79.0 26.06.16 20:00
14 Thakurgaon 2x25/41=82 58.0 08.06.16 22:00 54.0 30.05.16 21:00 60.0 03.06.15 20:00 70.0 04.08.15 19:30
15 Lalmonirhat 2x12.5/16.66+4x15/20=113 70.0 11.06.16 19:30 65.0 22.5.16 05:00 58.0 07.06.15 22:00 70.0 11.06.16 19:30
16 Barapukuria 2x25/41+2x15/20=122 42.0 29.06.16 21:00 28.0 10.05.16 21:00 38.0 06.06.15 20:00 45.0 09.04.16 21:00
17 Panchagar 2x25/41=82 28.0 02.06.16 19:30 27.0 21.05.16 20:00 19.0 19.06.15 20:00 34.0 20.02.16 19:00
HVDC
1 Jessore 25/41x2+1x50/83.3=163.3 130 21.06.16 20:00 136 12.05.16 19:40 114 11.06.15 19:30 136 12.05.16 19:40
2 Jhenaidah 25/41x2=82 73 30.06.16 22:00 72 12.05.16 19:30 61 11.06.15 21:00 73 30.06.16 22:00
3 Khustia 50/75x2=150 100 30.06.16 21:00 94 15.05.16 22:00 88 24.06.15 23:00 100 30.06.16 21:00
4 Bheramara 25/41x2=82 44 26.06.16 23:00 42 28.05.16 21:00 37 30.06.15 21:00 44 26.06.16 23:00
5 Chuadanga 25/41x2=82 53 07.06.16 19:30 52 11.05.16 12:00 51.5 12.06.15 20:00 54 29.09.15 19:00
6 Magura 25/41x2=82 39 30.06.16 21:00 35 30.05.16 19:00 30 02.06.15 19:30 39 30.06.16 21:00
7 Pabna 2x50/75=150 92 25.06.16 20:00 86 15/05/16 21:00 77 18/6/15 22:00 92 25.06.16 20:00
8 Shajadpur 2x15/20+1x35/50+25/41x1=131 77 14.06.16 21:00 73 05.05.16 19:30 58 06.05.15 20:00 80 25.04.16 21:00
9 Ishwardi 2x15/20+1x25/41=81 47 30.06.16 23:00 42.4 16/05/16 20:00 43 21/6/15 03:00 47 30.06.16 23:00
Page: 12 of 42
Page 125
Page | 110
QF-MIS-08
POWER GRID COMPANY OF BANGLADESH LTD.
Sub-Station Maximum Load Month: June-16
B.132/33KV Sub-Station.
Circle Sl No
Sub-Station Name
Sub-Station Capacity (MVA)
Current Month Previous Month This Month Last Year Maxm Load Received
Till-to-date
Maxm Load (MW)
Date Time Maxm Load (MW)
Date Time Maxm Load (MW)
Date Time Maxm Load (MW)
Date Time
1 Goalpara 12.5/16.66x2=32.3 39.6 08.06.16 21:00 36.4 29.05.16 19:30 36.0 02.06.15 19:30 60.61 22.03.12 19:30
Khulna
2 Khulna
Central 48/64x3=192 90.0 20.06.16 21:00 93.0 09.05.16 21:00 81.0 01.06.15 21:00 102.00 13.08.15 20:00
3 Noapara 2x15/20,44.1/63=103 59.0 23.06.16 21:00 54.0 03.05.16 20:00 56.0 29.06.15 21:00 59.0 13.08.15 20:00
4 Bagerhat 25/41x2=82 73.0 08.06.16 19:30 67.0 08.05.16 19:00 58.0 04.06.15 19:00 73.0 23.06.16 19:30
5 Mongla 25/41x2=82 32.0 06.06.16 11:00 34.0 31.05.16 09:00 29.0 01.06.15 10:00 34.0 31.05.16 09:00
6 Satkhira 25/41x2=82 73.0 29.06.16 21:00 70.0 27.05.16 21:00 62.3 08.06.15 22:00 73.0 29.06.16 21:00
7 Gallamari
GIS 25/41x2=82 47.8 07.06.16 17:00 47.8 10.05.16 22:00 46.0 09.06.15 13:00 52.8 10.04.16 08:00
14 Faridpur 75/50x2=150 120.0 05.06.16 21:00 120.0 22.05.16 20:00 102.00 25.06.15 21:00 120.0 22.05.16 20:00
15 Madaripur 25/41x3=123 101.0 10.06.16 19:30 101.0 09.05.16 20:00 93.00 02.06.15 21:00 101.0 09.05.16 20:00
16 Gopalgong 25/41x2=82 54.0 25.06.16 21:00 49.2 23.05.16 22:00 44.00 02.06.15 21:00 54.0 25.06.16 21:00
17 Barishal 50/75x2=150 112 26.06.16 19:30 108.00 30.05.16 19:30 88 02.06.15 19:00 112.00 26.06.16 19:30
18 Patuakhali 15/20x2+25/41=81 40.5 29.06.16 22:00 41.50 09.05.16 21:00 27 06.06.15 19:00 42.00 22.04.16 21:00
19 Bhandaria 2x25/41=82 40 16.06.16 21:00 38.00 08.05.16 20:00 32 06.06.15 19:00 40.00 16.06.16 21:00
Page: 13 of 42
Page 126
Page | 111
Appendix H: Transmission System Data (Sample June 2016)
QF-MIS-04
POWER GRID COMPANY OF BANGLADESH LTD.
TRANSMISSION SYSTEM DATA Month: June-16
01. Transmission Line Information:
A) 400KV Transmission Line Length (Ckt km) : 220.7
B) 230KV Transmission Line Length (Ckt km) : 3185.166
C) 132KV Transmission Line Length (Ckt km) : 6486.83 (Including DPDC 85.2 ckt. km)
02. 400KV Sub-Station Information:
Sl No
Name of Sub-station Circle Capacity (MW)
1 Bheramara HVDC Back to Back Station HVDC 500
03. 400/230KV Sub-Station Information:
Sl No
Name of Sub-station Circle Capacity (MVA)
1 Bibiyana Comilla 520
04.Grid Circle wise 230/132KV Sub-Station Information
Sl No
Circle Name
PGCB PDB Private
Nos of Substation
Capacity (MVA)
Nos of Substation
Capacity (MVA) Nos of
Substation Capacity (MVA)
1 Bogra(Switching=1) 3 900 0 0 0 0
2 Chittagong 1 600 0 0 2 660
3 Comilla 2 750 1 300
4 Dhaka(N) 3 1950 1 250
5 Dhaka(S) (Switching=1)
6 3225 0 0
6 HVDC 2 900 0 0
7 Khulna 2 1050 0 0
Total 19 9375 2 550 2 660
Grand Total (MVA) 10585
05. Grid Circle wise 132/33KV Sub-Station Information:
Sl No
Circle Name
PGCB PDB DPDC,DESCO & Others
Nos of Substation
Capacity (MVA)
Nos of Substation
Capacity (MVA)
Nos of Substation
Capacity (MVA)
1 Bogra 17 2245.6 - - 0 0
2 Chittagong 11 1457 2 136.6 6 345
3 Comilla 13 1711 1 82 - -
4 Dhaka(N) 17 3108 1 126 6 1125
5 Dhaka(S) 10 1806.6 8 1035
6 HVDC 9 1003.3 - - Bheramara
GKP 20
7 Khulna 13 1324 1 60 - -
Total 90 12,656 5 404.6 21 2525
Grand Total (MVA) 15,585
06. Grid Circle wise Capacitor Bank Information:
Sl No.
Circle Name
At 33KV At 132KV
No Of Units
Capacity (MVAR) No Of Units Capacity(MVAR)
1 Chittagong 43 215 1 45
2 Comilla 12 120 0 0
3 Dhaka(S) 26 272.5 2 90
4 Dhaka(N) 18 112.5 2 90
5 HVDC 12 82.5 2 90
6 Khulna 18 135 3 135
7 Bogra 62 402.5 0 0
Total 191 1340 10 450
Page 05 of 42


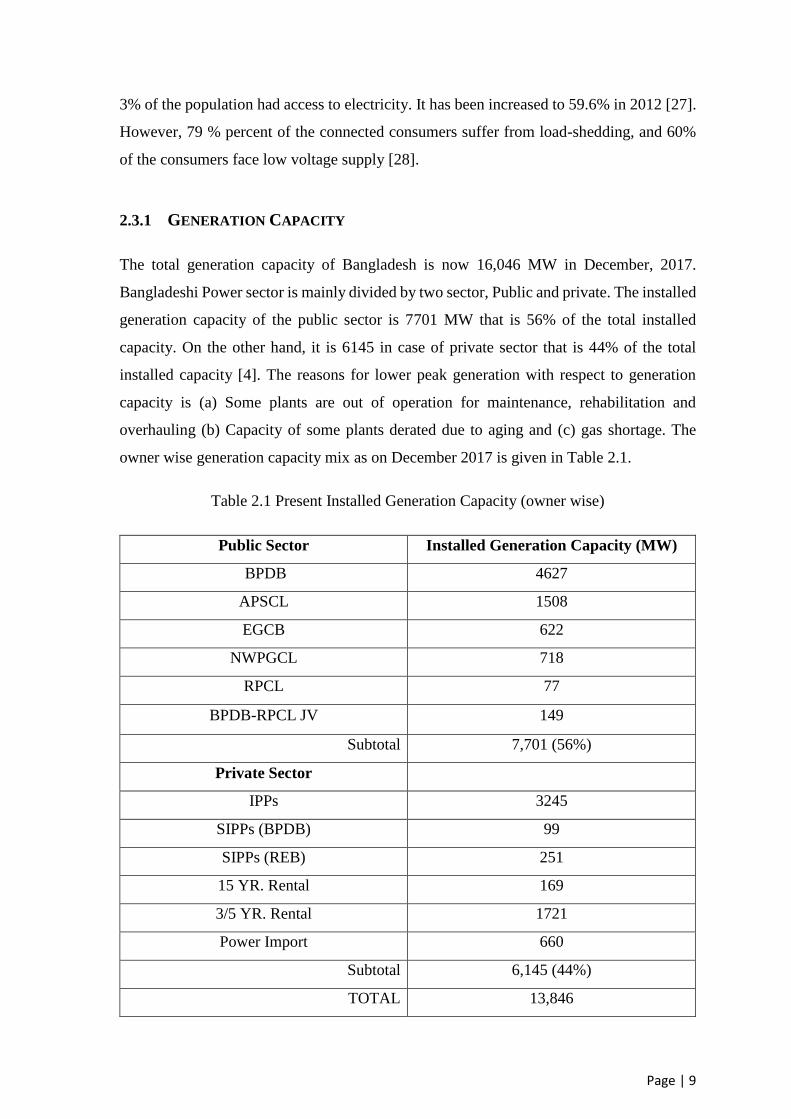


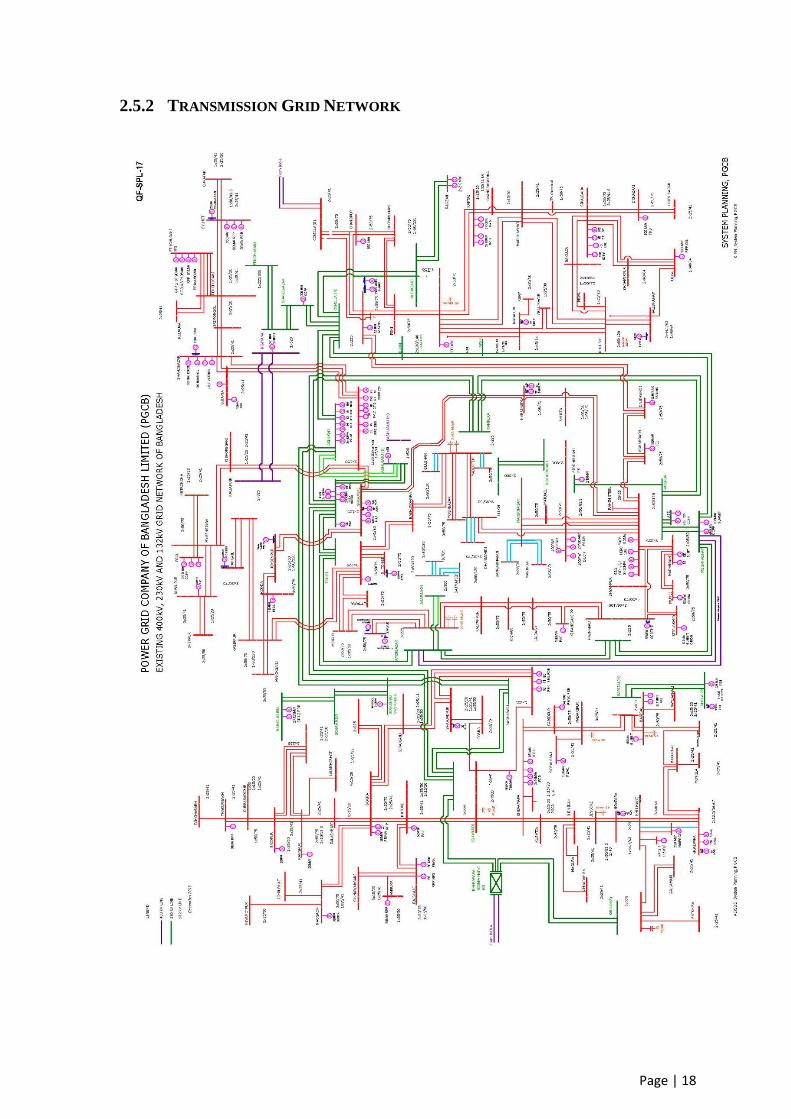


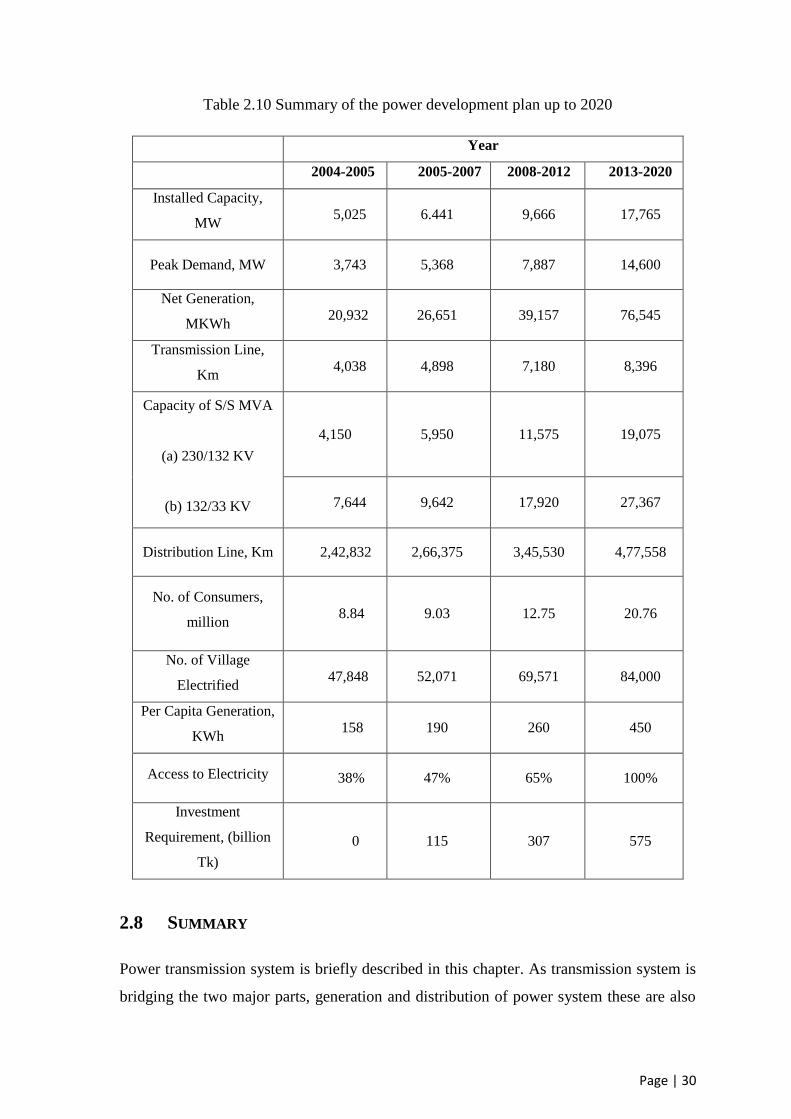


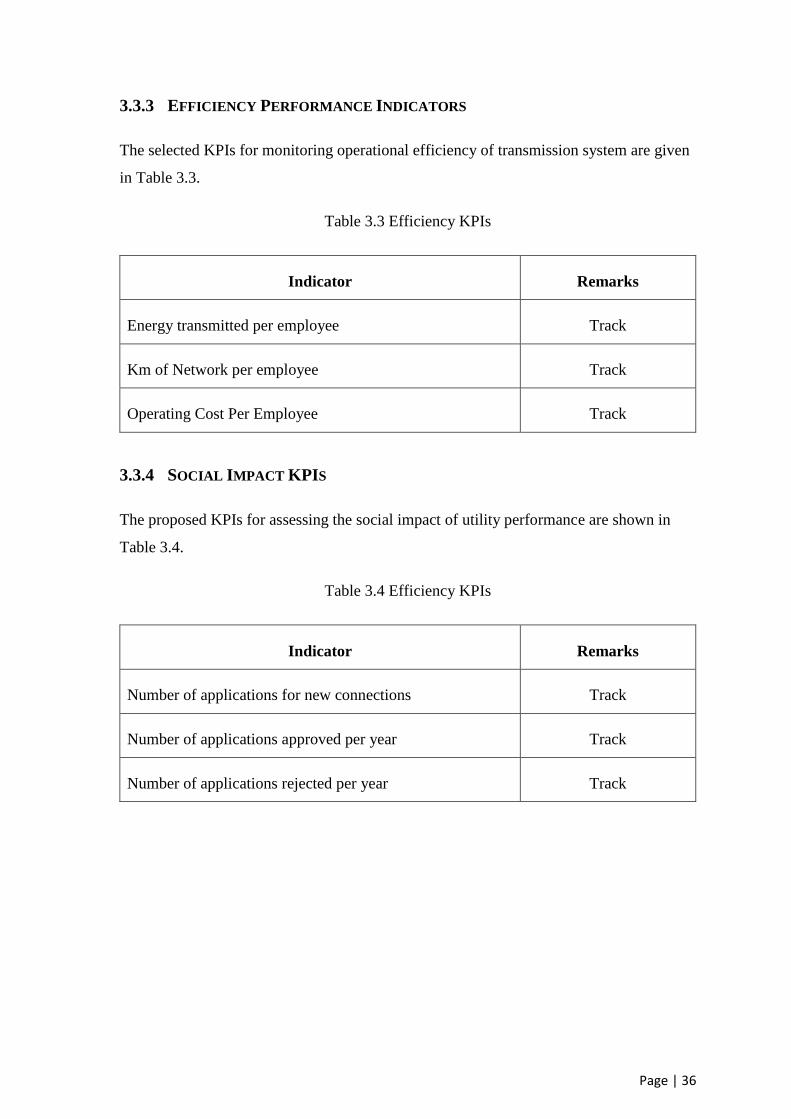


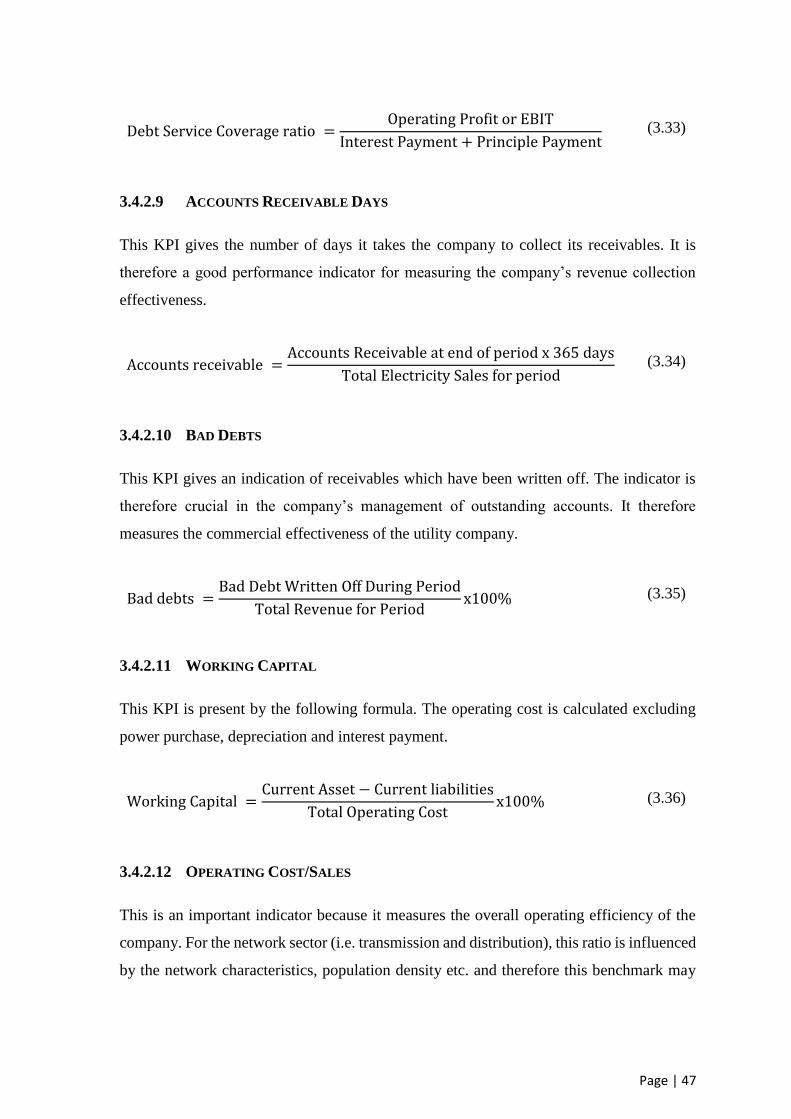


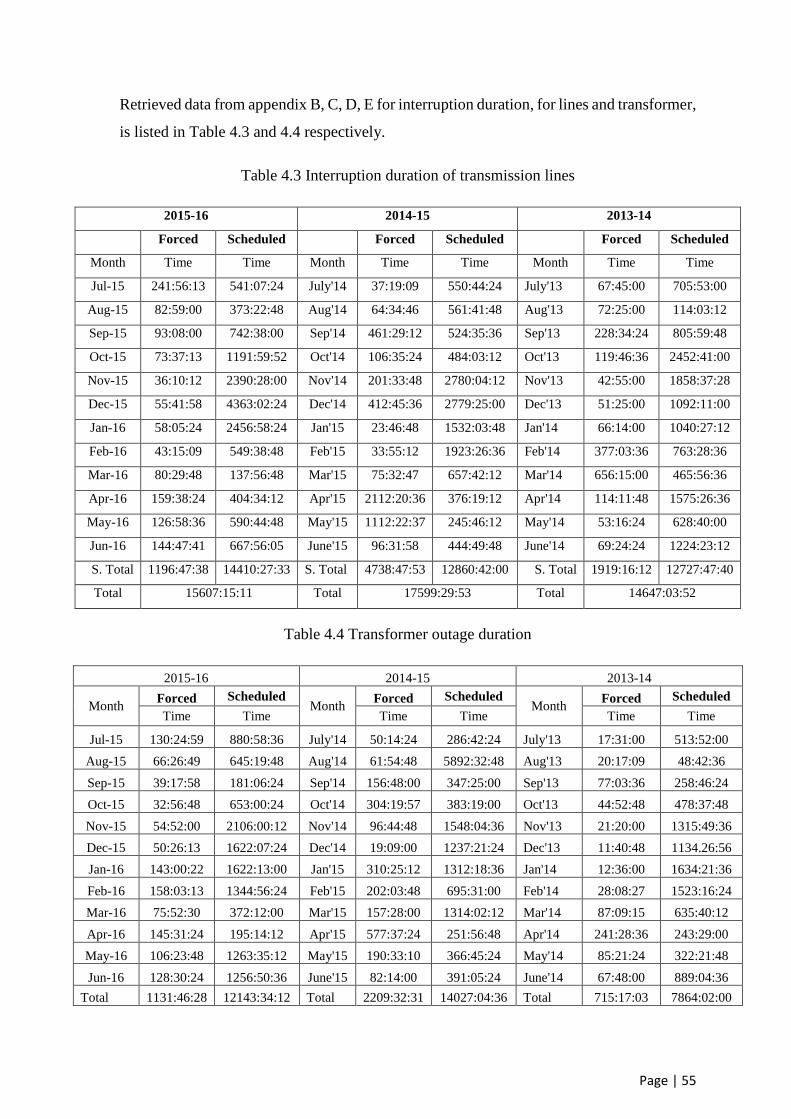


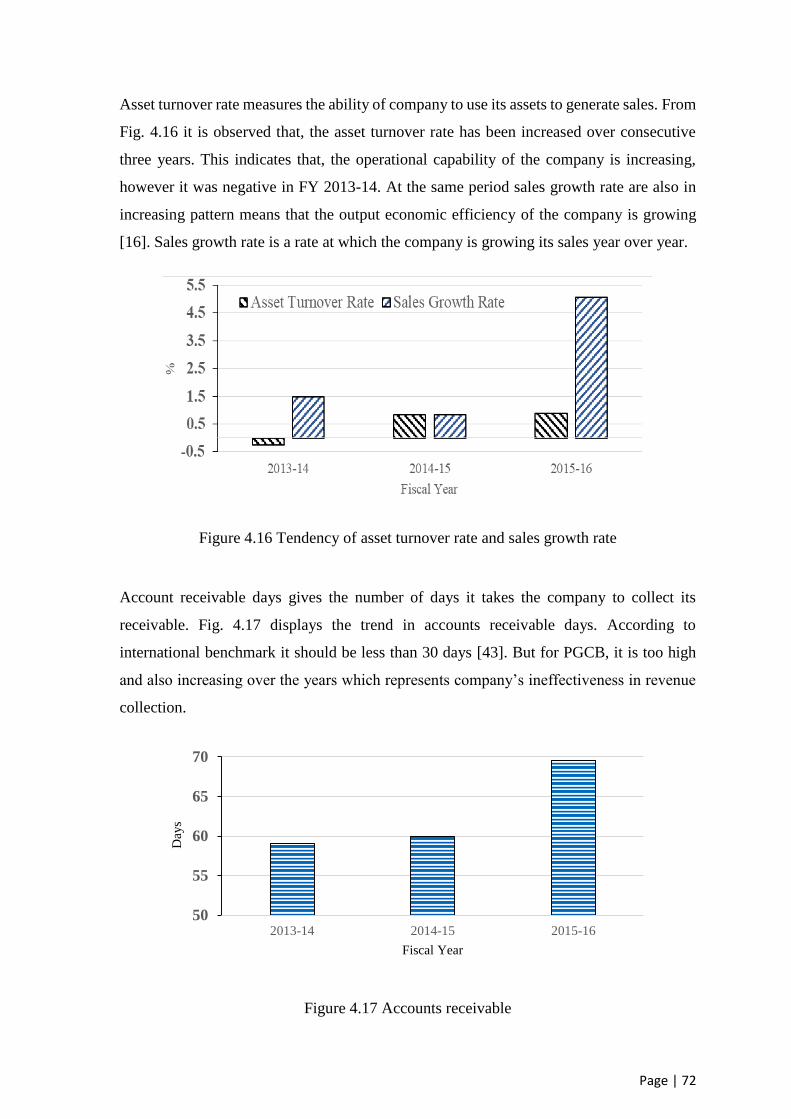

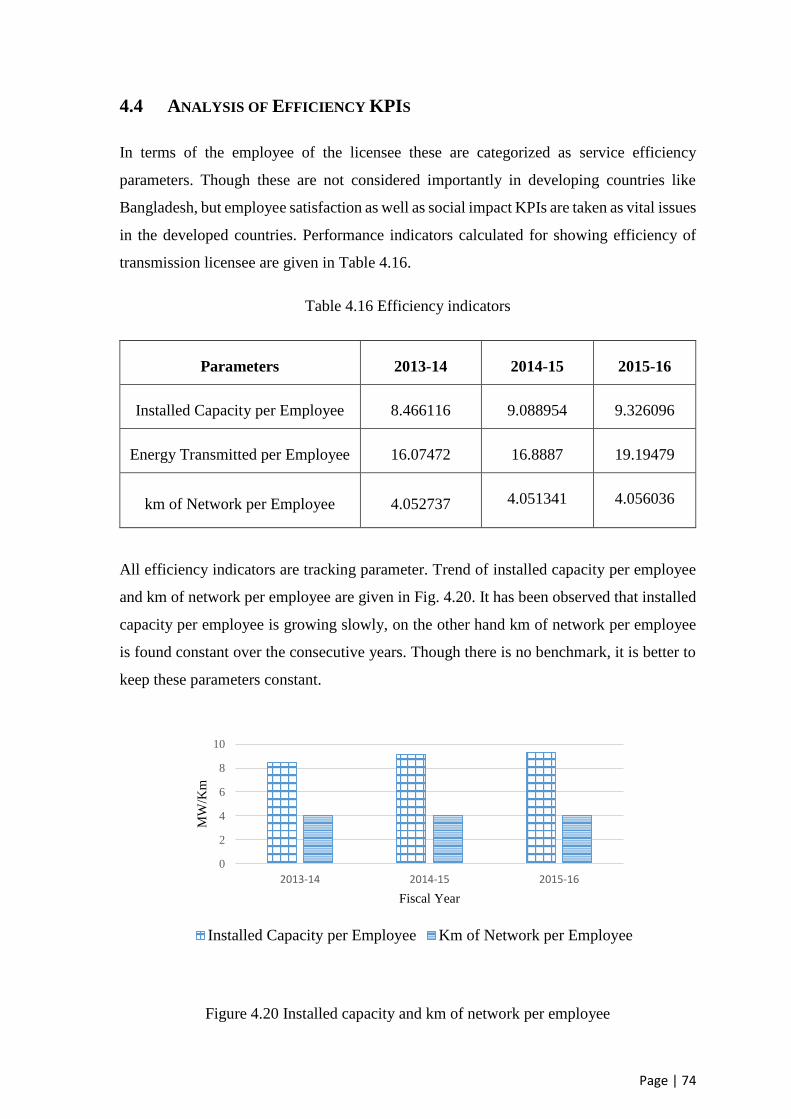
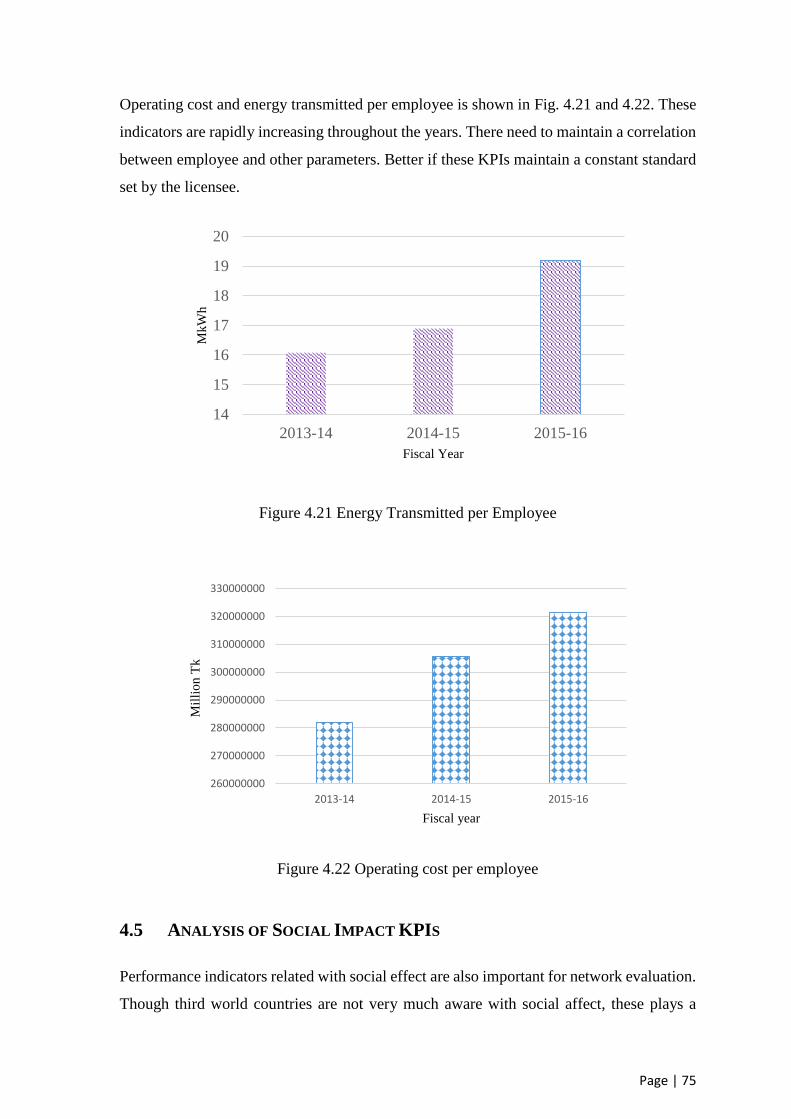


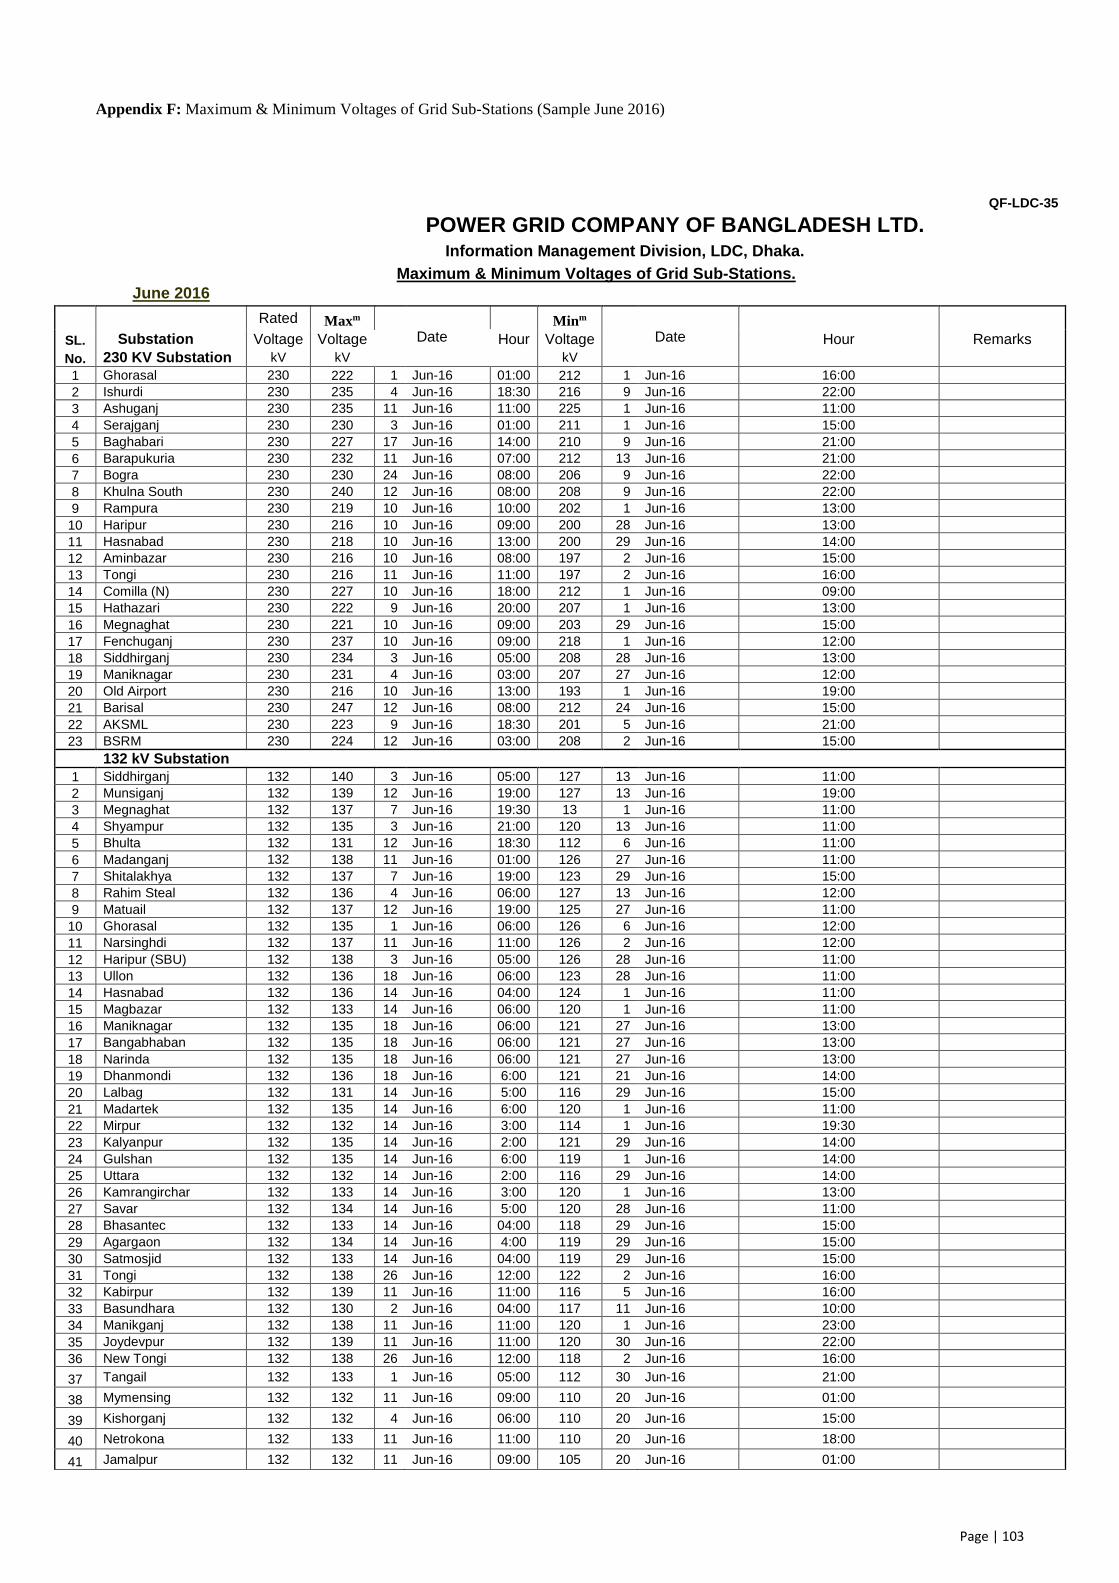
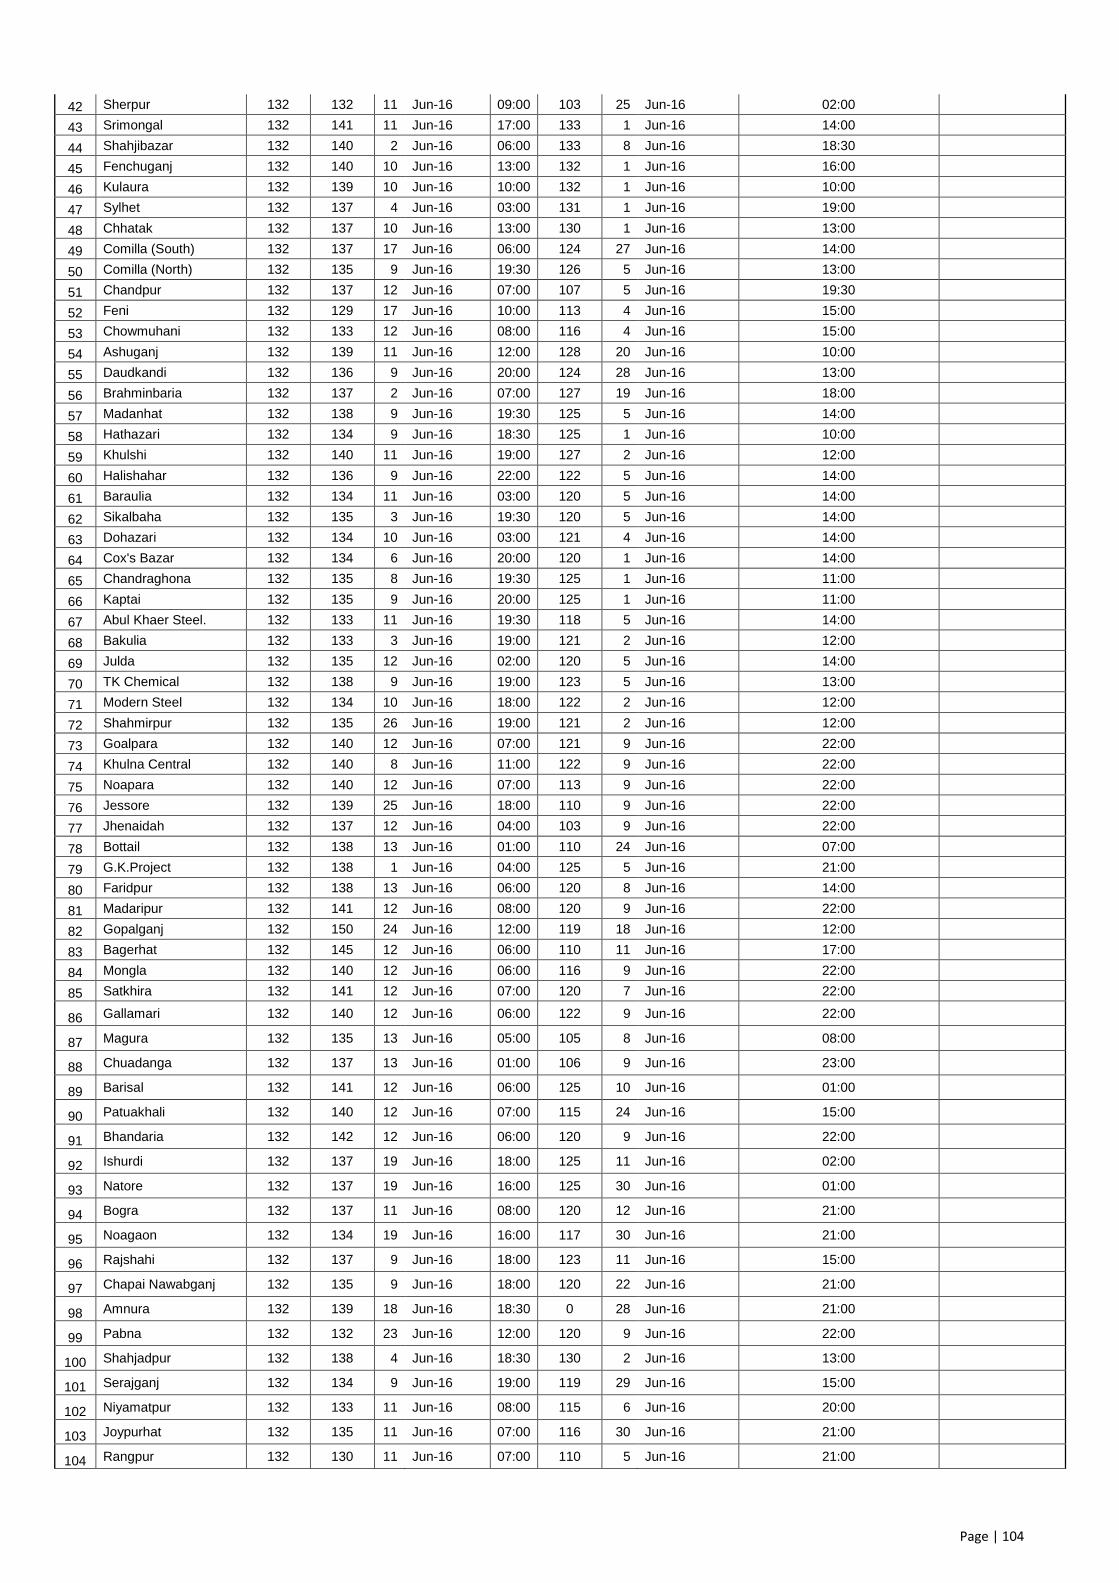


![Cisco Network Performance Evaluation Using Packet Tracer...906 Cisco Network Performance Evaluation Using Packet Tracer [4]. Single with a single destination address data transmission,](https://static.documents.pub/doc/80x56/60bd166767cd6b5ee268e3bc/cisco-network-performance-evaluation-using-packet-tracer-906-cisco-network-performance.jpg)


