60


Message from the Commissioner 2
Goals:
Safety and Security 3
Preservation 11
Efficiency and Effectiveness 29
Quality of Life 43
Accountability and Transparency 51
List of Metrics 55
Figure Index 57
Table of Contents
The Bulkeley Bridge - Spanning a Century - 1908 to 2008 (pictured here and on the cover)
1
The Connecticut Department of Transportation (CTDOT) has initiated a Performance Measures Program. Performance measurement is the use of statistical evidence to determine progress toward specific organizational objectives. This includes both evidence of actual fact, such as measurement of pavement smoothness, and measurement of customer satisfaction. The metrics indentified in this report constitute the starting point for measuring and enhancing our performance in the future.
Introduction

The Connecticut Department of Transportation is On the Move - committed to full transparency in its business of preserving, managing and developing the State’s transportation system. This Performance Metrics Report is a first step toward becoming a performance driven organization, focused on results and accountability. The residents and business community of Connecticut, “our customers,” depend on a safe and efficient intermodal transportation network to connect them to their jobs, schools and everyday life. In essence, this is our core mission, to connect people with life. Our customers have a high expectation of us. It is our desire to exceed these expectations. The establishment of goals and the achievement of them is a fundamental cornerstone of any successful business. Meeting expectations and continuous improvement is the pathway to enhanced credibility and trust. We are committed to preparing this report annually while updating our core performance measures on a continuing basis. This report can be found on our website at www.ct.gov/dot. We will update our progress regularly via our website so that it can be easily tracked. These online tools will become available during 2009. The report is organized into five goals which are linked to our core mission:
• Safety and Security • Preservation • Efficiency and Effectiveness • Quality of Life • Accountability and Transparency
In some instances, we have included statistics from other states to provide an objective sense of how we measure up. It is important to note that this is our first attempt at a comprehensive performance report and we expect further development and refinement of our core business metrics, particularly in financial and project performance areas. In any event, we want to encourage your feedback. So, please tell us what you think by e-mail at [email protected] by telephone at (860) 594-3061, or visit our new website at www.ct.gov/dot and click on - Contact Us. During my short tenure, I have been encouraged by the commitment and energy of my colleagues within the Department. Their collective will and vigor gives me optimism as we move ahead toward a more responsive, confident and capable organization. Joseph F. Marie Commissioner, Connecticut Department of Transportation
Message from the Commissioner
3 2

Safety and Security
It is the objective of the Connecticut Department of Transportation (CTDOT) to ensure the safety and security of all travelers on our multimodal transportation network. In order to reduce the number of fatalities, injuries and risks, the Department optimizes prevention, regulation, construction and maintenance programs. By tracking injury and fatality rates, as well as seat belt use and other measures, the Department gathers the information necessary to develop effective programs that ensure safety and security. Through programs such as Click It or Ticket; CT Operation Lifesaver (promoting rail track safety); Drunk Driving-Over the Limit, Under Arrest; Work Zone Safety; Safe Routes to School; Child Passenger Safety; Teen Driving Assistance and the Connecticut Rider Education Program (CONREP) Motorcycle Safety Courses, the Department strives to keep the traveling public safe.
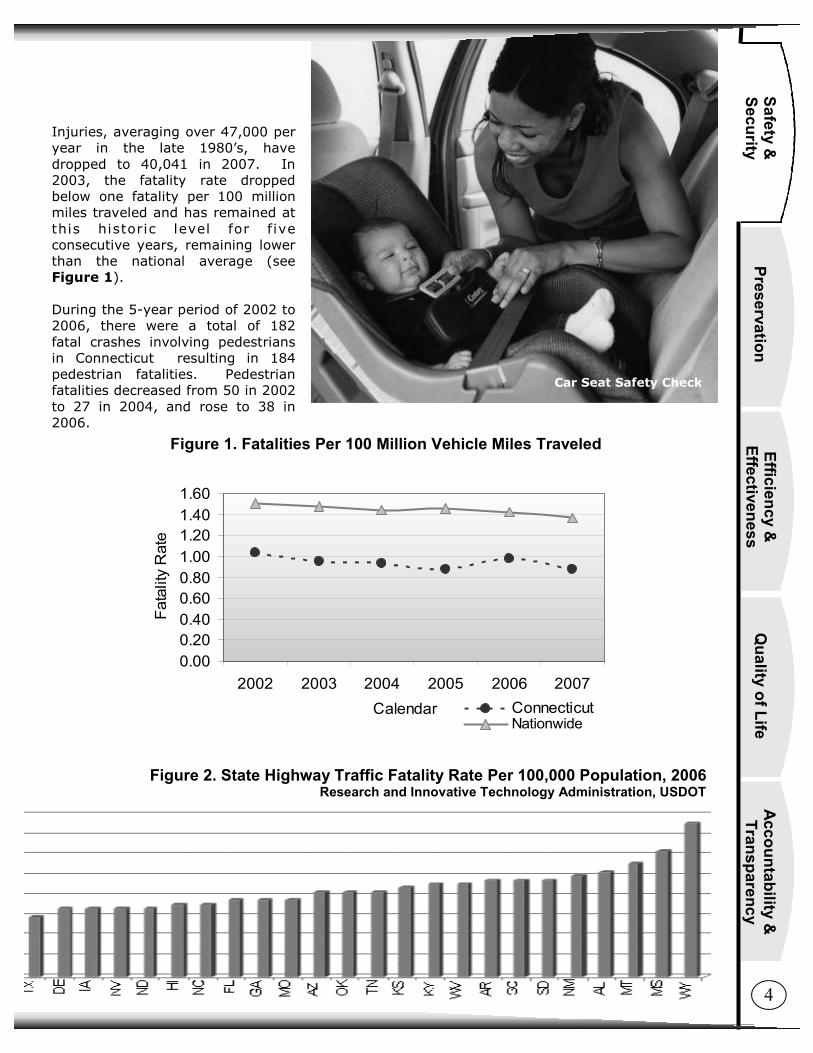
In 2007, Connecticut's fatality rate was less than one fatality per 100 million miles traveled compared with the national figure of 1.37 fatalities (see Figure 1). Overall, Connecticut continues to have one of the lowest vehicle fatality rates in the country, ranked as the fourth safest state for highway traffic fatalities per 100,000 population (see Figure 2). Many of the programs sponsored by the Department have assisted in reducing the fatality rate—most notable are those focusing on seat belt use, impaired driving, work zone safety, motorcycle safety, hazard elimination and pedestrian/bicyclist safety.
Safety Measures During the 5-year period of 2002 to 2006, the number of fatalities in Connecticut declined by 7 percent, compared to a 6 percent decrease in the New England Region, and a 1 percent decrease for the entire nation. The largest declines in Connecticut were in passenger and pedestrian fatalities (39 percent and 28 percent decreases, respectively). Connecticut’s fatalities and injuries as a result of motor vehicle crashes have been steadily declining during the past 20 years. Fatalities, averaging over 400 per year in the late 1980’s, have declined to 296 in 2007.
3
Acc
ount
abili
ty &
Tr
ansp
aren
cy
Qua
lity
of L
ife
Effic
ienc
y &
Ef
fect
iven
ess
Safe
ty &
Se
curit
y Pr
eser
vatio
n
0.000.200.400.600.801.001.201.401.60
2002 2003 2004 2005 2006 2007Calendar Year
Fata
lity
Rat
e
ConnecticutNationwide
Injuries, averaging over 47,000 per year in the late 1980’s, have dropped to 40,041 in 2007. In 2003, the fatality rate dropped below one fatality per 100 million miles traveled and has remained at this historic level for five consecutive years, remaining lower than the national average (see Figure 1). During the 5-year period of 2002 to 2006, there were a total of 182 fatal crashes involving pedestrians in Connecticut resulting in 184 pedestrian fatalities. Pedestrian fatalities decreased from 50 in 2002 to 27 in 2004, and rose to 38 in 2006.
Figure 1. Fatalities Per 100 Million Vehicle Miles Traveled
Figure 2. State Highway Traffic Fatality Rate Per 100,000 Population, 2006 Research and Innovative Technology Administration, USDOT
Car Seat Safety Check
4
Accountability &
Transparency
Quality of Life
Efficiency &
Effectiveness Safety &
Security
Preservation
Hazard Elimination Program The Hazard Elimination Program implements safety improvement projects to reduce the number and severity of crashes. Typical projects include intersection improvements; pavement and shoulder widening; guiderail and barrier improvements; crash cushion installations; roadway alignment modifications, signing, pavement marking and delineation; breakaway highway illumination poles and sign supports; pavement grooving and skid-resistant overlays; shoulder rumble strips; and minor structure replacements or modifications. Highway signing, pavement markings, delineators and traffic signals are essential elements to provide guidance, information and safety to roadway users. In addition, the CTDOT installs and maintains roadside safety devices such as guide rails and impact attenuators to reduce crash severity when vehicles leave the roadway. Roadside mowing and other vegetation management, including tree removal, provide better visibility and clear zones for vehicle recovery.
70%
72%
74%
76%
78%
80%
82%
84%
86%
2002 2003 2004 2005 2006 2007
Connecticut Nationwide
Seat Belt Program
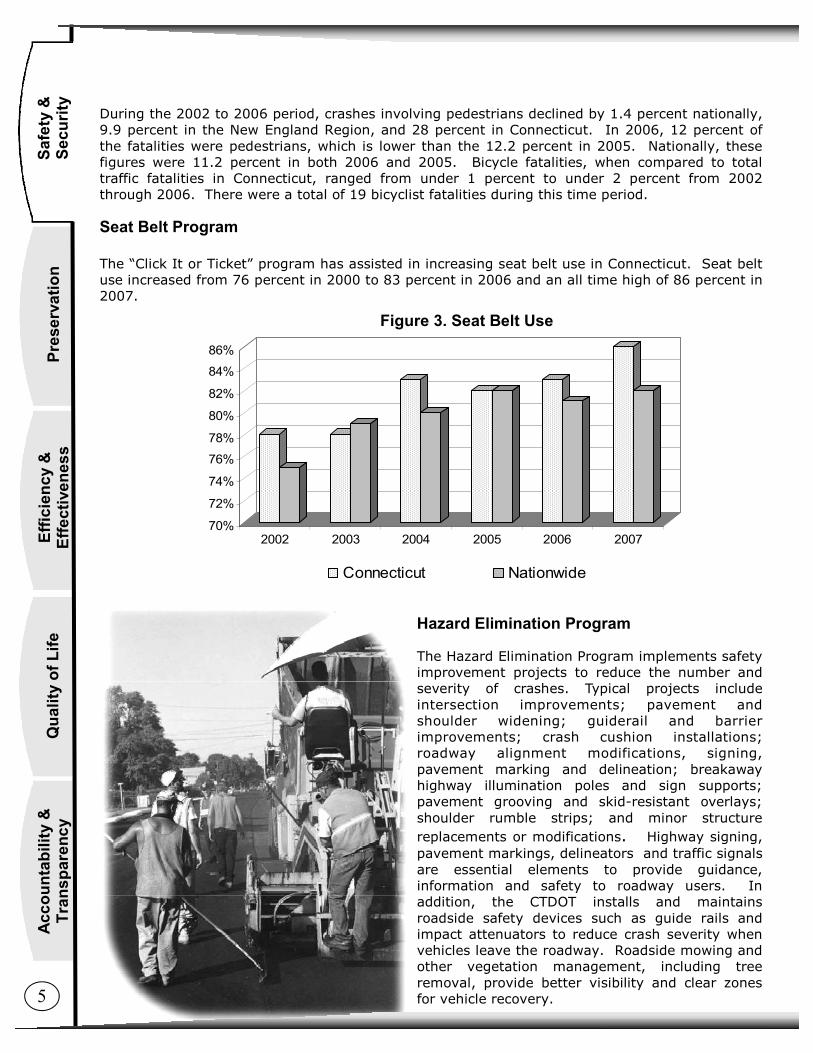
The “Click It or Ticket” program has assisted in increasing seat belt use in Connecticut. Seat belt use increased from 76 percent in 2000 to 83 percent in 2006 and an all time high of 86 percent in 2007.
Figure 3. Seat Belt Use
During the 2002 to 2006 period, crashes involving pedestrians declined by 1.4 percent nationally, 9.9 percent in the New England Region, and 28 percent in Connecticut. In 2006, 12 percent of the fatalities were pedestrians, which is lower than the 12.2 percent in 2005. Nationally, these figures were 11.2 percent in both 2006 and 2005. Bicycle fatalities, when compared to total traffic fatalities in Connecticut, ranged from under 1 percent to under 2 percent from 2002 through 2006. There were a total of 19 bicyclist fatalities during this time period.
5
Acc
ount
abili
ty &
Tr
ansp
aren
cy
Qua
lity
of L
ife
Effic
ienc
y &
Ef
fect
iven
ess
Safe
ty &
Se
curit
y Pr
eser
vatio
n

Motorcycle Safety Program In 2006, a total of 53 motorcycle operators and passengers were killed on Connecticut roadways, representing 17.6 percent of the State’s total traffic fatalities. Based on 85,271 registered motorcycles, the fatality rate per 10,000 registered vehicles was 6.2, an increase from the 2005 rate of 5.2. Even with this increase in fatality rates, Connecticut was still below the national average of 7.3 in 2005 and 7.2 in 2006. The Connecticut Rider Education Program (CONREP) was established in 1982. With motorcycle ridership gaining popularity as a recreational sport and as an alternative method of transportation, there has been an increase every year in the number of riders registering for training. Participation in CONREP has increased from approximately 2,000 in 1996 to over 6,000 in 2007. Preliminary figures indicate that 6,290 persons were trained in 2008 and CONREP is projecting an enrollment of 6,500 in 2009.
Work Zone Safety Program Safety in highway construction or work zones is important to both motorists passing through, and personnel working at these sites. This program also includes incident management zones where emergency responders are present. Work-zone related fatal and serious crashes have fluctuated year to year. During the 2001 to 2006 period, the number of serious crashes fluctuated from a
high of 27 in 2001 to 18 in 2006. During that same period, total crashes dropped from 1,122 in 2001 to 748 in 2006, a 33 percent reduction. Impaired Driving Program Through advertising campaigns such as “Drunk Driving Over the Limit, Under Arrest”, CTDOT has increased awareness and reduced fatalities. Alcohol-related fatal crashes are defined as any fatal crash in which a driver or non-occupant had an estimated blood alcohol concentration (BAC) of 0.01 or above. In Connecticut, the number of these crashes fluctuated from 123 in 2002 to 95 in 2005 and 124 in 2006. Fatal injuries in these crashes also fluctuated during this 5-year period from 135 in 2002 to 104 in 2005 and 131 in 2006.
6
Accountability &
Transparency
Quality of Life
Efficiency &
Effectiveness Safety &
Security
Preservation
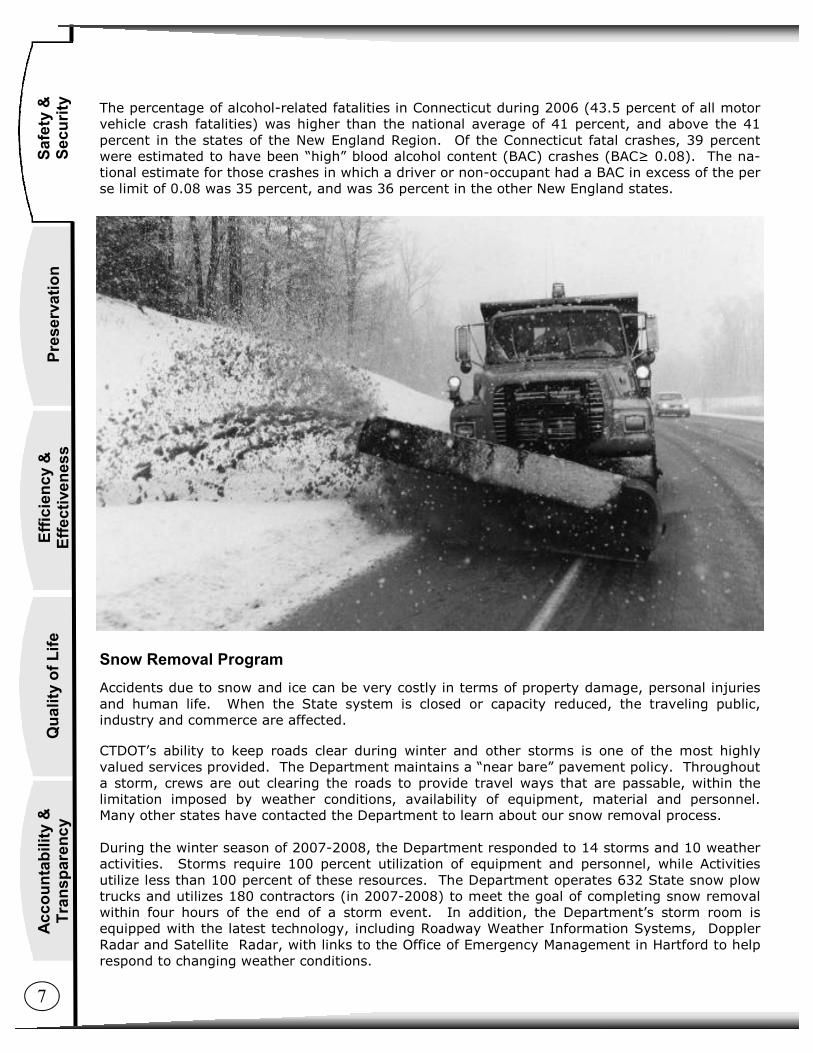
Snow Removal Program Accidents due to snow and ice can be very costly in terms of property damage, personal injuries and human life. When the State system is closed or capacity reduced, the traveling public, industry and commerce are affected. CTDOT’s ability to keep roads clear during winter and other storms is one of the most highly valued services provided. The Department maintains a “near bare” pavement policy. Throughout a storm, crews are out clearing the roads to provide travel ways that are passable, within the limitation imposed by weather conditions, availability of equipment, material and personnel. Many other states have contacted the Department to learn about our snow removal process. During the winter season of 2007-2008, the Department responded to 14 storms and 10 weather activities. Storms require 100 percent utilization of equipment and personnel, while Activities utilize less than 100 percent of these resources. The Department operates 632 State snow plow trucks and utilizes 180 contractors (in 2007-2008) to meet the goal of completing snow removal within four hours of the end of a storm event. In addition, the Department’s storm room is equipped with the latest technology, including Roadway Weather Information Systems, Doppler Radar and Satellite Radar, with links to the Office of Emergency Management in Hartford to help respond to changing weather conditions.
The percentage of alcohol-related fatalities in Connecticut during 2006 (43.5 percent of all motor vehicle crash fatalities) was higher than the national average of 41 percent, and above the 41 percent in the states of the New England Region. Of the Connecticut fatal crashes, 39 percent were estimated to have been “high” blood alcohol content (BAC) crashes (BAC≥ 0.08). The na-tional estimate for those crashes in which a driver or non-occupant had a BAC in excess of the per se limit of 0.08 was 35 percent, and was 36 percent in the other New England states.
7
Acc
ount
abili
ty &
Tr
ansp
aren
cy
Qua
lity
of L
ife
Effic
ienc
y &
Ef
fect
iven
ess
Safe
ty &
Se
curit
y Pr
eser
vatio
n

12
9
18
4
11
6
9
6
14
10
0
5
10
15
20
25
2003 / 2004 2004 / 2005 2005 / 2006 2006 / 2007 2007 / 2008
Storms Activities
CHAMP Connecticut H ighway Ass i s tance Motorist Patrol (CHAMP) is a roadway service patrol program operated by CTDOT, which provides assistance to motorists by changing flat tires, jump-starting, pushing vehicles to shoulders, providing fuel and offering shelter. The service patrols react to accidents and notify the Highway Operations Centers of the need for State Police, medical, fire and/or other emergency response. The drivers remove highway debris and dead animals; report damaged guiderail, illumination and drainage problems; and provide travel assistance to motorists on the highway. In addition, they ensure quick clearance of incidents to reduce traffic congestion and delays. The service is operated weekdays between 5:30 a.m. and 7:00 p.m. Also, CHAMP patrols the Interstate (I-95) Corridor during the summer holidays and Sundays during the peak p.m. traffic period. From July 2007 to June 2008, CHAMP provided assistance to 11,242 motorists along the I-95 corridor and 7,540 motorists in the greater Hartford area. CHAMP assistance has reduced the number of responses necessary by the Department of Public Safety. The current CHAMP fleet consists of 15 service patrol vehicles.
CHAMP Vehicle
Figure 4. Yearly Storm and Weather Activity Totals
8
Accountability &
Transparency
Quality of Life
Efficiency &
Effectiveness Safety &
Security
Preservation

Rail Safety As a part of the operating agreement, Metro-North annually conducts a detailed survey of riders. Figure 5 shows the results of the personal safety questions received from riders on the New Haven Line (CT residents only).
A positive perception of personal safety is correlated with higher ridership and stronger commitment to public transit as a mode of travel.
New Haven Line (CT only) 2004 2005 2006 2007
Safety on trains (% Satisfied) 94% 95% 94% 95%
Safety at stations (% Satisfied) 92% 92% 91% 94%
Safety at parking (% Satisfied) 90% 93% 90% 93%
Figure 5. Customer Perception of Rail Safety
Oversize/Overweight (OS/OW) Permit Issuance Program The OS/OW Program issues approximately 115,000 OS/OW permits per year. CTDOT is the designated lead agency and coordinates with the Department of Motor Vehicles, and the Department of Public Safety, and other State and local authorities to implement the program. The following initiatives are underway to enhance performance and provide faster service to motor carriers and customers. 1. Local Road Routing—the integration of local road mappings which results in a more
comprehensive, efficient and automated process for issuing OS/OW permits. 2. Automated Bridge Analysis—the development of an automated process to provide complete
listings of affected structures, relevant loadings and structural analysis for individual overweight vehicles.
3. The Restriction Manager (RM) program—tracks road closures, bridge clearance and any informational restrictions on the state-maintained highway system. The restrictions entered into the system are used to re-route OS/OW vehicles, locate and report existing dimensional and weight restrictions and can be used for future Departmental applications.
4. CT-ePASS—is the web-based component of the Permit Administration Software System (PASS). PASS provides all the functionality needed to obtain and enter requests for permitted travel, analyzes the request, keeps track of communications related to the approval of a request, issues the permit, and provides extensive reporting capabilities. It allows carriers to electronically order permits 24/7 on-line, and pay by credit card, making the process much easier and faster.
The Department expects that when fully implemented, the time to submit, review and process OS/OW permits will be lowered by 50 percent.
9
Acc
ount
abili
ty &
Tr
ansp
aren
cy
Qua
lity
of L
ife
Effic
ienc
y &
Ef
fect
iven
ess
Safe
ty &
Se
curit
y Pr
eser
vatio
n
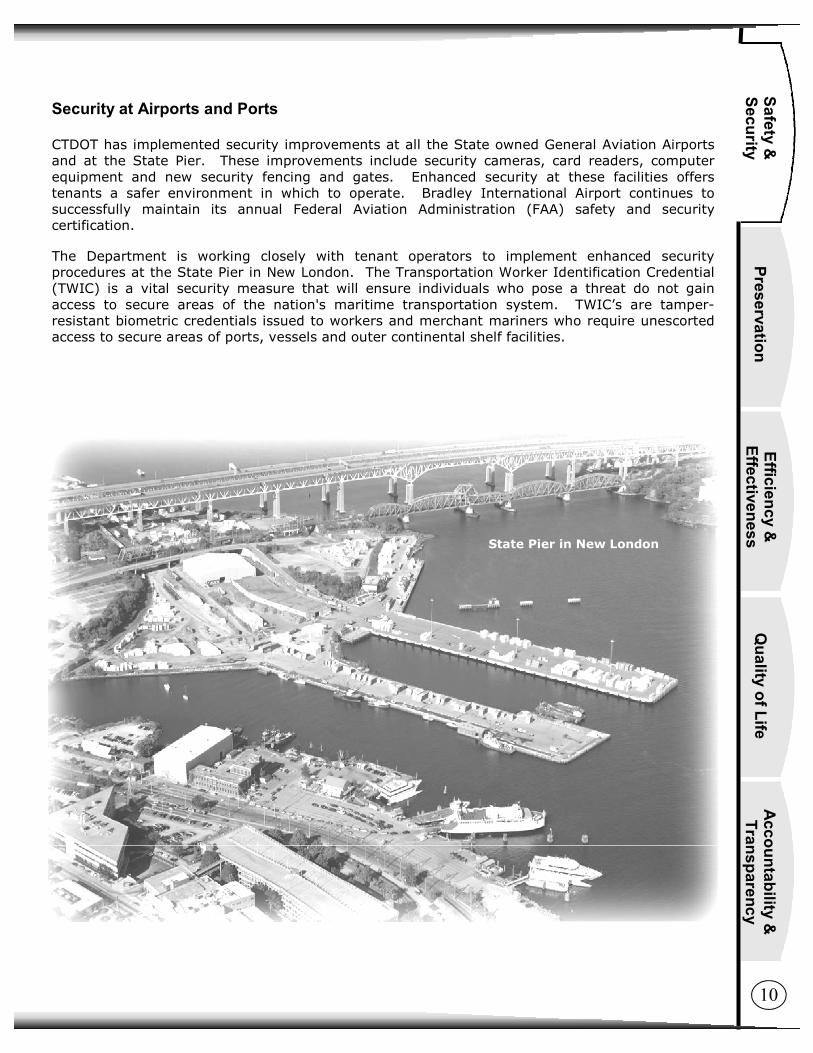
Security at Airports and Ports CTDOT has implemented security improvements at all the State owned General Aviation Airports and at the State Pier. These improvements include security cameras, card readers, computer equipment and new security fencing and gates. Enhanced security at these facilities offers tenants a safer environment in which to operate. Bradley International Airport continues to successfully maintain its annual Federal Aviation Administration (FAA) safety and security certification. The Department is working closely with tenant operators to implement enhanced security procedures at the State Pier in New London. The Transportation Worker Identification Credential (TWIC) is a vital security measure that will ensure individuals who pose a threat do not gain access to secure areas of the nation's maritime transportation system. TWIC’s are tamper-resistant biometric credentials issued to workers and merchant mariners who require unescorted access to secure areas of ports, vessels and outer continental shelf facilities.
State Pier in New London
10
Accountability &
Transparency
Quality of Life
Efficiency &
Effectiveness Safety &
Security
Preservation

29%
60%
12%
26%
61%
12%
35%
56%
9%
35%
55%
11%
37%
54%
9%
39%
50%
11%
36%
55%
9%
37%
54%
9%
41%
51%
8%
39%
53%
8%
0%
10%
20%
30%
40%
50%
60%
70%
80%
90%
100%
1998 1999 2000 2001 2002 2003 2004 2005 2006 2007
Good < 95
Acceptable95 - 170
Poor > 170
Pavement Management Program Through the Pavement Management (PM) Program, the Department systematically evaluates the condition of all State-maintained roadways. CTDOT collects various data elements regarding pavement quality with two Photolog vehicles (see page 36 for additional information on the Photolog Program). In addition to obtaining high-definition images of all State roadways, these sophisticated vehicles are equipped to collect pavement condition and inventory information, including roughness, wheel path rutting, cracking, geometric and global positioning information, cross-slope, and grade. The pavement data is analyzed and condition reports can be generated to document pavement needs and priorities.
Preservation
Figure 6. Ride Quality on Connecticut‘s National Highway System Roads International Roughness Index (IRI) inches per mile
It is the objective of CTDOT to preserve and maintain Connecticut’s transportation infrastructure. Increased vehicle miles traveled, greater congestion on aging infrastructure, and escalating operating costs put greater than ever demands on transportation networks. The Department utilizes prevention, inspection, construction and maintenance programs to preserve and maintain the existing transportation infrastructure. By monitoring the condition of roads, bridges and waterways, and by utilizing advanced management programs, the Department strives to preserve the infrastructure and to maximize the useful life of facilities and equipment.
11
Acc
ount
abili
ty &
Tr
ansp
aren
cy
Qua
lity
of L
ife
Effic
ienc
y &
Ef
fect
iven
ess
Safe
ty &
Se
curit
y Pr
eser
vatio
n

41%
51%
8%
79%
19%
2%
34%
46%
20%
73%
22%
5%
63%
28%
9%
61%
32%
7%
45%
41%
14%
0%10%20%30%40%50%60%70%80%90%
100%
CT MA RI VT NH ME NY
Good < 95
Acceptable95 - 170
Poor > 170
The Department uses a worldwide standard for measu r i ng pavemen t smoothness called the International Roughness Index, or IRI. This index provides a consistent and comparable measure of pavement in terms of the number of vertical bump inches per mile driven. IRI is reported as inches per mile. The lower the IRI number, the smoother the ride. The general public’s perception of a good road is one that provides a smooth ride. Roughness is an important pavement characteristic because it affects not only ride quality but also vehicle delay costs, fuel consumption and maintenance costs. The Federal Highway Administration (FHWA) requires that all states measure and submit roughness data annually for the National Highway System (NHS). The NHS includes interstate and other routes identified as having strategic defense characteristics, as well as routes providing access to major ports, airports, public transportation and intermodal facilities. The chart on the previous page (Figure 6) shows that ride quality on Connecticut roads has gradually been improving since 1998. The percentage of roads rated good has increased from 29 percent in 1998 to 39 percent in 2007, while the percentage of roads rated poor has decreased from 12 percent to 8 percent over the same period. The goal is to continue this trend by implementing pavement preservation principles and fully utilizing the Pavement Management Program. The chart below (Figure 7) compares the ride quality in the New England states and New York for 2006.
Figure 7. Ride Quality on the National Highway System in New England and New York, 2006 inches per mile
International Roughness Index (IRI)
Merritt Parkway
12
Accountability &
Transparency
Quality of Life
Efficiency &
Effectiveness Safety &
Security
Preservation
Good2,399 miles
55%
Fair985 miles
22%
Poor0.5 miles
0%Excellent1,034 miles
23%
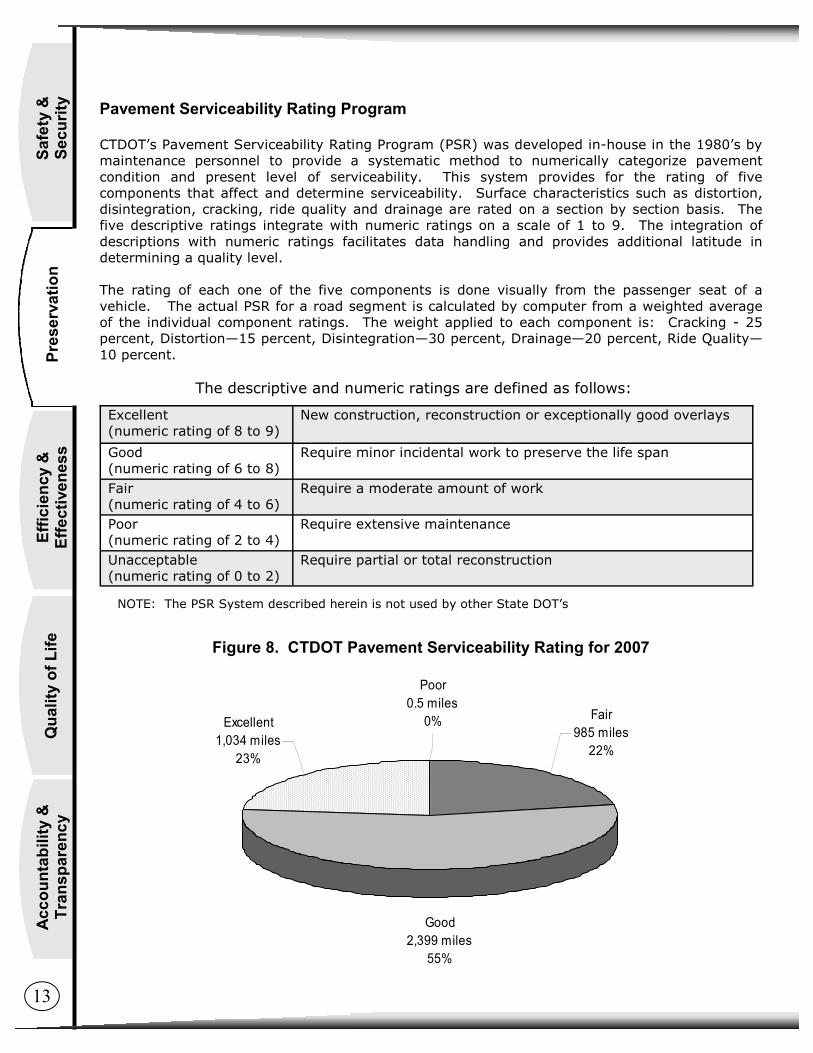
Pavement Serviceability Rating Program CTDOT’s Pavement Serviceability Rating Program (PSR) was developed in-house in the 1980’s by maintenance personnel to provide a systematic method to numerically categorize pavement condition and present level of serviceability. This system provides for the rating of five components that affect and determine serviceability. Surface characteristics such as distortion, disintegration, cracking, ride quality and drainage are rated on a section by section basis. The five descriptive ratings integrate with numeric ratings on a scale of 1 to 9. The integration of descriptions with numeric ratings facilitates data handling and provides additional latitude in determining a quality level. The rating of each one of the five components is done visually from the passenger seat of a vehicle. The actual PSR for a road segment is calculated by computer from a weighted average of the individual component ratings. The weight applied to each component is: Cracking - 25 percent, Distortion—15 percent, Disintegration—30 percent, Drainage—20 percent, Ride Quality—10 percent. The descriptive and numeric ratings are defined as follows:
Excellent (numeric rating of 8 to 9)
New construction, reconstruction or exceptionally good overlays
Good (numeric rating of 6 to 8)
Require minor incidental work to preserve the life span
Fair (numeric rating of 4 to 6)
Require a moderate amount of work
Poor (numeric rating of 2 to 4)
Require extensive maintenance
Unacceptable (numeric rating of 0 to 2)
Require partial or total reconstruction
Figure 8. CTDOT Pavement Serviceability Rating for 2007
NOTE: The PSR System described herein is not used by other State DOT’s
13
Acc
ount
abili
ty &
Tr
ansp
aren
cy
Qua
lity
of L
ife
Effic
ienc
y &
Ef
fect
iven
ess
Safe
ty &
Se
curit
y Pr
eser
vatio
n

Pavement Preservation Program Pavement preservation represents a proactive approach to maintaining our existing highways. An effective pavement preservation program will address pavements while they are still in good condition and before the onset of serious damage. By applying a cost-effective treatment at the right time, the pavement is restored almost to its original condition. The cumulative effect of preservation treatments is to postpone costly rehabilitation and reconstruction. Additionally, performing pavement preservation treatments is less disruptive to traffic flow than the long closures normally associated with reconstruction projects. With timely preservation we can provide the traveling public with improved safety and mobility, reduced congestion and smoother, longer lasting pavements. CTDOT’s Pavement Preservation Program was initiated in 2007 to coordinate strategies and proper treatments for extending pavement life through the application of cost effective preservation treatments. Initial projects under the Pavement Preservation Program are scheduled to be awarded in 2009. Tracking and documenting this process will provide an indication of performance and lead to the establishment of performance measures for a variety of pavement treatments.
Perpetual Pavement Award CTDOT recently earned the national Perpetual Pavement Award. A section of Route 82 in the towns of Haddam and Chester was awarded the 2007 Perpetual Pavement Award by the Asphalt Pavement Alliance. This is a nationally recognized award presented to agencies for asphalt pavements that have stood the test of time. The National Center for Asphalt Technology at Auburn University, along with a panel of industry experts, evaluates each nominated pavement to ensure that it meets the high standards required for this award. This portion of Route 82 opened in 1971 and was last paved in 1996.
I-95 Bridgeport
14
Accountability &
Transparency
Quality of Life
Efficiency &
Effectiveness Safety &
Security
Preservation

717
318433
330440
531
14091491
1651
490470
737
515554560519633
361 388505 513
399
11751128
776
1008
1900
0
250
500
750
1000
1250
1500
1750
2000
2000 2001 2002 2003 2004 2005 2006 2007 2008
BMMs Received BMMs Completed BMMs Remaining
Upon completion of the inspection process, a Bridge Maintenance Memo (BMM) identifies deficiencies and areas of deterioration for repairs in order to extend the useful life of the structure.
East Haddam Swing Bridge
Thru November
Figure 9. CTDOT Bridge Maintenance Memorandums (Requests)
15
Acc
ount
abili
ty &
Tr
ansp
aren
cy
Qua
lity
of L
ife
Effic
ienc
y &
Ef
fect
iven
ess
Safe
ty &
Se
curit
y Pr
eser
vatio
n

The 2007 collapse of the I-35W bridge in Minnesota caused a heightened focus on bridge safety. Fortunately, the CTDOT had already initiated a review of its inspection practices and the results were to increase inspections to every two years, with an understanding that the aging infrastructure (average bridge age in Connecticut is 50 years) will require considerable attention in the future. The Department inspects, evaluates and maintains an inventory of the structural condition, strength and functional capacity of over 5,000 state, local, and other types of bridges and structures in Connecticut. The Department is directly responsible for maintenance of almost 4,000 of these bridges. The condition of all bridge decks, superstructures and substructures are rated on a scale from 0 (failed condition) to 9 (excellent condition). The lowest rating of the components becomes the bridge’s overall rating. Upon completion of the inspection, a report is generated by the inspector which is then reviewed by a bridge engineer. If necessary, a Bridge Maintenance Memorandum (BMM) is prepared. The BMM identifies deficiencies and areas of deterioration for maintenance repairs in order to maximize the useful life of the structure. In addition to the ongoing preventive maintenance, the repair work identified from the BMM is scheduled based on criticality. Whenever the condition rating of a bridge falls into the “Poor” category (4), the Department further reviews its condition, assesses the inspection frequency, adds the structure to the “Bridge Program List” and initiates a project to address the needs. The Department seeks to preserve and maintain its existing infrastructure (Figure 10).
Bridge Preservation Program
Figure 10. Arrigoni Bridge - Middletown
16
Accountability &
Transparency
Quality of Life
Efficiency &
Effectiveness Safety &
Security
Preservation

FunctionallyObsolete
25%
StructurallyDeficient
9%
All Other66%
Figure 12. Percent of Highway Bridges Classified Structurally Deficient, 2007
Figure 11. Percent of Connecticut Highway Bridges Rated Structurally Deficient and Functionally Obsolete, 2007
0% 2% 4% 6% 8% 10% 12% 14%
VT
RI
NH
ME
NY
NJ
Connecticut
MA
DE
17
Acc
ount
abili
ty &
Tr
ansp
aren
cy
Qua
lity
of L
ife
Effic
ienc
y &
Ef
fect
iven
ess
Safe
ty &
Se
curit
y Pr
eser
vatio
n

Structurally Deficient Bridges—The classification “Structurally Deficient” is used to determine eligibility for Federal bridge replacement and rehabilitation funding. Bridges are classified as “structurally deficient” if they have a general condition rating for the deck, superstructure, substructure or culvert of 4 or less or if the roadway regularly floods. The fact that a bridge is "deficient" does not imply that it is likely to collapse or that it is unsafe. To remain in service, structurally deficient bridges are often posted with weight limits to restrict the gross weight of vehicles using the bridges to lessen the maximum weight typically allowed by law. When a bridge is determined to be unsafe, it is closed to traffic.
Functionally Obsolete Bridges— While structural deficiencies are generally the result of deterioration of the conditions of the bridge components, functional obsolescence results from changing traffic demands on the structure. Facilities, including bridges, are designed to conform to the design standards in place at the time they are designed. Over time, improvements are made to the design requirements. For example, the difference between the required, current-day shoulder width and the 1930s designed shoulder width represents a change. A bridge may be structurally sound, but be considered functionally obsolete according to new design parameters.
Figure 13. Percent of Highway Bridges Classified Functionally Obsolete, 2007
0% 5% 10% 15% 20% 25% 30%
MA
Connecticut
RI
NY
NJ
ME
VT
NH
DE
18
Accountability &
Transparency
Quality of Life
Efficiency &
Effectiveness Safety &
Security
Preservation

Fair55%
Poor9%
Good36%
Federal Bridge Condition RatingsGood -- 7 or above
Fair -- 5 - 6Poor -- 4 or less
Rating Condition Description
9 Excellent Excellent or new
8 Very Good Very Good
7 Good No problems noted.
6 Satisfactory Some minor problems.
5 Fair All primary structural elements are sound but may have minor section loss, cracking, spalling, or scour.
4 Poor Advanced section loss, deterioration, spalling, or scour.
3 Serious Loss of section, deterioration, spalling, or scour have seriously affected the primary structural components. Local failures are possible. Fatigue cracks in steel or shear cracks in concrete may be present.
2 Critical Advanced deterioration of primary structural elements. Fatigue cracks in steel or shear cracks in concrete may be present or scour may be removed substructure support. Unless closely monitored, it may be necessary to close the bridge until corrective action is taken.
1 Imminent Failure
Major deterioration or section loss present in critical structural components, or obvious loss present in critical structural components, or obvious vertical or horizontal move-ment affecting structural stability. Bridge is closed to traffic, but corrective action may put back in light service.
0 Failed Out of service; beyond corrective action.
Figure 14. Condition of Connecticut’s Highway Bridges, 2007
Figure 15. Federal Bridge Condition Rating Categories
19
Acc
ount
abili
ty &
Tr
ansp
aren
cy
Qua
lity
of L
ife
Effic
ienc
y &
Ef
fect
iven
ess
Safe
ty &
Se
curit
y Pr
eser
vatio
n

Other144%
Good42
13%
Poor77
23%
Fair19660%
Federal Bridge Condition RatingsGood -- 7 or above
Fair -- 5 - 6Poor -- 4 or less
Figure 16. Condition of Connecticut’s Rail Bridges, 2007
Railroad Bridge Preservation Program More than 300 railroad bridges on the New Haven Line as well as bridges on other state-owned rail lines, are inspected every two years to identify deficiencies and recommend repairs, rehabilitation or replacement in a timely manner. Railroad bridges are also rated by structural condition and strength of their superstructure (structural supports) as well as the substructure (piers and abutments). The evaluation results in a numerical rating from 0 (failed condition) to 9 (excellent condition). The lowest rating among the two main components becomes the bridge’s overall rating. When a structure receives its initial poor rating, the bridge is identified as a candidate for major repair, rehabilitation or replacement. Steps are then taken to ensure that the bridge is scheduled for rehabilitation or replacement. Figure 16 provides a summary of the condition of Connecticut’s rail bridges.
20
Accountability &
Transparency
Quality of Life
Efficiency &
Effectiveness Safety &
Security
Preservation

Preserving Rail and Transit Infrastructure and Rolling Stock Extensive planning is performed to develop long-term fleet strategies for replacing rail and transit rolling stock. Overseeing maintenance of existing rail and bus fleets is also a critical function performed by CTDOT to ensure the maximum life of these assets. The Department oversees the maintenance of the rights-of-way infrastructure, over 235 track miles, catenary, signals, stations, rail yards and associated structures on the New Haven main line and the three branch lines (New Canaan, Danbury and Waterbury). The goal is to bring the entire network to a state-of-good repair through a cyclical replacement of infrastructure elements. Ongoing major rail infrastructure projects and initiatives include replacement of the overhead cantenary system, New Haven rail yard improvements, track and tie replacement, signal system replacement and fixed and moveable bridge replacement or rehabilitation. Figure 17 shows the average age of the Connecticut bus fleet over the 2004-2008 period. As the owner of the CTTransit bus system, the Department purchases capital assets through the State procurement process for the majority of the local transit, ADA paratransit and commuter express operations. The Department buses are at an average life of more than 6.5 years with an expected life of 12 years for heavy-duty transit buses.
21
Acc
ount
abili
ty &
Tr
ansp
aren
cy
Qua
lity
of L
ife
Effic
ienc
y &
Ef
fect
iven
ess
Safe
ty &
Se
curit
y Pr
eser
vatio
n

Figure 17. Average Age of Connecticut’s Transit Fleet
The Federal Transit Administration (FTA) uses the guideline that full-sized heavy-duty transit buses are eligible for replacement at 12 years of age. Due to the constraints of the Federal grant-making process, the Department typically conducts the procurement process for new equipment in year 12 and buses are normally replaced by year 14. If the bus fleet was replaced in equal portions each year, the average age of the fleet should be about 7 years. However, this number varies due to the fact that the fleet replacements do not occur evenly, but rather are concentrated to some degree due to the timing of past replacements. The average age statistic is important, as older buses tend to require a higher level of maintenance to keep them operating efficiently and reliably. Therefore, the goal is to maintain the average age of the fleet at 7 years, with the understanding that this number may vary from time to time.
0
1
2
3
4
5
6
7
8
Year
s
2004 2005 2006 2007 2008
State-Owned Other Operators
Mystic River Draw Bridge 22
Accountability &
Transparency
Quality of Life
Efficiency &
Effectiveness Safety &
Security
Preservation

The majority of train cars on the New Haven Main Line are Electric Multiple Unit (EMU) rail cars. The average age of the EMU rail cars is 29 years (see Figure 18). Considering that the useful life of a rail car is typically 25 years, the purchase of the M8 railcars is critical to the overall viability of Connecticut’s commuter rail service. It should be noted that the “backbone” of the fleet are the M2 EMUs, which were built in the mid-1970s. Most of the M2 fleet will be retired on a gradual basis with the purchase of M8 EMUs.
Figure 18. Average Age of the New Haven Line EMU Fleet (2008)
Figure 19 illustrates the average age of the New Haven Line EMU fleet after the acceptance of the current order of the 300 M8s (a reduction in average age of approximately 19.5 years). This will translate into greater overall reliability and performance on the commuter rail system.
Figure 19. Average Age of the New Haven Line EMU Fleet (2012)
Average rail vehicle life (as currently established by the FTA) is 25 years. This includes a mid-life overhaul after 12 to 13 years of service. A mid-life overhaul involves major system replacements/upgrades and requires significant funding to ensure the 25 year life of these critical assets.
EMU Count Average Age Unit Size Unit Seating
M2 236 34 PAIR 232
M4 54 21 TRIPLET 350
M6 48 14 TRIPLET 344
TOTALS 338 29
EMU Count Average Age Unit Size Unit Seating
M2 40 38 PAIR 232
M4 54 25 TRIPLET 350
M6 48 18 TRIPLET 344
M8 300 1.5 PAIR 210
TOTALS 442 9.5
Rail Fleet Age
M2 Rail Cars
23
Acc
ount
abili
ty &
Tr
ansp
aren
cy
Qua
lity
of L
ife
Effic
ienc
y &
Ef
fect
iven
ess
Safe
ty &
Se
curit
y Pr
eser
vatio
n

Rail Fleet Replacement / Maintenance Strategy The replacement of the EMU M2 rail cars was deemed a critical need for the New Haven Line commuter service. In 2006, an order for 300 M8 cars was placed (jointly by CTDOT and MTA Metro-North Railroad) with Kawasaki Rail Car, Inc. after an extensive proposal process. An optional order for 80 additional M8s (for a total of 380 M8s) is available and may be exercised to provide the additional capacity needed on the entire Connecticut commuter system. The operation of the M8 EMU rail cars will increase fleet reliability and maintainability, provide for existing and future ridership, and meet the American with Disabilities Act requirements. The M8 design specifications also provide for the operation of the M8 rail cars on the Shore Line East commuter service operated by Amtrak, and on the Northeast Corridor (NEC) east of New Haven. EMU rail car overhauls are being completed or are in the development process. The M2 Critical Systems Replacement (CSR) program has extended the life and improved the reliability of this fleet. CSR programs for both the M4 and M6 EMU are also planned. Recent purchases of new switch/shuttle locomotives for the New Haven Line will replace older locomotives currently used for these services. Also, overhauls of locomotive-hauled rail coaches for Shore Line East have been completed and are in service. Finally, overhauls of locomotive-hauled coaches used on the New Haven Line on both the main line and for branch service are underway.
NEW M8 Rail Car
24
Accountability &
Transparency
Quality of Life
Efficiency &
Effectiveness Safety &
Security
Preservation

Figure 20. Rail Mean Distance Between Failures (Rail)
The average number of miles an equipment type runs without a failure, which causes a service delay.
Equipment Type 2004 2005 2006 2007 2007 Goals
Locomotives
P-32 26,976 21,789 25,590 25,620 30,000
P-40 n/a 6,897 21,128 21,318 Coaches
Bombardier 287,441 250,669 396,446 400,405 270,000 EMU
M2 49,452 57,614 66,849 76,892 65,000
M2 CSR 95,712 86,208
M4 44,539 45,538 62,801 39,773 60,000
M6 65,117 51,555 70,249 70,680 70,000
Mean Distance Between Failures Mean Distance between Failures (MDBF) is an industry standard for measuring the reliability of a rail car fleet. It is calculated by dividing the total miles operated by the total number of confirmed primary failures, by car or locomotive fleet. A confirmed primary failure is defined as a failure of any duration for mechanical cause that occurs to a revenue train that is reported late at its final terminal by more than 5 minutes and 59 seconds. The 5-minute-59-second delay metric is also the commuter rail industry standard for reporting on-time performance (OTP). Generally speaking, the higher the MDBF, the higher the OTP. The high average age of the EMU passenger rail car fleet poses a significant challenge in providing reliable and on-time train service. Recognizing the importance of maintaining an aging fleet, the CTDOT has moved forward on two specific initiatives to support the maintenance of the existing fleet while preparing for the arrival of the new M8 EMU rail cars. Starting in 2001, the Department began the M2 Critical System Replacement (CSR) program, which has improved the MDBF for the M2 fleet dramatically. In 2004, the MDBF for M2 cars was just under 50,000 miles. Year-to-date in 2008, the MDBF for M2 rail cars is over 82,000 miles. In 2006, the Department commissioned a new rail car maintenance shop facility in New Haven, which provided an additional 12 rail car “spots” for maintenance and inspection. The new shop facility almost doubled the current shop capacity (18 existing rail car maintenance spots for the EMU fleet) on the New Haven Line. These two initiatives have dramatically improved MDBF, which has translated into an improvement in overall OTP on the New Haven Line and the peak period 90 percent +/- train consist compliance (measures actual rail car assignments divided by programmed rail car assignments by train to ensure seating availability for customers).
25
Acc
ount
abili
ty &
Tr
ansp
aren
cy
Qua
lity
of L
ife
Effic
ienc
y &
Ef
fect
iven
ess
Safe
ty &
Se
curit
y Pr
eser
vatio
n

Miles Between Road Calls/Transit Outages Miles between road calls is the standard performance metric used nationally by bus operators to measure availability and reliability of equipment. Road calls are traditionally counted when a bus misses some or all of one of its scheduled trips. Figure 21 shows the recent trend for miles between road calls for CTTransit’s largest operating divisions in Hartford, New Haven and Stamford. In any given year, the number of road calls can be affected by the age of the fleet, the occurrence of fleet-wide defects on a certain model or model year of buses, the weather, and many other factors.
Figure 21. Mean Distance Between Transit Outages (Bus)
0
1,000
2,000
3,000
4,000
5,000
6,000
Mile
s
2004 2005 2006 2007 2008
Fiscal Year26
Accountability &
Transparency
Quality of Life
Efficiency &
Effectiveness Safety &
Security
Preservation

Preserving Our Airports Bradley International Airport is the gateway to New England and its preservation is critical for the State’s economic vitality and well being. As CTDOT strives to increase the multimodal use of our transportation system, linkage with and to our airports is also paramount. The Department preserves the State aviation system by maintaining and enhancing airport capacity. There are six airports owned and operated by the State: Bradley International, and five General Aviation Airports: Oxford, Brainard, Groton, Windham, and Danielson. Preservation activities include maintaining runways, facilities, lighting, carriers and service levels. The Department partners with the municipal airports which are: Tweed-New Haven, Bridgeport Sikorsky, Danbury and Meriden airports. These partnerships allow the municipal, State and Federal governments to link the aviation system with the appropriate resources, communication and support. Three targets have been established to enhance preservation. First, existing airfield capacity, should not be permitted to diminish. Second, where airfield capacity has already been or may become diminished, issues should be addressed and capacity restored. Third, no privately owned, public use airport should be permitted to close due to sale and/or conversion to non-aviation use.
Dredging the CT River for the Rocky Hill/Glastonbury Ferry 27
Acc
ount
abili
ty &
Tr
ansp
aren
cy
Qua
lity
of L
ife
Effic
ienc
y &
Ef
fect
iven
ess
Safe
ty &
Se
curit
y Pr
eser
vatio
n

Preserving State Vessels and Waterways CTDOT maintains the State owned water transportation facilities. It owns and operates two ferries on the Connecticut River. The Rocky Hill-Glastonbury Ferry has been in operation between Rocky Hill and Glastonbury for over 353 years. The Chester-Hadlyme Ferry will celebrate is 60th year in operation in 2009. The ferries operate seven days a week during the late spring to late fall. Each winter, maintenance overhauls take place to keep the vessels, machinery and equipment in operating condition. Through the creation of the Connecticut Maritime Commission (CTMC), a Maritime Policy has been developed and implemented that focuses on two key areas: Dredging and Economic Development. Dredging is the removal of rocks, sand, gravel, mud and clay from the bottom of waterways to create or maintain sufficient depth for ships to navigate. If no dredging were performed, our harbors and major rivers, so vital to commercial and defense activities, would eventually become impassable. Maintenance dredging of Connecticut’s ports, harbors and waterways to the Federally authorized depth has been identified as the top maritime priority. The Department is responsible for maintaining the proper depth of the State Pier facility and the State ferry slips on the Connecticut River and has proactively adopted a methodology to prioritize all dredging projects. In doing this, the Department works collaboratively with the U.S. Army Corps of Engineers, Connecticut Department of Environmental Protection, municipal and local governments, and private entities. As a result of using a regional coordination approach, 19 projects from Greenwich to Branford have been identified for dredging this season to provide safe vessel passage for many years to come.
Chester—Hadlyme Ferry 28
Accountability &
Transparency
Quality of Life
Efficiency &
Effectiveness Safety &
Security
Preservation
Efficiency and Effectiveness
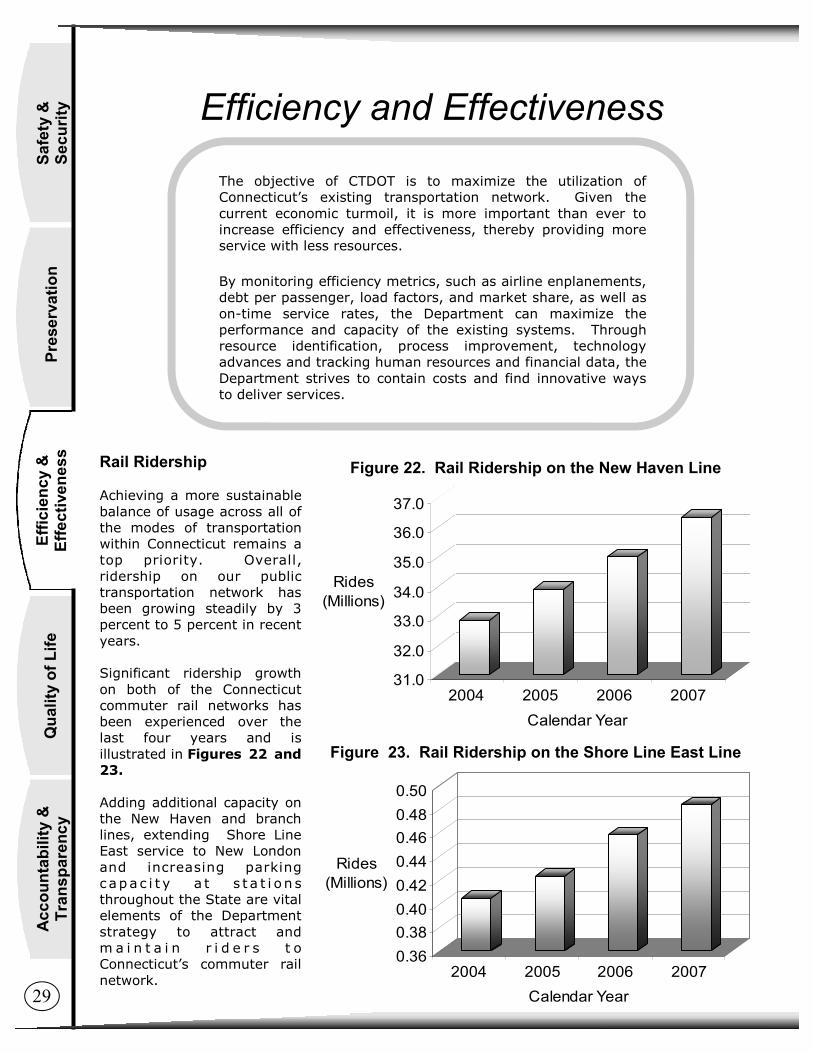
Rail Ridership Achieving a more sustainable balance of usage across all of the modes of transportation within Connecticut remains a top priority. Overall, ridership on our public transportation network has been growing steadily by 3 percent to 5 percent in recent years. Significant ridership growth on both of the Connecticut commuter rail networks has been experienced over the last four years and is illustrated in Figures 22 and 23. Adding additional capacity on the New Haven and branch lines, extending Shore Line East service to New London and increasing parking c apa c i t y a t s t a t i on s throughout the State are vital elements of the Department strategy to attract and m a i n t a i n r i d e r s t o Connecticut’s commuter rail network.
31.0
32.0
33.0
34.0
35.0
36.0
37.0
Rides (Millions)
2004 2005 2006 2007Calendar Year
0.360.380.400.420.440.460.480.50
Rides (Millions)
2004 2005 2006 2007Calendar Year
Figure 22. Rail Ridership on the New Haven Line
Figure 23. Rail Ridership on the Shore Line East Line
The objective of CTDOT is to maximize the utilization of Connecticut’s existing transportation network. Given the current economic turmoil, it is more important than ever to increase efficiency and effectiveness, thereby providing more service with less resources. By monitoring efficiency metrics, such as airline enplanements, debt per passenger, load factors, and market share, as well as on-time service rates, the Department can maximize the performance and capacity of the existing systems. Through resource identification, process improvement, technology advances and tracking human resources and financial data, the Department strives to contain costs and find innovative ways to deliver services.
29
Acc
ount
abili
ty &
Tr
ansp
aren
cy
Qua
lity
of L
ife
Effic
ienc
y &
Ef
fect
iven
ess
Safe
ty &
Se
curit
y Pr
eser
vatio
n
88%
90%
92%
94%
96%
98%
2004 2005 2006 2007Calendar Year
New Haven Line Shore Line East
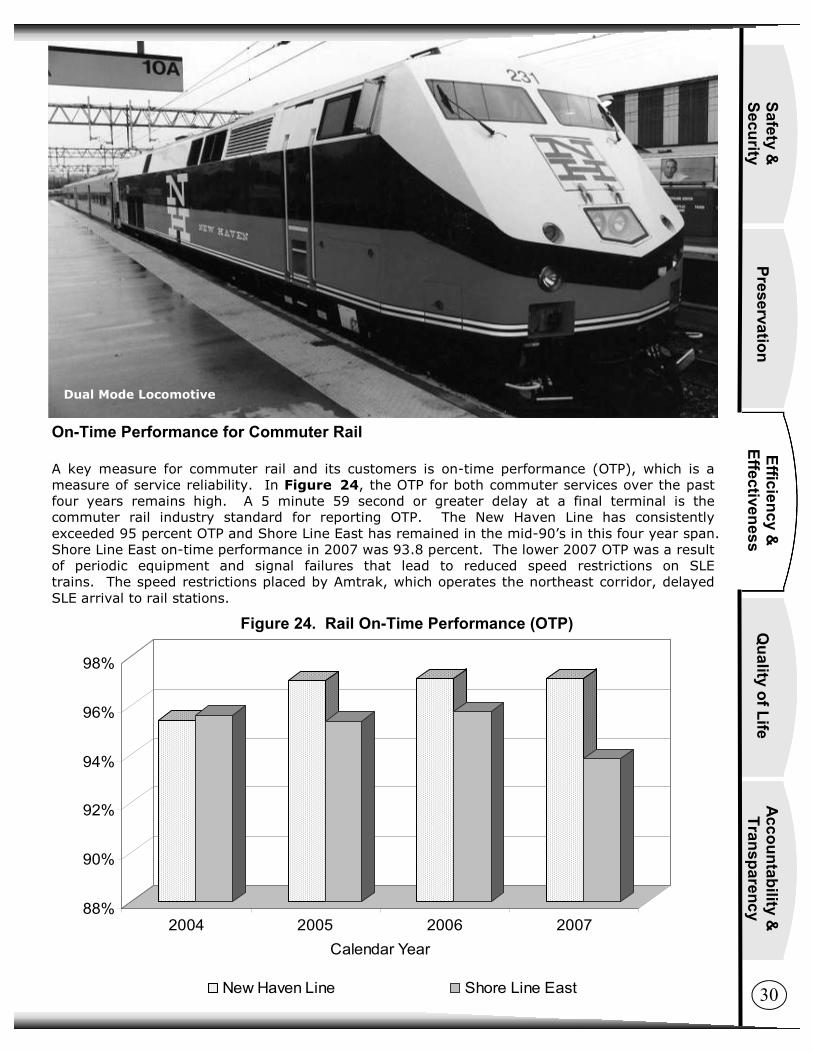
Figure 24. Rail On-Time Performance (OTP)
On-Time Performance for Commuter Rail A key measure for commuter rail and its customers is on-time performance (OTP), which is a measure of service reliability. In Figure 24, the OTP for both commuter services over the past four years remains high. A 5 minute 59 second or greater delay at a final terminal is the commuter rail industry standard for reporting OTP. The New Haven Line has consistently exceeded 95 percent OTP and Shore Line East has remained in the mid-90’s in this four year span. Shore Line East on-time performance in 2007 was 93.8 percent. The lower 2007 OTP was a result of periodic equipment and signal failures that lead to reduced speed restrictions on SLE trains. The speed restrictions placed by Amtrak, which operates the northeast corridor, delayed SLE arrival to rail stations.
Dual Mode Locomotive
30
Accountability &
Transparency
Quality of Life
Efficiency &
Effectiveness Safety &
Security
Preservation
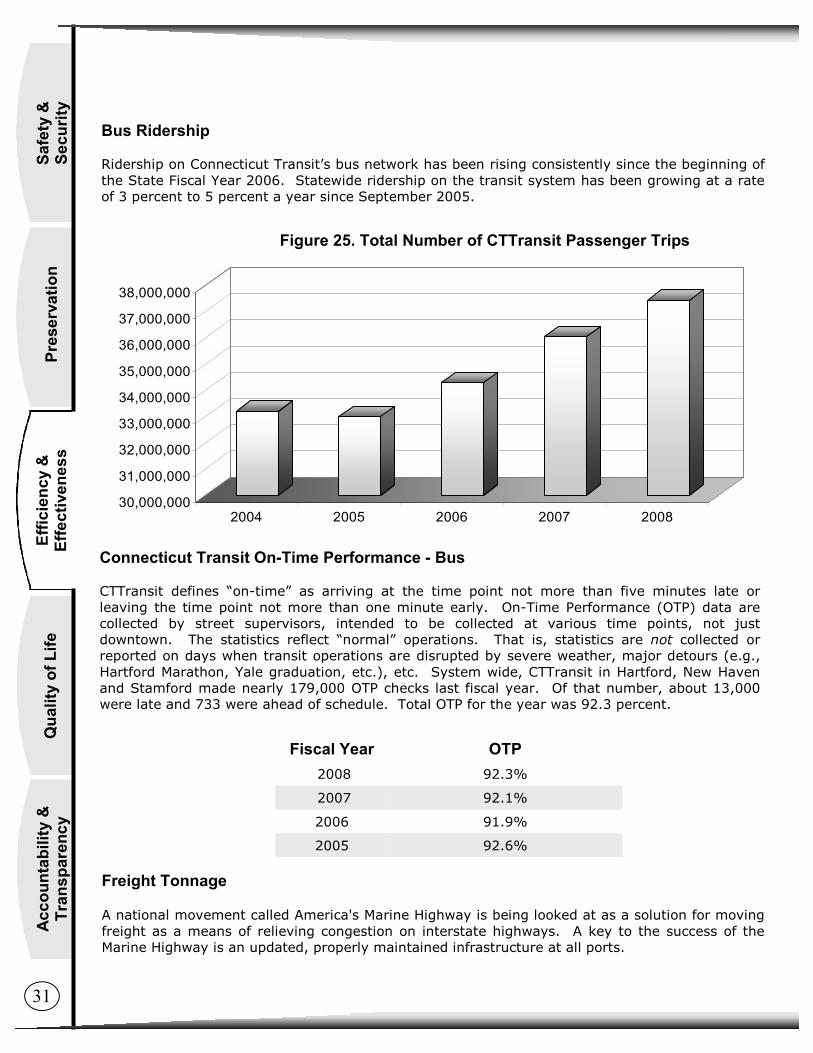
Figure 25. Total Number of CTTransit Passenger Trips
Connecticut Transit On-Time Performance - Bus CTTransit defines “on-time” as arriving at the time point not more than five minutes late or leaving the time point not more than one minute early. On-Time Performance (OTP) data are collected by street supervisors, intended to be collected at various time points, not just downtown. The statistics reflect “normal” operations. That is, statistics are not collected or reported on days when transit operations are disrupted by severe weather, major detours (e.g., Hartford Marathon, Yale graduation, etc.), etc. System wide, CTTransit in Hartford, New Haven and Stamford made nearly 179,000 OTP checks last fiscal year. Of that number, about 13,000 were late and 733 were ahead of schedule. Total OTP for the year was 92.3 percent.
Bus Ridership Ridership on Connecticut Transit’s bus network has been rising consistently since the beginning of the State Fiscal Year 2006. Statewide ridership on the transit system has been growing at a rate of 3 percent to 5 percent a year since September 2005.
30,000,000
31,000,000
32,000,000
33,000,000
34,000,000
35,000,000
36,000,000
37,000,000
38,000,000
2004 2005 2006 2007 2008
Fiscal Year OTP 2008 92.3%
2007 92.1%
2006 91.9%
2005 92.6%
Freight Tonnage A national movement called America's Marine Highway is being looked at as a solution for moving freight as a means of relieving congestion on interstate highways. A key to the success of the Marine Highway is an updated, properly maintained infrastructure at all ports.
31
Acc
ount
abili
ty &
Tr
ansp
aren
cy
Qua
lity
of L
ife
Effic
ienc
y &
Ef
fect
iven
ess
Safe
ty &
Se
curit
y Pr
eser
vatio
n
125,000
130,000
135,000
140,000
145,000
150,000
155,000
160,000
165,000
170,000
Tons
2002 2003 2004 2005 2007
Calendar Year
Freight Mail
Figure 26. Rail Freight Tonnage
Freight Carrier 2004 2005 2006 2007 2008
Providence & Worcester RR (Reports 1.7-2 million tons annually)
1,850,000 1,850,000 1,850,000 1,850,000 1,850,000
CSX Transportation 1,016,600 1,105,000 1,081,200 994,500 956,250
Central New England RR 159,800 181,730 181,220 181,730 172,321
CT Southern Railroad Co. 1,955,000 2,210,000 2,252,500 2,210,000 2,125,000
Housatonic RR (Reports 700,000-800,000 tons annually)
750,000 750,000 750,000 750,000 750,000
New England Central RR 1,050,000 1,066,700 1,160,600 1,024,427 1,085,782
Tilcon/BSRR 2,500,000 2,500,000 2,200,000 1,800,000 1,600,000
Total 9,281,400 9,663,430 9,475,520 8,810,657 8,539,353
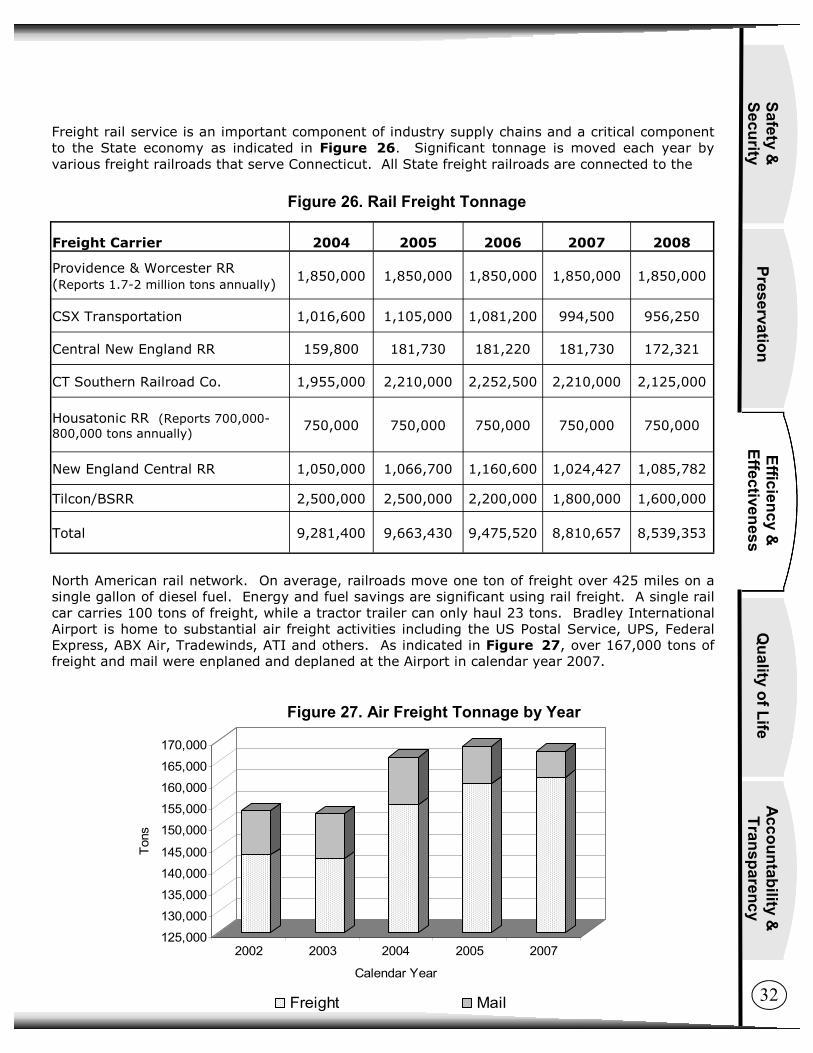
North American rail network. On average, railroads move one ton of freight over 425 miles on a single gallon of diesel fuel. Energy and fuel savings are significant using rail freight. A single rail car carries 100 tons of freight, while a tractor trailer can only haul 23 tons. Bradley International Airport is home to substantial air freight activities including the US Postal Service, UPS, Federal Express, ABX Air, Tradewinds, ATI and others. As indicated in Figure 27, over 167,000 tons of freight and mail were enplaned and deplaned at the Airport in calendar year 2007.
Figure 27. Air Freight Tonnage by Year
Freight rail service is an important component of industry supply chains and a critical component to the State economy as indicated in Figure 26. Significant tonnage is moved each year by various freight railroads that serve Connecticut. All State freight railroads are connected to the
32
Accountability &
Transparency
Quality of Life
Efficiency &
Effectiveness Safety &
Security
Preservation

2,900,000
3,000,000
3,100,000
3,200,000
3,300,000
3,400,000
3,500,000
3,600,000
3,700,000
FY 2002 FY 2003 FY 2004 FY 2005 FY 2006 FY 2007 FY 2008
Figure 28. Bradley International Airport Enplaned Passengers
Enplaned Passengers
One of the most important measures to evaluate the use of Bradley International Airport is total enplaned passengers. Enplaned passengers are those who board flights for departure from the Airport. Bradley, like most of the nation, has experienced a decline in enplaned passengers over the last several years due to the slowing economy and volatile jet fuel costs. As indicated in Figure 28, enplaned passengers declined 9.2 percent in FY 2007 and 2.1 percent in FY 2008. In response to these circumstances, the airlines have withdrawn capacity from that market, resulting in fewer departing seats available to fill. The reduction in departing seats has outpaced the reduction in enplaned passengers. This manifests itself in higher load factors, which simply represent the percentage of seats on an airplane that are filled. As indicated in Figure 30, this trend is being felt by Bradley and other airports in the region. As a proactive response to the economic upheaval that both the nation and the airline industry face, the management at Bradley has implemented a Five Point Plan to address the situation:
1. The reduction to the operating budget included an overall 1.3 percent reduction in airline rates and charges for all major carriers
2. The Airport’s operating budget for FY 2009 was cut by 1.4 percent and unanimously approved by the airlines serving the Airport
3. The Airport’s capital improvement program has been re-prioritized in order to preserve and strengthen the Airport’s overall cash position
4. Efforts are underway to expand the Airport’s air service area by implementing marketing programs in catchment area peripheries that border other regional airports experiencing deeper service cuts
5. Management is aggressively marketing the region and the Airport by implementing advertising campaigns designed to support the use of existing air service and to attract new entrant airlines.
With this plan in place, the airport is well positioned to take maximum advantage of the airline business cycle when it again enters an expansion mode.
33
Acc
ount
abili
ty &
Tr
ansp
aren
cy
Qua
lity
of L
ife
Effic
ienc
y &
Ef
fect
iven
ess
Safe
ty &
Se
curit
y Pr
eser
vatio
n
$-
$10.00$20.00
$30.00
$40.00$50.00
$60.00
$70.00$80.00
$90.00
FY 2003 FY 2004 FY 2005 FY 2006 FY 2007 FY 2008Outstanding Debt
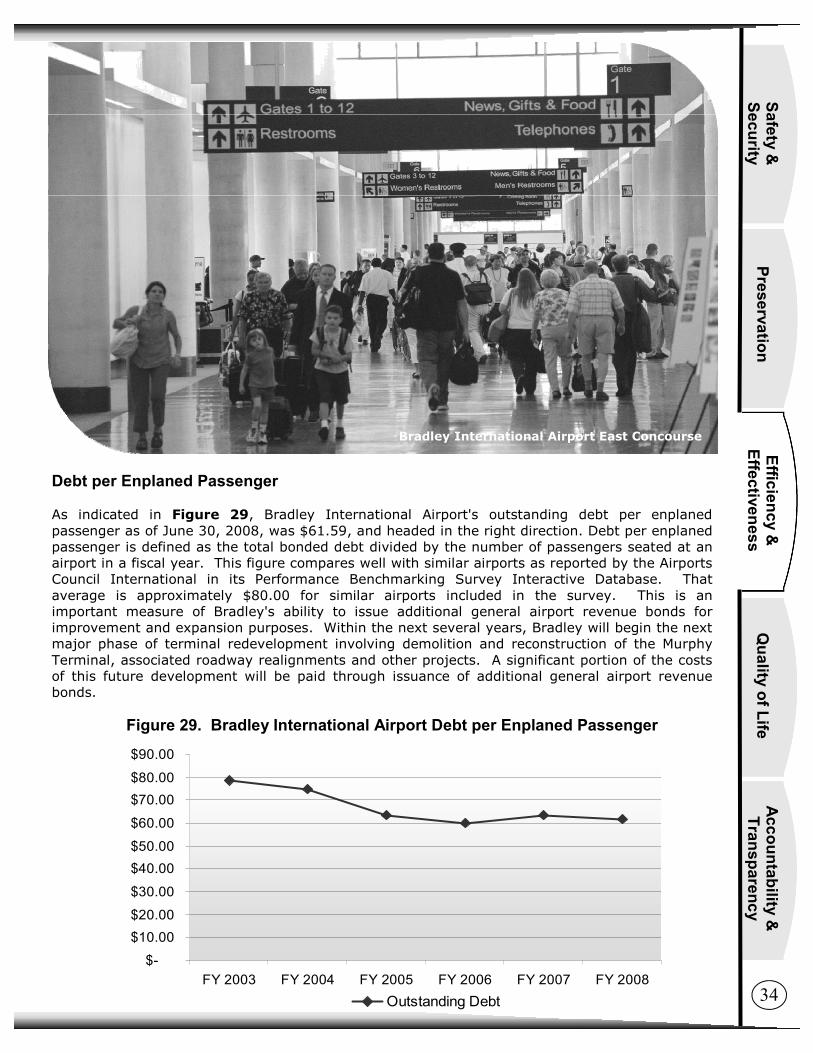
Debt per Enplaned Passenger As indicated in Figure 29, Bradley International Airport's outstanding debt per enplaned passenger as of June 30, 2008, was $61.59, and headed in the right direction. Debt per enplaned passenger is defined as the total bonded debt divided by the number of passengers seated at an airport in a fiscal year. This figure compares well with similar airports as reported by the Airports Council International in its Performance Benchmarking Survey Interactive Database. That average is approximately $80.00 for similar airports included in the survey. This is an important measure of Bradley's ability to issue additional general airport revenue bonds for improvement and expansion purposes. Within the next several years, Bradley will begin the next major phase of terminal redevelopment involving demolition and reconstruction of the Murphy Terminal, associated roadway realignments and other projects. A significant portion of the costs of this future development will be paid through issuance of additional general airport revenue bonds.
Figure 29. Bradley International Airport Debt per Enplaned Passenger
Bradley International Airport East Concourse
34
Accountability &
Transparency
Quality of Life
Efficiency &
Effectiveness Safety &
Security
Preservation

Figure 36. Regional Comparison In Terms of Load Factor History
Source: U.S. DOT, T-100 Onboard Passenger Data, via Data Base Products.
58%60%62%64%66%68%70%72%74%76%78%80%82%84%
Aug
-03
Nov
-03
Feb-
04
May
-04
Aug
-04
Nov
-04
Feb-
05
May
-05
Aug
-05
Nov
-05
Feb-
06
May
-06
Aug
-06
Nov
-06
Feb-
07
May
-07
Aug
-07
Nov
-07
Feb-
08
May
-08
Aug
-08
Average Load Factor
Year Ended Period
CompoundAnnual Growth Rates
Buffalo: +2%Hartford: +2%Manchester: +2% Providence: +2%
0%
On October 13, 2006, CTDOT and Embraer Aircraft Holding, Inc. agreed to lease terms and conditions providing for the construction, use and occupancy of the Embraer Aircraft Maintenance Facility at Bradley International Airport. After working closely with the Connecticut Department of Economic and Community Development to bring Embraer to the State, the Department is proud to welcome Embraer and its first class aircraft maintenance facility to the Bradley community. The maintenance facility includes 28,000 square feet of hangar, 18,000 square feet of office, 28,000 square feet of apron and a 104 space vehicle parking lot constructed by Embraer on a five acre site (with an option for an additional five acres for expansion). The Department delivered on the promises it made to bring this project to fruition. In a highly successful public / private partnership, the Department provided “one-stop-shopping” throughout the Request for Proposals process, drafting and negotiation of the lease agreement, review and approval of all design and engineering documents, construction inspection and issuance of construction permits and certificates of occupancy. The Department was also directly responsible for construction of a 1,000 foot long taxiway (Taxiway W) required to access the site. Less than two years after agreeing to terms, the facility is open for business.
Partnering Success
35
Acc
ount
abili
ty &
Tr
ansp
aren
cy
Qua
lity
of L
ife
Effic
ienc
y &
Ef
fect
iven
ess
Safe
ty &
Se
curit
y Pr
eser
vatio
n
Figure 30.

The Photolog Program CTDOT has been photologging Connecticut’s State highway network for over 30 years, upgrading the equipment as necessary to take advantage of latest technologies. The photolog program has been successful, not only by archiving millions of images, but by focusing on distribution of the images to as many customers as can benefit. Photolog is accessed from computer desktops via a navigation tool called Digital HIWAY. The photolog images and data allow users to drive, view, and gather information about roadways without leaving their desk. It has become a mainstream tool used daily by all the Department’s Bureaus. The photolog system has nearly unlimited potential for applications. It provides a safe and efficient way to gain familiarity with a roadway before a planned field trip. More importantly, it can be used to view current or historical field conditions, i.e., perform a virtual field trip, without leaving the office. The chart below demonstrates that as a result of employee use of photolog images, the Department has saved at least $5.6 million during the past five years, from a reduction in field trips for site visits. Several other State and Federal agencies, such as the Department of Public Safety, FHWA and UConn also have access to photolog images and data. Usage at these additional stand alone stations is not tracked. However, with the projections for stand alone usage included, a total of 500 Digital HIWAY users save the State an estimated $2 million per year in reduced field trips. This is a 3:1 benefit-cost ratio, based on the cost of the photolog operation.
Figure 31. Photolog Usage and Savings Year Number of photolog
stations Savings due to reduced field trips
2004 195 $892,500
2005 256 $1,038,100
2006 302 $1,072,200
2007 393 $1,178,300
2008 421 $1,491,500
Junction of I-91 and Route 9 36
Accountability &
Transparency
Quality of Life
Efficiency &
Effectiveness Safety &
Security
Preservation

Consolidation of the Financial Function In July 2007, CTDOT initiated a reorganization effort to address the divergent business processes, redundancies, and overlapping business functions resulting from a d e c e n t r a l i z e d s t r u c t u r e . The outcome was a consolidated fiscal and administrative function within the Bureau of Finance and Administration (BFA). With the assistance of staff from the Office of Policy and Management and the Department of Administrative Services, an in-depth review of the organizational structure, functions, business processes, and staffing was undertaken. Because fiscal and administrative staff were also d i sp e r sed t h roughou t t he Department, the review extended to all the Department Bureaus resulting in 98 employees who had been part of other Bureaus being transferred to BFA. The new organizational structure is expected to bring more effective financial reporting, greater budget control, and more timely and accurate payments to contractors, as well as a more efficient use of existing staff. Contract Process Improvement Over the past year, a process improvement effort was conducted in the administrative contracts/agreements and construction contracting units. This effort included over 150 employees and resulted in reports that identified t a n g i b l e a n d a t t a i n a b l e recommendations, as well as the establishment of key performance measures. The recommendations are currently being implemented and several measures have been identified to track in the future. Identified performance measures to track in the future are: the total numbers of days the contract takes
Junction of I-84 and Route 8 in Waterbury
37
Acc
ount
abili
ty &
Tr
ansp
aren
cy
Qua
lity
of L
ife
Effic
ienc
y &
Ef
fect
iven
ess
Safe
ty &
Se
curit
y Pr
eser
vatio
n

Close Out of Federal Projects With the transition to the State's new financial management system (Core-CT) and the implementation of a new federal billing system, the Department was unable to closeout FHWA funded projects efficiently. A project closeout team was formed in the beginning of October 2008 with representatives from the Department's operational areas and FHWA. The Department initiates approximately 200 projects per year and has approximately 1,212 Federal projects that need closure. The Department is moving forward and making progress with the Project Closeout and Final Voucher initiative, which is expected to have 30 projects closed as of January 12, 2009 and should meet the goal of closing 150 projects by June 30, 2009.
Municipal Master Agreements One recommendation of the Contract Process Improvement effort was the development of a Municipal Master Agreement to streamline non-competitive agreements such as those with municipalities or political sub-divisions. Currently, each project with a municipality or political sub-division is treated as a new agreement or contract, which are 50 to 100 pages long and take an average of 150 days to execute.
The Department is developing master agreements that will contain all of the provisions necessary to enter into an agreement with a municipality or political sub-division, with specific programs or projects then being attached to the master agreement. As they are implemented, these program/project updates should be only 3 to 5 pages and should take a fraction of the time to execute, as all of the legal provisions would be included in the master agreement and would not need to be addressed each time a program/project was added. The Department plans to pilot the new master agreements with several municipalities by July 1, 2009.
38
Accountability &
Transparency
Quality of Life
Efficiency &
Effectiveness Safety &
Security
Preservation
from start to finish; the number of revisions; the total time in each unit or with each person; the number of questions and type of issues; the n u m b e r a n d s e v e r i t y o f implementation or awarding issues; percentage delayed each year; and the number of days in excess of the allotted 60 days. Also, contracts will be electronically recorded and bid advertising delays will be tracked with reasons. Bid opening delays with reasons, documentation of any other delays, and the recording of all bid irregularities with coding will be documented to help to educate contractors and staff as to what mistakes are frequently made.
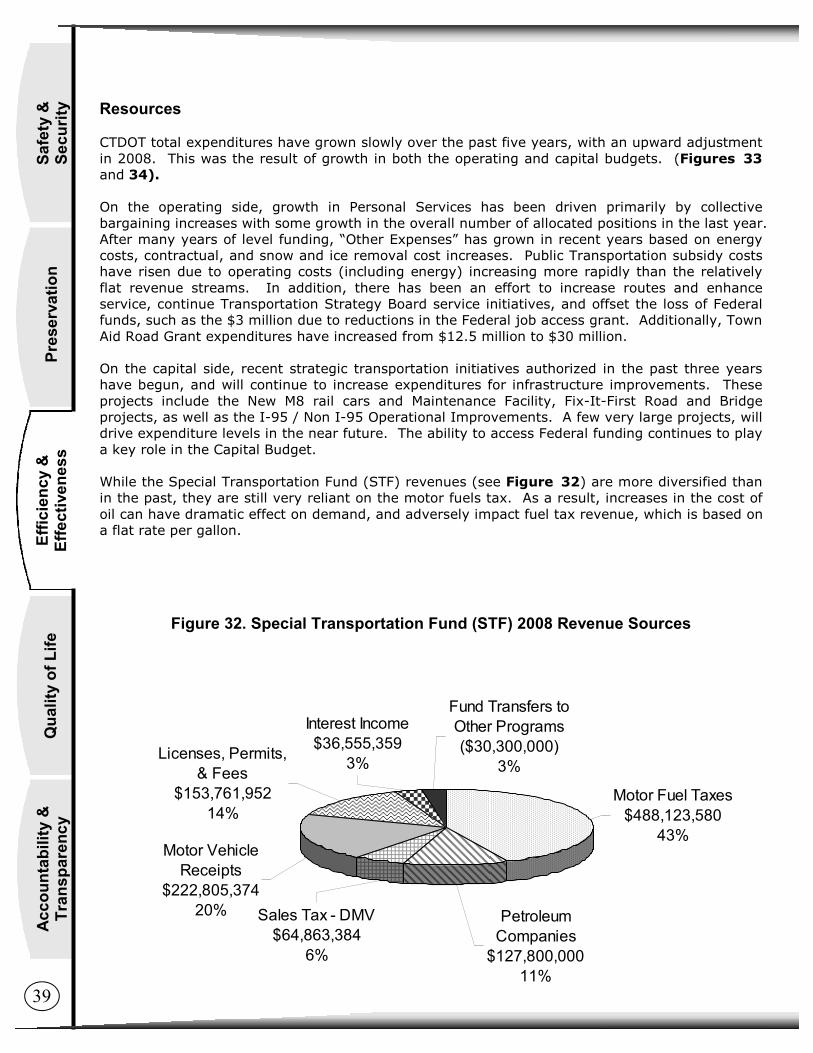
Resources CTDOT total expenditures have grown slowly over the past five years, with an upward adjustment in 2008. This was the result of growth in both the operating and capital budgets. (Figures 33 and 34). On the operating side, growth in Personal Services has been driven primarily by collective bargaining increases with some growth in the overall number of allocated positions in the last year. After many years of level funding, “Other Expenses” has grown in recent years based on energy costs, contractual, and snow and ice removal cost increases. Public Transportation subsidy costs have risen due to operating costs (including energy) increasing more rapidly than the relatively flat revenue streams. In addition, there has been an effort to increase routes and enhance service, continue Transportation Strategy Board service initiatives, and offset the loss of Federal funds, such as the $3 million due to reductions in the Federal job access grant. Additionally, Town Aid Road Grant expenditures have increased from $12.5 million to $30 million. On the capital side, recent strategic transportation initiatives authorized in the past three years have begun, and will continue to increase expenditures for infrastructure improvements. These projects include the New M8 rail cars and Maintenance Facility, Fix-It-First Road and Bridge projects, as well as the I-95 / Non I-95 Operational Improvements. A few very large projects, will drive expenditure levels in the near future. The ability to access Federal funding continues to play a key role in the Capital Budget. While the Special Transportation Fund (STF) revenues (see Figure 32) are more diversified than in the past, they are still very reliant on the motor fuels tax. As a result, increases in the cost of oil can have dramatic effect on demand, and adversely impact fuel tax revenue, which is based on a flat rate per gallon.
Special Transportation Fund (STF)2008 Revenue
Motor Fuel Taxes$488,123,580
43%
Fund Transfers to Other Programs($30,300,000)
3%
Petroleum Companies
$127,800,000 11%
Sales Tax - DMV$64,863,384
6%
Motor Vehicle Receipts
$222,805,374 20%
Licenses, Permits, & Fees
$153,761,952 14%
Interest Income$36,555,359
3%
Figure 32. Special Transportation Fund (STF) 2008 Revenue Sources
39
Acc
ount
abili
ty &
Tr
ansp
aren
cy
Qua
lity
of L
ife
Effic
ienc
y &
Ef
fect
iven
ess
Safe
ty &
Se
curit
y Pr
eser
vatio
n

$710$683 $659
$612
$746
$0
$100
$200
$300
$400
$500
$600
$700
$800
Milli
ons
2004 2005 2006 2007 2008Fiscal Year
State - Bond Federal - (matches Capital)
Expenditures funded from:
Figure 33. CTDOT Total Expenditures from 2004 to 2008 (Operating)
Figure 34. CTDOT Total Expenditures by Funding Source 2004 to 2008 (Capital)
$372$400
$446$485
$530
$0
$100
$200
$300
$400
$500
$600
Mill
ions
2004 2005 2006 2007 2008Fiscal year
State - Appropriated State - Other
Expenditures funded from:
40
Accountability &
Transparency
Quality of Life
Efficiency &
Effectiveness Safety &
Security
Preservation

3,553
198
3,033
727
3,073
312
3,058
291
3,147
202
3,268
276
0
500
1,000
1,500
2,000
2,500
3,000
3,500
4,000
2003 2004 2005 2006 2007 2008
FilledPositions
VacantPositions
Figure 35. CTDOT Allocated and Filled Position Counts on January 1, 2003 to 2008
I-91 and I-84 Interchange
41
Acc
ount
abili
ty &
Tr
ansp
aren
cy
Qua
lity
of L
ife
Effic
ienc
y &
Ef
fect
iven
ess
Safe
ty &
Se
curit
y Pr
eser
vatio
n

Allocated and Filled Positions The overall number of filled positions within the Department has risen in recent years from a low in 2004. Figure 36 depicts the actual number of maintenance positions from 2003 to 2008. The Department is currently reviewing staffing levels within Highway Operations to determine overall requirements, particularly in the area of bridge maintenance. As Figure 37 shows, the Department has made a concerted recruiting effort recently and has increased the number of engineers considerably since last year. Developing and maintaining this talent will be vital in the year’s ahead to ensure the overall success of the Department.
Figure 37. CTDOT Filled Engineering Positions
1,3211,371
1,449 1,441 1,446
1,528
1,200
1,250
1,300
1,350
1,400
1,450
1,500
1,550
2003 2004 2005 2006 2007 2008
Maintenance Positions
666 682 680 682752
842
0100200300400500600700800900
2003 2004 2005 2006 2007 2008
Engineering Positions
Figure 36. CTDOT Filled Maintenance Positions
42
Accountability &
Transparency
Quality of Life
Efficiency &
Effectiveness Safety &
Security
Preservation

Quality of Life
Aviation Enhancing the Quality of Life Bradley International Airport is the second busiest airport in New England. As of June 2008, American, Continental, Delta, Frontier, Northwest, Southwest, United, US Airways, Air Canada and fifteen additional regional commuter / express operators serve the Airport. The Airport offered 233 daily flights, including 116 departures with 38 non-stop destinations. In FY 2008, a total of 6.5 million passengers departed and arrived at Bradley, and the Department has improved customer’s experience in the Airport’s passenger terminal. Artists, painters and sculptors are given access to the display cases in the terminal to display their work. Live music performances are regularly scheduled. The current schedule includes performances in each of the next 12 months with a variety of genres represented. The Department also understands that for Bradley International Airport to enhance the quality of life in Connecticut, it must also be good to the environment and a good neighbor.
It is the objective of CTDOT to improve the overall quality of life for the residents of Connecticut by expanding mobility options and embracing designs that promote liveability and are compatible with our environment. Among other things, the Department has focused efforts on noise mitigation, reuse of materials and advanced use of de-icing technology. It optimizes its programs by tracking congestion and accident clearing rates, as well as utilizing advanced traffic management.
Transit Oriented Development (TOD) is the creation of residential, commercial and employment centers within walking distance of public transportation facilities, especially rail and rapid transit. Successful TOD projects include both private and public investment in this mixed use environment. TOD is an integral component of the Department's comprehensive transportation policy, plan and strategy. The Department is currently engaged in discussions with municipal officials and private developers throughout the State to make TOD a reality.
South Norwalk
43
Acc
ount
abili
ty &
Tr
ansp
aren
cy
Qua
lity
of L
ife
Effic
ienc
y &
Ef
fect
iven
ess
Safe
ty &
Se
curit
y Pr
eser
vatio
n
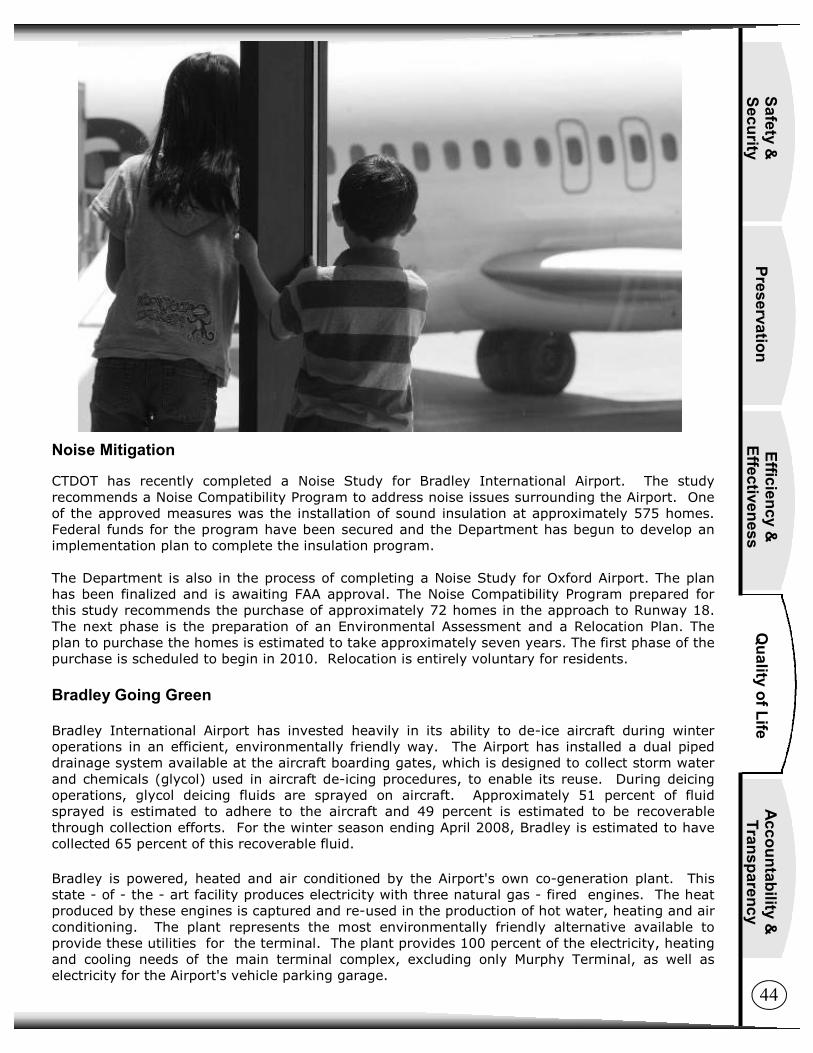
Noise Mitigation CTDOT has recently completed a Noise Study for Bradley International Airport. The study recommends a Noise Compatibility Program to address noise issues surrounding the Airport. One of the approved measures was the installation of sound insulation at approximately 575 homes. Federal funds for the program have been secured and the Department has begun to develop an implementation plan to complete the insulation program. The Department is also in the process of completing a Noise Study for Oxford Airport. The plan has been finalized and is awaiting FAA approval. The Noise Compatibility Program prepared for this study recommends the purchase of approximately 72 homes in the approach to Runway 18. The next phase is the preparation of an Environmental Assessment and a Relocation Plan. The plan to purchase the homes is estimated to take approximately seven years. The first phase of the purchase is scheduled to begin in 2010. Relocation is entirely voluntary for residents.
Bradley Going Green
Bradley International Airport has invested heavily in its ability to de-ice aircraft during winter operations in an efficient, environmentally friendly way. The Airport has installed a dual piped drainage system available at the aircraft boarding gates, which is designed to collect storm water and chemicals (glycol) used in aircraft de-icing procedures, to enable its reuse. During deicing operations, glycol deicing fluids are sprayed on aircraft. Approximately 51 percent of fluid sprayed is estimated to adhere to the aircraft and 49 percent is estimated to be recoverable through collection efforts. For the winter season ending April 2008, Bradley is estimated to have collected 65 percent of this recoverable fluid.
Bradley is powered, heated and air conditioned by the Airport's own co-generation plant. This state - of - the - art facility produces electricity with three natural gas - fired engines. The heat produced by these engines is captured and re-used in the production of hot water, heating and air conditioning. The plant represents the most environmentally friendly alternative available to provide these utilities for the terminal. The plant provides 100 percent of the electricity, heating and cooling needs of the main terminal complex, excluding only Murphy Terminal, as well as electricity for the Airport's vehicle parking garage.
44
Accountability &
Transparency
Quality of Life
Efficiency &
Effectiveness Safety &
Security
Preservation

Improving Winter Highway Maintenance The traditional de-icing approach to winter highway maintenance, utilizing sand and salt, has been used in Connecticut for at least 35 years. De-icing is a strategy by which ice and or compacted snow is removed from the roadway by either chemical or mechanical means or both. There are three critical goals—reducing costs, increasing safety and minimizing environmental impacts. Sand has potentially negative human health impacts, limited traction at higher traffic volumes, and requires significant effort and cost to collect and dispose of in the spring season. The Department has implemented a roadway pretreatment program, based on the success of a pilot program which was completed last winter (2007/08). The pilot program involved pre-treating elevated roadways, curves and bridges with liquid salt brine to prevent the formation of frost and black ice. This season, the Department has expanded the pre-treatment to all state maintained roadways. This program has proven to be successful at reducing accidents caused by frozen roadway surfaces.
Recycled Construction and Maintenance Materials
Figure 38. Recycling in Construction and Maintenance Materials for Concrete, Bituminous Concrete, Wood and Steel
* Demolition contains generated and reused Portland Cement Concrete and Bituminous Concrete. Note: All steel and aluminum was surpluses and sold for scrap.
Item 2000 2002 2003 2004 2006 2007 Demolition Debris (Tons)*
563,594 424,377 393,984 364,816 232,679 396,483
Wood (Tons) 3,129 2,172 7,352 470 85 380
Steel (Tons) 3,417 2,339 2,547 1,372 5,922 12,654
CTDOT has collected information on generation, re-use and recycling of construction materials since 1996. The materials shown in Figure 38 were generated onsite or within a Department project or property, and reused onsite or transported to another Department project or property for reuse. None of the materials were disposed of outside of Department projects. Since the transportation network includes large quantities of pavement and bridge materials, all rehabilitation/reconstruction activities affect a significant quantity of construction materials; in particular, concrete, steel, and wood. Fortunately, all of these materials are recyclable or re-usable. Nearly 100 percent of bituminous pavements that are milled or removed from roadways end up back into pavements. The construction demolition debris for concrete road and bridge replacements, airport runway and, in some cases, buildings can be reused as roadway base material or as structural fill. All steel and aluminum is 100 percent recyclable, and all brush and trees that are removed from the roadsides are chipped and handled in an environmentally acceptable way. When economically feasible, even recycled glass beverage containers have been incorporated into construction projects.
Diesel Locomotive Initiatives
In 2007, all rail diesel operations converted to low-sulfur fuel (500ppm) for running of Shore Line East and New Haven Line locomotives. Metro-North Railroad began several years earlier running low sulfur fuel in their locomotives. Studies show that a decrease in sulfur fuel from 3,000 ppm to 500 ppm results in an approximate 10 percent reduction in Particulate Matter (PM) emissions, at a cost of 1 to 3 cents per gallon. The Department and Metro-North Railroad purchased 12 new Brookville Locomotives, BL20GH. With their arrival in 2008, these locomotives are especially designed for operating on both passenger and work-train service, and are more fuel efficient and 45
Acc
ount
abili
ty &
Tr
ansp
aren
cy
Qua
lity
of L
ife
Effic
ienc
y &
Ef
fect
iven
ess
Safe
ty &
Se
curit
y Pr
eser
vatio
n

Buses and Bus Facilities The statewide bus fleet of over 600 full-size transit buses has completed its transition to ultra-low sulfur diesel fuel. In addition, most of those buses are also operating with a five percent biofuels additive. The three largest CTTransit maintenance and storage facilities have added five percent biofuels to the heating oil used for space and hot water heating for a combined total of about 300,000 gallons of biofuels added to the total usage of about six million gallons of diesel motor and heating fuels. CTDOT added its first fuel cell bus to the fleet operations in 2007. The State also was accepted into a Federal Transit Administration fuel cell bus research program, which will deliver four more fuel cell buses to CTTransit in 2009 and 2010. The Department has begun installing diesel particulate filters on its diesel bus fleet using Federal Congestion Management and Air Quality (CMAQ) funds. These filters can remove most of the remaining diesel particulates emitted by the older buses in our fleet. In 2005, CTTransit began operating two diesel-electric hybrids buses in regular service. These buses achieve an improvement in fuel economy and a reduction in emissions of about 20 percent when compared to buses of similar make, model and age. Additionally, the Hartford Bus Storage and Maintenance Facility has had a 23Kw photovoltaic installation on its roof, offsetting electrical purchases amounting to over 30,000 KwH of electricity annually.
environmentally friendly. Two BL20GH locomotives (at 2000 horsepower) burn less than half the fuel of 1 older P40 locomotive (4000 horsepower). In 2008, the Department cut in half PM emissions from the current locomotive fleet by the introduction of new locomotives. New M8 Rail Fleet
The new M8 rail fleet will be able to save power through regenerative braking. Regenerative braking converts braking power into electricity, where it feeds power back up into the catenary, thus returning electricity back into the system.
Fuel Cell Transit Bus
46
Accountability &
Transparency
Quality of Life
Efficiency &
Effectiveness Safety &
Security
Preservation
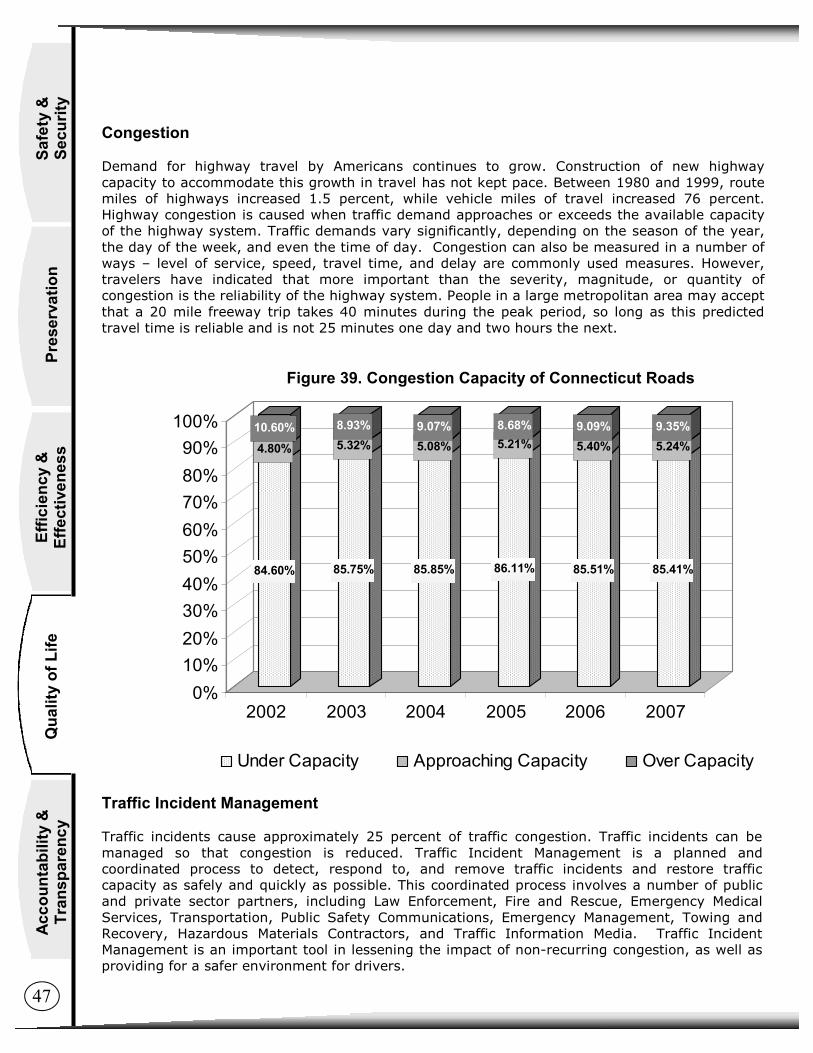
84.60%
4.80%10.60%
85.75%
5.32%8.93%
85.85%
5.08%9.07%
86.11%
5.21%8.68%
85.51%
5.40%9.09%
85.41%
5.24%9.35%
0%10%20%30%40%50%60%70%80%90%
100%
2002 2003 2004 2005 2006 2007
Under Capacity Approaching Capacity Over Capacity
Congestion Demand for highway travel by Americans continues to grow. Construction of new highway capacity to accommodate this growth in travel has not kept pace. Between 1980 and 1999, route miles of highways increased 1.5 percent, while vehicle miles of travel increased 76 percent. Highway congestion is caused when traffic demand approaches or exceeds the available capacity of the highway system. Traffic demands vary significantly, depending on the season of the year, the day of the week, and even the time of day. Congestion can also be measured in a number of ways – level of service, speed, travel time, and delay are commonly used measures. However, travelers have indicated that more important than the severity, magnitude, or quantity of congestion is the reliability of the highway system. People in a large metropolitan area may accept that a 20 mile freeway trip takes 40 minutes during the peak period, so long as this predicted travel time is reliable and is not 25 minutes one day and two hours the next.
Figure 39. Congestion Capacity of Connecticut Roads
Traffic Incident Management Traffic incidents cause approximately 25 percent of traffic congestion. Traffic incidents can be managed so that congestion is reduced. Traffic Incident Management is a planned and coordinated process to detect, respond to, and remove traffic incidents and restore traffic capacity as safely and quickly as possible. This coordinated process involves a number of public and private sector partners, including Law Enforcement, Fire and Rescue, Emergency Medical Services, Transportation, Public Safety Communications, Emergency Management, Towing and Recovery, Hazardous Materials Contractors, and Traffic Information Media. Traffic Incident Management is an important tool in lessening the impact of non-recurring congestion, as well as providing for a safer environment for drivers.
47
Acc
ount
abili
ty &
Tr
ansp
aren
cy
Qua
lity
of L
ife
Effic
ienc
y &
Ef
fect
iven
ess
Safe
ty &
Se
curit
y Pr
eser
vatio
n
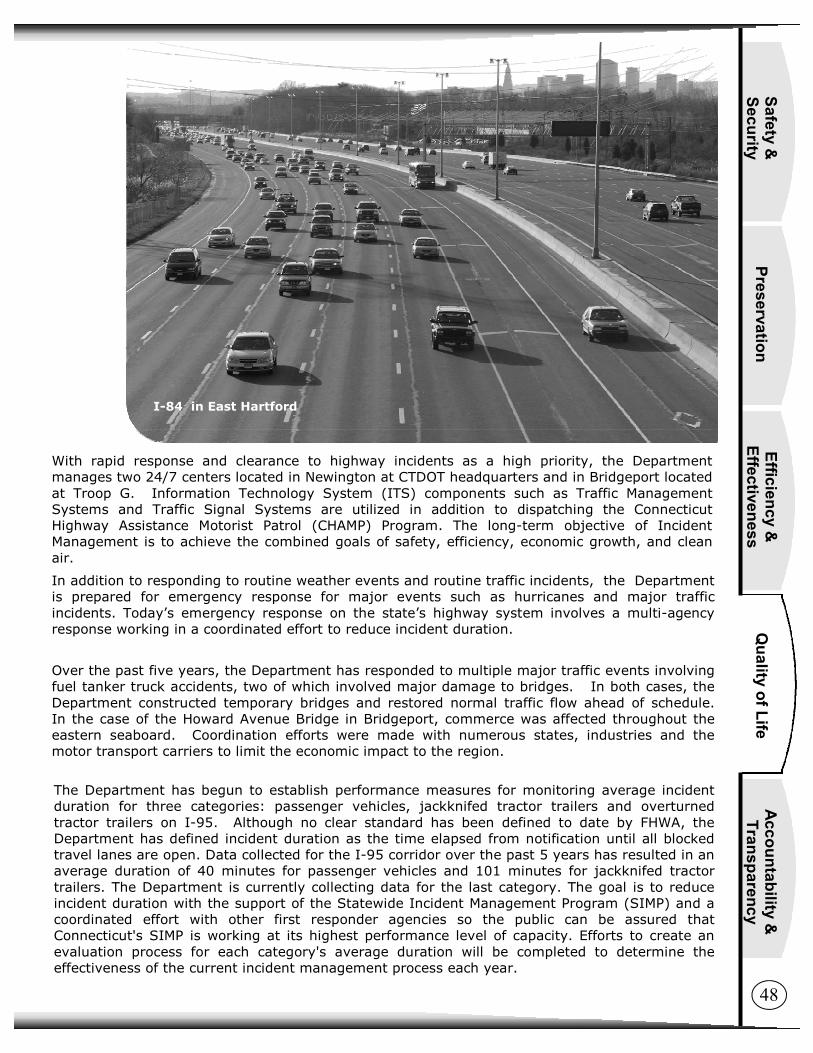
With rapid response and clearance to highway incidents as a high priority, the Department manages two 24/7 centers located in Newington at CTDOT headquarters and in Bridgeport located at Troop G. Information Technology System (ITS) components such as Traffic Management Systems and Traffic Signal Systems are utilized in addition to dispatching the Connecticut Highway Assistance Motorist Patrol (CHAMP) Program. The long-term objective of Incident Management is to achieve the combined goals of safety, efficiency, economic growth, and clean air.
In addition to responding to routine weather events and routine traffic incidents, the Department is prepared for emergency response for major events such as hurricanes and major traffic incidents. Today’s emergency response on the state’s highway system involves a multi-agency response working in a coordinated effort to reduce incident duration.
Over the past five years, the Department has responded to multiple major traffic events involving fuel tanker truck accidents, two of which involved major damage to bridges. In both cases, the Department constructed temporary bridges and restored normal traffic flow ahead of schedule. In the case of the Howard Avenue Bridge in Bridgeport, commerce was affected throughout the eastern seaboard. Coordination efforts were made with numerous states, industries and the motor transport carriers to limit the economic impact to the region.
The Department has begun to establish performance measures for monitoring average incident duration for three categories: passenger vehicles, jackknifed tractor trailers and overturned tractor trailers on I-95. Although no clear standard has been defined to date by FHWA, the Department has defined incident duration as the time elapsed from notification until all blocked travel lanes are open. Data collected for the I-95 corridor over the past 5 years has resulted in an average duration of 40 minutes for passenger vehicles and 101 minutes for jackknifed tractor trailers. The Department is currently collecting data for the last category. The goal is to reduce incident duration with the support of the Statewide Incident Management Program (SIMP) and a coordinated effort with other first responder agencies so the public can be assured that Connecticut's SIMP is working at its highest performance level of capacity. Efforts to create an evaluation process for each category's average duration will be completed to determine the effectiveness of the current incident management process each year.
I-84 in East Hartford
48
Accountability &
Transparency
Quality of Life
Efficiency &
Effectiveness Safety &
Security
Preservation

Traffic Management Systems Traffic Management Systems (TMS) are currently deployed along I-95, I-84, I-91, I-395, Route 1 and Route 2. Operations staff have the ability to monitor traffic conditions, detect incidents, notify appropriate response personnel, track response personnel and track incident duration. The systems also alert motorists of conditions through variable message signs, Highway Advisory Radio (HAR), and video and incident information on the CTDOT web page. E-Alert has recently been added to notify subscribers of highway and rail incident information.
Business Development Program CTDOT administers a Business Development Program for firms certified by the Department as Disadvantaged Business Enterprises (DBE). The Disadvantaged Business Program is an economic development program that stimulates business growth and job creation. The purpose of the program is to provide no cost comprehensive developmental services to the Department DBE firms to assist with growth and competitiveness, thereby encouraging their progress toward self-sufficiency. The program provides supportive assistance in two major areas: 1) Business Assessment and 2) Development Plan Implementation. Some of the areas of assistance are: Financial Management Services, Construction Management Services, Operational Management Services and Procurement. Connecticut was among the first programs in the nation to be selected for the initial pilot. The Department has been successful in obtaining over $2.5 million in Federal funds over the past five years to implement the program.
Newington Highway Operations Center
49
Acc
ount
abili
ty &
Tr
ansp
aren
cy
Qua
lity
of L
ife
Effic
ienc
y &
Ef
fect
iven
ess
Safe
ty &
Se
curit
y Pr
eser
vatio
n

Bikeways, Walkways and Trails In an effort to meet the public's demand for improved mobility and a better quality of life, CTDOT supports the use of bicycling and walking throughout Connect i cut and attempts to provide a safe and convenient environment for the use of these non-motorized modes of transportation. The state's network of multi-use trails is also an important element in the State’s transportation system. These trails provide a means for many Connecticut residents to use non-motorized transportation to travel safely and conveniently from a location near their homes to other destinations in the state. The Department’s targets with respect to bicycle and pedestrian transportation are as follows:
• To provide a statewide multi-use trail system that is i n t eg ra t ed w i t h o the r transportation systems.
• To provide and maintain a safe, convenient and pleasing bicycle and pedestrian environment.
• To encourage and support bicycle/pedestrian safety, education and enforcement programs.
• To make full use of State resources in providing technical assistance to towns and municipalities for the development of bicycle and p e d e s t r i a n f a c i l i t i e s throughout Connecticut.
50
Accountability &
Transparency
Quality of Life
Efficiency &
Effectiveness Safety &
Security
Preservation

Communication CTDOT is undergoing a concerted effort to make our practices and services visible to our stakeholders: citizens, municipalities, legislators, the State executive branch, Federal partners and the news media. A major focus has been placed on enhancing our communication - clearly informing our customers about programs at the Department. This report will be one of many mechanisms for the agency to communicate and be accountable to the citizens of Connecticut. As part of this initiative, the Department is developing a new website that aims to be more customer friendly and intuitive. It will provide enhanced and up-to-date agency, project and performance information. Some features of this redesigned website became available in early January 2009 and full implementation is expected by early summer.
Public Outreach and Partnering
The Department has a strong commitment to partnering and continues to use these opportunities to better understand community, State and regional transportation needs. The Department provides coordination of all State and local transportation governance, including the Metropolitan Planning Organizations and the Rural Regional Planning Organizations, (collectively referred to RPO’s), which consists of administering the Metropolitan and Rural Regional Transportation Programs and Agreements. The Department provides coordination with the RPO’s on all transportation issues concerning the State and provides guidance to RPO’s in the areas of Federal law compliance, planning regulations, and Title VI/environmental justice requirements. This coordination allows for a complete view of the State transportation system and enables the Department to plan based on the needs of the communities and the region. Discussions with these various entities, as well as many other community and business groups, help to map transportation projects for today and the future. The Commissioner of the Department of Transportation is a member of numerous commissions, including the Connecticut Maritime Commission and the Connecticut Pilot Commission. The Connecticut Maritime Commission is the primary body within the State of Connecticut to develop and recommend maritime policy to the Governor, the Department and the General Assembly. The Connecticut Pilot Commission is responsible to assist and advise the Commissioner of Transportation on matters relating to the licensure of pilots, the safe conduct of vessels and the protection of the ports and waters of the state, including the waters of Long Island Sound. The Commissioner’s membership to the Transportation Strategy Board, the Bradley Board and other commissions and committees assures multi-modal and balanced input to our decision making processes. Additionally, the Department hosts numerous informational and listening meetings, as well as formal public hearings, to discuss projects and transportation issues, and to listen to the needs of our customers. Transportation decisions have an effect on people, communities, livelihood and quality of life. Obtaining community input is critical for advancing the transportation system.
Accountability and Transparency
It is the objective of CTDOT to be committed to full transparency in all of its business matters. The Department will continue to find ways to effectively communicate and make public all of its business practices and process by ensuring the highest level of integrity in the use of public funds.
51
Acc
ount
abili
ty &
Tr
ansp
aren
cy
Qua
lity
of L
ife
Effic
ienc
y &
Ef
fect
iven
ess
Safe
ty &
Se
curit
y Pr
eser
vatio
n
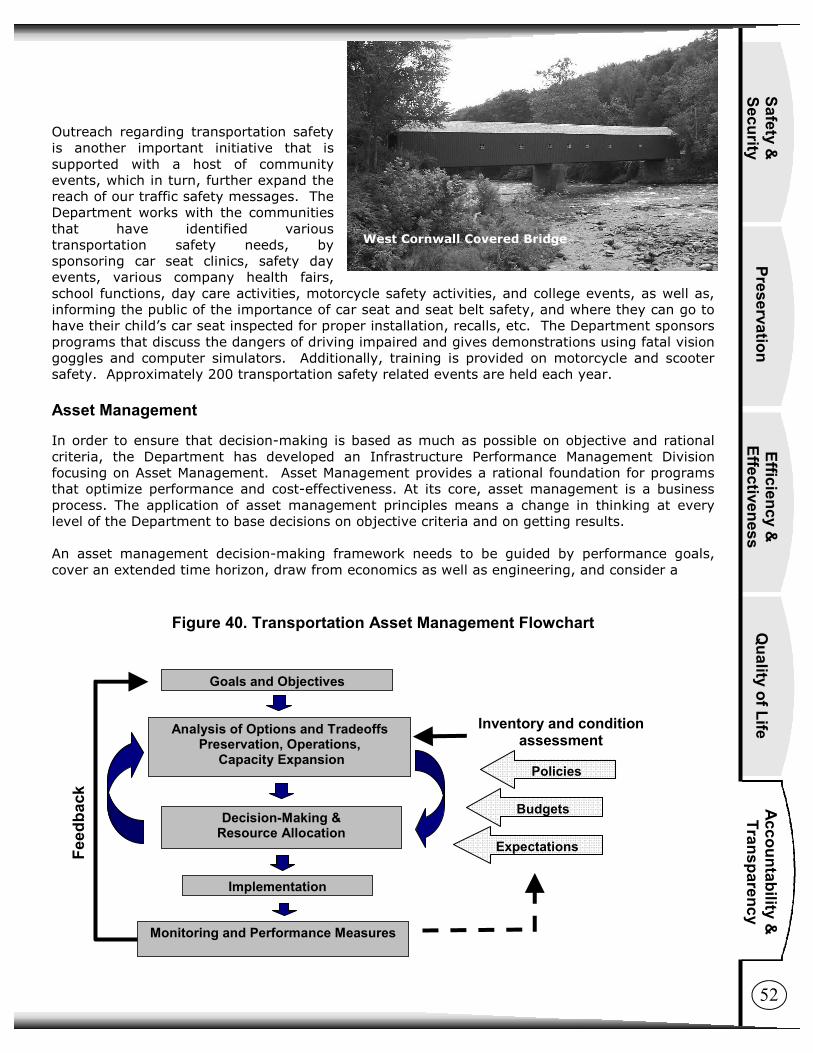
Outreach regarding transportation safety is another important initiative that is supported with a host of community events, which in turn, further expand the reach of our traffic safety messages. The Department works with the communities that have identified various transportation safety needs, by sponsoring car seat clinics, safety day events, various company health fairs, school functions, day care activities, motorcycle safety activities, and college events, as well as, informing the public of the importance of car seat and seat belt safety, and where they can go to have their child’s car seat inspected for proper installation, recalls, etc. The Department sponsors programs that discuss the dangers of driving impaired and gives demonstrations using fatal vision goggles and computer simulators. Additionally, training is provided on motorcycle and scooter safety. Approximately 200 transportation safety related events are held each year.
Asset Management In order to ensure that decision-making is based as much as possible on objective and rational criteria, the Department has developed an Infrastructure Performance Management Division focusing on Asset Management. Asset Management provides a rational foundation for programs that optimize performance and cost-effectiveness. At its core, asset management is a business process. The application of asset management principles means a change in thinking at every level of the Department to base decisions on objective criteria and on getting results. An asset management decision-making framework needs to be guided by performance goals, cover an extended time horizon, draw from economics as well as engineering, and consider a
Figure 40. Transportation Asset Management Flowchart
Expectations
Decision-Making & Resource Allocation
Goals and Objectives
Analysis of Options and Tradeoffs Preservation, Operations,
Capacity Expansion
Implementation
Monitoring and Performance Measures
Feed
back
Budgets
Policies
Inventory and condition assessment
West Cornwall Covered Bridge
52
Accountability &
Transparency
Quality of Life
Efficiency &
Effectiveness Safety &
Security
Preservation

broad range of assets. The Core Principles of Asset Management as seen in Figure 40 are:
• Policy-driven—Resource allocation decisions are based on a well-defined set of policy goals and objectives.
• Performance-based—Policy objectives are translated into system performance measures that are used for both day-to-day and strategic management.
• Analysis of Options and Tradeoffs—Decisions on how to allocate funds within and across different types of investments (e.g., preventive maintenance versus rehabilitation, pavements versus bridges) are based on an analysis of how different allocations will impact achievement of relevant policy objectives.
• Decisions Based on Quality Information—The merits of different options with respect to an agency's policy goals are evaluated using credible and current data.
• Monitoring Provides Clear Accountability and Feedback—Performance results are monitored and reported for both impacts and effectiveness.
Transportation Asset Management focuses on the whole transportation infrastructure, and makes possible, decisions that reflect the optimal performance of that infrastructure compared to the resources required to operate and maintain it. Additionally, asset management examines investment timing, tools and economic analyses to assure the effective use of available funds. The information underlying asset management–sometimes raw data and at other times data generated from the analytical process–is fundamental to an improved understanding of the economic tradeoffs.
Quality Assurance
With recent challenges on major projects such as the Waterbury I–84 project , the Department has engaged in an extensive “lessons learned” effort, which has resulted in the creation of a Quality Assurance (QA) Unit. The emphasis for this Unit is objectivity and independence. The Department recognizes the vital importance of ensuring that taxpayer’s dollars are spent wisely and that the public’s interest is protected.
This office will provide the Department with the ability to perform process reviews, technical audits, quality assurance and constructability reviews for its Capital Programs. The Office will also focus on the application of technology in engineering and construction to deliver transportation projects in a more efficient, cost effective and high-quality manner.
An Independent Assurance (IA) system provides validity to the QA program. Its function is to ensure that sampling and testing are being conducted properly. The objective is to resolve all disputes at the lowest possible level.
Thus far in Connecticut, several trial specifications and special provisions in the area of hot-mix asphalt (HMA) construction have been developed in conjunction with the HMA Task Force for Pavement Improvement and evaluated on various projects.
As the Department moves forward in the development of this unit, all participants will be included to achieve a successful QA implementation. Joint involvement, communication, education/training, continuity, and commitment are all fundamental ingredients to a strong QA program in Connecticut.
53
Acc
ount
abili
ty &
Tr
ansp
aren
cy
Qua
lity
of L
ife
Effic
ienc
y &
Ef
fect
iven
ess
Safe
ty &
Se
curit
y Pr
eser
vatio
n

Revamping the Construction Inspection Process The Department has revised the requirements for consultant inspection firms to include a Quality Management Plan. This plan must describe how the consulting firm will ensure the quality of its work. The Department modified and streamlined many administrative procedures to enable field staff to spend more time in the field inspecting the work. New guidelines have been developed for Project Engineers working on construction projects. The training program for the Department's field staff was modified to emphasize inspection fundamentals. Additional sign-offs are now done to certify the daily inspection report and that work was performed in conformance with the contract requirements. The daily inspection report was modified in several respects and requires any defective work to be identified on this form. The inspection units will work closely with the newly established QA office to continue to review and improve the way in which inspections are performed.
Project Delivery
CTDOT recognizes the need to continuously look for ways to improve project delivery without compromising safety or quality. The Department will begin reporting regularly on the status of large scale projects on the new website. Each project report will include: estimated budget, description of the projects scope, estimated time of completion and other details depending on the complexity of the project. The Department’s goal is to have these projects updated as major phases are completed and/or quarterly so that reliable and current information on the status can be obtained. Pilot Design Projects are another example of efforts being made by the Department to improve delivery. The Pilot Design Projects using electronic plan submissions have allowed reviewing and commenting on design submissions to proceed with greater efficiency and accuracy. Comments during the review process are developed in a digital format, and each submission milestone is stored electronically for future needs during the design process. These digital contracts also have construction benefits, due to the ease of sharing and distributing the electronic plans and specifications, along with the inherited intelligence like searching and measuring within the documents. The Department will continue its review of this project delivery process.
54
Accountability &
Transparency
Quality of Life
Efficiency &
Effectiveness Safety &
Security
Preservation
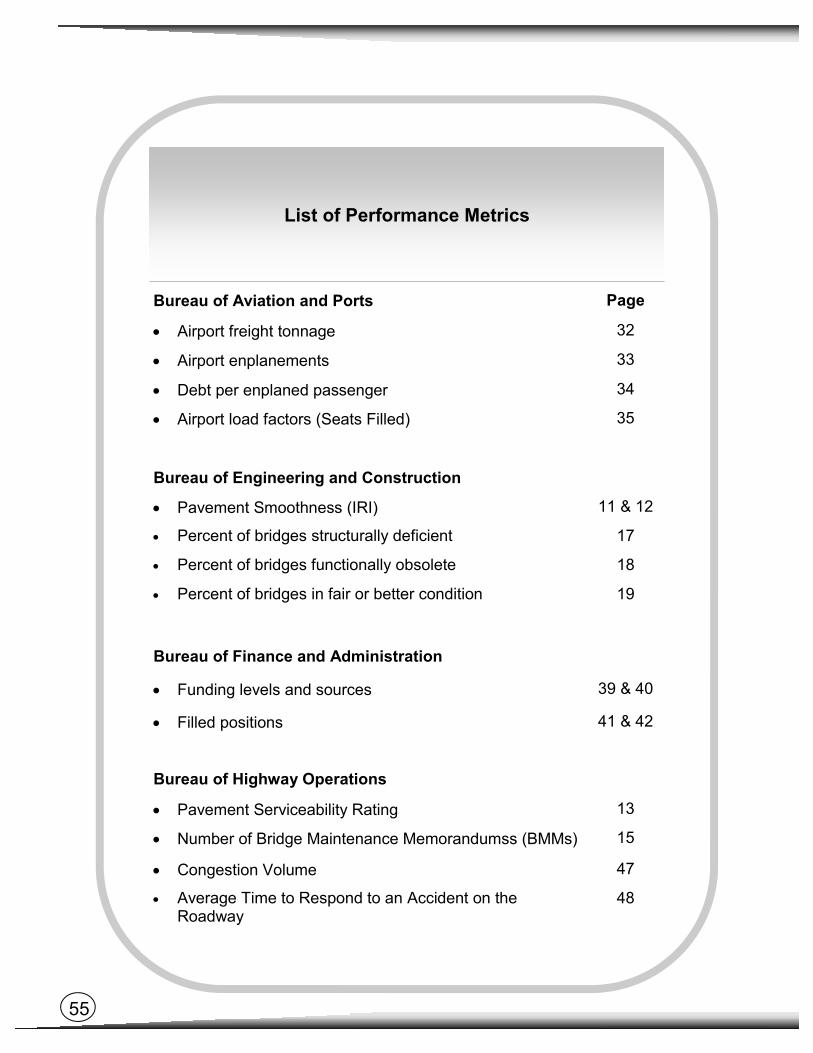
Bureau of Aviation and Ports Page
• Airport freight tonnage 32
• Airport enplanements 33
• Debt per enplaned passenger 34
• Airport load factors (Seats Filled) 35
Bureau of Engineering and Construction
• Pavement Smoothness (IRI) 11 & 12
• Percent of bridges structurally deficient 17
• Percent of bridges functionally obsolete 18
• Percent of bridges in fair or better condition 19
Bureau of Finance and Administration
• Funding levels and sources 39 & 40
• Filled positions 41 & 42
Bureau of Highway Operations
• Pavement Serviceability Rating 13
• Number of Bridge Maintenance Memorandumss (BMMs) 15
• Congestion Volume 47
• Average Time to Respond to an Accident on the Roadway
48
List of Performance Metrics
55

56
Bureau of Policy and Planning
• Number of highway fatalities per 100,000 population 3 & 4
• Number of highway fatalities per 100 million miles traveled 4
• Number of injured persons per 100,000 population 3
• Injuries and fatalities among bicyclists and pedestrians 5
• Injuries and fatalities among motorcycle operators and passengers
6
• Seat belt usage rates 5
• Work Zone related fatalities and crashes 6
• Percent of impaired driving fatalities 6 & 7
Bureau of Public Transportation
• Rail Customer Safety 9
• Condition of rail road bridges 20
• Average age of the rail and bus fleets 22 & 23
• Rail mean distance between failures (Rail) 25
• Transit mean distance between outages (Bus) 26
• Rail Ridership 29
• Rail on time performance 30
• Bus Ridership 31
• Rail freight volumes 32
List of Performance Metrics
Tables and Charts Page 1. Fatalities Per 100 Million Vehicle Miles Traveled 4 2. State Highway Traffic Fatality Rate Per 100,000
Population, 2006 3 & 4
3. Seat Belt Use 5 4. Yearly Storm and Weather Activity Totals 8 5. Customer Perception of Rail Safety 9 6. Ride Quality on Connecticut’s National Highway
System Roads 11
7. Ride Quality on the National Highway System in New England and New York, 2006
12
8. Pavement Serviceability Rating, 2007 13 9. CTDOT Bridge Maintenance Memorandums
(Requests) 15
10. Arrigoni Bridge - Middletown 16 11. Percent of CT Highway Bridges Rated Structurally
Deficient and Functionally Obsolete, 2007 17
12. Percent of Highway Bridges Classified Structurally Deficient, 2007
17
13. Percent of Highway Bridges Classified Functionally Obsolete, 2007
18
14. Condition of Connecticut’s Highway Bridges, 2007 19 15. Federal Bridge Condition Rating Categories 19 16. Condition of Connecticut’s Rail Bridges, 2007 20 17. Average Age of Connecticut’s Transit Fleet 22 18. Average Age of the New Haven Line EMU Fleet
(2008) 23
19. Average Age of the New Haven Line EMU Fleet (2012)
23
20. Rail Mean Distance Between Failures (Rail) 25 21. Mean Distance Between Transit Outages (Bus) 26
Figure Index
57

Tables and Charts Page 22. Rail Ridership on the New Haven Line 29
23. Rail Ridership on the Shore Line East Line 29
24. Rail On-Time Performance 30
25. Total Number of CTTransit Passenger Trips 31
26. Rail Freight Tonnage 32 27. Air Freight Tonnage by Year 32
28. Bradley International Airport Enplaned Passengers
33
29. Bradley International Airport Debt per Enplaned Passenger
34
30. Regional Comparison of Load Factor History 35
31. Photolog Usage and Savings 36
32. Special Transportation Fund (STF) 2008 Revenue Sources
39
33. CTDOT Total Expenditures from 2004 to 2008 (Operating)
40
34. CTDOT Total Expenditures by Funding Source 2004 to 2008 (Capital)
40
35. CTDOT Allocated and Filled Position Counts on January 1, 2003 to 2008
41
36. CTDOT Filled Maintenance Positions 42
37. CTDOT Filled Engineering Positions 42
38. Recycling in Construction and Maintenance Materials
45
39. Congestion Capacity of Connecticut Roads 47 40. Transportation Asset Management Flowchart 52
Figure Index
58

Our Mission: The mission of the Connecticut Department of Transportation is to provide a safe and
efficient intermodal transportation network that improves the quality of life and promotes economic vitality for the State and the region.


