PERFORMANCE MONITORING PLAN (PMP) EASTERN INDONESIA WATER AND SANITATION PROGRAM JUNE 2009 This publication was produced by Development Alternatives, Inc. for review by the United States Agency for International Development under Contract No. 497-M-00-05-00005-00
Transcript
PERFORMANCE MONITORING PLAN (PMP) EASTERN INDONESIA WATER AND SANITATION PROGRAM
JUNE 2009
This publication was produced by Development Alternatives, Inc. for review by the United States Agency for International Development under Contract No. 497-M-00-05-00005-00
Photo credit: ESP Jayapura People living in RW 03 Argapura Pantai of Kelurahan Argapura in Jayapura Municipality keep their drinking water in the jerrycans. They have to buy the water from outside the kampong, since their kampong is located above the sea. ESP is working with local PDAM to provide piped water to each household through master meter program.
PERFORMANCE MONITORING PLAN (PMP) EASTERN INDONESIA WATER AND SANITATION PROGRAM Title: Performance Monitoring Plan (PMP) Eastern Indonesia Water and
Sanitation Program Program, activity, or project number: Environmental Services Program,
DAI Project Number: 5300201.
Strategic objective number: SO No. 2, Higher Quality Basic Human Services Utilized (BHS).
Sponsoring USAID office and contract number: USAID/Indonesia,
Contract number: 497-M-00-05-00005-00.
Contractor name: DAI. Date of publication: June 2009
TABLE OF CONTENTS
TABLE OF CONTENTS............................................................................................................. I 1. INTRODUCTION .............................................................................................................. 1 2. ESP EASTERN INDONESIA WATER AND SANITATION PROGRAM WORK PLAN AND PMP INDICATORS .............................................................................................. 6 3. PERFORMANCE MONITORING SYSTEM .................................................................... 9
4. PERFORMANCE INDICATOR REFERENCE SHEET OF BASIC HUMAN SERVICE STRATEGIC OBJECTIVE (BHS SO) ..................................................................................... 11 5. PERFORMANCE INDICATOR REFERENCE SHEET OF EASTERN INDONESIA WATER AND SANITATION PROGRAM ............................................................................ 13 6. REFERENCES ................................................................................................................... 36
1. INTRODUCTION The Environmental Services Program (ESP) is a 64 month program developed and funded by USAID/Indonesia and implemented under the leadership of Development Alternatives, Inc. (DAI). ESP provides technical assistance and related services to impact the Strategic Objective (SO) of Basic Human Services (BHS) focusing on the interdependence of health and the environment and their impact on health outcomes. ESP works with the Government of Indonesia, the private sector, NGOs, community groups and other stakeholders to strengthen watershed management and key environmental services. One of the main objectives of ESP is to improve the health and livelihoods of Indonesians through improved and expanded access to key environmental services such as water, sanitation and solid waste management. These goals are accomplished using appropriate technologies, innovative financing, environmentally sustainable practices and sustainable market-oriented activities. ESP’s current activities focus on the following High Priority Provinces (HPPs): Nanggroe Aceh Darussalam, North Sumatra, West Java, DKI Jakarta, Central Java/DI Yogyakarta and East Java. USAID is also responding to overarching technical and social problems in Eastern Indonesia associated with the lack of access to water and environmental sanitation services (waste water disposal, solid waste management and drainage). The Dutch Embassy in Indonesia has provided additional funding to USAID to expand the ESP program to three cities in Eastern Indonesia, including Manado, Ambon and Jayapura. This document describes the Performance Management Plans (PMP) for ESP Eastern Indonesia Water and Sanitation Program. The PMP document provides information on the outcomes and indicator of the project and implementation of monitoring the achievement of the program outcomes toward the target determined in the contract agreement. This PMP document follows the structure of the current ESP Annual Work Plan, with indicators at the following levels: 1. USAID Basic Human Services (BHS) Strategic Objective (SO) 2. USAID Maintaining Healthy Ecosystems (MHE) Special Objective (Sp) 3. USAID Annual Operational Plan (OP) indicators 4. Eastern Indonesia Water and Sanitation Program Scope of Work Outcomes and
Deliverables A final level, Work Plan task and sub-task level indicators, are used for internal program monitoring and evaluation purposes. Several of the ESP Eastern Indonesia Water and Sanitation program outcomes indicators contribute to USAID’s BHS SO and IR level indicators,, for example, access to clean water and basic sanitation. USAID is also devoting resources to the achievement of a Special Objective (SpO) that bridges the critical connection between healthy ecosystems and basic human services. USAID focuses its interventions on key threats to biodiversity values and specifically target protection of critical ecologically processes and function. Based upon these concerns, several PMP indicators also contribute to USAID’s MHE SpO and IR level indicators, especially the indicators related to the component of Watershed Management and Biodiversity Conservation.
Performance Monitoring Plan (PMP) Eastern Indonesia Water and Sanitation Program
With the establishment of the Operational Plan (OP) by USAID, ESP has clarified specific outcomes indicators that contribute to OP indicators. Several ESP Eastern Indonesia Water and Sanitation program outcome indicators contribute to two objectives of the USAID’s OP’s indicators, including Investing in People (IIP) and Economic Growth (EG). Table 1 below describes the contribution of ESP indicators to USAID’s BHS SO and MHE SpO indicators as well as to the OP’s indicators. The PMP is a performance management tool for ESP to help plan and manage the process of assessing and reporting progress towards achieving program outcomes and results. It is a critical tool for planning, managing, and documenting how performance data are collected and used. All indicators are presented in a uniform format. Each Performance Indicator Reference Sheet describes its indicator in detail and includes definitions, data sources, and frequency of data collection and reporting. ESP is committed to providing monitoring information to USAID/Indonesia and its partners that meets the requirements and guidelines outlined in USAID's ADS Chapters 200-203 as well as the USAID OP Guideline. ESP has strived to ensure that the PMP adequately measures impact of work related to project financing from various earmarks including Biodiversity and Child Survival funding. Whenever possible, the indicators were adapted from standard indicators used by international organizations and USAID for child health programs and water supply, sanitation and hygiene activities. The relevant documents are listed under references. Where such commonly accepted standards do not exist, the proposed indicators closely follow the description of outcomes, tasks and sub-tasks. The development of the PMP indicators take into account the characteristics of good performance indicators as described in the relevant USAID guidelines: • Direct: An indicator should closely track the result it is intended to measure. When
direct indicators cannot be used because of costs or other factors, a reasonable proxy indicator maybe used.
• Objective: Objective indicators are operationally precise and uni-dimensional. They should be unambiguous about what is being measured and what data are being collected.
• Useful for Management: Indicators should be useful for management purposes at relevant levels of decision making
• Practical: An indicator is practical if data can be obtained in a timely way and at reasonable cost.
• Attributable to ESP: Performance indicators should measure change that is clearly and reasonably attributable, at least in part, to the efforts of ESP and therefore USAID. That is, indicators should credibly reflect the actual performance of the ESP Scope of Work.
• Timely: Performance data should be available when they are needed to make decisions. • Adequate: Taken as a group, a performance indicator and its companion indicators should
be the minimum necessary to ensure that progress toward the given results is sufficiently captured.
In attempting to gauge the impact of ESP, attribution becomes a complex issue. Numerous organizations including government, NGOs and donors are active throughout the country and many in the same districts, municipalities and even the same communities as those in which ESP will be active. Wherever possible indicators were identified that will address this issue by focusing on impact that is specific to ESP activities. To be useful for program management, these indicators and key information from the performance indicator reference sheets have been entered in ESP’s management information system (TAMIS – Technical and administrative Management Information System) to ensure timely tracking and reporting.
ENVIRONMENTAL SERVICES PROGRAM WWW.ESP.OR.ID 2
Performance Monitoring Plan (PMP) Eastern Indonesia Water and Sanitation Program
Table 1: ESP’s indicators contributing to USAID’s Indicators (BHS and MHE)
USAID BHS and MHE ESP USAID Operational Plan (OP)
SO/SpO Level Indicators Deliverables/ Outcomes
Indicator Objective/ Program Area/ Element
Indicator
SO Indicator
SO-a: Percent of children < 36 months with diarrhea in last two weeks
Program Outcome
Proportion of children aged 0-59 months (or appropriate age range such as 0-35 or 0-23 months) who had diarrhea at any time in the two-week period prior to the survey
IIP 1.6. Maternal and Child Health
Number of people trained in effective hand washing with soap
Common indicator
SO-c: Number of people in target areas with improved access to adequate safe water supply
Outcome 2.b.
Percent and number of household that benefit from an improved water source
IIP 1.8. Clean Water and Sanitation Services
Number of people in target areas with access to improved drinking water supply as a result of USG assistance
Outcome 2.d.(2)
Number of people benefiting from the community based solid waste systems developed
EG 8.2. Clean Productive Environment
Number of people benefiting from the USG supported community-based solid waste system
SO Indicator
SO-e: Number of people in target areas with improved access to adequate sanitation
Outcome 2.e.(2)
Number of people benefiting from small scale sanitation system
IIP 1.8. Clean Water and Sanitation Services
Number of people in target areas with access to improved sanitation facilities as a result of USG assistance
Outcome 0.b.(1)
Number of campaign activities supported by ESP
SO and SpO Indicator
IR 1.1: Number of national, provincial or district-led advocacy initiatives in support of improved basic human services/ maintained healthy ecosystems
Outcome 0.b.(2)
Number of campaign supported led by ESP’s partners/ stakeholders
N/A
SpO Indicator
IR 1.4: Number of watershed management plans implemented by stakeholders
Outcome 1.g. Number of Water Resource Protection Plans with Zonation Systems designed and under implementation
N/A
ENVIRONMENTAL SERVICES PROGRAM WWW.ESP.OR.ID 3
Performance Monitoring Plan (PMP) Eastern Indonesia Water and Sanitation Program
IR 2.2: Number of districts with plans and budgets to improve service delivery
Outcome 2.c. Number of sanitation strategies with action plans developed and ready to be submitted for funding by (Local and Central) Government, donor and/or other financing possibilities
N/A
SO indicator
IR 2.5: Number of PDAMs with improved service delivery
Outcome 2.a. Number of PDAMs providing better services, indicated by the increasing of 20% of PDAM performance index
N/A
SO and SpO Indicators
IR 2.6: Number of DCAs and PPPs established to expand service delivery
Outcome 3.c. Number of financing plans developed n cooperation with PDAMs or local governments to access commercial financing through DCA or other means
IIP 1.8. Clean Water and Sanitation Services
Amount of private financing mobilized with a DCA guarantee
Outcome 2.d.(1)
Number of community-based solid waste systems developed and implemented
EG 8.2. Clean Productive Environment
Number of community-based solid waste management system developed and implemented as a result of USG assistance
SO indicator
IR 2.7: Number of small-scale sanitation plans and community based solid waste systems
Outcome 2.e.(1)
Number of small scale sanitation systems (SSSS) developed and implemented
N/A
SpO indicator
IR 3.5: Number of communities in critical watersheds that have adopted environmental management practices
Outcome 1.f. Number of community groups implementing activities to improve natural resource management
EG 8.1. Natural Resources and Biodiversity
a) Number of people with increased economic benefits derived from sustainable natural resource management and conservation as a results of USG assistance
Performance Monitoring Plan (PMP) Eastern Indonesia Water and Sanitation Program
household connections as a results of micro-credit programs
IIP 1.8. Clean Water and Sanitation Services
Amount of private financing mobilized with a DCA guarantee
Performance Monitoring Plan (PMP) Eastern Indonesia Water and Sanitation Program
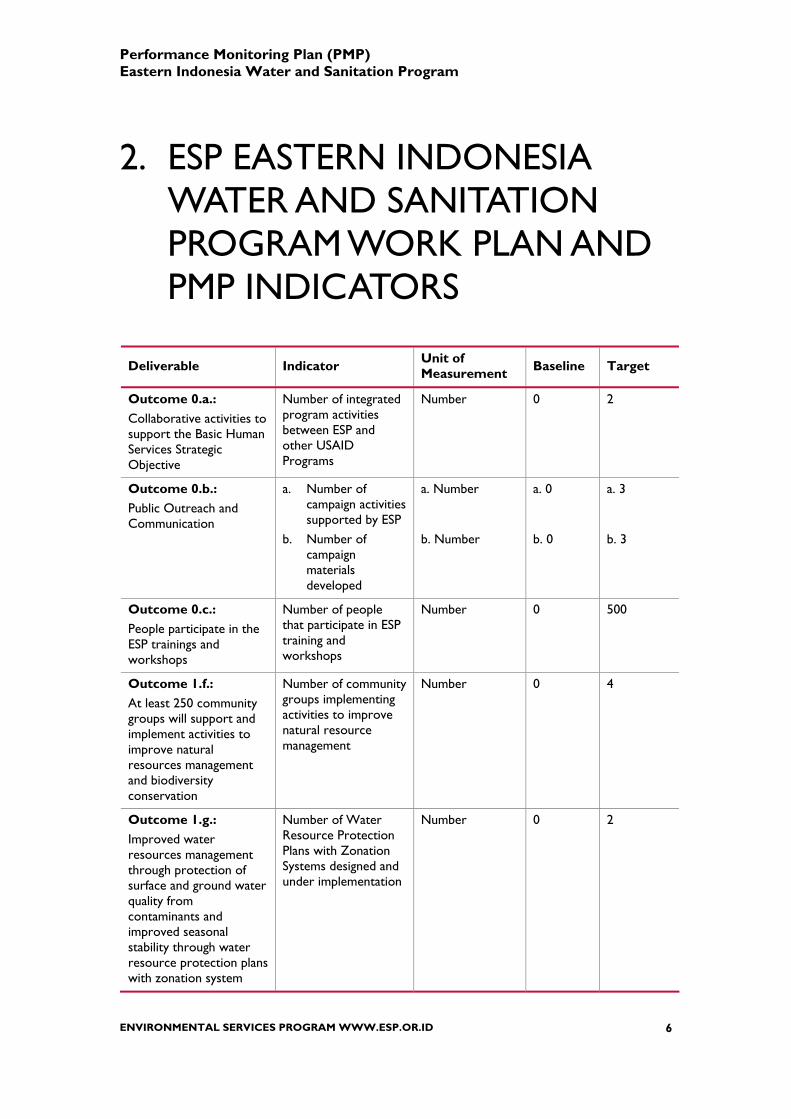
2. ESP EASTERN INDONESIA WATER AND SANITATION PROGRAM WORK PLAN AND PMP INDICATORS
Deliverable Indicator Unit of Measurement Baseline Target
Outcome 0.a.: Collaborative activities to support the Basic Human Services Strategic Objective
Number of integrated program activities between ESP and other USAID Programs
Number 0 2
Outcome 0.b.: Public Outreach and Communication
a. Number of campaign activities supported by ESP
b. Number of campaign materials developed
a. Number b. Number
a. 0 b. 0
a. 3 b. 3
Outcome 0.c.: People participate in the ESP trainings and workshops
Number of people that participate in ESP training and workshops
Number 0 500
Outcome 1.f.: At least 250 community groups will support and implement activities to improve natural resources management and biodiversity conservation
Number of community groups implementing activities to improve natural resource management
Number 0 4
Outcome 1.g.: Improved water resources management through protection of surface and ground water quality from contaminants and improved seasonal stability through water resource protection plans with zonation system
Number of Water Resource Protection Plans with Zonation Systems designed and under implementation
Number 0 2
ENVIRONMENTAL SERVICES PROGRAM WWW.ESP.OR.ID 6
Performance Monitoring Plan (PMP) Eastern Indonesia Water and Sanitation Program
Deliverable Indicator Unit of Measurement Baseline Target
Outcome 2.a.: At least 33 PDAMs demonstrates 20% progress on a PDAM performance monitoring index that reflects technical, financial and managerial performance
Number of PDAMs indicated by the increasing of 20% of PDAM performance index
Number 0 3 (2 are PDAMs and 1 PT Air Menado)
Outcome 2.b.: Population with access to clean water is increased by 20% in ESP geographic areas except for Aceh. In the tsunami impacted areas of Aceh, population with access to clean water is doubled
Percent and number of household that benefit from an improved water source
Percentage and Number
0 HH
3,300 HH
Outcome 2.c.: At least 5 district/municipal sanitation strategies with action plans including but not limited to centralized systems are developed in conjunction with local governments as catalyst for funding
Number of sanitation strategies with action plans developed and ready to be submitted for funding by (Local and Central) Government, donor and/or other financing possibilities
Number 0 3
Outcome 2.d.: At least 15 community-based solid waste management plans are developed and implemented. Of these, a minimum of 5 community plans for restored and new facilities will be developed and implemented for return communities in Aceh
a. Number of community-based solid waste systems developed and implemented
b. Number of people benefiting from the community based solid waste systems developed
a. Number
b. Number
a. 0
b. 0
a. 2
b. 300
Outcome 2.e.: At least 25 community-based small scale sanitation plans are developed and implemented. Of these, a minimum of 5 community plans for restored and new facilities will be developed and implemented for return communities in Aceh
a. Number of small scale sanitation systems (SSSS) developed and implemented
b. Number of people benefiting from small scale sanitation system
a. Number
b. Number
a. 0
b. 0
a. 3
b. 300
ENVIRONMENTAL SERVICES PROGRAM WWW.ESP.OR.ID 7
Performance Monitoring Plan (PMP) Eastern Indonesia Water and Sanitation Program
Deliverable Indicator Unit of Measurement Baseline Target
Outcome 2.f.: The precursors needed to impact childhood diarrhea (clean water, sanitation, and behavior change) are contributed to the BHS effort to reduce in the incidence of childhood diarrhea and mortality
a. Number of school that adopted CGH concept
b. Number of people trained in effective hand washing with soap
a. Number
b. Number
a. 0
b. 0
a. 2
b. 2,500
Outcome 3.a.: At least 30 PDAMs individually demonstrate an improved operating ratio and those in default of old SLA and RDA debts are assisted in the preparation and submission of proposals to restructure outstanding debt
a. The number of PDAMs that were in default of SLA and RDA debts and are assisted in the preparation and submission of proposals to restructure outstanding debt
a. Number
a. 0
a. 1
Outcome 3.c.: At least 10 PDAMs or local governments are assisted in the development of plans to access commercial financing through DCA or other means
Number of financing plans developed n cooperation with PDAMs or local governments to access commercial financing through DCA or other means
Number 0 2
Outcome 3.e.: At least 12 micro-credit program are established with PDAMs and local banks, resulting in the connection of at least 100,000 low-income persons to the water supply network
a. The number of microcredit programs established with PDAMs and local banks, including a signed master agreement, staff training, and promotional plan.
b. The number of new household connections as a results of micro-credit programs
a. Number
b. Number
a. 0
b. 0
a. 1
b. 1,000
ENVIRONMENTAL SERVICES PROGRAM WWW.ESP.OR.ID 8
Performance Monitoring Plan (PMP) Eastern Indonesia Water and Sanitation Program
3. PERFORMANCE MONITORING SYSTEM
A Performance Monitoring System is necessary to collect and present data and results for program indicators in a timely and reliable manner. Depending on the indicator, the ESP Eastern Indonesia Water and Sanitation Performance Monitoring System has four components:
Each of these four components is described in greater detail below.
3.1. PROGRAM IMPACT EVALUATION ESP monitors program impact with two main tools, the ESP Human Interest Story of the beneficiaries of the program for qualitative impact. The stories will be provided by the direct beneficiaries of the program from three cities focusing on the testimony of the direct program impact to people’s livelihood. Beneficiaries include people from target communities, local, provincial and central government, local NGO’s and water utilities. The stories will be written between September 2009 and February 2010.
3.2. QUALITY ASSURANCE This PMP document provides for regular and timely data collection of program achievements through the specific intake forms. The result of data collection shows quantitative progress with qualitative notes for main program achievements based on the targeted outcomes. This progress is included in regular ESP reports including Quarterly and Annual Progress Reports. The PMP intake forms are posted in the ESP TAMIS (Technical and Administrative Management Information System). This system is an integrated system not only for the monitoring system but also as an effective for management tools. The data entry is collected by all regional specialists per reporting period. The ESP M&E Specialist compiles, analyzes and presents data for each outcome every reporting period. As part of a quality assurance mechanism, ESP M&E Specialist communicates with the technical and regional advisors to review the results of the analysis prior to posting in the ESP reports. Other activities to support quality assurance include regular field visits and report reviews to ground-truth the accuracy of PMP quantitative and qualitative information. Field visits are
ENVIRONMENTAL SERVICES PROGRAM WWW.ESP.OR.ID 9
Performance Monitoring Plan (PMP) Eastern Indonesia Water and Sanitation Program
conducted to look at general activities per component as well as per integrated activity. The ESP M&E Specialist collaborates with each regional team to discuss how the activities support the achievement of the targeted outcomes. Quality assurance is also implemented through reviewing activity reports and other documents.
3.3. ACTIVITY MONITORING ESP Monitoring activities are targeted to support two types of information collection and reporting: quantitative and qualitative. Quantitative data is presented as part of the regular ESP quarterly and annual reporting processes. These quantitative reports are developed in accordance with outcomes and deliverables defined in the ESP contract. Besides the quantitative report, the M&E team will also report on the qualitative achievement of the program through the implementation of ESP Longitudinal Studies. Quantitative monitoring is focused on the presentation of the achievement of ESP outcome and deliverable on a quarterly and annual basis, as per the performance sheets in this PMP. To produce the reports, a regular data collection and review process is implemented. The method of the data collection used includes: 1) Review of reports received; 2) Data exploration through TAMIS; 3) Interviews; and 4) Field observations. The data collected is analyzed based on the methods stated in the performance indicator reference sheets. Qualitative monitoring focuses on the presentation of program impact in specific locations at the end of the program period. Through the human interest stories, Longitudinal Studies will communicate ESP successes through a journalistic approach, personalizing the impact of the quantitative data as well as demonstrating the integration among the components in the specific locations. The report of the qualitative monitoring is prepared in separate report of the quantitative monitoring report.
3.4. INPUT MONITORING (THROUGH TAMIS)
The tracking of program inputs is managed through ESP’s TAMIS (Technical and Administrative Management Information System). This keeps track of each output achieved of all program activities at program, provincial and component levels. The type of outputs kept in ESP’s TAMIS include field-based achievements, meetings, publications, events (training, workshop, study tour, etc.), maps and other outputs. This includes such details as number and type of participants. Reports from TAMIS are generated regularly and are reviewed quarterly. The information collected from the ESP’s TAMIS is included in ESP’s reporting to USAID.
ENVIRONMENTAL SERVICES PROGRAM WWW.ESP.OR.ID 10
Performance Monitoring Plan (PMP) Eastern Indonesia Water and Sanitation Program
4. PERFORMANCE INDICATOR REFERENCE SHEET OF BASIC HUMAN SERVICE STRATEGIC OBJECTIVE (BHS SO)
The Basic Human Services program focuses on the interdependence of human health and the environment. The program will increase access and utilization of key health and environmental services at the district level. Activities include: health and hygiene for vulnerable women and children; better nutrition; access to safe water and sanitation; sustainable management of natural resources and biodiversity conservation; family planning and reproductive health systems; infectious disease reduction, including tuberculosis (TB); HIV/AIDS prevention among at-risk populations; and polio and avian influenza (AI) surveillance and other prevention/eradication efforts. All family planning assistance agreements incorporate clauses that implement the President's directive restoring the Mexico City policy. In the “Safe Water and Environmental Services Programs”, USAID supports better health through improved water resource management and expanded access to clean water and sanitation services. With a ‘ridges to reef’ approach, partners improve water resource management from watershed sources along rivers and through cities to coastal reefs. In the upper watershed, the program promotes forest management, biodiversity conservation and land use planning to protect a steady, year-round source of clean water. Further downstream, the program strengthens municipal water utilities to improve and expand piped water and sanitation services to communities. Stakeholder forums link upstream and downstream communities to build consensus on water and waste management issues. Marginalized urban communities also benefit from the introduction of safe drinking water through Air Rahmat, a home chlorination product introduced to the market through a public-private partnership.
ENVIRONMENTAL SERVICES PROGRAM WWW.ESP.OR.ID 11
Performance Monitoring Plan (PMP) Eastern Indonesia Water and Sanitation Program
Performance Indicator Reference Sheet
BHS SO: Period Prevalence of Diarrhea Strategic Objective: Higher Quality Basic Human Services Utilized. Intermediate Result: - Indicator: Proportion of children aged under three years old who had diarrhea at any time in the two-week period prior to the survey.
DESCRIPTION Precise Definition(s): “Diarrhea” is commonly defined as three or more loose or watery stools in a 24-hour period, a loose stool being one that would take the shape of the container. Diarrhea that is of 14 or more days in duration is defined as “persistent diarrhea”. This indicator measures the prevalence of diarrhea among children under age three years and gives some indication of the importance of diarrhea as a public health problem. Diarrhea is one of the principal causes of morbidity and mortality among children in developing countries, accounting for about one fifth of all deaths of children under age three years (Kosek, Bern, and Guerrant, 2003). Diarrhea-related deaths are most commonly caused by dehydration produced by acute watery diarrhea and acute dehydration. Death can also be caused by infection, particularly in children who have persistent diarrhea (of 14 or more days in duration) and malnutrition, in those who have other infections at the same time (such as pneumonia), or in those who have bloody diarrhea. Unit of Measure: household. Disaggregated by: SES and age group.
PLAN FOR DATA ACQUISITION BY USAID Data Source(s): Household survey questionnaire and ESP Mini Baseline/Ten Minute Monitoring. Data Collection Method: Household survey results from ESP intervention districts. Method of Acquisition: Survey conducted by survey research organization. Frequency/Timing of Data Acquisition: Baseline and regular follow up survey
DATA QUALITY ISSUES Known Data Limitations and Significance (if any): The indicator is useful for evaluating the effectiveness of specific public health interventions aimed at reducing the frequency of childhood diarrheal disease. It is simple to calculate and can be used to examine trends in diarrheal disease over time. Because diarrheal disease prevalence is influenced by season, surveys must occur in the same season if the data are to be comparable over time. While it is extremely useful for measuring the importance of diarrhea as a public health problem, the indicator is a reflection of both old and new cases of diarrhea in the population. It does not give any indication of how long the diarrhea has lasted and excludes children who may have died with symptoms of diarrhea.
PLAN FOR DATA ANALYSIS, REVIEW, & REPORTING Data Analysis: Number of children aged 0-35 months who had diarrhea at any time in the two-week period prior to the survey ___________________________________________________________________________________________ x 100 Number of children aged 0-35 months surveyed Presentation of Data: Diarrhea prevalence among children under three years old for boys and girls Review of Data: M&E Specialist and Health Communication Coordinator Reporting of Data: Baseline survey report and follow up survey report
OTHER NOTES
Notes on Baselines/Targets: relative reduction in prevalence in intervention areas
PERFORMANCE INDICATOR VALUES Output Target Baseline Result Data Program Year
FY05 FY06 FY07 FY08 FY09 FY10 Total Target N/A N/A 26% 22% 18% 18% 18% Percentage of
diarrhea incidence is decreased
28% Actual
THIS SHEET LAST UPDATED ON: 6/4/09
ENVIRONMENTAL SERVICES PROGRAM WWW.ESP.OR.ID 12
Performance Monitoring Plan (PMP) Eastern Indonesia Water and Sanitation Program
5. PERFORMANCE INDICATOR REFERENCE SHEET OF EASTERN INDONESIA WATER AND SANITATION PROGRAM
Since 2005, ESP has been providing Technical Support to select local governments, local water utilities (PDAMs) and local communities in all HPPs to facilitate access to an improved water supply. Achieving this goal requires raw water protection activities, the introduction of a range of sanitation improvements, solid waste management, and behavior change programs, mainly in urban areas. The Dutch Government has had a long history of providing Technical and Financial assistance to cities in Eastern Indonesia (North Sulawesi, Maluku and Papua) to increase access to improved water supply services. This is particularly apparent now as there is currently a promotion of Public-Public Partnerships between a Dutch Water Utility WMD (Water Maatschappij Drenthe) and interested Local Governments/PDAMs. In addition, the Dutch Government has a contract with UNICEF to work in rural and urban areas in several provinces in Eastern Indonesia. Realizing the potential and added value of introducing ESP’s well-respected program to the same areas, the Dutch Embassy in Jakarta approached USAID Jakarta to develop a formal collaboration in Eastern Indonesia, under the Potomac Agreement. This agreement encourages bilateral donors from seven European countries (Norway, Sweden, Denmark, Finland, Ireland, United Kingdom) and the USA to increase donor efficiency through the direct support of one another’s development programs. The main focus of the ESP Eastern Indonesian expansion program as follow: − Support the three Water Utilities (PDAM Ambon, PDAM Jayapura and PT Air Manado)
in increasing access to piped water supplies in their target areas, including model raw water protection plans; and
− To work with all three Local Governments to develop citywide sanitation strategies and action plans (covering waste water, solid waste and drainage), including the development of several Community-Based sanitation and Solid Waste Management systems.
The outcomes and deliverables of the project in Eastern Indonesia are supporting several existing ESP outcomes and deliverables. Based on this point, the detailed performance indicator reference sheets of these outcomes are follow the existing performance indicator reference sheets stated above respectively. To anticipate the specific requirements of program monitoring and evaluation for the Eastern Indonesia Water and Sanitation Program, a separate document, only for Performance Monitoring Plan (PMP) of the program, is prepared separately.
ENVIRONMENTAL SERVICES PROGRAM WWW.ESP.OR.ID 13
Performance Monitoring Plan (PMP) Eastern Indonesia Water and Sanitation Program
Performance Indicator Reference Sheet PM Deliverable 0.a.: Collaborative Program between ESP and Other USAID Partners
Strategic Objective: Higher Quality Basic Human Services Utilized Intermediate Result: Government, communities and the private sector mobilized to advocate for higher quality basic human service Deliverable: Collaborative Program to Support the Strategic Objective of Basic Human Services Indicator: Number of integration program between ESP and other USAID Programs
DESCRIPTION
Precise Definition(s): The integration program activities are conducted by collaboration between ESP and other USAID partners who have the same working area. The collaborative program activities is aimed to achieve higher impact of USAID’s Special Objective especially Basic Human Service (BHS). The working area is determined by geographic or issues. The USAID partners involve in the integration program will not only under BHS Strategic Objective but it may include other USAID’s strategic Objectives. The contribution of ESP and other USAID partners in the collaborative program will be in different form one to another such as financial (cost sharing) and other project resources (in-kind contribution: human and materials resources) Unit of Measure: Number of integration program Disaggregated by: Province and program level (national and regional level)
PLAN FOR DATA ACQUISITION BY USAID
Data Source(s): Reports on integration program activities from ESP and other USAID programs and TAMIS entries Data Collection Method: Review of reports as received and TAMIS entries Method of Acquisition: Monitoring and Evaluation Specialist responsible for data collection through TAMIS Frequency/Timing of Data Acquisition: Quarterly and annually data analysis of TAMIS entries
DATA QUALITY ISSUES
Known Data Limitations and Significance (if any): The performance monitoring will measure the number of integrated program by ESP and other USAID partners. It will not measure the level of impact of the “integration”, even thought this kind of program is targeted to achieve higher impact of USAID’s Special Objective. The level of impact of the “integration” may prepare in the separate report.
PLAN FOR DATA ANALYSIS, REVIEW, & REPORTING
Data Analysis: Simple counting of total integrated activities conducted by ESP and other USAID Partners Presentation of Data: Quantitative with additional qualitative information Review of Data: COP, DCOP, technical and regional advisors Reporting of Data: ESP quarterly and annual report to USAID
OTHER NOTES
Notes on Baselines/Targets: For the East-Indonesia program, ESP will collaborate with the USAID funded, Safe Water System (SWS) program in Ambon and Jayapura and possibly also in Manado. ESP team will also collaborate closely with the Urban Slum improvement program by CARE (Jayapura) and Mercy Corps (Ambon). This reporting will be accompanied by a narrative report on the implementation of the integrated activities conducted by ESP and other USAID and non-USAID partners.
PERFORMANCE INDICATOR VALUES Program Year
Output Target Baseline Result Data
FY05 FY06 FY07 FY08 FY09 FY10 Total Target
N/A N/A N/A N/A 2 0 2 Joint program of integration conducted by ESP and other USAID partners
0 Actual
THIS SHEET LAST UPDATED ON: 6/4/09
ENVIRONMENTAL SERVICES PROGRAM WWW.ESP.OR.ID 14
Performance Monitoring Plan (PMP) Eastern Indonesia Water and Sanitation Program
BHS/MHE – IR 1.1
Performance Indicator Reference Sheet PM Deliverable 0.b.: Public Outreach and Communication
Strategic Objective: Higher Quality Basic Human Services Utilized Intermediate Result: Government, communities and the private sector mobilized to advocate for higher quality basic human service Deliverable: Public Outreach and Communication Indicator1: 1. Number of campaign supported by ESP 2. Number of campaign supported by ESP partners/stakeholders
DESCRIPTION
Precise Definition(s): The campaigns mentioned in first indicator led by ESP Team through multi media campaigns and other campaign approaches. Some campaigns will integrate the issues on environmental and hygiene improvement. The campaign will be conducted in different type of activities such as media relation activities (media visit, media gathering, press conference, etc.), advocacy events (meeting, seminar, exhibition, etc.), and media campaign (talk show and Public Service Advertisement in TV and radio; and articles and news in print media).
The campaign supported led by the ESP partners/stakeholders (indicator 2) will be implemented by different type of ESP partners such as NGOs, Local Government, media, private sector and community groups.
Unit of Measure: 1) Number of campaign; 2) Number of campaign Disaggregated by: 1) each province; 2) each province
PLAN FOR DATA ACQUISITION BY USAID
Data Source(s): Campaign reports by ESP and its partners; and TAMIS entries on campaign activities Data Collection Method: Review of reports as received and TAMIS entries Method of Acquisition: M&E Specialist and POC Coordinator responsible for data collection through TAMIS Frequency/Timing of Data Acquisition: Quarterly and annually data analysis of TAMIS entries
DATA QUALITY ISSUES
Known Data Limitations and Significance (if any): One campaign may take one topic that will be conducted through several activities in a certain period. It will be possible to be overlap with other activities. In this case, the counting of the results of this indicator will be focus only the activities related to the advocacy activities.
PLAN FOR DATA ANALYSIS, REVIEW, & REPORTING
Data Analysis: Simple counting of campaign activities conducted Presentation of Data: Quantitative with additional qualitative information Review of Data: Initial review done by POC coordinator then final review by COP/DCOP Reporting of Data: ESP quarterly and annual reports to USAID
OTHER NOTES
Notes on Baselines/Targets: The campaign and publication activities will produce simple publication and campaign activities focusing on promoting the ESP Hygiene Behavior Change and STBM program activities. This reporting will be accompanied by a narrative report on the implementation of advocacy activities in each region.
PERFORMANCE INDICATOR VALUES Program Year
Output Target Baseline Result Data
FY05 FY06 FY07 FY08 FY09 FY10 Total
Target N/A N/A N/A N/A 1) 3 2) 3
1) 0 2) 0
1) 3 2) 3
1) campaign activities conducted by ESP 2) campaign activities conducted by ESP partners
0
Actual
THIS SHEET LAST UPDATED ON: 6/4/09
1 Only first and second indicator will contribute to BHS/MHE IR 1.1
ENVIRONMENTAL SERVICES PROGRAM WWW.ESP.OR.ID 15
Performance Monitoring Plan (PMP) Eastern Indonesia Water and Sanitation Program
Performance Indicator Reference Sheet PM Deliverable 0.c.: People Participate in ESP Training/Workshop
Strategic Objective: Higher Quality Basic Human Services Utilized Intermediate Result: Government, communities and the private sector mobilized to advocate for higher quality basic human service Deliverable: People Participation in the ESP Training and Workshop Indicator: Number of people participate in ESP trainings and workshops;
DESCRIPTION
Precise Definition(s): The “people” mentioned in this indicator 1 consist of community people, government officers from different levels, private sectors officers, donor agency staff, ESP staff, etc who are participated in the ESP training and workshop activities. The training and workshops activities will be conducted at different levels such as national and local levels. Several topics of training and workshop include ESP related general issues, technical which is related to ESP components, advocacy and Behavior Change and Communication, etc. Unit of Measure: Number of people Disaggregated by: Gender (male and female) and each province
PLAN FOR DATA ACQUISITION BY USAID
Data Source(s): TAMIS entries Data Collection Method: Review of TAMIS entries Method of Acquisition: M&E Specialist responsible for data collection through TAMIS Frequency/Timing of Data Acquisition: Quarterly and annually data analysis of TAMIS entries
DATA QUALITY ISSUES
Known Data Limitations and Significance (if any): To measure the people participated in the ESP trainings and workshops will only consider to the number of the people. It will not measure the designation of the people. The total number of the people is only differentiated by the gender (male and female).
PLAN FOR DATA ANALYSIS, REVIEW, & REPORTING
Data Analysis: Simple counting of total people participated in ESP trainings and workshops, percentage of women participation Presentation of Data: Quantitative with additional qualitative information Review of Data: Initial review by M&E Specialist and final review by COP and DCOP Reporting of Data: ESP quarterly and annual report to USAID
OTHER NOTES
Notes on Baselines/Targets: People trained from ESP sites in several topics. This reporting will be accompanied by a narrative report on the implementation of the training and workshop programs in each ESP location
PERFORMANCE INDICATOR VALUES
Program Year Output Target Baseline Result Data
FY05 FY06 FY07 FY08 FY09 FY10 Total
Target N/A N/A N/A N/A 400 100 500 Number of people trained
0 Actual
THIS SHEET LAST UPDATED ON: 6/4/09
ENVIRONMENTAL SERVICES PROGRAM WWW.ESP.OR.ID 16
Performance Monitoring Plan (PMP) Eastern Indonesia Water and Sanitation Program
MHE IR 3.5 OP – EG 8.1
Performance Indicator Reference Sheet Outcome 1.f. Community Groups Supporting Improved NRM
Strategic Objective: Higher Quality Basic Human Services Utilized Intermediate Result: Improved practices and behaviors adopted at the community and household levels Outcome: At least 250 community groups support and implement activities to improve natural resources management and biodiversity conservation Indicator: Number of community groups implementing activities to improve natural resource management and/or biodiversity conservation
DESCRIPTION
Precise Definition(s): Community groups involved in the implementation of activities toward improving natural resource management and/or biodiversity conservation are the communities that live in the selected WSM area where ESP implements activities. Community groups consist of 20-30 people from a sub-village or village in ESP area. The activities of the community groups include participatory planning, agroforestry, land rehabilitation, rural community-based water and sanitation management, and conservation/protected areas management. It also includes the strengthening of inter-community networks, support for advocacy on local policy that relates to natural resource management, and also establishment of public private partnerships Unit of Measure: Community groups Disaggregated by: Each province HPP
PLAN FOR DATA ACQUISITION BY USAID
Data Source(s): TAMIS entries on the activities by community group and report by regional teams Data Collection Method: Review of TAMIS entries and reports as received Method of Acquisition: Monitoring and Evaluation Specialist responsible for data collection through TAMIS Frequency/Timing of Data Acquisition: Quarterly and annual data analysis of TAMIS entries
DATA QUALITY ISSUES
Known Data Limitations and Significance (if any): The capacity building activities by the community groups may differ from one WSM area to another due to local conditionality. The performance monitoring will only measure on community groups that conduct capacity building activities in all selected WSM areas without differentiating the activities themselves
PLAN FOR DATA ANALYSIS, REVIEW, & REPORTING
Data Analysis: Simple counting of community groups conduct activities to improve NRM and biodiversity conservation Presentation of Data: Quantitative with additional qualitative information Review of Data: Initial review by M&E Specialist and final review by WSM advisor, including field-based ground truthing Reporting of Data: ESP Quarterly and Annual reports to USAID
OTHER NOTES Notes on Baselines/Targets: The capacity building activities by community groups will focus on assessing the main problems related to water conservation management, and increasing understanding of community groups toward this. A strong understanding contributes to the development of sustainable improved natural water conservation management by these community groups.
PERFORMANCE INDICATOR VALUES Program Year
Output Target Baseline Result Data FY05 FY06 FY07 FY08 FY09 FY10 Total
Target (cumulative)2
N/A N/A N/A N/A 4 4 4 Community groups implement activities on improved natural resource management
0 Actual
THIS SHEET LAST UPDATED ON: 6/4/09
2 This result is counted cumulatively because this result indicates a process where the achievement of each step is
continuing
ENVIRONMENTAL SERVICES PROGRAM WWW.ESP.OR.ID 17
Performance Monitoring Plan (PMP) Eastern Indonesia Water and Sanitation Program
MHE IR 1.4
Performance Indicator Reference Sheet
WS Outcome 1.g. – Improved Water Resources Management through Protection of Surface and Ground Water Quality
Strategic Objective: Higher Quality Basic Human Services Utilized Intermediate Result: Government, communities and the private sector mobilized to advocate for higher quality basic human services Outcome: Improved water resources management through protection of surface and ground water quality from contaminants and improved seasonal stability through water resource protection plans with zonation system Indicator Number of Water Resource Protection Plans with Zonation Systems designed and under implementation
DESCRIPTION Precise Definition(s): Water resource protection plans will be developed thorugh two main activities such as 1) development of the zonation system of one or more springs in the selected sub-watershed areas; and 2) the development of the action plans to protect the springs. In some ESP locations, there maybe a potential surface and ground water sources used by the municipal water utilities or directly managed by other local authority are located in the same location of ESP watershed area. To improve the sustainability efforts for providing water supply for people live in the rural area, a sustainable efforts need to be conducted in this areas. The action plans developed need to be endorsed by the local government and/or the municpal water utilities or other local authority. In the implementation of the water resource protection plans should also require a participatio of the local community.
Unit of Measure: water resource protection plan Disaggregated by: Each province
PLAN FOR DATA ACQUISITION BY USAID Data Source(s): TAMIS entries on the progress of development of water resource protection plans and report by regional teams; copies of completed plans Data Collection Method: Review of TAMIS entries and reports as received Method of Acquisition: Monitoring and Evaluation Specialist responsible for data collection through TAMIS Frequency/Timing of Data Acquisition: Semi-annual and annual data analysis of TAMIS entries
DATA QUALITY ISSUES Known Data Limitations and Significance (if any): Available funding for the implementation of water resource protection plan is a necessary prerequisite, but it does not reflect whether these plans are implemented effectively or what result these WSM plans achieve. This will require separate assessment
PLAN FOR DATA ANALYSIS, REVIEW, & REPORTING Data Analysis: Counting of percentage of the achievement of each step of development of water resource protection plans Presentation of Data: Quantitative with additional qualitative information Review of Data: Initial review by M&E Specialist and final review by WSM advisor, including field-based ground-truthing Reporting of Data: ESP Semi-annual and Annual report to USAID
OTHER NOTES Notes on Baselines/Targets: The selection of potential springs that will be protected will be part of existing watershed areas selected in the previous year. This program may become the follow up program of previous management plans but should specificly addressing more focus on the protectio of the water resources. This reporting is accompanied by a qualitative description of each stage of development of fund for WSM plans.
PERFORMANCE INDICATOR VALUES Program Year
Output Target Baseline Result Data
FY05 FY06 FY07 FY08 FY09 FY10 Total Target (cumulative)3
N/A N/A N/A N/A 2 2 2 Water resource protection plans developed and implemented
0 Actual
THIS SHEET LAST UPDATED ON: 6/4/09
3 This result is counted cumulatively because this result indicates a process where the achievement of each step is
continuing
ENVIRONMENTAL SERVICES PROGRAM WWW.ESP.OR.ID 18
Performance Monitoring Plan (PMP) Eastern Indonesia Water and Sanitation Program
Strategic Objective: Higher Quality Basic Human Services Utilized Intermediate Result: Basic Human Services delivered effectively at the local level Outcomes: At least 33 PDAMs demonstrates 20% progress on a PDAM performance monitoring index that reflects technical, financial and managerial performance Indicator: Number of PDAMs indicated by the increasing of 20% of PDAM performance index
DESCRIPTION Precise Definition(s): Improvement of PDAM technical operational and financial management performance is measured through a “PDAM performance index“ which considers several key performance topics: 1. Corporate plan 2. Non Revenue Water (NRW) reduction 3. Tariff 4. Customer relationship 5. Human Resource Development policies/programs 6. PDAMs staff training 7. Operational Cost efficiency 8. PDAM Benchmarking program 9. Water quality program 10. GIS/MIS For each of these topics detailed criteria have been identified and weighted. Total maximum score is 100%. In addition to this qualitative assessment ESP regional staff will regularly collect quantitative information with regard increase in revenue and connections for all participating PDAMs. Unit of Measure: PDAM Disaggregated by: each province
PLAN FOR DATA ACQUISITION BY ESP Data Source(s): TAMIS entries on the PDAM performance index based on data of PDAM semi annual and annual report Data Collection Method: Review of TAMIS entries and reports as received Method of Acquisition: Monitoring and Evaluation Specialist and National Watsan Specialist responsible for data collection through TAMIS Frequency/Timing of Data Acquisition: Semi-annually and annually data analysis of TAMIS entries
DATA QUALITY ISSUES Known Data Limitations and Significance (if any): There is no existing index. A complete set of PDAM index has been developed by ESP Team, based on PDAM assessment (baseline) conducted in Project Year 1. Baseline data collection was done around the same time.
PLAN FOR DATA ANALYSIS, REVIEW, & REPORTING Data Analysis: Progress on the individual PDAM performance index Presentation of Data: Qualitative with additional quantitative information Review of Data: Initial review by M&E Specialist and final review by Environmental Services (SD) Advisor Reporting of Data: ESP Semi Annual and Annual report to USAID
OTHER NOTES Notes on Baselines/Targets: Firstly a PDAM baseline assessment is conducted to identify condition of existing services and key criteria to determine PDAM performance index. Because this is only 1.5 year program there is target for 20% increase, but regular measuring of DPAM performance index is used to show progress in PDAM performance improvement. This reporting is accompanied by a quantitative description of achievement based on index as mentioned in definition section. Main focus for this indicator is on PDAM Ambon and Jayapura, since Water supply is under PT in Manado.
BHS/MHE IR 2.5
ENVIRONMENTAL SERVICES PROGRAM WWW.ESP.OR.ID 19
Performance Monitoring Plan (PMP) Eastern Indonesia Water and Sanitation Program
PDAMs show increasing of 20% PDAM performance index
0 Actual
THIS SHEET LAST UPDATED ON: 6/4/09
4 This result is counted cumulatively because this result indicates a process where the achievement of each step is
continuing
ENVIRONMENTAL SERVICES PROGRAM WWW.ESP.OR.ID 20
Performance Monitoring Plan (PMP) Eastern Indonesia Water and Sanitation Program
OP – IIP 1.8 BHS SO-c
Performance Indicator Reference Sheet SD Outcome 2.b. – Access to Clean Water
Strategic Objective: Higher Quality Basic Human Services Utilized Intermediate Result: Basic Human Services delivered effectively at the local level Outcomes: Population with access to clean water is increased by 20% in ESP geographic areas except for Aceh. In the tsunami impacted areas of Aceh, population with access to clean water is doubled Indicator: Percent and number of household that benefit from an improved water source
DESCRIPTION
Precise Definition(s): Clean water is water that only requires boiling to become safe as defined by Ministry of Health, Republic of Indonesia. In accordance with International practice, clean water will be measured as the use of improved water source, mainly through PDAM connection to the individual household consumers or public water facilities and non-PDAM water sources. For this project, non-PDAM water source will include the following categories: • Improved access through community based water supply., • Improvement of unprotected dug well or boreholes to become improved water source. For non-PDAM water source, the percentage of increase access to clean water is applicable only to ESP sites and does not apply to total household population in that area. The above assumption is also applied for Aceh, both for area of three PDAMs, included in ESP program, as well as locations with non-PDAM (community based) water supply programs. Unit of Measure: number of PDAM and non-PDAM connection Disaggregated by: each province
PLAN FOR DATA ACQUISITION BY ESP Data Source(s): TAMIS entries on PDAM connection based on data of PDAM semi annual and annual report and non PDAM water supply Data Collection Method: Review of TAMIS entries and reports as received Method of Acquisition: Monitoring and Evaluation Specialist and National Watsan Specialist responsible for data collection through TAMIS Frequency/Timing of Data Acquisition: Semi-annually and annually data analysis of TAMIS entries
DATA QUALITY ISSUES Known Data Limitations and Significance (if any):
PLAN FOR DATA ANALYSIS, REVIEW, & REPORTING Data Analysis: Counting number of households have clean water access through PDAM and non-PDAM connections in ESP sites and counting in percent increased of households access to clean water..in relation to baseline (determined each year) Presentation of Data: Quantitative with additional qualitative information. Review of Data: Initial review by M&E Specialist and final review by Environmental Services (SD) Advisor Reporting of Data: ESP Semi Annual and Annual report to USAID
OTHER NOTES
Notes on Baselines/Targets: The increase in access to clean water for three locations in East-Indonesia is concentrated on introduction of micro-credit in Manado (and possibly Ambon) and investment planning for rehabilitation existing and/or connecting new areas in Ambon and Jayapura.
ENVIRONMENTAL SERVICES PROGRAM WWW.ESP.OR.ID 21
Performance Monitoring Plan (PMP) Eastern Indonesia Water and Sanitation Program
Household in ESP program location has access to improved water sources
1) For PDAM water source (2008): 152,430 connections (will be increased by end of program years);
2) For non-PDAM water source: 0
Actual
THIS SHEET LAST UPDATED ON: 6/4/09
5 This result is counted cumulatively because this result indicates a process where the achievement of each step is
continuing
ENVIRONMENTAL SERVICES PROGRAM WWW.ESP.OR.ID 22
Performance Monitoring Plan (PMP) Eastern Indonesia Water and Sanitation Program
BHS/MHE IR 2.2
Performance Indicator Reference Sheet SD Outcome 2.c. – Development of City-wide Sanitation Strategies with Action Plans
Strategic Objective: Higher Quality Basic Human Services Utilized Intermediate Result: Improved Practices and Behaviors adopted at the community and household level Outcomes: At least 5 district/municipal sanitation strategies with action plans including but not limited to centralized systems are developed in conjunction with local governments as catalyst for funding Indicator: Number of sanitation strategies with action plans developed and ready to be submitted for funding by (Local and Central) Government, donor and/or other financing possibilities
DESCRIPTION
Precise Definition(s): The development of Citywide Sanitation Strategies Plan (CSSP) includes the following index steps: 1) Identification of Potential Locations + Development of CSSP Guidelines 2) Establishing city sanitation working group (POKJA) , including PEMDA budget for operational cost of POKJA 3) Development Geographic Sanitation Mapping Soft Program for target cities 4) TA to facilitate develop CSSP - Phase #1: potential and existing condition, direction and policy sanitation, vision,
mission, target and strategy, including the implementation of Local Stakeholder Workshop #1 to collecting community aspiration and public consultation.
5) TA to facilitate develop CSSP - Phase #2: program strategic and activities, plan schedule, performance indicators and budgeting, and institutional and sector responsibility
6) TA to facilitate develop CSSP - Phase #3: action plan (implementing of CSSP phase 1) and development cost, including Local Stakeholder Workshop #2 to identify local stakeholder commitment on implementation of CSSP
7) National CSSP workshops to promoting CSSP to the Central Government and other donors in Indonesia (looking for national commitments)
Unit of Measure: Number of steps completed for City-wide sanitation strategy with action plans by Local government Disaggregated by: Province
PLAN FOR DATA ACQUISITION BY ESP Data Source(s): TAMIS entries on the progress of development of city-wide sanitation strategies with action plans and report on the process of development the strategies Data Collection Method: Review of TAMIS entries and reports as received Method of Acquisition: Monitoring and Evaluation Specialist responsible for data collection through TAMIS Frequency/Timing of Data Acquisition: Semi-annually and annually data analysis of TAMIS entries
DATA QUALITY ISSUES Known Data Limitations and Significance (if any): The approach for development of city-wide sanitation strategy with action plan will be different from one location to another location, which affects the recording of the process of proposal development as per mentioned in the definition section above.
PLAN FOR DATA ANALYSIS, REVIEW, & REPORTING Data Analysis: Counting of percentage of the achievement of each step of development of city-wide sanitation strategy with action plans Presentation of Data: Quantitative with additional qualitative information. Review of Data: Initial review by M&E Specialist and final review by Municipal Water Services (SD) Advisor Reporting of Data: ESP Semi Annual and Annual report to USAID
OTHER NOTES Notes on Baselines/Targets: The one-half year program is used to assist establishment of Pokja Sanitation in at least 3 locations, followed by assessment of the existing and situation and joined development of city-wide sanitation strategy and action plan.
ENVIRONMENTAL SERVICES PROGRAM WWW.ESP.OR.ID 23
Performance Monitoring Plan (PMP) Eastern Indonesia Water and Sanitation Program
PERFORMANCE INDICATOR VALUES
Program Year Output Target Baseline Result Data
FY05 FY06 FY07 FY08 FY09 FY10 Total Target (cumulative)6 N/A N/A N/A N/A 3 3 3 Locations with
city-wide sanitation developed
0 Actual
THIS SHEET LAST UPDATED ON: 6/4/09
6 This result is counted cumulatively because this result indicates a process where the achievement of each step is
continuing
ENVIRONMENTAL SERVICES PROGRAM WWW.ESP.OR.ID 24
Performance Monitoring Plan (PMP) Eastern Indonesia Water and Sanitation Program
OP – EG 8.2
BHS SO-e BHS IR 2.7
Performance Indicator Reference Sheet SD Outcome 2.d. – Development of Community-based Solid Waste Management Systems
Strategic Objective: Higher Quality Basic Human Services Utilized Intermediate Result: Improved practices and behaviors adopted at the community and household level Outcomes: At least 15 community-based solid waste management plans are developed and implemented. Of these, a minimum of 5 community plans for restored and new facilities will be developed and implemented for return communities in Aceh Indicator7: 1) Number of community-based solid waste systems developed and implemented; 2) Number of people benefiting from the community based solid waste systems developed
DESCRIPTION Precise Definition(s): The development and implementation of SWMS follows the index steps below: 1. Location identified and agreed upon with local stakeholders (government and local communities 2. Solid waste management system plan developed and agreed upon by stakeholders 3. Community roles and responsibilities defined 4. Tariff and fee collection system in place 5. Solid waste collection system implemented 6. Solid waste disposal systems (where possible including recycling) implemented The development of the community-based SWMS includes the system developed by the ESP partners/stakeholders through small grant scheme Unit of Measure: Each system developed + number of people benefitting Disaggregated by: Province
PLAN FOR DATA ACQUISITION BY ESP Data Source(s): TAMIS entries on the progress of development of community-based solid waste management system that include technical report of the activity and secondary data from local authority Data Collection Method: Review of TAMIS entries and reports as received Method of Acquisition: Monitoring and Evaluation Specialist responsible for data collection through TAMIS Frequency/Timing of Data Acquisition: Semi-annually and annually data analysis of TAMIS entries
DATA QUALITY ISSUES Known Data Limitations and Significance (if any): The approach for development of community solid waste system might be different from one location to another location, depend on the existing condition of each solid waste management in each location. It will affect the recording of the process of proposal development as per mentioned in the definition section above.
PLAN FOR DATA ANALYSIS, REVIEW, & REPORTING Data Analysis: Counting of percentage of the achievement of each step of development of community-based solid waste management system developed + counting number of participating/benefiting households Presentation of Data: Quantitative with additional qualitative information. Review of Data: Initial review by M&E Specialist and final review by Environmental Services (SD) Advisor Reporting of Data: ESP Semi Annual and Annual report to USAID
OTHER NOTES Notes on Baselines/Targets: The East Indonesia program will implement own Community Based solid Waste systems in Manado (and possibly Jayapura); in addition ESP Specialists will provide technical support for CBWSM to CARE (Jayapura) and Mercy Corps (Ambon), but systems completed and beneficiaries will not be counted under this PMP, to avoid double counting.
7 First indicator will contribute to BHS IR 2.7. and the second indicator will contribute to BHS SO-e
ENVIRONMENTAL SERVICES PROGRAM WWW.ESP.OR.ID 25
Performance Monitoring Plan (PMP) Eastern Indonesia Water and Sanitation Program
PERFORMANCE INDICATOR VALUES
Program Year Output Target Baseline Result Data
FY05 FY06 FY07 FY08 FY09 FY10 Total Target
(cumulative)8 N/A N/A N/A N/A a) 2
b) 300 a) 2
b) 300 a) 2
b) 300 a) SWMS
developed and implemented
b) People implement
community-based SWMS
0 Actual
THIS SHEET LAST UPDATED ON: 6/4/09
8 This result is counted cumulatively because this result indicates a process where the achievement of each step is
continuing
ENVIRONMENTAL SERVICES PROGRAM WWW.ESP.OR.ID 26
Performance Monitoring Plan (PMP) Eastern Indonesia Water and Sanitation Program
OP – IIP 1.8 BHS SO-e
BHS IR 2.7.
Performance Indicator Reference Sheet SD Outcome 2.e. – Development of Small Scale Sanitation Systems
Strategic Objective: Higher Quality Basic Human Services Utilized Intermediate Result: Improved practices and behaviors adopted at the community and household level Outcomes: At least 25 community-based small scale sanitation plans are developed and implemented. Of these, a minimum of 5 community plans for restored and new facilities will be developed and implemented for return communities in Aceh Indicator9: 1) Number of small scale sanitation systems (SSSS) developed and implemented; 2) Number of people benefiting from small scale sanitation system
DESCRIPTION Precise Definition(s): Small scale sanitation includes sewage treatment at the local level. The development and implementation of small scale sanitation plans follows the steps below: 1. Locations identified and agreed upon with Local stakeholders (Government, local communities) 2. Plans and designs developed and agreed upon by stakeholders 3. Community roles and responsibilities defined through workshops and formal training 4. Operation, maintenance and monitoring system established 5. Community Sanitation systems constructed 6. Quality of effluent in accordance to relevant standards The development of the SSSS includes the system developed by the ESP partners/stakeholders through small grant scheme Unit of Measure: Each system developed + number of people benefiting Disaggregated by: Province
PLAN FOR DATA ACQUISITION BY ESP Data Source(s): TAMIS entries on the progress of development of small scale sanitation system that include technical report of the activity and secondary data from local authority Data Collection Method: Review of TAMIS entries and reports as received Method of Acquisition: Monitoring and Evaluation Specialist responsible for data collection through TAMIS Frequency/Timing of Data Acquisition: Semi-annually and annually data analysis of TAMIS entries
DATA QUALITY ISSUES Known Data Limitations and Significance (if any):
PLAN FOR DATA ANALYSIS, REVIEW, & REPORTING Data Analysis: Progress of development process of community sanitation systems and number of people benefiting Presentation of Data: Quantitative with additional qualitative information. Review of Data: Initial review by M&E Specialist and final review by Environmental Services (SD) Advisor Reporting of Data: ESP Semi Annual and Annual report to USAID
OTHER NOTES Notes on Baselines/Targets: The East Indonesia program will implement own SSSS in Manado (and possibly Jayapura); in addition ESP Specialists will provide technical support for CBS to CARE (Jayapura) and Mercy Corps (Ambon), but systems and beneficiaries will not be counted under this PMP, to avoid double counting.
PERFORMANCE INDICATOR VALUES Program Year
Output Target Baseline Result Data FY05 FY06 FY07 FY08 FY09 FY10 Total
Target (cumulative)10 N/A N/A N/A N/A
a) 2 b) 300
a) 2 b) 300
a) 2 b) 300
a) SSS developed and implemented b) people implement SSSS
0 Actual
THIS SHEET LAST UPDATED ON: 6/4/09
9 First indicator will contribute to BHS IR 2.7. and the second indicator will contribute to BHS SO-e 10
This result is counted cumulatively because this result indicates a process where the achievement of each step is continuing
ENVIRONMENTAL SERVICES PROGRAM WWW.ESP.OR.ID 27
Performance Monitoring Plan (PMP) Eastern Indonesia Water and Sanitation Program
Strategic Objective: Higher Quality Basic Human Services Utilized Intermediate Result: Improved practices and behaviors adopted at the community and household level Outcomes: The precursors needed to impact childhood diarrhea (clean water, sanitation, and behavior change) are contributed to the BHS effort to reduce in the incidence of childhood diarrhea and mortality Indicator: a) Number of school that adopted Clean, Green and Hygiene (CGH) concept; b) Number of people trained in effective hand washing with soap
DESCRIPTION
Precise Definition(s): The Clean, Green and Hygiene (CGH) concept is the application of better hygiene and healthy living for every individual. The CGH School, is the application of better hygiene and healthy living through students learning and behavior change process with the goals that they will apply these behavior not only at the school but also in their own family. Criteria for CGH School: (1) all teachers are well train in the behavior change related to HWWS, solid waste, sanitation, POU Water and conservation, (2) all the students are engaged in the practice of HWWS and properly practice the behavior in their daily routine, (3) the school has practice garbage separation, (4) teachers and students are aware of and use better method to purify water for drinking through boiling or other alternative, (5) school has implement re-greening program: school nursery, tree planting, saving through conservation, (6) school has endorse all the above practices in their school system. People trained in effective hand washing with soap will ONLY counts people who participate in the ESP training and workshops that discuss the complete package of improving health and hygiene behavior which include fecal oral transmission to reduce diarrhea and practice proper hand washing with soap. This achievement does NOT include number of people participate in the hand washing with soap event. Unit of Measure: a) school; b) people Disaggregated by: Each province
PLAN FOR DATA ACQUISITION BY ESP Data Source(s): a) Results of Mini Baseline/Ten Minutes Monitoring; b) TAMIS entry and report on the CGH school; c) TAMIS entry Data Collection Method: a) Review of TAMIS entries and reports as received; b) review of TAMIS entry Method of Acquisition: Monitoring and Evaluation Specialist and Health Communication coordinator responsible for data collection through TAMIS Frequency/Timing of Data Acquisition: a) Semi-annually and annually data analysis of TAMIS entries; b) Quarterly and annually data analysis of TAMIS entry
DATA QUALITY ISSUES Known Data Limitations and Significance (if any):
PLAN FOR DATA ANALYSIS, REVIEW, & REPORTING Data Analysis: a) Progress of development process of school adopting CGH concept; b) Simple counting of number of people received training on proper hand washing with soap Presentation of Data: Quantitative with additional qualitative information. Review of Data: Initial review by M&E Specialist and Health Communication Coordinator and final review by COP/DCOP Reporting of Data: a) and b) ESP Semi Annual and Annual report to USAID; c) ESP Quarterly and Annual report to USAID
OTHER NOTES Notes on Baselines/Targets: ESP will work with new schools in the program location and will work with teachers and students to promote improved hygiene behavior. People trained in effective hand washing with soap will be counted from all ESP activities that integrate this training in the activities.
ENVIRONMENTAL SERVICES PROGRAM WWW.ESP.OR.ID 28
Performance Monitoring Plan (PMP) Eastern Indonesia Water and Sanitation Program
PERFORMANCE INDICATOR VALUES
Program Year Output Target Baseline Result Data
FY05 FY06 FY07 FY08 FY09 FY10 Total Target (cumulative)11
a) N/A b) N/A
a) N/A b) N/A
a) N/A b) N/A
a) N/A b) N/A
a) 3 b) 2,500
a) 3 b) 2,500
a) 3 b) 2,500
a. School adopting CGH concept
b. People trained in proper hand washing with soap
a. 0
b. 0 Actual
THIS SHEET LAST UPDATED ON: 6/4/09
11
This result is counted cumulatively because this result indicates a process where the achievement of each step is continuing
ENVIRONMENTAL SERVICES PROGRAM WWW.ESP.OR.ID 29
Performance Monitoring Plan (PMP) Eastern Indonesia Water and Sanitation Program
Strategic Objective: Higher Quality Basic Human Services Utilized Intermediate Result: Basic Human Service delivered effectively at the local level Outcome: At least 30 PDAMs individually demonstrate an improved operating ratio and those in default of old SLA and RDA debts are assisted in the preparation and submission of proposals to restructure outstanding debt. Indicator(s): The number of PDAMs that were in default of old SLA and RDA debts and are assisted in the preparation and submission of proposals to restructure outstanding debt.
The Operating Ratio is a key measure of a PDAM’s financial condition, and is defined as: Total Operating Revenues divided by Total Operating Costs (including depreciation). In addition to tracking the quantitative Operating Ratio for a respective PDAM, ESP will also track (and provide qualitative descriptions of) those activities carried out by ESP that contribute to an improved Operating Ratio, such as tariff adjustments, debt restructuring, corporate planning, and technical operations improvements (such as a reduction in NRW). Unit of Measure: The Number of PDAMs with an improved OR at the end of ESP’s assistance to a respective PDAM. Disaggregated by: Each province
Precise Definition(s): Debt Restructuring Some of the PDAMs with which ESP works have outstanding loans to the Ministry of Finance. (MOF) Based on the PDAM’s request, ESP will provide technical assistance to a PDAM to prepare a debt restructure proposal in accordance with the MOF’s guidelines. The principals steps (or progress benchmarks) in the debt restructuring process are defined as follows: 1. Data/Information Gathering 2. Preparation of the Company Performance Improvement Plan (RPKP), including a Financial Action Recovery Plan
(FRAP) 3. Presentation/Socialization to Local Government to obtain Letters of Commitment (Bupati/Walikota and DPRD) 4. Submission of Debt Restructuring Proposal
Unit of Measure: The Number of PDAMs assisted in the preparation and submission of debt restructuring proposals, with progress tracked as a percentage of the above steps (1 – 4) ongoing or completed. Disaggregated by: Each province
PLAN FOR DATA ACQUISITION BY ESP Data Source(s): PDAM Financial Reports and TAMIS entry Data Collection Method: Review TAMIS entries based on semi-annual and annual PDAM financial statements. Method of Acquisition: The FN team will review data and calculate Operating Ratio as accurately as possible. Additionally, the FN team will track debt restructuring progress using the ESP TAMIS. Frequency/Timing of Data Acquisition: a) semi annually and annually data analysis of TAMIS entries; b) quarterly and annually data analysis of TAMIS entries
DATA QUALITY ISSUES Known Data Limitations and Significance (if any): PDAM accounting procedures and the accuracy of the financial data can vary from one PDAM to the next.
PLAN FOR DATA ANALYSIS, REVIEW, & REPORTING Data Analysis: Calculation of PDAM Operating Ratio, and calculation of the percentage of debt restructuring steps completed. Presentation of Data: Quantitative (Operating Ratio) with additional Qualitative information (progress on specific initiatives to improve the financial status of PDAMs)
Review of Data: Environmental Finance Coordinator, Monitoring & Evaluation Specialist, and COP
Reporting of Data: a) ESP Semi Annual and Annual report to USAID; b) ESP Quarterly and Annual report to USAID
OTHER NOTES
Notes on Baselines/Targets Results are measured at end of program counting PDAMs that submit a debt restructuring plan to Ministry of Finance ..
ENVIRONMENTAL SERVICES PROGRAM WWW.ESP.OR.ID 30
Performance Monitoring Plan (PMP) Eastern Indonesia Water and Sanitation Program
PERFORMANCE INDICATOR VALUES
Program Year Output Target Baseline Result Data
FY05 FY06 FY07 FY08 FY09 FY10 Total
Targeted # of PDAMs completing debt restructuring process (cumulative)12
Strategic Objective: Higher Quality Basic Human Services Utilized Intermediate Result: Government, communities and the private sector mobilized to advocate for higher quality basic human services. Outcome: At least 10 PDAMs or local governments are assisted in the development of plans to access commercial financing through DCA or other means. Indicator: The number of financing plans developed in cooperation with PDAMs or local governments to access commercial financing through DCA or other means.
DESCRIPTION
Precise Definition(s): The principals steps (or benchmarks) in the development of a financing plan are defined as follows: 1. Project Identification (agreed by PDAM and/or stakeholders) 2. Pre-Feasibility Study (Desk Study, Technical/Financial Audit) 3. Presentation/Socialization of Pre-Feasibility Study result to PDAM and stakeholders, followed by written request from
PDAM/Local Government to proceed. 4. Full Feasibility Study (which may include one or more of the following elements: Water Supply and Demand Analysis,
Investment Cost, Financial Analysis of Historical and Projected Costs/Revenue, Identification of financing options, Technical analysis, and Recommendations)
5. Presentation/Socialization of Full Feasibility Study result to PDAM and stakeholders, followed by written request from PDAM/Local Government to proceed
6. Identification and Implementation of Follow-up Action(s) (which may include one or more of the following elements: Preparation of detailed timeline, Preparation of Terms of Reference, Preparation of Project Tendering Documents, Selection of Financing Institution, Revision of Financial Projection, etc.)
Unit of Measure: The number of financing plans developed, as measured by the completion of Steps 1 – 6 above. Disaggregated by: Financing Plan and Process Steps
PLAN FOR DATA ACQUISITION BY ESP Data Source(s): PDAM, ESP Documentation, Formal Written Communication Data Collection Method: Review of Meeting Minutes and ESP documentation Method of Acquisition: Environmental Finance (FN) team responsible for reviews and reporting through TAMIS Frequency/Timing of Data Acquisition: Data Updated and input into TAMIS Quarterly and annually
DATA QUALITY ISSUES
Known Data Limitations and Significance (if any):
PLAN FOR DATA ANALYSIS, REVIEW, & REPORTING Data Analysis: Data entered into and analyzed in TAMIS by FN team members. Presentation of Data: Quantitative (the number of financing plans underway/completed), and Qualitative (description of progress achieved) Review of Data: Environmental Finance Coordinator, Monitoring & Evaluation Specialist, and COP Reporting of Data: ESP Quarterly and Annual report to USAID
OTHER NOTES
Notes on Baselines/Targets: Program will develop 2 financing plans with PDAM Ambon and Jayapura and submit to Local (and possibly Provincial & Central) Government for financing from combined funding sources (APBD, APBN, local banks, etc)
OP – IIP 1.8 BHS IR 2.6.
ENVIRONMENTAL SERVICES PROGRAM WWW.ESP.OR.ID 32
Performance Monitoring Plan (PMP) Eastern Indonesia Water and Sanitation Program
PERFORMANCE INDICATOR VALUES
Program Year Output Target Baseline Result Data
FY05 FY06 FY07 FY08 FY09 FY10 Total Target (cumulative)13
N/A N/A N/A N/A 2 2 2 Financing Plans Developed to Access Commercial Finance.
0
Actual
THIS SHEET LAST UPDATED ON: 6/4/09
13 This result is counted cumulatively because this result indicates a process where the achievement of each step is
continuing
ENVIRONMENTAL SERVICES PROGRAM WWW.ESP.OR.ID 33
Performance Monitoring Plan (PMP) Eastern Indonesia Water and Sanitation Program
Performance Indicator Reference Sheet
FN Outcome # 3.e – Microcredit Program for New Water Connections Strategic Objective: Higher Quality Basic Human Services Utilized Intermediate Result: Government, communities and the private sector mobilized to advocate for higher quality basic human services Outcome: At least 12 micro-credit programs are established with PDAMs and local banks, resulting in the connection of at least 100,000 low-income persons to water supply network. Indicators: a) The number of microcredit programs established with PDAMs and local banks, including a signed master agreement, staff training, and promotional plan; b) The number of new household connections as a results of micro-credit programs
DESCRIPTION Precise Definition(s): Establishment of Microcredit Programs The principal steps (progress benchmarks) for the implementation of a microcredit program within a PDAM are defined as follows:
1. Contact local banks to assess their interest in providing micro-credit financing facilities 2. Road show to introduce micro-credit program to water utility 3. Obtain written confirmation from Water Utility of interest in program and decision to proceed 4. Arrangement, negotiation and documentation of agreement among PDAM stakeholders and local bank 5. Preparation of draft Master Agreement for PDAM with Local Bank 6. Microcredit Master Agreement (MMA) signing between PDAM and Local Bank 7. Internal training for the staff of PDAM and Local Bank 8. Communications strategy to promote micro-credit to potential customers prepared and implementation underway. Unit of Measure: The number of microcredit programs established (as measured by the completion of Steps 1-8 above). Notably, a single PDAM can have more than one “microcredit program” by executing multiple Microcredit Master Agreements (MMA’s) with different banks or different branches of the same bank. Disaggregated by: PDAM, Master Agreement (Bank), and Process Steps
Precise Definition(s): Household Connections
The FN team shall count the number of new connections achieved by each PDAM using the microcredit arrangement. Each new connection is assumed to represent 5 persons. Unit of Measure: Number of new connections (multiplied by 5 to arrive at estimated number of persons connected) Disaggregated by: PDAM
PLAN FOR DATA ACQUISITION BY ESP Data Source(s): Documentation of microcredit program (such as signed Master Agreement, promotional materials), etc.; PDAM report on new connections. Data Collection Method: Copies of Documentation maintained by ESP as well as regular reporting from PDAM on number of new connections added each month. Method of Acquisition: Environmental Finance (FN) team responsible for review, verification, and reporting through TAMIS Frequency/Timing of Data Acquisition: Quarterly and annually through TAMIS
DATA QUALITY ISSUES
Known Data Limitations and Significance (if any):
PLAN FOR DATA ANALYSIS, REVIEW, & REPORTING Data Analysis: Data entered into and analyzed in TAMIS by FN team members. Presentation of Data: Quantitative (number of programs established and number of new connections), and Qualitative (description of progress achieved at each PDAM) Review of Data: Environmental Finance Coordinator, Monitoring & Evaluation Specialist, and COP Reporting of Data: ESP Quarterly and Annual Report
OTHER NOTES Notes on Baselines/Targets: A PDAM can have more than one “microcredit program” by executing multiple Microcredit Master Agreements (MMA’s) with different banks or different branches of the same bank. Current target covers only Manado, between Pt Air Manado and , at least one local bank. Possibly Ambon has potential also to implement micro credit program
OP – IIP 1.8
ENVIRONMENTAL SERVICES PROGRAM WWW.ESP.OR.ID 34
Performance Monitoring Plan (PMP) Eastern Indonesia Water and Sanitation Program
PERFORMANCE INDICATOR VALUES
Program Year Output Target Baseline Result Data
FY05 FY06 FY07 FY08 FY09 FY10 Total Target (cumulative)14 N/A N/A N/A N/A 1 1 1 Establishment of 1
14 This result is counted cumulatively because this result indicates a process where the achievement of each step is
continuing
15 This result is counted cumulatively because this result indicates a process where the achievement of each step is continuing
ENVIRONMENTAL SERVICES PROGRAM WWW.ESP.OR.ID 35
Performance Monitoring Plan (PMP) Eastern Indonesia Water and Sanitation Program
6. REFERENCES
Environmental Services Program (ESP) Indonesia. (2005). First Annual Work Plan and Life of Project Plan.
Environmental Services Program (ESP) Indonesia. (2005). Nanggroe Aceh Darussalam Annual Work Plan and Life of Project Plan.
Joint Monitoring Programme (JMP). (2005). Guide for Water Supply, Sanitation and Hygiene Related Survey Questions. WHO/UNICEF.
Kleinau E, Pyle D, Nichols L, Rosensweig F, Cogswell L, and Tomasek A. (2003). Strategic Report 8: Guidelines for Assessing Hygiene Improvement. Arlington, VA: Environmental Health Project II (USAID).
Olembo, Lynnette. FAD Kaona, Mary Tuba, Gilbert Burnham, Eckhard Kleinau. SAFE WATER SYSTEMS: An Evaluation of the Zambia CLORIN Program. FINAL REPORT. Johns Hopkins University, Bloomberg School of Public Health; Environmental Health Project (EHP)/USAID 28 September 2004.
ORC Macro (2000). Model A Questionnaire with Commentary for High Contraceptive Prevalence Countries (Qs.21-24 and 33-34 of the Household Questionnaire; Qs. 485 and 495 of the Woman’s Questionnaire).
Project Hope (1999). Kasungu Child Survival and Mother Care Programme Baseline Survey, Questionnaire for mother/caretaker (Qs. 74-85).
Rapid Knowledge, Practices and Coverage (KPC) Survey. (2005). Revised Module #: Household Water Supply, Sanitation and Hygiene. CORE Group/CSTS/USAID.
SAVE/Vietnam. Spot Observation Checklist.
The Performance Management Toolkit. A Guide to Developing and Implementing Performance Management Plans. Policy and Program Coordination Bureau. Contract Number: AEP-C-00-99-00034-00. USAID. Last Revised: April 2003.
UNICEF (1995/2000). Multiple Indicator Cluster Survey (Water and Sanitation).
ENVIRONMENTAL SERVICES PROGRAM WWW.ESP.OR.ID 36
ENVIRONMENTAL SERVICES PROGRAM Ratu Plaza Building, 17th. Fl.