AbstractA set of Critical Flow Venturis (CFVs) were manufactured by Flow Systems and calibrated by NIST inGaithersburg, MD. Subsequently these flow standards along with pressure and temperature standardshave been integrated into a gas flow meter calibration (GFC) system. Performance data and an uncertaintyanalysis is discussed here in this paper. Calibration data on these CFV standards will be used to inter-compare the NIST and CEESI primary facilities.
Flow Systems manufactures between 300 and 400CFVs on an annual basis. These Venturis aresubsequently calibrated by CEESI. In efforts toeliminate logistical issues, improve lead times andreduce uncertainty, Flow Systems and CEESI haveundertaken a joint effort to design, manufacture andcommission an automated gas flow meter calibrationsystem (GFC). The desired uncertainty for acalibration made on a meter-under-test (MUT) was tobe less than ± 0.20%. This requires low uncertaintyfor the discharge coefficient (Cd) for the CFV, as wellas the pressure and temperature instrumentationinstalled in the GFC.
2. System Design
Eight CFVs with throat diameters ranging from0.41 mm to 4.5 mm were designed and manufacturedin accordance with ISO 9300 and ASME MFC-7M.
MAPAN - Journal of Metrology Society of India, Vol. 26, No. 3, 2011; pp. 247-254ORIGINAL ARTICLE
These CFVs were designed as a binary set such that thethroat areas progress by a factor of 2. This set of CFVsis also referred to as the "P Nozzles". These Venturiswere calibrated at the NIST FMG facilities located inGaithersburg, MD using the 677 L PVTt system [1]. Theuncertainty in the discharge coefficient (Cd) versusthroat Reynolds Number (Re) equation for each CFV isless than ± 0.07% at 95% confidence. Test fluids usedby NIST were nitrogen and compressed air. The flowingtemperature was near ambient, at approximately 21 °C.Each CFV (P Nozzle) was calibrated over an inletpressure range of 172 to 827 kPa. Using the same fluidsand at the same temperature, the GFC system willservice 0.00005 to 0.03 kg/s.
The main test fluid for the GFC system will becompressed air that is filtered and dried to a pressuredewpoint less than -40 °C. A sensor measuring thedewpoint is used as an alarm in the GFC system. Thesupply pressure to the system will range from 690 to900 kPa. This supply will be diffused into severalcopper tubes which, along with the CFV and MUT Meter
Michael Carter, William Johansen and Charles Britton
248
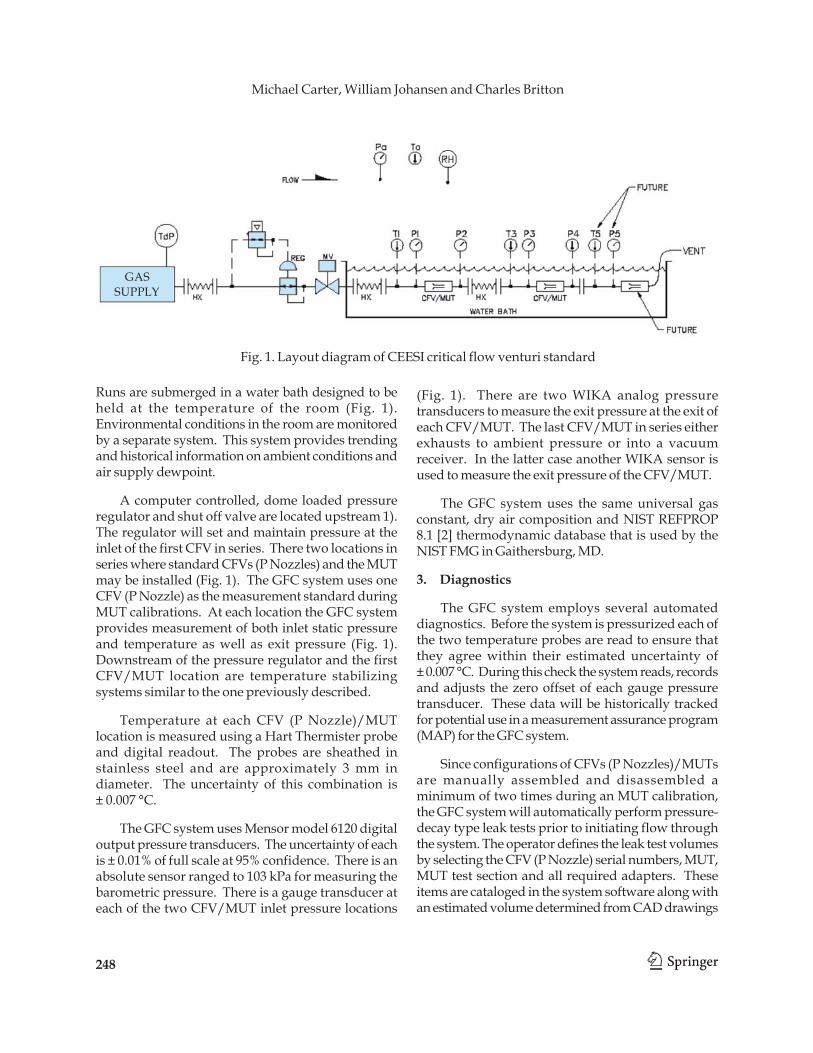
Runs are submerged in a water bath designed to beheld at the temperature of the room (Fig. 1).Environmental conditions in the room are monitoredby a separate system. This system provides trendingand historical information on ambient conditions andair supply dewpoint.
A computer controlled, dome loaded pressureregulator and shut off valve are located upstream 1).The regulator will set and maintain pressure at theinlet of the first CFV in series. There two locations inseries where standard CFVs (P Nozzles) and the MUTmay be installed (Fig. 1). The GFC system uses oneCFV (P Nozzle) as the measurement standard duringMUT calibrations. At each location the GFC systemprovides measurement of both inlet static pressureand temperature as well as exit pressure (Fig. 1).Downstream of the pressure regulator and the firstCFV/MUT location are temperature stabilizingsystems similar to the one previously described.
Temperature at each CFV (P Nozzle)/MUTlocation is measured using a Hart Thermister probeand digital readout. The probes are sheathed instainless steel and are approximately 3 mm indiameter. The uncertainty of this combination is± 0.007 °C.
The GFC system uses Mensor model 6120 digitaloutput pressure transducers. The uncertainty of eachis ± 0.01% of full scale at 95% confidence. There is anabsolute sensor ranged to 103 kPa for measuring thebarometric pressure. There is a gauge transducer ateach of the two CFV/MUT inlet pressure locations
(Fig. 1). There are two WIKA analog pressuretransducers to measure the exit pressure at the exit ofeach CFV/MUT. The last CFV/MUT in series eitherexhausts to ambient pressure or into a vacuumreceiver. In the latter case another WIKA sensor isused to measure the exit pressure of the CFV/MUT.
The GFC system uses the same universal gasconstant, dry air composition and NIST REFPROP8.1 [2] thermodynamic database that is used by theNIST FMG in Gaithersburg, MD.
3. Diagnostics
The GFC system employs several automateddiagnostics. Before the system is pressurized each ofthe two temperature probes are read to ensure thatthey agree within their estimated uncertainty of± 0.007 °C. During this check the system reads, recordsand adjusts the zero offset of each gauge pressuretransducer. These data will be historically trackedfor potential use in a measurement assurance program(MAP) for the GFC system.
Since configurations of CFVs (P Nozzles)/MUTsare manually assembled and disassembled aminimum of two times during an MUT calibration,the GFC system will automatically perform pressure-decay type leak tests prior to initiating flow throughthe system. The operator defines the leak test volumesby selecting the CFV (P Nozzle) serial numbers, MUT,MUT test section and all required adapters. Theseitems are cataloged in the system software along withan estimated volume determined from CAD drawings
Fig. 1. Layout diagram of CEESI critical flow venturi standard
GASSUPPLY
249
Performance of a Gas Flow Meter Calibration System Utilizing Critical Flow Venturi Standards
of each. After a cap is installed by the operator at theend of the most downstream test section, the systemopens the shut off valve and the regulator slowlypressurizes the entire volume. The leak test pressureset point is 690 kPa. Once the system determines thatthe total leak test volume has reached equilibrium withrespect to temperature, a counter is initiated and allpressures and temperatures within the system arerecorded. Provided that the pressure decay is lessthan a predetermined limit, the test will last 60seconds. At the end of this interval, the final pressuresand temperatures are recorded along with theduration of the test.
If the leak test passes, the GFC system will comparethe final readings of the gauge transducers used andverify that they agree within their full scaleuncertainty specifications
4. Validation Efforts
The GFC system is programmed using NationalInstruments LabVIEW software. Data processed usingthis software was input into spreadsheets that performidentical calculations. GFC system calculations havebeen compared to spreadsheet values and were foundto be less than 10 ppm. Results are archived and arerevalidated with each software revision.
5. CEESI Evaluation of P Nozzles with Primary B
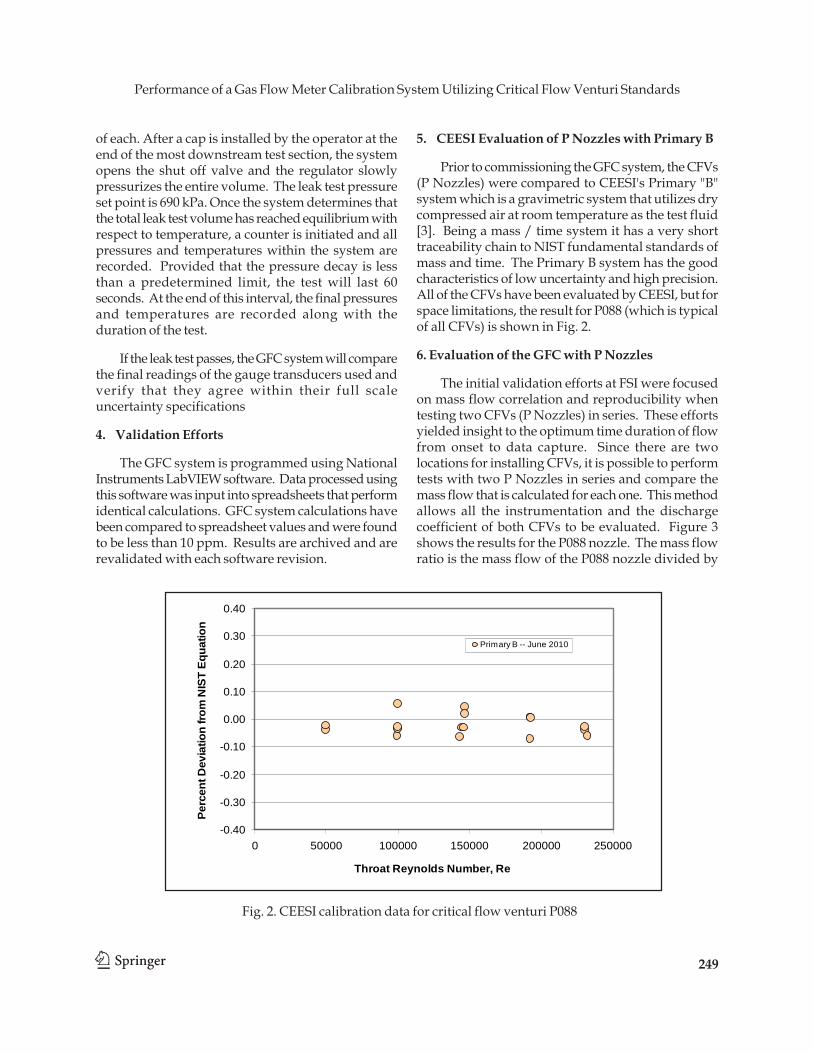
Prior to commissioning the GFC system, the CFVs(P Nozzles) were compared to CEESI's Primary "B"system which is a gravimetric system that utilizes drycompressed air at room temperature as the test fluid[3]. Being a mass / time system it has a very shorttraceability chain to NIST fundamental standards ofmass and time. The Primary B system has the goodcharacteristics of low uncertainty and high precision.All of the CFVs have been evaluated by CEESI, but forspace limitations, the result for P088 (which is typicalof all CFVs) is shown in Fig. 2.
6. Evaluation of the GFC with P Nozzles
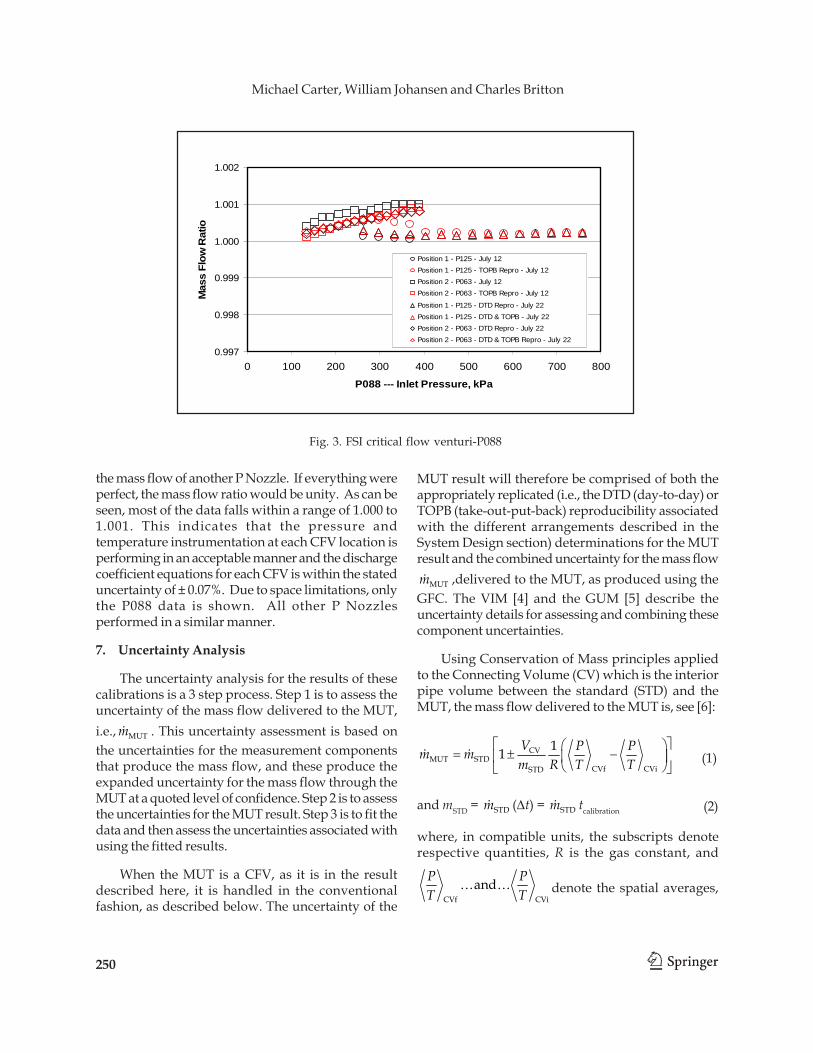
The initial validation efforts at FSI were focusedon mass flow correlation and reproducibility whentesting two CFVs (P Nozzles) in series. These effortsyielded insight to the optimum time duration of flowfrom onset to data capture. Since there are twolocations for installing CFVs, it is possible to performtests with two P Nozzles in series and compare themass flow that is calculated for each one. This methodallows all the instrumentation and the dischargecoefficient of both CFVs to be evaluated. Figure 3shows the results for the P088 nozzle. The mass flowratio is the mass flow of the P088 nozzle divided by
Fig. 2. CEESI calibration data for critical flow venturi P088
-0.40
-0.30
-0.20
-0.10
0.00
0.10
0.20
0.30
0.40
0 50000 100000 150000 200000 250000
Throat Reynolds Number, Re
Perc
ent D
evia
tion
from
NIS
T Eq
uatio
n
Primary B -- June 2010
Michael Carter, William Johansen and Charles Britton
250
the mass flow of another P Nozzle. If everything wereperfect, the mass flow ratio would be unity. As can beseen, most of the data falls within a range of 1.000 to1.001. This indicates that the pressure andtemperature instrumentation at each CFV location isperforming in an acceptable manner and the dischargecoefficient equations for each CFV is within the stateduncertainty of ± 0.07%. Due to space limitations, onlythe P088 data is shown. All other P Nozzlesperformed in a similar manner.
7. Uncertainty Analysis
The uncertainty analysis for the results of thesecalibrations is a 3 step process. Step 1 is to assess theuncertainty of the mass flow delivered to the MUT,i.e., MUTm . This uncertainty assessment is based onthe uncertainties for the measurement componentsthat produce the mass flow, and these produce theexpanded uncertainty for the mass flow through theMUT at a quoted level of confidence. Step 2 is to assessthe uncertainties for the MUT result. Step 3 is to fit thedata and then assess the uncertainties associated withusing the fitted results.
When the MUT is a CFV, as it is in the resultdescribed here, it is handled in the conventionalfashion, as described below. The uncertainty of the
MUT result will therefore be comprised of both theappropriately replicated (i.e., the DTD (day-to-day) orTOPB (take-out-put-back) reproducibility associatedwith the different arrangements described in theSystem Design section) determinations for the MUTresult and the combined uncertainty for the mass flow
MUTm ,delivered to the MUT, as produced using theGFC. The VIM [4] and the GUM [5] describe theuncertainty details for assessing and combining thesecomponent uncertainties.
Using Conservation of Mass principles appliedto the Connecting Volume (CV) which is the interiorpipe volume between the standard (STD) and theMUT, the mass flow delivered to the MUT is, see [6]:
⎡ ⎤⎛ ⎞= ± −⎢ ⎥⎜ ⎟
⎝ ⎠⎣ ⎦CV
MUT STDCVf CViSTD
11 V P Pm mm R T T (1)
and mSTD = STDm (Δt) = STDm tcalibration
where, in compatible units, the subscripts denoterespective quantities, R is the gas constant, and
… …CVf CVi
andP PT T denote the spatial averages,
0.997
0.998
0.999
1.000
1.001
1.002
0 100 200 300 400 500 600 700 800
P088 --- Inlet Pressure, kPa
Mas
s Fl
ow R
atio
Position 1 - P125 - July 12Position 1 - P125 - TOPB Repro - July 12Position 2 - P063 - July 12Position 2 - P063 - TOPB Repro - July 12
Position 1 - P125 - DTD Repro - July 22Position 1 - P125 - DTD & TOPB - July 22Position 2 - P063 - DTD Repro - July 22Position 2 - P063 - DTD & TOPB Repro - July 22
Fig. 3. FSI critical flow venturi-P088
(2)
251
Performance of a Gas Flow Meter Calibration System Utilizing Critical Flow Venturi Standards
respectfully, of the pressure to temperature ratios inthe CV at the end and the beginning of the calibration
interval. In this way the term ⎛ ⎞
−⎜ ⎟⎝ ⎠CVf CVi
1 p pR T T is
the fluid density increase in the CV during thecalibration. The plus or minus term in the governingequation for MUTm depends on whether the STD isupstream or downstream from the MUT; the sign isminus when the STD is upstream of the MUT and it isplus when the MUT is upstream of the STD, see [6].
The relative uncertainty for MUTm is thereforewritten, see [6]:
( )( )
2 2CV CVr MUT r STD r
STD
r CV2 2CV CVr STD
STD CV r CV
( ) [ ( )] [ (1 )]
[ ( )] [ )]
Vu m u m um
u pV pu m
m RT u T
ρΔ= + − =
⎧ ⎫+⎪ ⎪+ ⎨ ⎬⎪ ⎪⎩ ⎭
Data records are to be used to quantify thevariances under the radical sign in the above equation,
including correlation effects, see [6]. When the STD isa P Nozzle, STDm is given by:
= * *c wSTD oSTD STD dSTD STD
U oSTD
g Mm P A C CR T
where dSTDC is provided via the NIST calibrationreport on its calibration of the STD.
The relative uncertainty for STDm is written, whereit is assumed that no correlation effects are presentamong the component measurements that comprise
STDm see [6]:
(3)
(4)
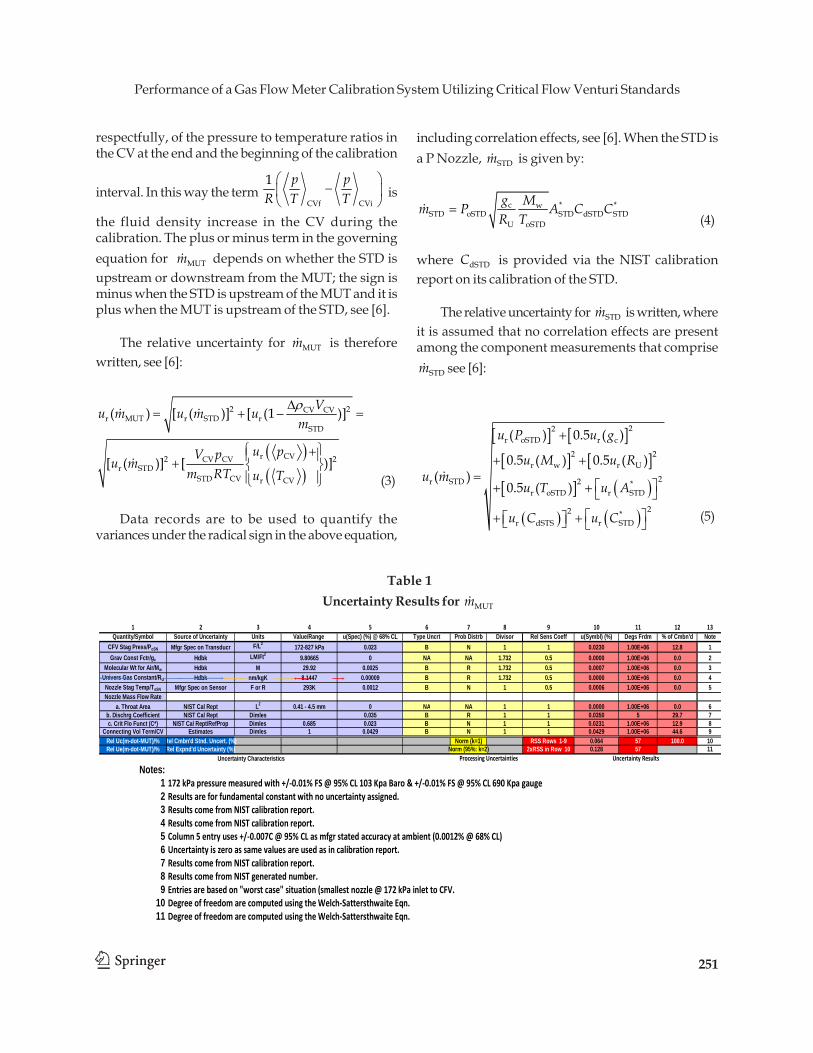
Table 1Uncertainty Results for MUTm
1 2 3 4 5 6 7 8 9 10 11 12 13Quantity/Symbol Source of Uncertainty Units Value/Range u(Spec) (%) @ 68% CL Type Uncrt Prob Distrb Divisor Rel Sens Coeff u(Symbl) (%) Degs Frdm % of Cmbn'd Note
CFV Stag Press/PoSN Mfgr Spec on Transducr F/L2 172-827 kPa 0.023 B N 1 1 0.0230 1.00E+06 12.8 1Grav Const Fctr/gc Hdbk LM/Ft2 9.80665 0 NA NA 1.732 0.5 0.0000 1.00E+06 0.0 2
Molecular Wt for Air/Mw Hdbk M 29.92 0.0025 B R 1.732 0.5 0.0007 1.00E+06 0.0 3Univers Gas Constant/RU Hdbk nm/kgK 8.1447 0.00009 B R 1.732 0.5 0.0000 1.00E+06 0.0 4Nozzle Stag Temp/ToSN Mfgr Spec on Sensor F or R 293K 0.0012 B N 1 0.5 0.0006 1.00E+06 0.0 5Nozzle Mass Flow Rate
a. Throat Area NIST Cal Rept L2 0.41 - 4.5 mm 0 NA NA 1 1 0.0000 1.00E+06 0.0 6b. Dischrg Coefficient NIST Cal Rept Dimles 0.035 B R 1 1 0.0350 5 29.7 7c. Crit Flo Funct (C*) NIST Cal Rept/RefProp Dimles 0.685 0.023 B N 1 1 0.0231 1.00E+06 12.9 8
Notes:1 172 kPa pressure measured with +/‐0.01% FS @ 95% CL 103 Kpa Baro & +/‐0.01% FS @ 95% CL 690 Kpa gauge 2 Results are for fundamental constant with no uncertainty assigned.3 Results come from NIST calibration report.4 Results come from NIST calibration report.5 Column 5 entry uses +/‐0.007C @ 95% CL as mfgr stated accuracy at ambient (0.0012% @ 68% CL)6 Uncertainty is zero as same values are used as in calibration report.7 Results come from NIST calibration report.8 Results come from NIST generated number.9 Entries are based on "worst case" situation (smallest nozzle @ 172 kPa inlet to CFV.
10 Degree of freedom are computed using the Welch‐Sattersthwaite Eqn.11 Degree of freedom are computed using the Welch‐Sattersthwaite Eqn.
Michael Carter, William Johansen and Charles Britton
252
Typical values for these relative uncertainties areused in the tabulation for r STD( )u m presented in Table 1,see [6]. The resulting relative Expanded Uncertaintyfor is ± 0.128 % at 95 % confidence level.
When a calibration of a P Nozzle is done usingother P Nozzles, the calibration result for each nozzleis written:
=* MUT U oPnzlPnzl dPnzl *
oPnzl Pnzl c w
m R TA C PP C g M
The relative uncertainty for the calibration result
( )*r Pnzl dPnzlu A C iswritten,see[4]:
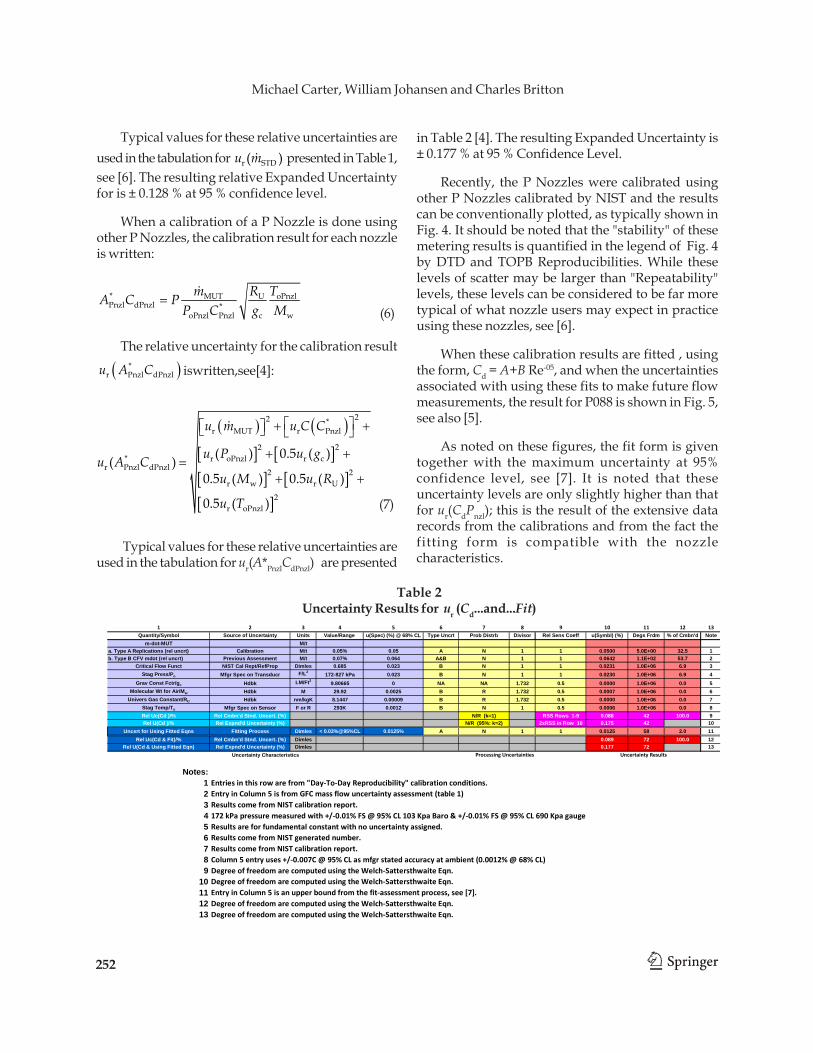
Typical values for these relative uncertainties areused in the tabulation for ur(A*PnzlCdPnzl) are presented
in Table 2 [4]. The resulting Expanded Uncertainty is± 0.177 % at 95 % Confidence Level.
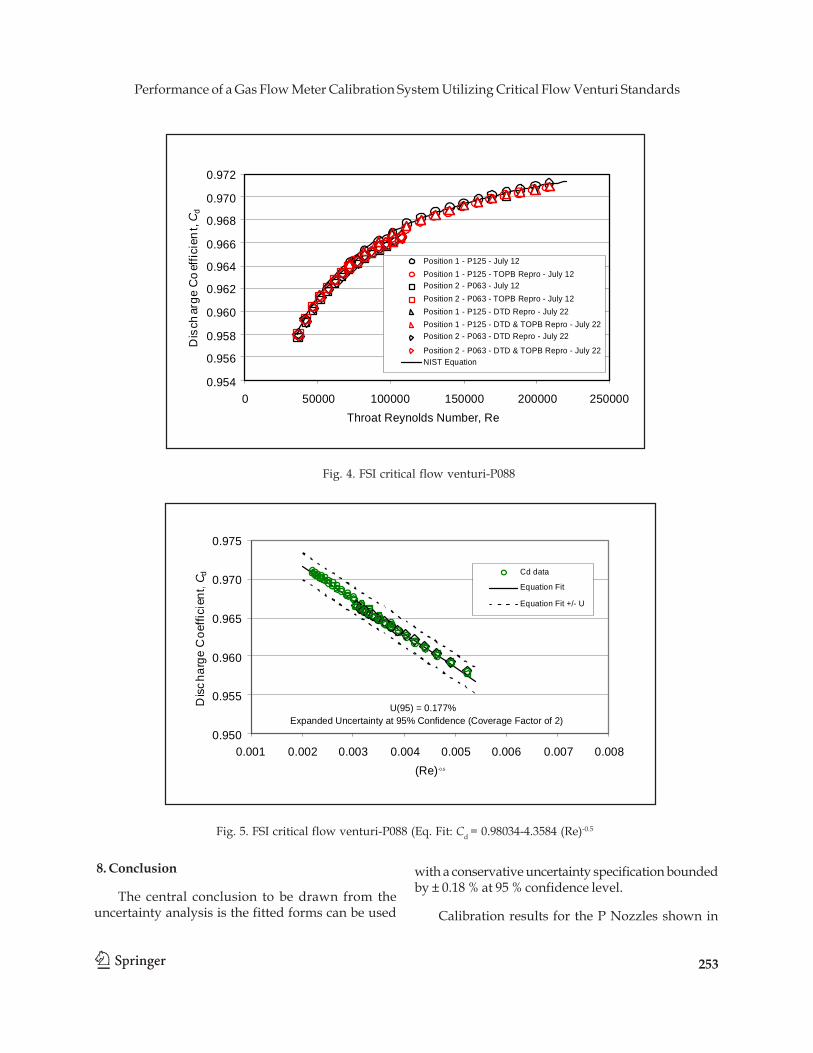
Recently, the P Nozzles were calibrated usingother P Nozzles calibrated by NIST and the resultscan be conventionally plotted, as typically shown inFig. 4. It should be noted that the "stability" of thesemetering results is quantified in the legend of Fig. 4by DTD and TOPB Reproducibilities. While theselevels of scatter may be larger than "Repeatability"levels, these levels can be considered to be far moretypical of what nozzle users may expect in practiceusing these nozzles, see [6].
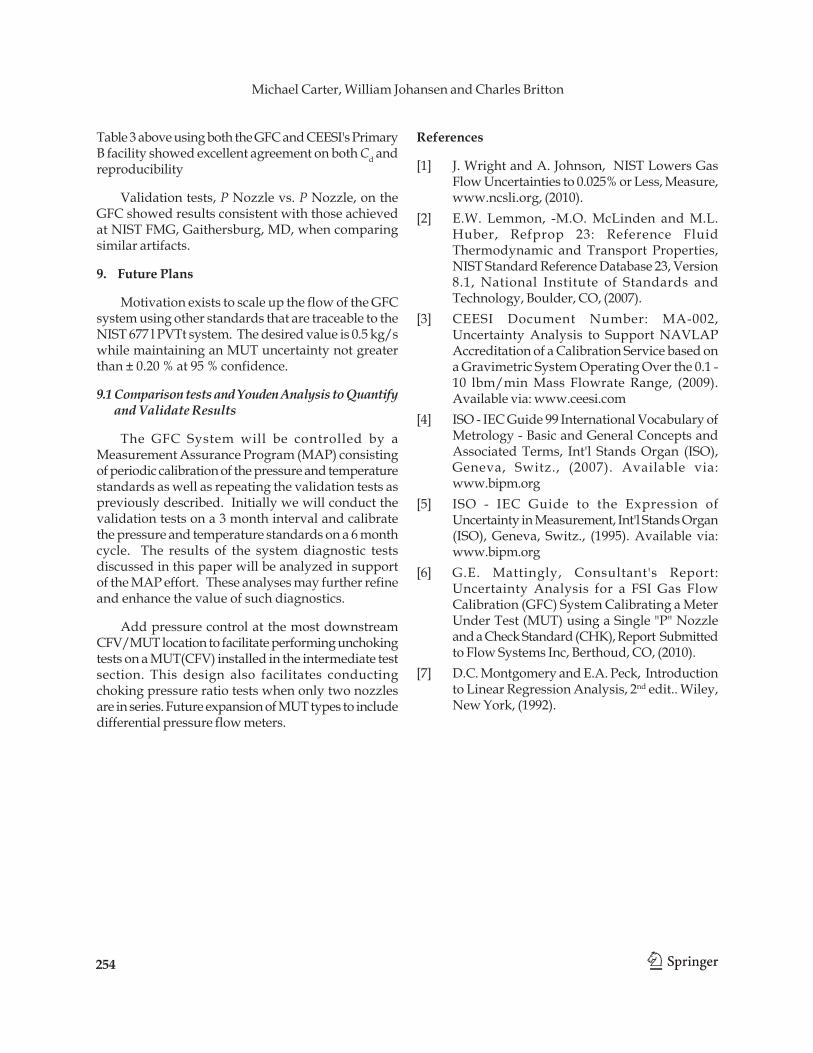
When these calibration results are fitted , usingthe form, Cd = A+B Re-05, and when the uncertaintiesassociated with using these fits to make future flowmeasurements, the result for P088 is shown in Fig. 5,see also [5].
As noted on these figures, the fit form is giventogether with the maximum uncertainty at 95%confidence level, see [7]. It is noted that theseuncertainty levels are only slightly higher than thatfor ur(CdPnzl); this is the result of the extensive datarecords from the calibrations and from the fact thefitting form is compatible with the nozzlecharacteristics.
(6)
( ) ( )[ ] [ ][ ] [ ][ ]
⎡ ⎤+ +⎡ ⎤⎣ ⎦ ⎣ ⎦
+ +=
+ +
22 *r MUT r Pnzl
22* r oPnzl r c
r Pnzl dPnzl 2 2r w r U
2r oPnzl
( ) 0.5 ( )( )0.5 ( ) 0.5 ( )
0.5 ( )
u m u C C
u P u gu A Cu M u R
u T
Table 2Uncertainty Results for ur (Cd...and...Fit)
1 2 3 4 5 6 7 8 9 10 11 12 13Quantity/Symbol Source of Uncertainty Units Value/Range u(Spec) (%) @ 68% CL Type Uncrt Prob Distrb Divisor Rel Sens Coeff u(Symbl) (%) Degs Frdm % of Cmbn'd Note
m-dot-MUT M/ta. Type A Replications (rel uncrt) Calibration M/t 0.05% 0.05 A N 1 1 0.0500 5.0E+00 32.5 1b. Type B CFV mdot (rel uncrt) Previous Assessment M/t 0.07% 0.064 A&B N 1 1 0.0642 1.1E+02 53.7 2
Critical Flow Funct NIST Cal Rept/RefProp Dimles 0.685 0.023 B N 1 1 0.0231 1.0E+06 6.9 3Stag Press/Po Mfgr Spec on Transducr F/L2 172-827 kPa 0.023 B N 1 1 0.0230 1.0E+06 6.9 4
Grav Const Fctr/gc Hdbk LM/Ft2 9.80665 0 NA NA 1.732 0.5 0.0000 1.0E+06 0.0 5Molecular Wt for Air/Mw Hdbk M 29.92 0.0025 B R 1.732 0.5 0.0007 1.0E+06 0.0 6
Univers Gas Constant/RU Hdbk nm/kgK 8.1447 0.00009 B R 1.732 0.5 0.0000 1.0E+06 0.0 7Stag Temp/To Mfgr Spec on Sensor F or R 293K 0.0012 B N 1 0.5 0.0006 1.0E+06 0.0 8Rel Uc(Cd )/% Rel Cmbn'd Stnd. Uncert. (%) N/R (k=1) RSS Rows 1-9 0.088 42 100.0 9Rel U(Cd )/% Rel Expnd'd Uncertainty (%) N/R (95%: k=2) 2xRSS in Row 10 0.175 42 10
Uncert for Using Fitted Eqns Fitting Process Dimles < 0.03%@95%CL 0.0125% A N 1 1 0.0125 58 2.0 11Rel Uc(Cd & Fit)/% Rel Cmbn'd Stnd. Uncert. (%) Dimles 0.089 72 100.0 12
Notes:1 Entries in this row are from "Day‐To‐Day Reproducibility" calibration conditions.2 Entry in Column 5 is from GFC mass flow uncertainty assessment (table 1)3 Results come from NIST calibration report.4 172 kPa pressure measured with +/‐0.01% FS @ 95% CL 103 Kpa Baro & +/‐0.01% FS @ 95% CL 690 Kpa gauge 5 Results are for fundamental constant with no uncertainty assigned.6 Results come from NIST generated number.7 Results come from NIST calibration report.8 Column 5 entry uses +/‐0.007C @ 95% CL as mfgr stated accuracy at ambient (0.0012% @ 68% CL)9 Degree of freedom are computed using the Welch‐Sattersthwaite Eqn.
10 Degree of freedom are computed using the Welch‐Sattersthwaite Eqn.11 Entry in Column 5 is an upper bound from the fit‐assessment process, see [7].12 Degree of freedom are computed using the Welch‐Sattersthwaite Eqn.13 Degree of freedom are computed using the Welch‐Sattersthwaite Eqn.
U(95) = 0.177%Expanded Uncertainty at 95% Confidence (Coverage Factor of 2)
Michael Carter, William Johansen and Charles Britton
254
Table 3 above using both the GFC and CEESI's PrimaryB facility showed excellent agreement on both Cd andreproducibility
Validation tests, P Nozzle vs. P Nozzle, on theGFC showed results consistent with those achievedat NIST FMG, Gaithersburg, MD, when comparingsimilar artifacts.
9. Future Plans
Motivation exists to scale up the flow of the GFCsystem using other standards that are traceable to theNIST 677 l PVTt system. The desired value is 0.5 kg/swhile maintaining an MUT uncertainty not greaterthan ± 0.20 % at 95 % confidence.
9.1 Comparison tests and Youden Analysis to Quantify and Validate Results
The GFC System will be controlled by aMeasurement Assurance Program (MAP) consistingof periodic calibration of the pressure and temperaturestandards as well as repeating the validation tests aspreviously described. Initially we will conduct thevalidation tests on a 3 month interval and calibratethe pressure and temperature standards on a 6 monthcycle. The results of the system diagnostic testsdiscussed in this paper will be analyzed in supportof the MAP effort. These analyses may further refineand enhance the value of such diagnostics.
Add pressure control at the most downstreamCFV/MUT location to facilitate performing unchokingtests on a MUT(CFV) installed in the intermediate testsection. This design also facilitates conductingchoking pressure ratio tests when only two nozzlesare in series. Future expansion of MUT types to includedifferential pressure flow meters.
References
[1] J. Wright and A. Johnson, NIST Lowers GasFlow Uncertainties to 0.025% or Less, Measure,www.ncsli.org, (2010).
[2] E.W. Lemmon, -M.O. McLinden and M.L.Huber, Refprop 23: Reference FluidThermodynamic and Transport Properties,NIST Standard Reference Database 23, Version8.1, National Institute of Standards andTechnology, Boulder, CO, (2007).
[3] CEESI Document Number: MA-002,Uncertainty Analysis to Support NAVLAPAccreditation of a Calibration Service based ona Gravimetric System Operating Over the 0.1 -10 lbm/min Mass Flowrate Range, (2009).Available via: www.ceesi.com
[4] ISO - IEC Guide 99 International Vocabulary ofMetrology - Basic and General Concepts andAssociated Terms, Int'l Stands Organ (ISO),Geneva, Switz., (2007). Available via:www.bipm.org
[5] ISO - IEC Guide to the Expression ofUncertainty in Measurement, Int'l Stands Organ(ISO), Geneva, Switz., (1995). Available via:www.bipm.org
[6] G.E. Mattingly, Consultant's Report:Uncertainty Analysis for a FSI Gas FlowCalibration (GFC) System Calibrating a MeterUnder Test (MUT) using a Single "P" Nozzleand a Check Standard (CHK), Report Submittedto Flow Systems Inc, Berthoud, CO, (2010).
[7] D.C. Montgomery and E.A. Peck, Introductionto Linear Regression Analysis, 2nd edit.. Wiley,New York, (1992).