Page 1
NASA/CR--2002-211992
Performance of a Model Rich Burn-QuickMix-Lean Burn Combustor at Elevated
Temperature and Pressure
Christopher O. Peterson, William A. Sowa, and G.S. Samuelsen
University of Californi.a, Irvine, Irvine, California
December 2002
https://ntrs.nasa.gov/search.jsp?R=20030013952 2018-09-07T21:52:47+00:00Z
Page 2
The NASA STI Program Office... in Profile
Since its founding, NASA has been dedicated to
the advancement of aeronautics and spacescience. Tile NASA Scientific and Technical
Information (STI) Program Office plays a key part
in helping NASA maintain this important role.
Tile NASA STI Program Office is operated by
Langley Research Center, the Lead Center forNASA's scientific and technical information. The
NASA STI Program Office provides access to the
NASA STI Database, the largest collection of
aeronautical and space science STI in file world.
The Program Office is also NASA's institutional
medlanism for disseminating the results of its
researd3 and development acti vities. These results
are published by NASA in the NASA STI Report
Series, which includes the following report types:
TECHNICAL PUBHCATION. Reports of
completed :research or a major significant
phase of research that present the results of
NASA programs and include extensive data
or theoretical analysis. Includes compilations
of significant scientific and technical data and
information deemed to be of continuing
reference value. NASA's counterpart of peer-
reviewed formal professional papers but
has less stringent limitations on manuscript
lengfl3 and extent of graphic presentations.
TECHNICAL MEMORANDUM. Scientific
and tedmical findings that are pre, liminary or
of specialized interest, e.g., quick release
reports, working papers, and bibliographiesthat contain minimal annotation. Does not
contain extensive analysis.
CONTRACTOR REPORT. Scientific and
technical findings by NASA-sponsored
contractors and grantees.
CONFERENCE PUBLICATION. Collected
papers from scientific and technical
conferences, symposia, seminars, or other
meetings sponsored or cosponsored byNASA.
SPECIAL PUBLICATION. Scientific,
technical, or historical information from
NASA programs, projects, and missions,
often concerned with subjects having
substantial public interest.
TECHNICAL TRANSLATION. English-
language translations of foreign scientific
and technical material pertinent to NASA'smission.
Specialized services that complement the STI
Program Office's diverse offerings include
creating custom thesauri, building customized
databases, organizing and publishing research
results.., even providing videos.
For more information about the NASA STI
Program Office, see the following:
® Access the NASASTI Program Home Page
at http:lhuww.sti.nasa.gov
® E-mail your question via the Intemet to
[email protected]
* Fax your question to the NASA Access
Help Desk at 301-621-0134
* Telephone the NASA Access Help Desk at301-621-0390
Write to:
NASA Access Help Desk
NASA Center for AeroSpace Information7121 Standard Drive
Hanover, MD 21076
Page 3
NASA/CR--2002-211992
Performance of a Model Rich Burn-QuickMix-Lean Burn Combustor at Elevated
Temperature and Pressure
Christopher O. Peterson, William A. Sowa, and G.S. Samuelsen
University of Californi.a, Irvine, Irvin.e, California
Prepared under Grant NAG3----1110
National Aeronautics and
Spa ce Ad.minis tration
Glelm Research Center
December 2002
Page 4
Trade names or manufacturers' names are used in this report foridentificatio_ only. This usage does not constitute a_ official
endorsement, either expressed or implied, by the Natio_mlAeronautics and Space Administration.
NASA Center for Aerospace Information71121Standard Drive
Hanover, MD 211076
Available frorn
National Technical Information Service
5285 Port Royal RoadSpringfield, VA 22100
Available electronically at http://gltrs.grcnasa.gov
Page 5
TABLE OF CONTENTS
PAGE
LIST OF SYMBOLS AND SUBSCRIPTS ...................................... v
1.0 INTRODUCTION .................................................................... 1
1.1 OVERVIEW .................................................................. 1
1.2 GOALS AND OBJECTIVES ........................................ 3
2.0 BACKGROUND ...................................................................... 4
2.1 AERO GAS TURBINE ENGINES ................................. 4
2.2 EMISSIONS FROM GAS TURBINE ENGINES .......... 9
2.2.1 NOx ................................................................. 9
2.2.2 CO AND UHC ................................................. 12
2.3 MINIMIZATION OF EMISSIONS FROM GAS
TURBINE ENGINES ................................................ 13
2.4 THE RQL COMBUSTOR CONCEPT .......................... 15
2.4.1 PREVIOUS UCI RQL RESEARCH ................ 16
2.4.2 ADDITIONAL RQL RESEARCH ................... 17
3.0 APPROACH ............................................................................. 18
4.0 EXPERIMENT ........................................................................ 20
4.1 TESTING FACILITY .................................................... 20
4.1.1 EXISTING FACILITY ..................................... 20
4.1.2 MODIFICATIONS ........................................... 25
4.2 MODEL RQL COMBUSTOR ........................................ 32
4.2.1 MODULAR DESIGN ...................................... 32
4.2.2 FUEL ATOMIZER AND FUEL ...................... 37
4.2.3 SWIRLERS ...................................................... 38
4.3 EXPERIMENTAL DESIGN AND EXECUTION .......... 39
4.3.1 EXPERIMENTAL DEVELOPMENT .............. 39
4.3.2 FLOW SPLITS TESTING ............................... 40
4.3.3 PHASE 1 TESTING: PERFORMANCE
ASSESSMENT ............................................... 42
NASA/CR--2002-211992 iii
Page 6
4.3.4 PHASE 2 TESTING: DETAILED
MEASUREMENT .......................................... 46
5.0 RESULTS ................................................................................. 48
5.1 PHASE 1 TESTING ....................................................... 48
5.1.1 NOx EMISSIONS ............................................. 48
5.1.2 NOx PRODUCTION AND REACTION
TEMPERATURE ........................................... 59
5.1.3 COMBUSTION EFFICIENCY ......................... 62
5.2 PHASE 2 TESTING ....................................................... 65
5.2.1 RICH ZONE EMISSION PROFILE ................. 65
5.2.2 LEAN ZONE EMISSION PROFILE ................ 67
6.0 SUMMARY AND CONCLUSIONS ......................................... 70
6.1 SUMMARY ................................................................... 70
6.2 CONCLUSIONS ............................................................ 71
REFERENCES ............................................................................... 72
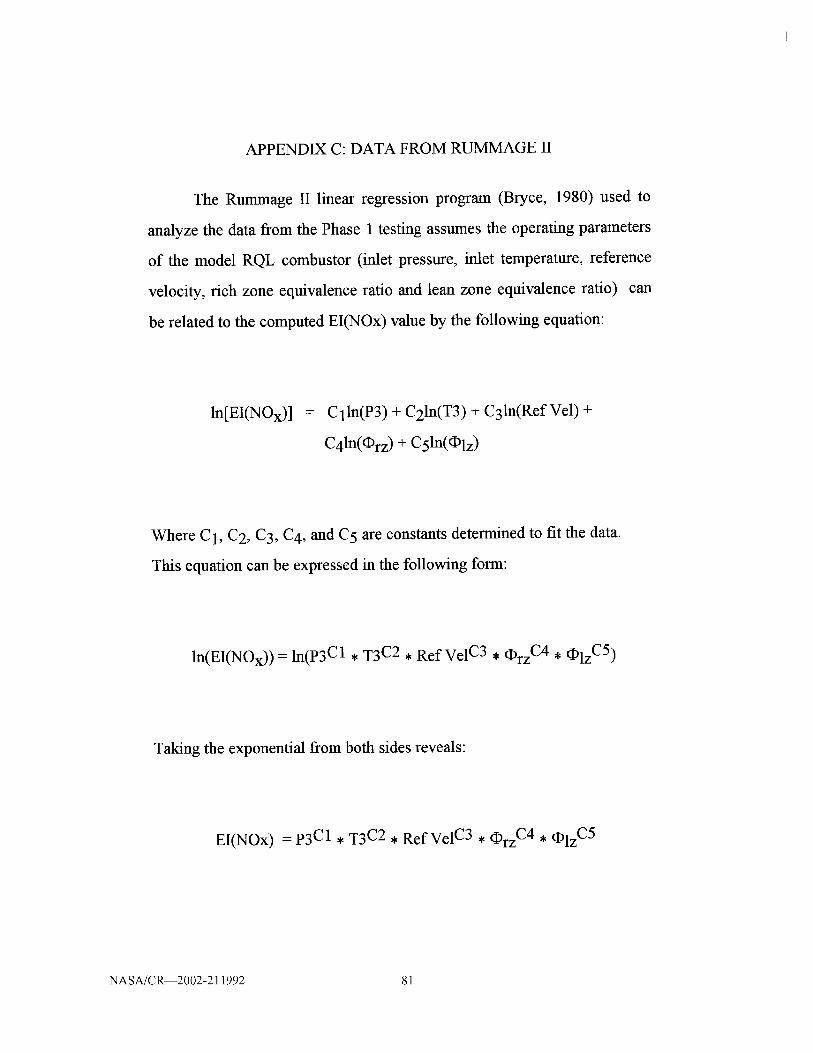
APPENDIX A: EI(NOx) EQUATION DERIVATION ................... 77
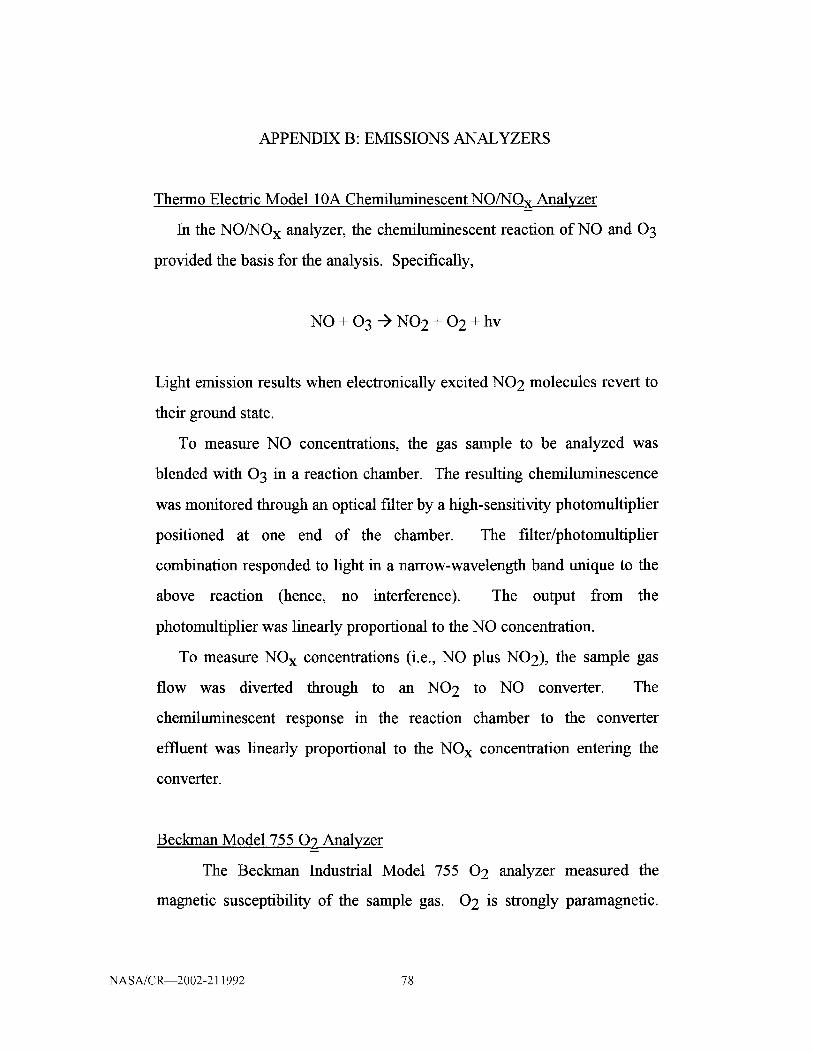
APPENDIX B: EMISSIONS ANALYZERS ................................... 78
APPENDIX C: DATA FROM RUMMAGE II ................................ 81
NASA/CR--2002- 211992 iv
Page 7
LIST OF SYMBOLS
C x = concentration of constituent x in ppm
EI(X) = Emissions Index for X (gins X / kg fuel)
k = rate of reaction
Mf = molecular weight of fuel
Mp = molecular weight of products of combustion
n C = number of atoms of carbon in one molecule of fuel
P = pressure
R = Universal Gas Constant
r = hydrogen to carbon atom ratio in fuel molecule
T = absolute temperature
= equivalence ratio
_1 = combustion efficiency
LIST OF SUBSCRIPTS
eq = equilibrium
lz = lean zone
rz = rich zone
NASA/CR--2002- 211992 v
Page 9
1.0 INTRODUCTION
1.1 OVERVIEW
As gas turbine technology advances into the 21st century, combustion
engineers are faced with the challenge of achieving higher compression
ratios and higher turbine inlet temperatures in aero gas turbine engines. At
the same time, as interest in pollutant emissions from gas turbines increases,
combustion engineers are also required to consider new means for pollutant
reduction.
In the past, aero gas turbine engine designers have sacrificed emissions
to attain greater flight speeds and altitudes. For today's aero gas turbine
engines, it is necessary to reduce these emissions, while at the same time,
maintaining these same speeds and altitudes. In some European countries,
airlines are being taxed for NO x emissions in their airspace. Concern for
pollutant reduction is particularly strong for the next generation of aircraft,
represented by the High Speed Civil Transport, which is being designed to
fly at stratospheric altitudes. In the stratosphere, NOx emissions could
contribute to ozone depletion. (Johnston, 1971)
To achieve this reduction in NO x emissions, engine designers have been
challenged to evaluate various combustor configurations. One promising
configuration is the three-stage RQL combustor. In the RQL (rich burn -
quick mix - lean burn) combustor, air is mixed with the fuel in two stages.
In the primary zone of the combustor, a fraction of the total air is reacted
with the fuel to form a fuel rich combustion mixture. By operating rich of
stoichiometery, the flame temperature is reduced and an active pool of
hydrocarbon is produced which can reduce NO formed. Downstream, the
remaining air is added to the fuel rich product mixture via dilution jets to
NASA/CR 2002-211992 1
Page 10
form a fuel lean mixture in the secondary zone. Operating lean of
stoichiometric keeps the combustion temperature low and also eliminates
carbon monoxide (CO) and unbumt hydrocarbons (UHC).
To date, the reduction of NO x from staged RQL type combustors
operating at atmospheric, low temperature inlet conditions has been well
documented. Staged combustion has been demonstrated successful at
reducing thermal and fuel NO at atmospheric conditions with no air preheat
(Yamagishi, et al, 1975; Be6r, et al, 1982), and at atmospheric conditions
with air preheat up to 600 K (Sadakata, et al, 1981).
However, little information exists for the RQL's low NOx potential
when operating at temperatures and pressures that correspond to actual gas
turbine engines. A full evaluation of the RQL, for use in stationary and
aero applications, requires a systematic study of the effects of current, as
well as futuristic, operating conditions on the emissions of NOx and
combustion efficiency.
This study seeks to establish the effects of typical HSCT operating
conditions on emissions production by examining the roles inlet
temperature, pressure, reference velocity, rich zone equivalence ratio, and
lean zone equivalence ratio play in the production of emissions, particularly
NOx, from a model rich bum - quick mix - lean bum combustor in the fuel
rich zone (first stage) and the fuel lean zone (third stage). Mixing within
the quick mix zone (second stage) at realistic operating conditions is
addressed in a separate thesis (Kroll, 1993).
1.2 GOALS AND OBJECTIVES
The two main goals of this research are to characterize the performance
of the RQL combustor at elevated inlet temperatures and pressures and to
NASA/CR 2002-211992 2
Page 11
determine the significance of various operating parameters on NOx
emissions and combustion efficiency. To achieve these goals, four
objectives were established.
1. Modify an existing testing facility in order to make it capable of
simulating actual gas turbine engine combustor operating conditions.
2. Develop a model RQL combustor that would simulate the plenum feed
characteristic of practical gas turbine combustor hardware.
3. Obtain exit plane emissions data for the RQL combustor operated under
various conditions.
. Identify where NO x production is occuring by operating the model RQL
combustor at realistic conditions and obtain emissions profiles at the
exit of the rich zone and entrance of the lean zone as well as exit plane
measurements.
NASA/C_2002-211992 3
Page 12
2.0 BACKGROUND
2.1 GAS TURBINE ENGINES
2.1.1 AERO GAS TURBINES
Aero gas turbines do not vary greatly in their general design constraints.
They all operate on a limited range of fuels and produce power for one type
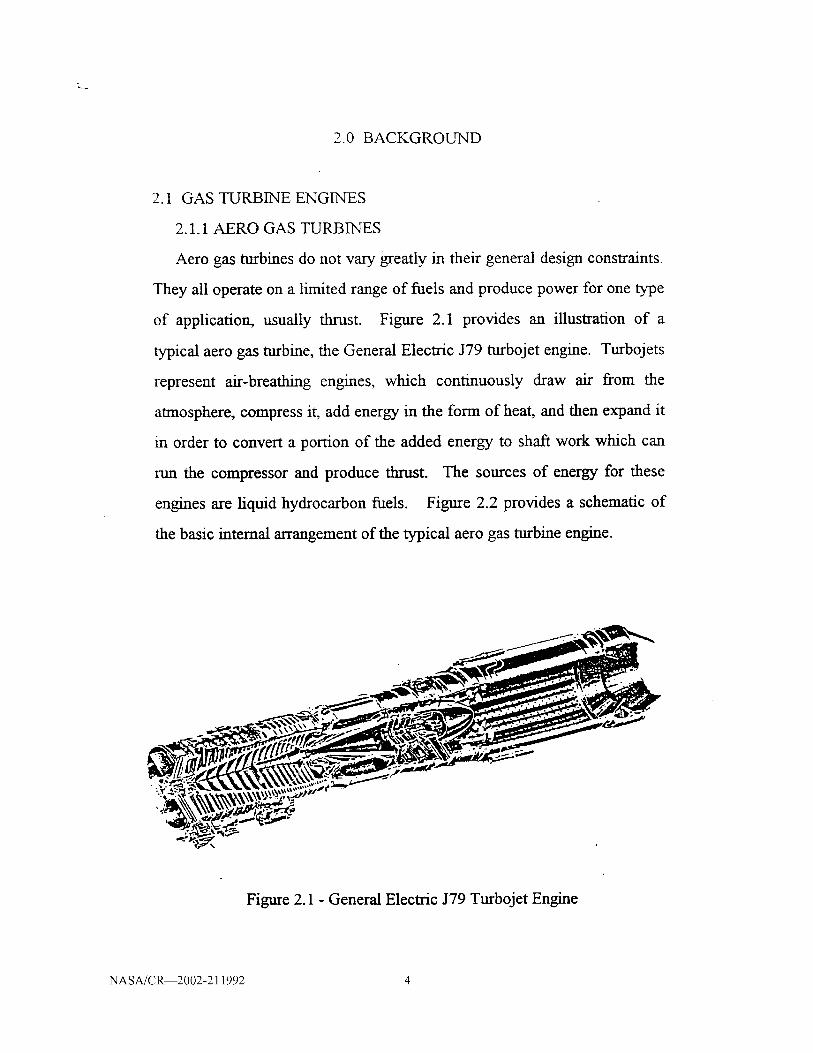
of application, usually thrust. Figure 2.1 provides an illustration of a
typical aero gas turbine, the General Electric J79 turbojet engine. Turbojets
represent air-breathing engines, which continuously draw air from the
atmosphere, compress it, add energy in the form of heat, and then expand it
m order to convert a portion of the added energy to shaft work which can
run the compressor and produce thrust. The sources of energy for these
engines are liquid hydrocarbon fuels. Figure 2.2 provides a schematic of
the basic internal arrangement of the typical aero gas turbine engine.
Figure 2.1 - General Electric J79 Turbojet Engine
NASA/CR 2002-211992 4
Page 13
Dif._fu_ser Turl e __Nozzle
iii J;f _ + Fn i__"- 1
-,
) @
Figure 2.2 - Schematic of Aero Gas Turbine Engine
The numbers assigned to the various points within the engine are based
on the system established in MIL-E-5007 (Mattingly, 1987). This system
can be applied to all forms of aircraft engine and divides the engine into
commonly numbered major zones. Between each zone, the air passing
through the engine undergoes a specific process. These various processes
(see Figure 2.2) can be broken down into the following steps (Peterson &
Hill, 1965):
a-l:
1 -2:
2-3:
From far upstream, where the velocity of the air relative to the
engine is the flight velocity, the air is brought to the intake,
usually with some acceleration or deceleration.
The velocity is decreased as the air is carried to the
compressor inlet through the inlet diffuser and ducting
system.
The air is compressed in the dynamic compressor. The
compression ratio for the compressor is a fixed value usually
NASA/CR 2002-211992 5
Page 14
3 -4:
4-5"
5 -6:
6 - 7:
predetermined to provide a minimum fuel consumption to
thrust ratio for a specific flight velocity.
The air is "heated" by the mixing and burning of fuel in the
air.
The air is expanded through the turbine to obtain power to
drive the compressor.
The air may or may not be further "heated" by the addition
and burning of more fuel in an afterburner.
The air is accelerated and exhausted through the exhaust
nozzle to produce thrust.
w
<n_W
_swI-
)
b
®I i I
ENTROPY
NON-AFTERBURNER
,,=,I-
®
®
1 I I I I I
ENTROPY
AFTERBURNER
Figure 2.3 - Thermodynamic Representation of Aero Gas Turbine Engine
NASA/C_2002-211992 6
Page 15
These processes, with and without the addition of the afterburner are
presented on an entropy vs. temperature thermodynamic chart in Figure 2.3.
From these charts it is clear that, at the entrance to the combustor, the air is
at an elevated temperature and pressure. It is also clear that these
combustor inlet conditions are dependent on both the flight conditions of
the engine (point a), and the compression ratio of the dynamic compressor
(points 2 to 3). For a given compression ratio, the inlet temperature and
pressure to the combustor will increase with increases in atmospheric air
density and temperature. Therefore, at take off and early climb, when the
air brought into the engine is at 101.3 kPa and 295 K, the inlet conditions to
the combustor will be much higher than at high altitude cruise, where the
air density and temperature is much lower. Similarly, for a given flight
condition, the inlet conditions to the combustor will be higher for a
compressor with a higher compression ratio.
The inlet conditions to the combustor are also dependent on the aircraft
flight speed. The total pressure of the air entering the engine is the sum of
the static pressure and the pressure due to ram. For flight speeds less than
Mach 1.5, the pressure due to ram is negligible. However, for speeds
greater than Mach 1.5, the pressure due to ram increases with air speed as
depicted in Figure 2.4. (Pratt &Whitney, 1988)
Air inlet temperature can also rise as a result of ram. The total
temperature of a moving gas is the ambient temperature plus the rise due to
ram effect. The relation between temperature and air speed is illustrated in
Figure 2.5. (Pratt & Whitney, 1988)
NASA/CR 2002-211992 7
Page 16
t_
o..v
0_
Et__Z
20O0
1000
5OO
100
Mach 4.,_
Mach 3._;J
Mach 15 _¢_Maeh 2.0
I _1 I I I I
Mach 1.0
I I600 700 800 900 1000 1200 2000
True Air Speed (knots)
Figure 2.4 - Ram Pressure vs. Airspeed
2000I..1_
1000
r'_E 500I1)I-
E 100
0
Mach 4._
-- Mach 3.0f
Mach 1.0 2.0
-I I I I I I I I I600 700 800 900 1000 1200 2000
True Air Speed (knots)
Figure 2.5 - Temperature vs. Airspeed
Modem aircraft typically operate at altitudes between 7500 m to 11000
m and have compression ratios between 15 and 20 (Mattingly, 1987). At
this altitude the ambient air has roughly a pressure of 27.5 kPa (30% sea
level) and an absolute temperature of 236 K (80% sea level) (ICAO, 1958).
NASA/C_2002-211992 8
Page 17
Since the flight speed is less than Mach 1, ram has little effect and the
combustor inlet conditions usually approach 620 kPa and 700 K.
At high altitude cruise, turbojets only operate at 70 to 80% maximum
thrust. At take off and low altitude climb, typical turbojets operate at 100%
thrust. The ambient air is 101.3 kPa and 294 K. Again, since the air speed
is low, ram effects can be neglected. For these operating conditions, the
combustor inlet conditions can increase to almost 2070 kPa and 820 K.
Futuristic aircraft, such as the High Speed Civil Transport, that will
operate at stratospheric altitudes (around 18500 m) and at supersonic
velocities (Mach 2 to 3) can achieve this increase in speed with greater
compression ratios. At an altitude of 18500 m, the ambient air will have a
temperature of 222 K and a static pressure of 5.0 kPa. At an air speed that
exceeds Mach 1.0, the effects of ram have to be considered. At Mach 2.0,
for example, the inlet air to the engine will have a pressure of 41 kPa and a
temperature of 340 K. For a compression ratio of 25, this will result in
combustor inlet conditions of 1033 kPa and 900 K.
2.2 EMISSIONS FROM GAS TURBINE COMBUSTORS
2.2.1 NOx
Of the many harmful pollutants found in gas turbine emissions, oxides
of nitrogen, or NOx, require the most attention. At most operating
conditions, the bulk (in excess of 90%) of NOx produced is in the form of
NO.
There are four processes by which NO can be formed during
combustion reactions: thermal NO production, prompt NO production, NO
produced by fuel-bound nitrogen (Brady et al., 1991) and low temperature
NO (Westbrook, 1992). In applications involving practical gas turbine
NASA/CR 2002-211992 9
Page 18
combustors, thermal NO is the most significant of these processes, with
Prompt NO being the only other significant contributor.
Thermal NOx is produced by oxidation of atmospheric nitrogen in post
flame gases. The formation of thermal NO can be illustrated by the three
reactions composing the extended Zeldovich mechanism (Miller &
Bowman, 1991; Glassman, 1987; Samuelsen, 1975; Zeldovich, 1946)listed
on the following page.
N2+O ¢:> NO + N
N+O 2 ¢_ NO + O
N+OH ¢_ NO + H
Since the first of these three reactions is the rate limiting reaction, the
Zeldovich method can be simplified to:
d[NO]/dt = const( [N2][O ] exp(-E/RT))
In this simplified model, NO production increases linearly with the local
concentrations of N 2 and O and exponentially with reaction temperature.
The temperature dependence of this model becomes important for
temperatures exceeding 1900 K. The significance of the 1900 K reaction
temperature is related to the breaking of the triple bond in molecular
nitrogen (N2) which must occur in order for the first reaction of the
Zeldovich mechanism to proceed.
NASA/CR 2002-211992 10
Page 19
Prompt NO, which can also be formed in gas turbine combustion
processes, is produced by high-speed reactions at the flame front.
Unfortunately, the specific mechanisms of prompt NO are not well
understood. Attempts to characterize the formation of prompt NO are
complicated by the presence of super equilibrium O-atom concentrations in
and near the primary combustion zone which temporarily accelerate the
production of thermal NO by the Zeldovich mechanism. (Herbefling, 1976;
Fenimore, et al., 1987; Miller & Bowman, 1991) This sudden increase in
NO can be mislabeled as prompt NO.
The basis for the prompt NO mechanism is believed to be reactions
involving fragmented hydrocarbons attacking atmospheric nitrogen
(Fenimore, 1971 and Haynes, et al., 1975). The most significant of these
reactions are considered to be:
CH+N 2 ¢_ HCN+N
CH 2+N 2 _:_ HCN+NH
CH 2+N 2 ¢_' H2CN+N
C+N 2 ¢_ CN+N
An additional component of the prompt mechanism may parallel the
mechanism for fuel-nitrogen derived NO with the HCN eventually forming
an ammonia species (Haynes, et al., 1975). The final step of the prompt
NO mechanism involves the oxidation of amines or cyano species to NO
(Miller and Bowman, 1990). Since, at present, a detailed understanding of
NASA/CR 2002-211992 11
Page 20
the prompt NO mechanism is unavailable, it is unclear whether the prompt
NO mechanism plays a significant role in the formation of NO x in gas
turbine engines operating at realistic conditions.
2.2.2 CO AND UHC
Carbon monoxide (CO) is a product of incomplete combustion and can
be formed as a result of inadequate burning rates in the primary zone,
insufficient residence times, inadequate mixing of the fuel or quenching of
the primary zone post flame products by dilution air. (Lefebvre, 1983) The
oxidation of CO to CO 2 is dependent on residence time and flame
temperature. For high temperatures, the oxidation process revolves around
the reaction:
CO+OH --) CO2+H
which is a fast reaction. For lower temperatures, the oxidation process
revolves around the reaction:
CO+H20 --) CO 2+H2
Unburned hydrocarbons, or UHC, include fuel that emerges from the
exit of the combustor as either liquid or vapor, and products of the thermal
degradation of the parent fuel into species of lower molecular weight, such
as methane. The formation of UHC can be linked to poor atomization,
inadequate burning rates, or quenching from dilution air.
NASA/CR 2002-211992 12
Page 21
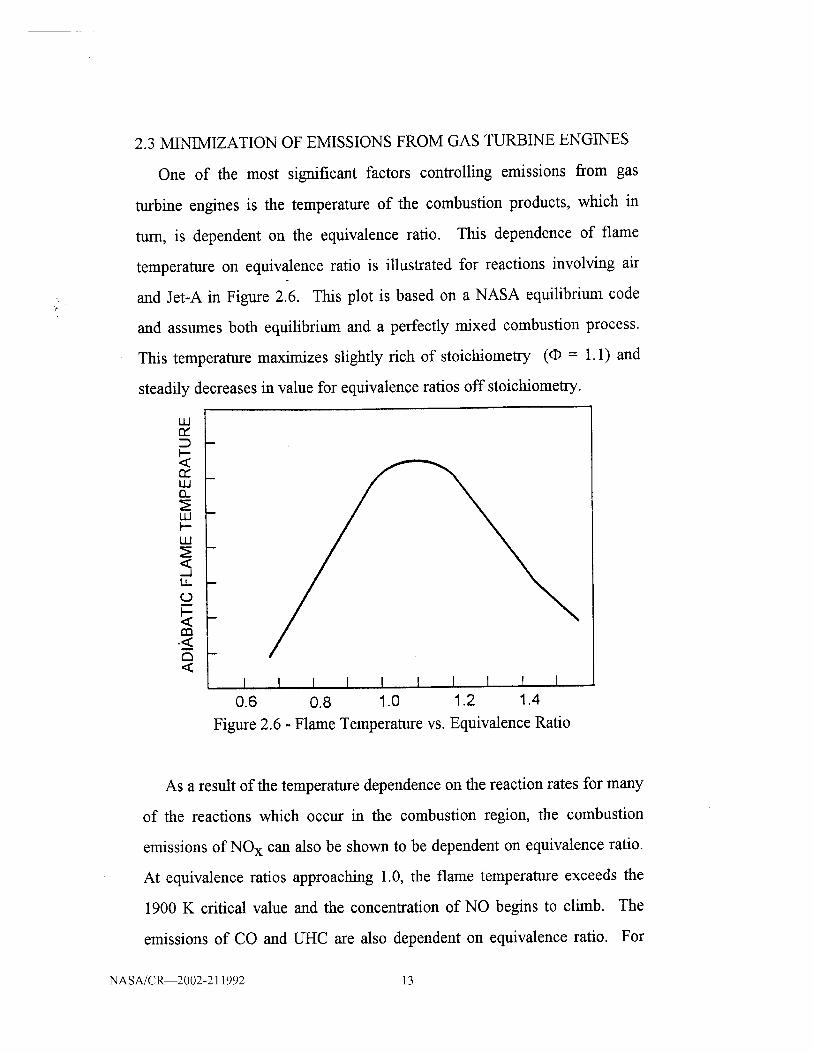
2.3 MINIMIZATION OF EMISSIONS FROM GAS TURBINE ENGINES
One of the most significant factors controlling emissions from gas
turbine engines is the temperature of the combustion products, which in
ram, is dependent on the equivalence ratio. This dependence of flame
temperature on equivalence ratio is illustrated for reactions involving air
and Jet-A in Figure 2.6. This plot is based on a NASA equilibrium code
and assumes both equilibrium and a perfectly mixed combustion process.
This temperature maximizes slightly rich of stoichiometry (_ = 1.1) and
steadily decreases in value for equivalence ratios off stoichiometry.
tad
<
t.iJ{2.
U.I
U.I
<...IIt.
O
1:13.<tm<
m
m
w
m
m
I I I I I I I I I I
0.6 0.8 1.0 1.2 1.4
Figure 2.6 - Flame Temperature vs. Equivalence Ratio
As a result of the temperature dependence on the reaction rates for many
of the reactions which occur in the combustion region, the combustion
emissions of NO x can also be shown to be dependent on equivalence ratio.
At equivalence ratios approaching 1.0, the flame temperature exceeds the
1900 K critical value and the concentration of NO begins to climb. The
emissions of CO and UHC are also dependent on equivalence ratio. For
NASA/C_2002-211992 13
Page 22
fuel rich mixtures, the presence of excess fuel results in incomplete
combustion. Unburned fuel, in the form of either liquid or vapor, is
exhausted out of the combustor along with other indicators of incomplete
combustion such as CO. Thus, as the equivalence ratio increases past
stoichiometry, the concentration of CO and UHC increase. For fuel lean
reactions, excess oxygen results in the complete oxidation of the majority of
the CO and hydrocarbon species. Thus, as the equivalence ratio decreases
past stoichiometry, the concentration of CO and UHC approaches
equilibrium concentration levels. The dependence of these various
emission concentrations on equivalence ratio are illustrated in Figure 2.7.
//
//
//
i i
0.1 0.3
7"-
! \ .,''"/ \
/ \I \ .'"
I \ ,,"!
I \\ .'" "
I \.,'"
,.'" \\
r ='l-'n I
0.5 0.7 0.9 1.1 1.3 1.5 1.7 1.9
Equivalence Ratio
.... NOx (Vol %)*20
....... CO (Vol %)
-- UHC (PPM)
Figure 2.7 - Emissions vs Equivalence Ratio
From this figure, it is clear that the simplest way to reduce NOx
formation in a gas turbine is by operating either rich or lean. Although both
NASA/C_2002,211992 14
Page 23
approaches reduce flame temperature and thereby NOx, each approach
(operating either lean or rich) has its disadvantages.
Operating lean will significantly reduce the flame temperature and
consequently NOx emissions. However, fuel lean combustion in the dome
region of a gas turbine has stability problems.
Operating rich will reduce NO x production in three ways. First, thermal
NOx formation is decreased by reducing the flame temperature. Second,
by operating with a fuel rich mixture, the concentration of available oxygen
atoms is reduced. As a result, the production rate of NO decreases. Third,
fuel rich combustion provides a large concentration of NO x consuming HC
radicals. However, fuel rich combustion produces excessive amounts of
CO and unburned hydrocarbons (UHC). Staged combustion offers the
means to utilize the rich bum advantages while avoiding the disadvantages
inherent in both rich and lean combustion.
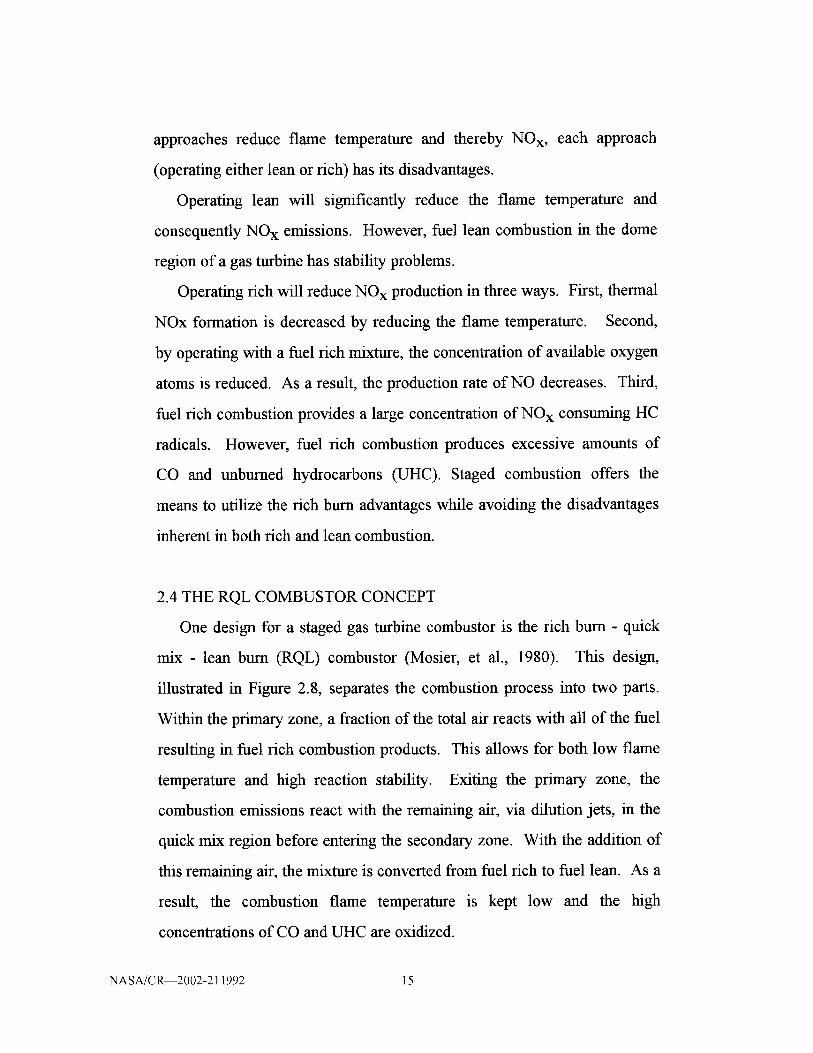
2.4 THE RQL COMBUSTOR CONCEPT
One design for a staged gas turbine combustor is the rich bum - quick
mix - lean bum (RQL) combustor (Mosier, et al., 1980). This design,
illustrated in Figure 2.8, separates the combustion process into two parts.
Within the primary zone, a fraction of the total air reacts with all of the fuel
resulting in fuel rich combustion products. This allows for both low flame
temperature and high reaction stability. Exiting the primary zone, the
combustion emissions react with the remaining air, via dilution jets, in the
quick mix region before entering the secondary zone. With the addition of
this remaining air, the mixture is converted from fuel rich to fuel lean. As a
result, the combustion flame temperature is kept low and the high
concentrations of CO and UHC are oxidized.
NASA/CR 2002-211992 15
Page 24
QUICK MIXAIR __
SWIRLER AIR
FUEL __
\
RICH ZONE QUICKMIX ZONE
LEAN ZONE
Figure 2.8 - The Rich Burn - Quick Mix - Lean Bum Combustor
2.4.1 PREVIOUS UCI RQL RESEARCH
Brady et al. (1990) studied the operation of the first stage of the RQL,
the rich zone. These studies involved the effects of dome geometry on
mixing in a rich bum combustor operating at atmospheric conditions
without inlet air preheat.
It was concluded from these studies that a significant relationship
existed among the rich zone control variables (nozzle air to fuel ratio,
reference velocity, swirl strength, inlet geometry and rich zone length) and
the degree of mixing. These studies concluded that increases in nozzle fuel
to air ratios and reference velocity led to enhanced fuel-air mixing over the
range of the experiment. In addition, co-swirling inlet fuel and air streams
had superior mixing but reduced stability compared to counter-swirling
flows.
NASA/CR--2002-211992 16
Page 25
2.4.2 ADDITIONAL RQL RESEARCH
The RQL concept, as a means for NOx reduction, has been established
for atmospheric cases with and without preheat. In Yamagishi, et al., 1975,
an RQL combustor was demonstrated to be successful at reducing thermal
and fuel NO at atmospheric conditions with no air preheat Sadakata, et al.,
in 1981 compared emissions from a two-stage RQL type stationary
combustor with those from a single stage combustor. This research also
investigated the effects of preheat and determined that NO production
increased with increased inlet temperature. Be6r, et al., (1982),
demonstrated lower NO emissions from a RQL type combustor employing
coal liquid fuels.
However, the effects of pressure by itself, and in conjunction with inlet
temperature, on NO production from an RQL combustor have yet to be
significantly addressed. This study helps to develop an tmderstanding of
these effects.
NASA/CR 2002-211992 17
Page 26
3.0 APPROACH
As mentioned in Section 1.2, the two main goals of this research were to
demonstrate the operation of the RQL combustor at realistic operating
conditions and to determine the significance of various operating
parameters on NO x emissions and combustion efficiency at realistic
conditions. To achieve these goals, the research was divided into three
tasks, with each task addressing a separate objective.
. The first task of the research involved modifying an existing testing
facility in order to make it capable of simulating actual gas turbine
engine combustor operating conditions. This task of the research is
detailed in Section 4.1 of this report.
. The second task of the research involved the development of a model
RQL combustor that would simulate the plenum air feed of real gas
turbine engines. This phase of the research is detailed in Section 4.2 of
this report.
° The third task of the research involved the acquisition of emissions data
from the model combustor operated at realistic conditions. This task
was divided into four parts: experimental development, flow splits tests,
Phase 1 emissions testing, and Phase 2 emissions testing. During the
experimental development, operating parameters to be examined in
relation to NO/NOx emissions were selected. During the flow splits
testing, the plenum feeding of the model RQL combustor was examined
and characterized. During the Phase 1 testing the influence of several
NASA/CR 2002-211992 18
Page 27
operating parameters on NO x emissions and combustion efficiency
would be evaluated. And fmally, during the Phase 2 testing, emission
profiles would be obtained at the exit of the rich zone and the entrance
to the lean zone of the model combustor, while the combustor was
operated at realistic conditions. This phase of the research is detailed in
section 4.3 of this report.
NASA/CR 2002-211992 19
Page 28
4.0 EXPERIMENT
to 920 K and
0.566 m3/s.
1500 kPa.
4.1 TESTING FACILITY
4.1.1 EXISTING FACILITY
The investigation was conducted in a modified high pressure gas turbine
combustor facility at UCI. This facility was originally designed and built to
study high pressure fuel spray atomization (Dreunan, 1990). In addition, it
could incorporate model combustors with optical access that could be
probed with laser-based and conventional diagnostics. As originally
conceived, this facility could operate at inlet air temperatures and pressures
1700 kPa respectively. The maximum air flow possible was
The maximum fuel flow was 10 gph, with pressures up to
The central component of the test facility was the high pressure vessel
housing the model combustor. This vessel, depicted in Figure 4.1,
consisted of a plenum air inlet manifold, a vertically traversable nozzle
tube, a plenum chamber into which a model can combustor could be
mounted, and a water cooled exhaust section.
The vertically traversable nozzle tube was situated on the central axis of
this vessel and consisted of a 25.4 mm diameter stainless steel tube housing
a 6.4 nun fuel tube. High pressure fuel was supplied through the inner 6.4
nun tube, while fuel atomization air passed through the annulus between the
6.4 mm and 25.4 mm tubes. The inside bottom of the fuel tube was
threaded to accommodate a variety of different air assist nozzles.
Traversing was accomplished with a stepper motor and electronic control
system. The model can combustor was mounted to this nozzle tube, and
thus could also be traversed vertically.
NASA/CR 2002-211992 20
Page 29
PRESSUREVESSEL
PLENUM AIR INLET
='TICAL Wl N DOWS
EXHAUST -_
EXHAUST TEE
EXIT-PLANEMISSIONS PROBE
EXHAUST COOLINGWATER INJECTION
Figure 4.1 - The High Pressure Vessel
The walls of the plenum air inlet manifold and the plenum chamber
were fabricated out of 25.4 mm thick chrome-moly steel and were rated to
NASA/C_2002-211992 21
Page 30
withstand pressures up to 1722 kPa at temperatures not exceeding 760 K.
The inner diameter of the plenum chamber was 38 cm.
Air entering the vessel through the manifold was first directed upward to
acheive pressure uniformity and then downward through a flow
straightener. This flow straightener consisted of a series of fine stainless
steel screens and helped insure a uniform flow into the plenum chamber. A
high temperature braided rope seal mounted between the model combustor
and the plenum chamber's exhaust seal tube insured minimal ah" leakage out
of the plenum chamber around the combustor. Therefore, once inside the
plenum chamber, the air was restricted to exit through the model
combustor.
Two doors, mounted 180 ° apart, allowed for access to the model
combustor. In addition, two 17.8 cm diameter, 5 cm thick, fused quartz
windows allowed for visual monitoring of the model combustor during
tests.
The exhaust section of the vessel, located at the bottom, was cooled
through the use of three spatially mounted water spray tubes. A high
pressure water pump was utilized to maintain a steady flow of cooling
water to the exhaust section.
The air supply system utilized three 300 HP rotary air compressors and
a positive displacement booster compressor. Working in parallel, the two
standard compressors were capable of supplying 1000 SCFM of air
pressurized to 1033 kPa. Working in series with the booster compressor,
the compressors could supply 1000 SCFM of air pressurized to 3446 kPa.
After exiting the booster compressor, the air supply was piped into the
high pressure facility where it was separated into two flows. The bulk of
the air flow was directed into the plenum air line which fed into the high
NASA/CR 2002-211992 22
Page 31
pressure vessel's plenum chamber. A small portion of the air was directed
into a nozzle air line.
The flow rate of air through both air lines was regulated with a
pneumatic control valve and a sonic venturi. In both air lines, high pressure
air, from the booster compressor, passed through the pneumatic valve and
then through the sonic venturis. By choking the flow in the orifices of these
venturis, the flow rate of air downstream of the venturis became linearly
dependent on the pressure upstream of the venturis. The pressure upstream
of the venturies was controlled with the pneumatic valve. For the plenum
air supply line, the sonic venturi calibration curve was:
Upstream Pressure (psia) = 0.405 (air flow in SCFM) - 9.80
Two different sonic venturis were used for the nozzle air supply line.
Each supplied a different range of flows. The smaller of these venturis
supplied flow rates between 1 and 15 SCFM. Its calibration was:
Upstream Pressure (psia) = 18.484 (air flow in SCFM) - 5.305
The larger of the two venturies allowed for air flows between 10 and
150 SCFM. The calibration for this venturi was:
Upstream Pressure (psia) = 2.101 (air flow in SCFM) - 5.002
The pressure within the vessel was controlled with a pneumatic valve
located after its exhaust. The pressure in the system was regulated by
throttling the exhaust gas flow.
NASA/CR 2002-211992 23
Page 32
Figure 4.2 illustrates the air supply system.
NOZZLE AIRLOW PRESSURE t'_ _ i¢_
A,R,._ET= _ y y l_yREGULATOR I
I Em SONICI CONTROL VENTURI
I VALVE NOZZLE
AIR INLET
PLENUM AIR '
PRESSURE
VESSEL
PREHEATER
Figure 4.2 - Air Supply System
The fuel supply system utilized a Pulsafeeder pulsating pump to draw
fuel from a 13 gallon fuel tank. The flow rate of fuel through the pump
could be regulated electronically, and varied from 0 to 10 gph. If the 13
gallon fuel tank was pressurized to 150 kPa with nitrogen, the flow rate
through the pump could be increased to 17 gph. The flow rate of the fuel
through the pump was also dependent on the pressure downstream of the
pump. At higher downstream pressures, lower flow rates were expected.
At 1033 kPa downstream, the maximum fuel flow rate was only 6 gph.
The rate of fuel flow to the combustor was regulated through the use of two
bypass valves in addition to the fuel coarse and free feed valves. The fuel
system utilized a flow turbine meter, which converted flow rate to Hertz, to
determine the flow rate of fuel to the vessel.
NASA/C_2002-211992 24
Page 33
4.1.2 MODIFICATIONS
In order to achieve the operating conditions required for this research,
several modifications were made to this facility. These modifications
involved the addition of (1) increased air preheater capacity, (2) insulation
and refractory lining to the air lines and vessel, (3) a high pressure fuel
supply system, and (4) an emissions monitoring system.
Heaters. To provide the increased inlet air temperature needed to
simulate practical gas turbine engines, it was necessary to provide
additional preheat to the plenum air. This heating was accomplished
through the use of three electrical resistance heaters working in series.
These heaters were built by Watlow and were each capable of heated the air
flow to successively higher temperatures. The first of these heaters
(previously installed) was capable of heating 1200 SCFM to 700 K. The
second heater (new) increased the air temperature to 815 K. The third
heater (also new) could increase the temperature to 900 K. The nozzle
air supply was not heated prior to entering the high pressure vessel. Since
the ratio of nozzle air to plenum air was below 5%, the effects of this
deficiency were assumed to be minimal.
Insulation. The plumbing between the heaters and the high pressure
vessel was insulated with 5 cm of thick insulating blanket to prevent
excessive heat loss. Manufactured by Carborundum, this blanket, called
Fiberfrax, consisted primarily of fiberglass. The insulation, rolled around
the plumbing, was held in place with a wrapped coil of thin incolel wire.
The outer surface of the Fiberfrax was covered with a thin aluminum foil to
prevent flaking of the fiberglass.
NASA/CR 2002-211992 25
Page 34
Insulation was also added to the inner wall of the high pressure vessel.
(Figure 4.3) This insulation was a ceramic based refractory, consisting
primarily of A120 3, SiO 2, and CaO. Manufactured by Plibrico, this
refractory, called Plicast Airlight, had a service limit temperature of
1100 K. The thermal conductivity of this ceramic insulation was 0.65
btu,in/hr,ft2,OF. By applying a coat 25.4 nun thick to the inner wall of
the high pressure vessel, the maximum allowable temperature in the plenum
was increased to 1000 K. The addition of this insulation decreased the
plenum chamber inner diameter to 31.75 cm.
INLET NOZZLEMANIFOLD TUBE
CA,STABLE CERAMICREFRACTORY
ACCESS DOOR
MODELCOMBUSTOR
Figure 4.3 - Refractory Coating In High Pressure Vessel
The Plicast Airlight was water based and cast into place. The roof of
the high pressure vessel was removed and a round cardboard mold was
NASA/C_2002-211992 26
Page 35
inserted into the vessel. The dry refractory was mixed with water and
poured into the annular region between the mold and the inner vessel wall.
Prior to the pouring, 19 mm steel nails were welded to the inner wall of the
vessel. These nails served as anchors for the refractory once it dried. After
48 hours, the cardboard mold was removed and the refractory was
thermally treated for 1 hour at 1000 K by passing air through the electrical
heaters.
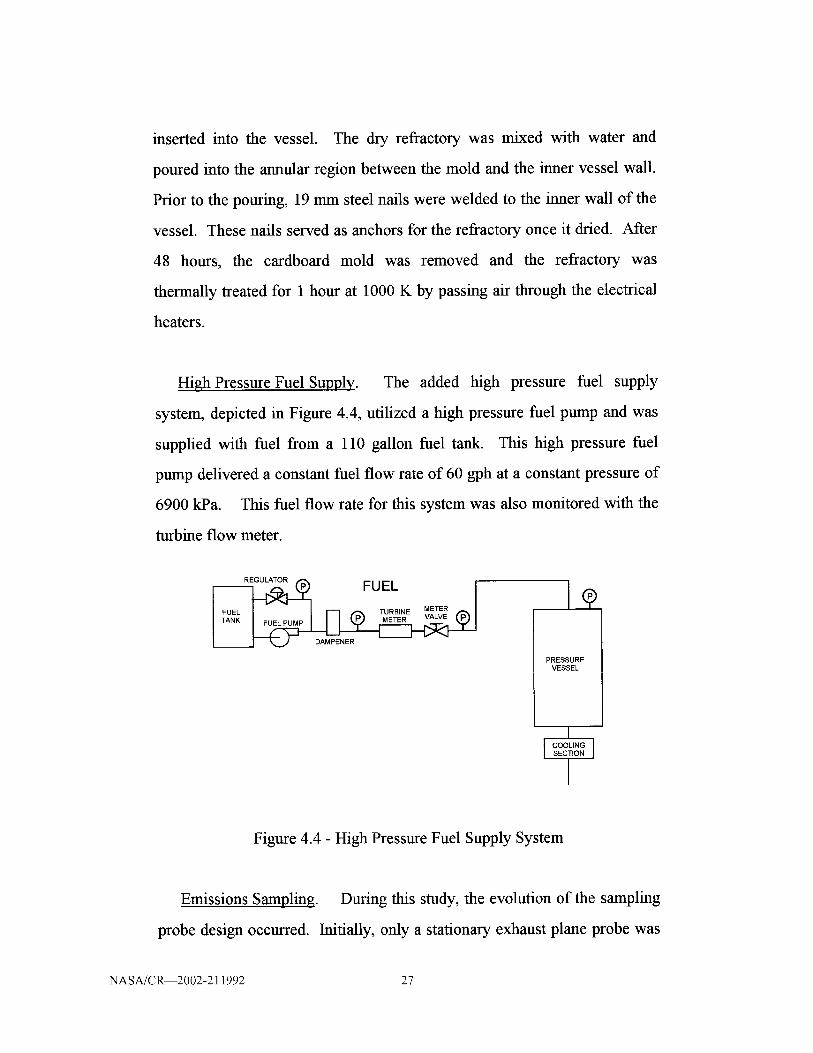
High Pressure Fuel Supply. The added high pressure fuel supply
system, depicted in Figure 4.4, utilized a high pressure fuel pump and was
supplied with fuel from a 110 gallon fuel tank. This high pressure fuel
pump delivered a constant fuel flow rate of 60 gph at a constant pressure of
6900 kPa. This fuel flow rate for this system was also monitored with the
turbine flow meter.
REGULATOR _ .....
FUFL
FUEL TURBINE METER
I I _ DAMPENER
PRESSURE I
VESSEL
Figure 4.4 - High Pressure Fuel Supply System
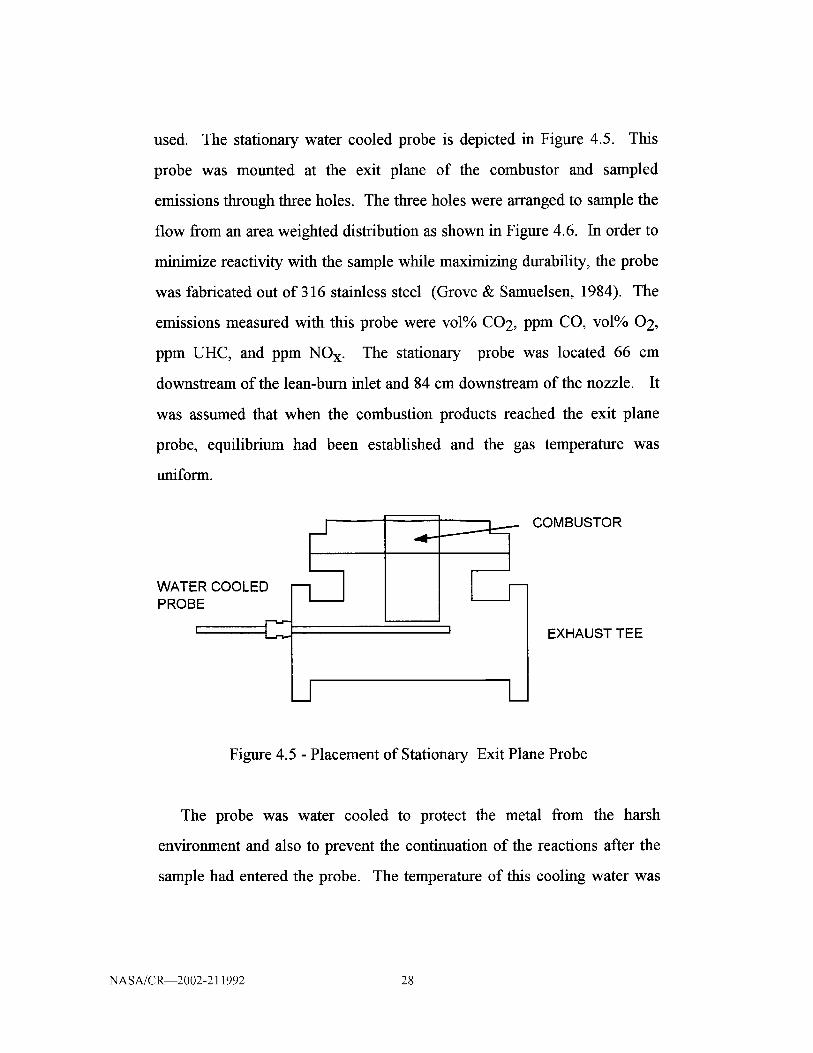
Emissions Sampling. During this study, the evolution of the sampling
probe design occurred. Initially, only a stationary exhaust plane probe was
NASA/CR 2002-211992 27
Page 36
used. The stationary water cooled probe is depicted in Figure 4.5. This
probe was mounted at the exit plane of the combustor and sampled
emissions through three holes. The three holes were arranged to sample the
flow from an area weighted distribution as shown in Figure 4.6. In order to
minimize reactivity with the sample while maximizing durability, the probe
was fabricated out of 316 stainless steel (Grove & Samuelsen, 1984). The
emissions measured with this probe were vol% CO 2, ppm CO, vol% 02,
ppm UHC, and ppm NO x. The stationary probe was located 66 cm
downstream of the lean-burn inlet and 84 cm downstream of the nozzle. It
was assumed that when the combustion products reached the exit plane
probe, equilibrium had been established and the gas temperature was
uniform.
WATER COOLED
PROBE
COMBUSTOR
I L
EXHAUST TEE
Figure 4.5 - Placement of Stationary Exit Plane Probe
The probe was water cooled to protect the metal from the harsh
environment and also to prevent the continuation of the reactions after the
sample had entered the probe. The temperature of this cooling water was
NASA/C_2002-211992 28
Page 37
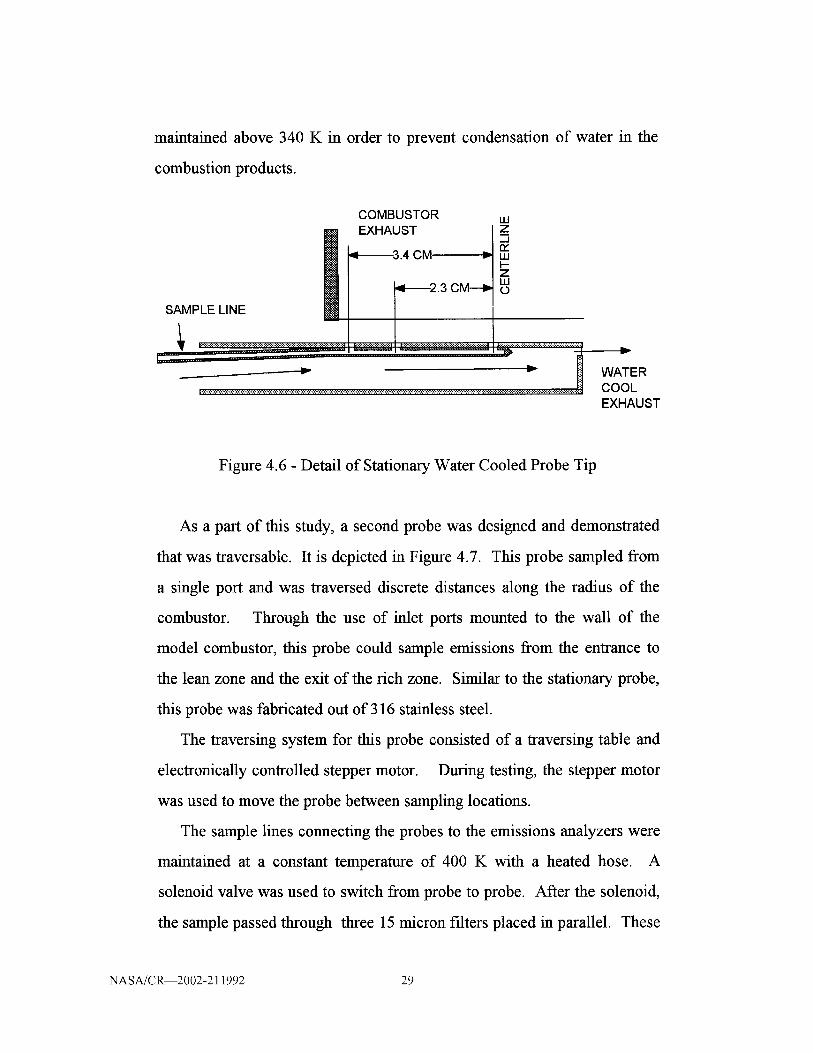
maintained above 340 K in order to prevent condensation of water in the
combustion products.
COMBUSTOR uJ
EXHAUST z
_ ,_3.40M _ _
SAMPLE LINE _L-___ _
R
EXHAUST
Figure 4.6 - Detail of Stationary Water Cooled Probe Tip
As a part of this study, a second probe was designed and demonstrated
that was traversable. It is depicted in Figure 4.7. This probe sampled from
a single port and was traversed discrete distances along the radius of the
combustor. Through the use of inlet ports mounted to the wall of the
model combustor, this probe could sample emissions from the entrance to
the lean zone and the exit of the rich zone. Similar to the stationary probe,
this probe was fabricated out of 316 stainless steel.
The traversing system for this probe consisted of a traversing table and
electronically controlled stepper motor. During testing, the stepper motor
was used to move the probe between sampling locations.
The sample lines connecting the probes to the emissions analyzers were
maintained at a constant temperature of 400 K with a heated hose. A
solenoid valve was used to switch from probe to probe. After the solenoid,
the sample passed through three 15 micron filters placed in parallel. These
NASA/CR 2002-211992 29
Page 38
filters reduced the amount of solids (soot) reaching the analyzers.
Following the filters, the sample flow was regulated again with a solenoid,
which diverted the flow to either the Emissions Console II (which analyzed
CO, 0 2, CO 2, NO, and NOx) or the Hot FID (which analyzed UHC).
Figure 4.8 presents the complete sample line.
rwOt---
WATER INLETD _ O RING SEAL SAMPLE EXHAUST
::::::::::::::::::::::::::::::::::::::::::::::::::::::::::::::::::::::::
---_ _ _iiii}iiiiiii_"_"- ..........................................NN ..................._ ml_
VESSEL WALL THREADED ROD FOR STEPPER
TRAVERSING SYSTEM MOTOR
PROBE TIP
DETAI L
WATER INLET
I I
I N_ I 'SAMPLE LINE
WATER OUTLET
Figure 4.7 - Traversing Probe
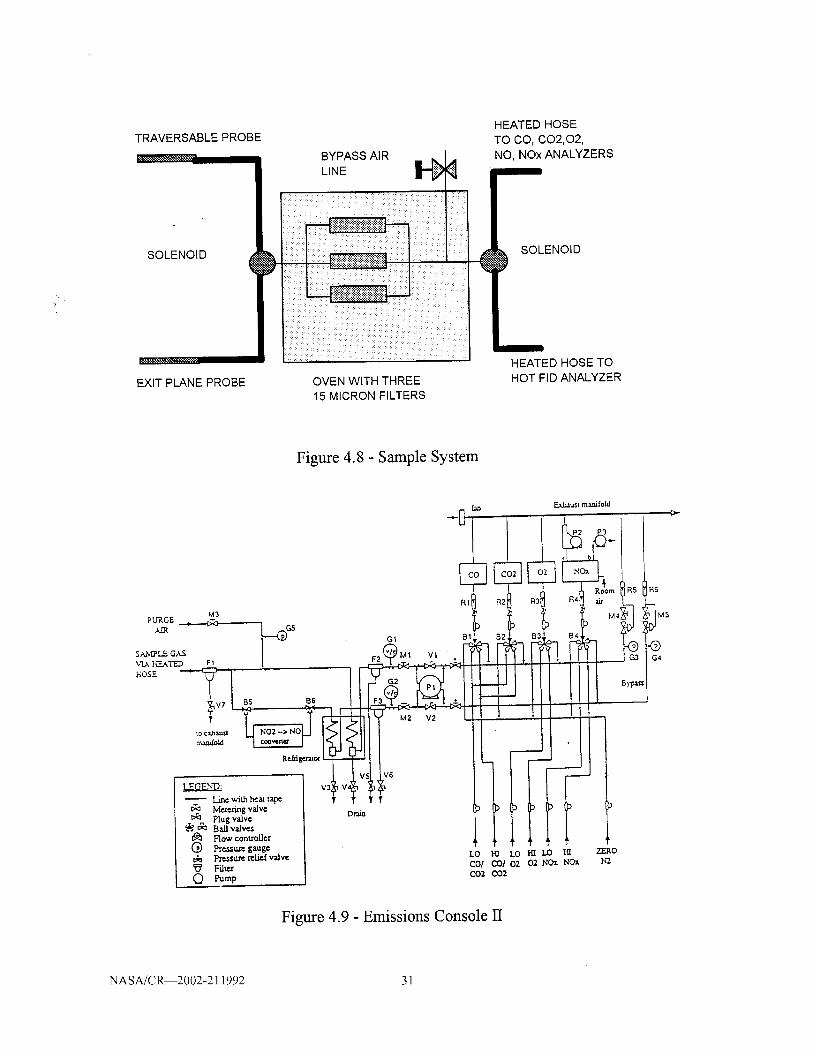
The Emissions Console II, presented in Figure 4.9, was built at UCI and
consists of a Horiba Model PIR 2000 CO analyzer, a Horiba Model PIR
2000 CO 2 analyzer, a Beckman Model 755 0 2 analyzer, and a Thermo
Electron Model 10A Chemiluminescent NO/NO x analyzer. The sample
was drawn into the EC II with a pump and sent through an ice bath which
condensed and removed the water. When the combustor was operated
trader pressure, the sample was pushed through the Emissions Console II
without the need of the pump.
NASA/C_2002-211992 30
Page 39
TRAVERSABLE PROBE
BYPASS AIR
LINE
HEATED HOSE
TO CO, CO2,O2,
NO, NOx ANALYZERS
SOLENOID SOLENOID
EXIT PLANE PROBE OVEN WITH THREE
15 MICRON FILTERS
HEATED HOSE TO
HOT FID ANALYZER
Figure 4.8 - Sample System
t.oom R5 R6
C_ G4
N2
Figure 4.9 - Emissions Console II
NASA/C_2002-211992 31
Page 40
Refer to Appendix B for a discussion regarding the operating principles
for the analyzers used.
4.2 MODEL RQL COMBUSTOR
Since it was desired to simulate the plenum feeding common to real gas
turbine combustors, the model RQL was designed without independently
controlled air inlet ports. Air from the plenum entered the combustor
through two openings: the aerodynamic swirler or the quick mix dilution
jets. As discussed in Section 4.1, the flow splits of air through these
openings was predetermined and constant.
Due to the extreme heat of reaction expected during testing (in
excess of 2100 K), the combustor was fabricated out of Hastelloy X and the
inner walls were lined with a high temperature refractory. Hastelloy X is a
nickel-based superalloy with good oxidation resistance at temperatures up
to 1500 K and moderately good strength properties up to 1144 K. It has
been used in jet engine exhaust nozzles, afterburner components, and
structural parts in burner and turbine components. (Mattingly, et al, 1987)
The refractory was silica based and could withstand temperatures up to
2255 K.
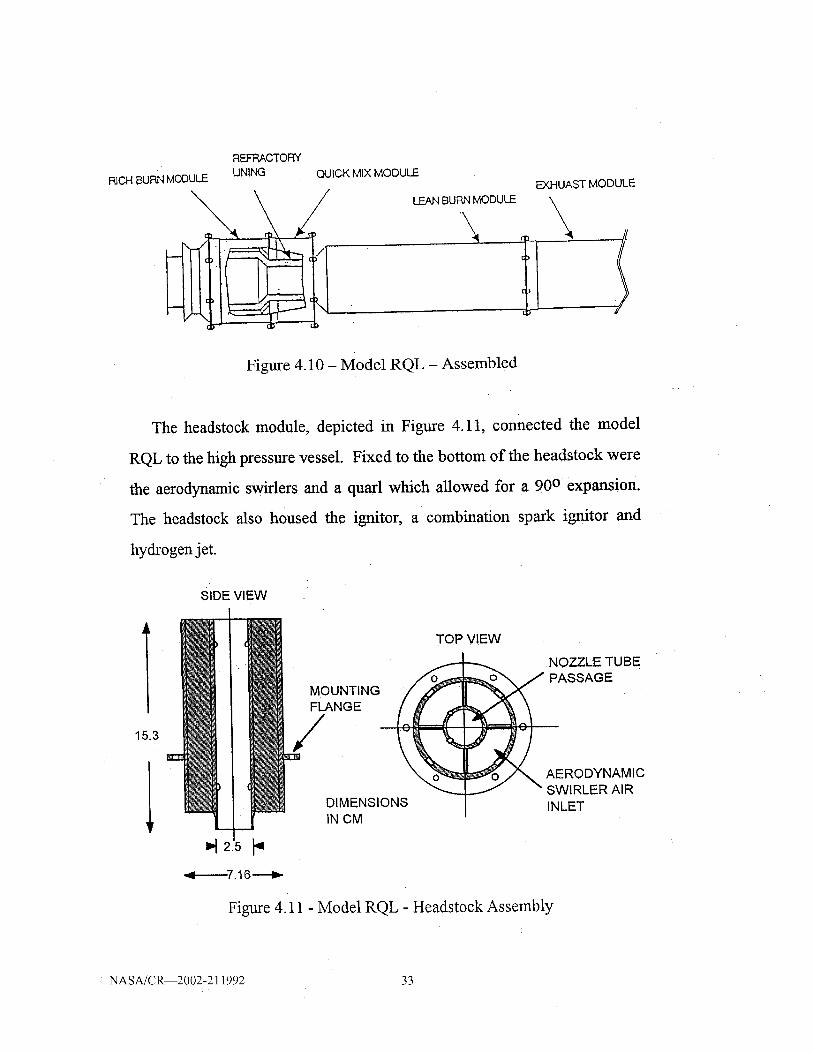
4.2.1 MODULAR DESIGN
The combustor was modular in design and consisted of five
components: the headstock, the rich zone, the quick mix zone, the lean zone
and the exhaust section. The modular design enabled varying the geometry
of any one combustor part. These five modules were connected with
flanges. Figure 4.10 provides a schematic of the fully assembled model
RQL.
NASA/CR 2002-211992 32
Page 41
RICHBURNMODULE
REFRACTORY
UNING QUICK MIX MOOULE
LEANBURNMODULE
\EXHUAST MODULE
Figure 4.10 - Model RQL - Assembled
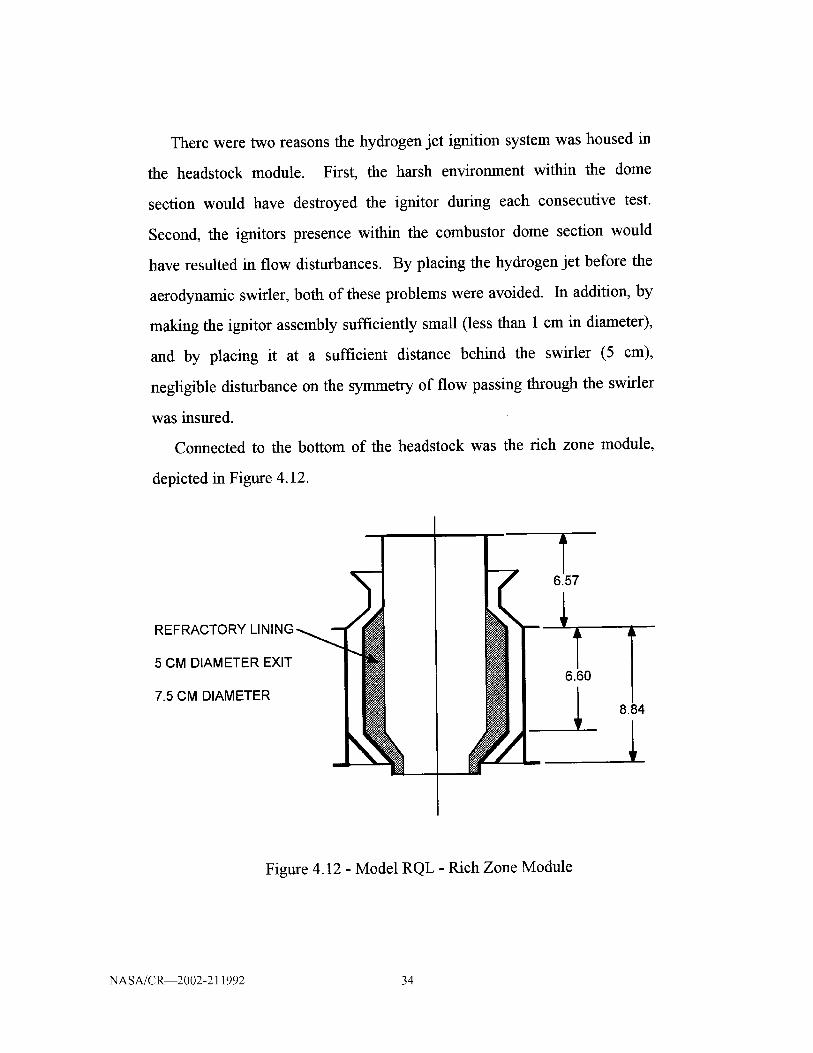
The headstock module, depicted in Figure 4.11, connected the model
RQL to the high pressure vessel. Fixed to the bottom of the headstock were
the aerodynamic swMers and a quarl which allowed for a 900 expansion.
The headstock also housed the ignitor, a combination spark ignitor and
hydrogen jet.
SIDE VIEW
I TOP VIEW NOZZLE TUBE
_ PASSAGF__
15.3
MOUNTINGFLANGE
DIMENSIONS
IN CM
_ AERODYNAMIC
SWIRLER AIR
INLET
Figure 4.11 - Model RQL - Headstock Assembly
NASA/CR--2002.211992 33
Page 42
There were two reasons the hydrogen jet ignition system was housed in
the headstock module. First, the harsh environment within the dome
section would have destroyed the ignitor during each consecutive test.
Second, the ignitors presence within the combustor dome section would
have resulted in flow disturbances. By placing the hydrogen jet before the
aerodynamic swMer, both of these problems were avoided. In addition, by
making the ignitor assembly sufficiently small (less than 1 cm in diameter),
and by placing it at a sufficient distance behind the swirler (5 cm),
negligible disturbance on the symmetry of flow passing through the swMer
was insured.
Connected to the bottom of the headstock was the rich zone module,
depicted in Figure 4.12.
REFRACTORY LINING
5 CM DIAMETER EXIT
7.5 CM DIAMETER
T6.57
6.60
8.84
Figure 4.12 - Model RQL - Rich Zone Module
NASA/C_2002-211992 34
Page 43
This module was double walled, with fuel rich reaction occuring within
the middle section and air flow from the plenum was directed through the
inner and outer walls towards the quick mix module's dilution holes. The
inner wall of the rich zone module was lined with 1.25 cm of refractory.
The inner diameter of the rich zone is 7.6 cm before the contraction and 5.0
cm after. This contraction was located 8.9 cm downstream of the nozzle
tip.
Passing through the inner and outer wall of the module before the
expansion was a probe inlet port. This port allowed access for the
traversing emissions probe. A high temperature braided rope seal provided
a relatively air tight seal, while at the same time allowed for the free
movement of the probe. The inner diameter of this port was 1.25 cm.
The next module was the quick mix section, depicted in Figure 4.13.
10()0I
6.35
Figure 4.13 - Model RQL - Quick Mix Module
In this module that the remaining plenum air was added to the rich
combustion mixture. The inner walls were lined with 1.0 cm of refractory
and the inner diameter was 5.0 cm. The total length of the quick mix
module was 6.35 cm. There were eight equal area dilution jets. These
NASA/CR--2002-211992 35
Page 44
jets used a round hole geometry and were 1.25 cm in diameter. It was
concluded in a related paper (Hatch, 1991) that the round hole geometry
provided the best NOx control.
Following the quick mix module, was the lean zone and exhaust
modules, both of which are depicted in Figure 4.14.
30.5
rL
34.74
Figure 4.14 - Model RQL - Lean Zone and Exhaust Module
Unlike the rich zone and quick mix, these modules were single walled,
with a 1.25 cm layer of refractory lining the walls. The inner diameter of
the lean zone was 5.0 cm before the expansion and 7.5 cm after. The
diameter of the exhaust module was 7.5 cm throughout the full length. The
lean zone was 30.5 cm long, while the exhaust module was 34.74 cm.
NASA/C_2002-211992 36
Page 45
Added to the side of the lean zone module was a probe port. Similar to
the port in the rich zone, this port allowed access for the traversing
emissions sample probe. The axial positions of this port was selected to
sample emissions from the quick mix exhaust at a residence time of 3.0 ms
for the case where inlet air is 700 K, 800 kPa, and has a reference velocity
of 10 m/s.
4.2.2 FUEL ATOMIZER AND FUEL
The model combustor was designed to accommodate a wide variety of
fuel atomizers, ranging from practical air blast to research air assist. The
atomizer used for this research was a twin fluid, air assist atomizer, which
provided a wide fuel flow range and controlled atomization characteristics.
This atomizer, depicted in Figure 4.15, was designed and built by Parker
Hannifm and produced a high degree of symmetry and reproducibility for
inter-laboratory comparison. The primary component of this atomizer was
an externally mixing, air assist nozzle, called the Research Simplex
Atomizer, or RSA. The fuel exited from a centrally located simplex
atomizer tip and mixed with swirling atomizing air. The swirl from this
atomizing air ran counter to the swirl generated by the combustor's
aerodynamic swirlers. The simplex tip of the RSA was interchangeable to
vary liquid flow rate range, droplet diameter, and spray cone angle. The
flow rate of fuel through this nozzle was related to the pressure drop across
it by the following equation:
FN -- (fuel flow in lbs/hr) / sqrt(pressure drop across nozzle in psid)
NASA/CR 2002-211992 37
Page 46
where FN was the flow number corresponding to the particular nozzle. For
this research the RSA nozzle had a flow number of 4.57. During
operation, this number was checked by measurements made of both the fuel
flow and the pressure drop across across the nozzle.
AIR
,tSWIRLER
/
FUEL
//
/,
/
AIR
SWlRLER
\
Figure 4.15 - Fuel Atomizer
This nozzle design produced nominally 10 micron SMD droplets as
measured by the laser diffraction technique at a fuel pressure drop of 687
kPa (100 psid). While the RSA was not a production industrial gas turbine
atomizer, the atomizer displayed many of the features of practical gas
turbine atomizers such as a pressure atomizing simplex tip and air injection
to aid in the formation of a fine fuel spray.
The fuel used for this research was Jet-A. Jet-A is represented by the
formula C12H23 . The specific gravity for Jet-A is 0.813. (Martel, 1988)
4.2.3 SWIRLERS
Swirl was generated from one of two fiat vaned swirlers, each of which
had vane angles of 600. The two swirlers had two different effective areas.
NASA/C_2002-211992 38
Page 47
Using the larger swirler, a 3:1 flow split was achieved. A 4:1 flow split
was achieved with the smaller swifter.
4.3 EXPERIMENTAL DESIGN AND EXECUTION
4.3.1 EXPERIMENTAL DEVELOPMENT
Five combustor operating parameters important to NO/NOx production
and combustion efficiency are operating pressure, inlet air temperature,
reference velocity, lean zone equivalence ratio and overall equivalence
ratio.
The significance of inlet temperature lies in its direct proportionality to
flame temperature. Since thermal NOx production is exponentially
dependent on flame temperature it can be exponentially linked to inlet
temperature as well.
Operating pressure has been shown to be significant in both thermal
NOx production and prompt NOx production (Heberling, 1976). Pressure
has also been shown to have an influence on CO and UHC emissions with
CO and UHC concentrations decreasing at higher pressures. (Lefebvre,
1983)
Reference velocity is inversely proportional to reaction residence time
which is significant in both thermal NOx production and CO oxidation.
Previous studies have demonstrated that combustor residence time can be
linked to thermal NO emissions by the following expression:
In [EI(NO)/t] = -72.28 + (2.80)[sqrt(T)] - T/38
where T is the flame temperature in Kelvin and t is the residence time in
seconds (Lefebvre, 1983). The effect of residence time on thermal NO
NASA/CR 2002-211992 39
Page 48
formation has been shown (Anderson, 1975) to be less significant at lower
equivalence ratios (qb < 0.4).
The rich zone equivalence ratio is significant in its relationship to rich
zone reaction temperature and the concentration of rich zone HC radicals.
It defines the inlet composition to the quick mix region which has the
greatest impact on the NO x production.
The lean zone equivalence ratio is significant in its relationship to lean
zone flame temperature and the oxidation of input CO.
The rich zone and lean zone equivalence ratios are also important to
NOx production in that they dictate the relative significance of the
transition between the two zones, in the quick mix region. In order to
maintain low NOx, it is necessary to pass the fuel rich products rapidly
through the stoichiometric state to reach the fuel lean region. However, the
transition time must be significant enough for oxidation of CO and UHC to
occur. The smaller the ratio of rich zone to lean zone equivalence ratio, the
greater the extent to which stoichiometric regions can form within the
transition region in the quick mix dilution jets and consequently, the greater
the residence time within this transition region.
4.3.2 FLOW SPLIT TESTING
Since the model combustor was designed to operate with plenum
feeding, it was necessary to determine quantitatively the ratio of plenum air
entering the combustor through the aerodynamic swirler to that entering
through the quick mix dilution jets. In order to quantify this ratio, a series
of flow split tests were conducted.
The flow split tests consisted of three phases. During the first phase, the
combustor was placed in the high pressure vessel and the air inlets to both
NASA/CR 2002-211992 40
Page 49
the swirler and the dilution jets were sealed. Plenum air was then added to
the plenum chamber. With both combustor inlets plugged, the only means
of exhaust for the plenum air was through the seal tube rope seal. By
measuring the flow rate of air into the vessel relative to the pressure
differential across the rope seal, a calibration curve was established relating
the rate of leakage across the seal to the pressure differential across the
combustor.
During the second phase of the flow splits test, the inlet to the
aerodynamic swirlers was opened but the inlet to the dilution jets was left
closed. Plenum air was again added to the plenum chamber and a
calibration curve was established relating flow rate into the plenum
chamber to the pressure drop across the combustor. Since the leakage
through the rope seal was known for a given pressure drop, it was possible
to establish a relation between the flow rate of plenum air through the
swMers to the pressure drop across the combustor. This relation indicated
that for flow rates above 80 SCFM, the pressure drop across the combustor
increased linearly with the flow rate of plenum air through the swirlers.
For the third phase of the flow split tests, both the inlets to the model
combustor were opened and air was added to the plenum. Another
calibration curve was established relating the flow into the plenum chamber
to the pressure drop across the combustor. Since the rate of leakage
through the rope seal and the rate of air passage through the swirlers was
known for a given pressure drop, it was possible to compute the flow rate of
air through the dilution jets for a given pressure drop. From this curve,
similar to that established for the swirler, it was established that for flow
rates above 60 SCFM, the pressure drop across the combustor increased
linearly with flow rate through the dilution jets.
NASA/CR 2002-211992 41
Page 50
Combining the results from the three phases of the flow split tests, the
ratio of flow passing through the swirlers to that passing through the
dilution jets was computed. Since above 80 SCFM, the pressure drop
across the combustor was linearly related to the flow rate of air flow
through the two inlet ports, it was assumed that this computed flow split
ratio was constant for all flow cases above 80 SCFM.
By performing these series of tests twice, each time with a different size
aerodynamic swirler, two different flow splits were established. With the
smaller swirler, a flow split of 4:1 was computed. In other words, for air
flow rates into the plenum above 80 SCFM, 20% of the plenum air entered
the combustor through the swirlers while the remaining 80% entered
through the dilution jets. From these tests it was concluded that, for the air
flow rates tested, the air leakage through the rope seal was negligible. With
the larger swirlers, the flow split was computed to be 3:1. Thus, 25% of the
plenum air entered through the swirlers while 75% entered through the
dilution jets.
4.3.3 PHASE 1 TESTING: PERFORMANCE ASSESSMENT
During the Phase 1 tests, exit plane emissions data were obtained for
the model RQL combustor as it was operated under a number of different
conditions. The five operating conditions varied were inlet temperature to
the combustor, pressure, plenum air reference velocity, rich zone
equivalence ratio, and lean zone equivalence ratio. The pressure measured
was that of the plenum air before entering the model combustor. The
reference velocity variable was a theoretical value approximating the
velocity of the plenum air passing through the combustor lean zone at the
plenum chamber temperature and pressure.
NASA/CR 2002-211992 42
Page 51
Two sets of equivalence ratios were chosen for each of the flow split
studies. For the 4:1 flow split, the combustor was first operated with rich
zone and lean zone equivalence ratios of 1.5 and 0.3, and second with rich
zone and lean zone equivalence ratios of 2.0 and 0.4. For the 3:1 flow
splits, the combustor was first operated at rich zone and lean zone
equivalence ratios of 1.5 and 0.375, and second at 2.0 and 0.5. By keeping
the rich zone equivalence ratio between 1.5 and 2.0, relatively low reaction
temperature and soot formation could be maintained. The lean zone
equivalence ratio was varied between 0.5 and 0.3 to maintain a relatively
cool exhaust temperature.
For each set of equivalence ratios, the model combustor was tested at
three different plenum air reference velocities (10 m/s, 15 m/s, and 20 m/s),
four different inlet temperatures (367 K, 533 K, 700 K, and 867 K), and
various pressures between 200 kPa and 1033 kPa atm. 367 K was chosen
as the inlet lowest temperature in order to prevent saturation of the
refractory walls by liquid fuel injected prior to ignition. 200 kPa was
chosen as the lowest pressure setting in order to maintain a stable flame.
During initial test runs of the model RQL combustor, it was noted that it
was difficult to maintain a stable flame under atmospheric conditions.
For all tests, the air/liquid ratio in the nozzle was kept constant at 1.0.
In total, 122 different test cases were investigated. The test conditions
selected were chosen to provide an emissions database for a broad range of
operation and were dependent on the availability of plenum air (required
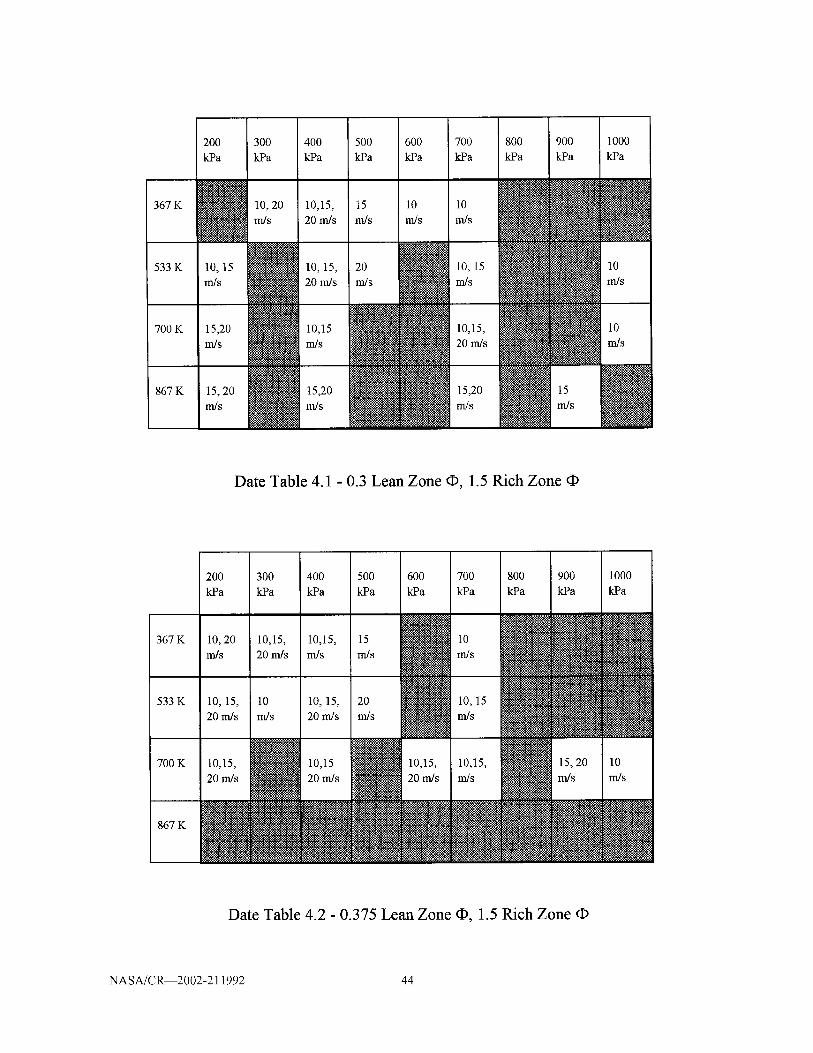
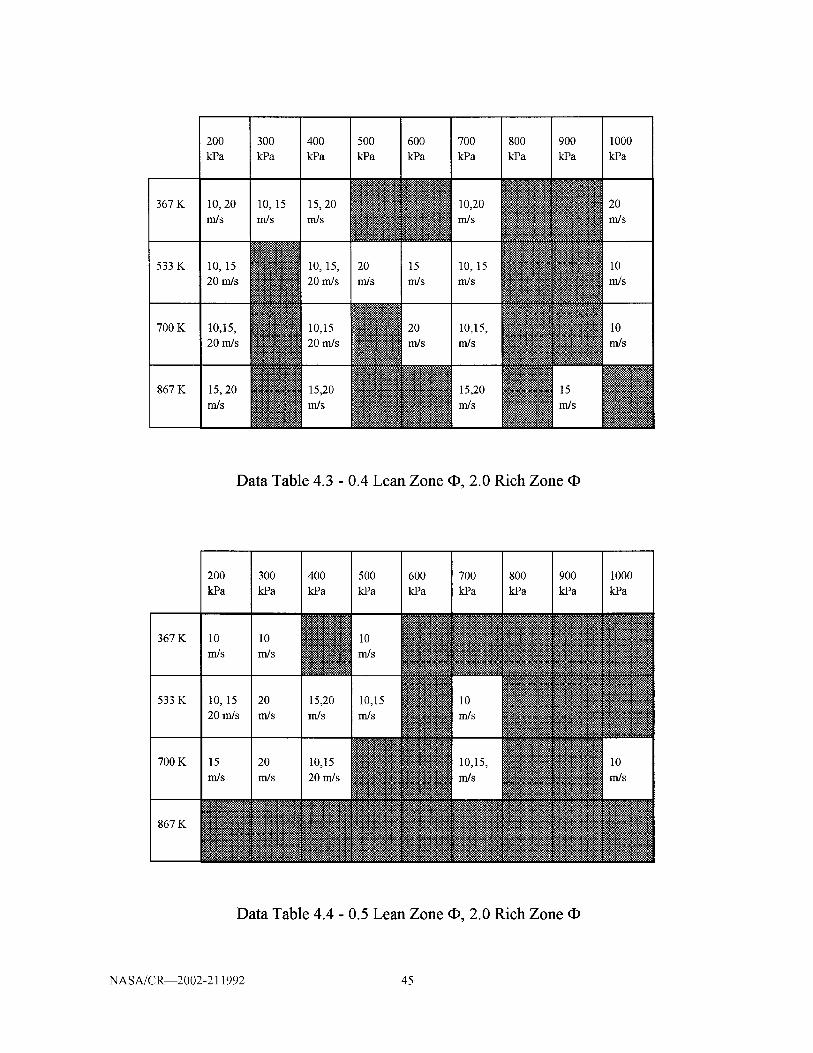
less than 1000 SCFM). Data Tables 4.1 through 4.4 list the different test
cases which made up the Phase 1 test matrix.
NASA/CR 2002-211992 43
Page 52
367K
533K
700K
867K
200kPa
N10, 15
m/s
15,20
m/s
15, 20
m/s
300 400 500 600 700 800 900 1000
kPa kPa kPa kPa kPa kPa kPa kPa
10,20 10,15, 15 10 10 NN _m/s 20 m/s m/s m/s m/s
10,15, 20 _ 10,15 NN 1020 m/s rrds rrds m/s
NN10,15 f 10,15, 10
m/s 20 m/s m/s
Date Table 4.1 - 0.3 Lean Zone _, 1.5 Rich Zone
Date Table 4.2 - 0.375 Lean Zone _, 1.5 Rich Zone
NASA/C_2002-211992 44
Page 53
367K
533K
700K
867K
200kPa
10,20m/s
10,1520m/s
10,15,20m/s
15,20m/s
300 400 800 900 1000kPa kPa kPa kPa kPa
500 600 700kPa kPa kPa
m/sl0'15m/s15'20_N m/s10'20NN 20m/s
20m/s m/s m/s m/s m/s
_ 10'15 N 20 10'15' NN 1020m/s m/s m/s m/s
N 15'20 NN 15'20 N 15Nm/s m/s m/s
Data Table 4.3 - 0.4 Lean Zone _, 2.0 Rich Zone
Data Table 4.4 - 0.5 Lean Zone _, 2.0 Rich Zone qb
NASA/CR 2002-211992 45
Page 54
4.3.4 PHASE 2 TESTING: DETAILED MEASUREMENTS
The Phase 2 tests involved obtaining emissions profiles at the exit of the
rich zone and the entrance to the lean zone. For these tests, the combustor
was operated at the following conditions: T3 = 700 K, P3 -- 400 kPa, Ref
Vel = 10 m/s, Overall Equivalence Ratio = 0.375, and Rich Zone
Equivalence Ratio = 1.5. Since these tests seeked to establish the relative
contribution of the rich zone and lean zone to the overall production of
NO x, the operating pressure, temperature and reference velocity were
chosen at random. The lean zone and rich zone equivalence ratios were
chosen to represent average conditions.
The traversable water cooled probe was used to obtain emissions (NO,
NOx, 02, CO, CO 2 and UHC) at six radial positions in the rich zone exit
and eleven radial positions in the lean zone entrance. (Figure 4.16)
RICH ZONE
5CM
LEAN ZONEI
QUICK MIX
ZONE
SIX RADIAL POSITIONS
AT RICH ZONE EXIT
(CENTERLINE, 0.5 CM,
1.0 CM, 1.5 CM, 2.0 CM,
AND 2.5 CM FROM THE
CENTERLINE)
ELEVEN RADIAL POSITIONS
AT LEAN ZONE ENTRANCE
(CENTERLINE, 0.25 CM, 0.5 CM0.75 CM, 1.0 CM, 1.25 CM, 1.5 CM
1.75 CM, 2.0 CM, 2.25 CM, AND
2.5 CM FROM THE CENTERLINE)
Figure 4.16 - Phase 2 Testing Locations
NASA/C_2002-211992 46
Page 55
For this research, the start of the lean zone was designated by the
leading edge of the round holes of the quick mix dilution jets. The
combustor was assumed to be axisymmetric. As a result, emissions data
were obtained for only half of the combustor.
NASA/CR 2002-211992 47
Page 56
5.0 RESULTS
5.1 PHASE 1 TESTING
5.1.1 NOx EMISSIONS
The measure of NO x in the combustor exhaust was evaluated with a
computed Emission's Index (EI(NOx)). This index value indicated the ratio
of grams of NOx present in the exhaust to the kilograms of fuel consumed.
The emissions of NO x, measured in ppm, were converted to the NO x
Emission Index with the following formula (derived in Appendix A):
EI(NOx) = [MW No2/MWdry exhaust] [(100- %H20)/100]
[mass flow rate of exhaust in grams/fuel flow rate in kg] NO x ppm
Rich Zone • = 1.5, Lean Zone • = 0.3. The first series of Phase 1 tests
involved operating the model RQL combustor with a rich zone equivalence
ratio of 1.5 and a lean zone equivalence ratio of 0.3. The combustor was
operated at three different air reference velocities (10 m/s, 15 m/s, and 20
m/s). For the 10 m/s reference velocity case, the combustor was run at
three inlet temperatures (367 K, 533 K, and 700 K). An additional inlet
temperature of 867 K was added to the 15 m/s and 20 m/s cases. The
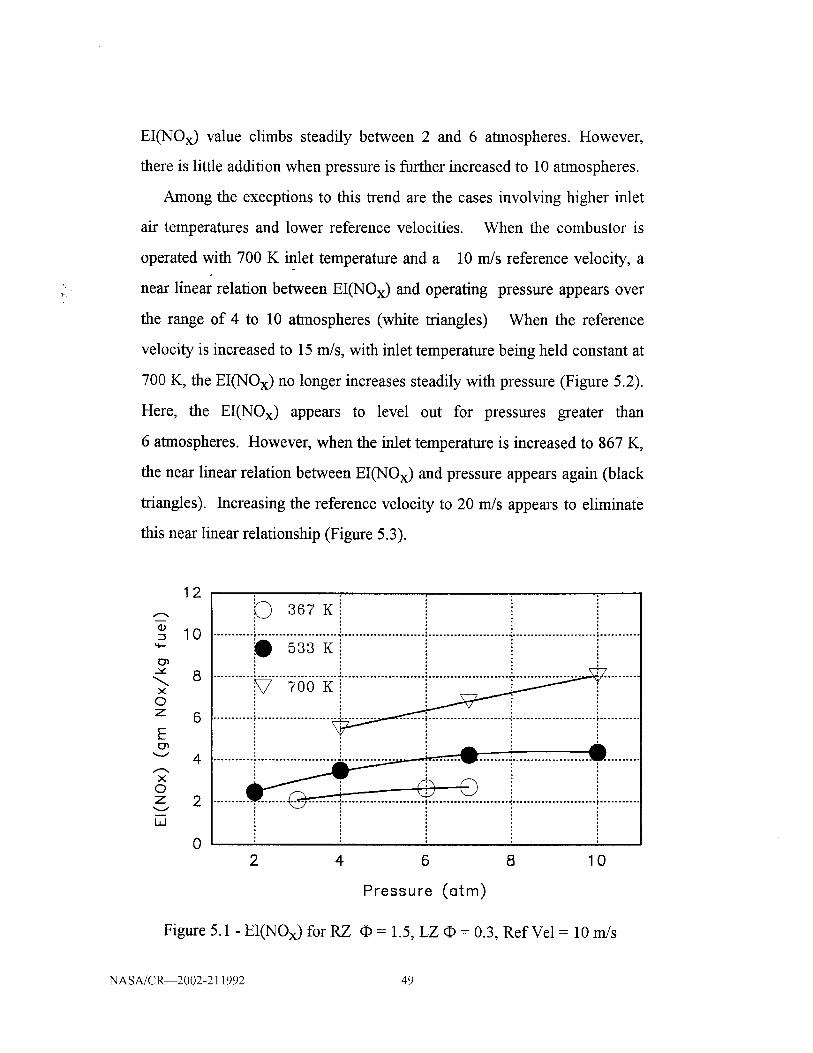
computed EI(NOx) values for these test cases are presented in Figures 5.1
through 5.3.
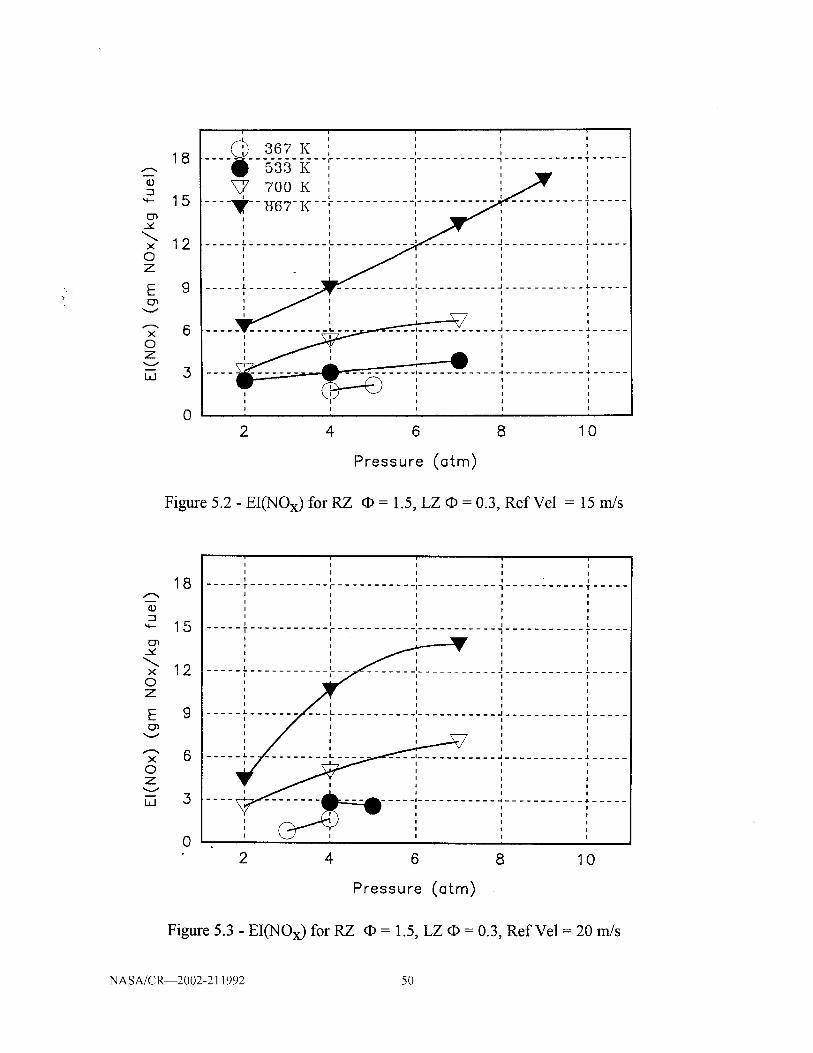
Comparisons of the cases where inlet temperature and reference velocity
are held constant while pressure is increased reveal a tendency between
increased NOx production and increased pressure. With a few exceptions,
this relation tends to appear more pronounced at lower pressures. For
example, for the 10 m/s, 533 K test cases in Figure 5.1 (black circles) the
NASA/C_2002-211992 48
Page 57
EI(NOx) value climbs steadily between 2 and 6 atmospheres. However,
there is little addition when pressure is further increased to 10 atmospheres.
Among the execptions to this trend are the cases involving higher inlet
air temperatures and lower reference velocities. When the combustor is
operated with 700 K inlet temperature and a 10 m/s reference velocity, a
near linear relation between EI(NOx) and operating pressure appears over
the range of 4 to 10 atmospheres (white triangles) When the reference
velocity is increased to 15 m/s, with inlet temperature being held constant at
700 K, the EI(NOx) no longer increases steadily with pressure (Figure 5.2).
Here, the EI(NOx) appears to level out for pressures greater than
6 atmospheres. However, when the inlet temperature is increased to 867 K,
the near linear relation between EI(NOx) and pressure appears again (black
triangles). Increasing the reference velocity to 20 m/s appears to eliminate
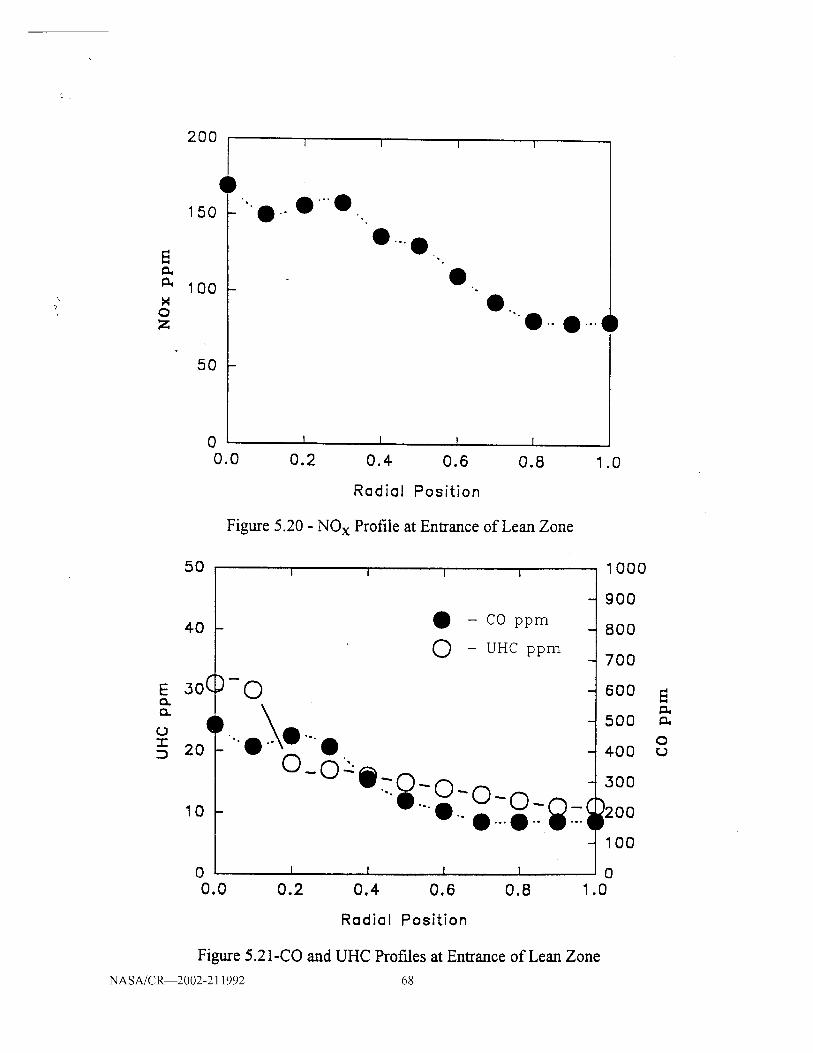
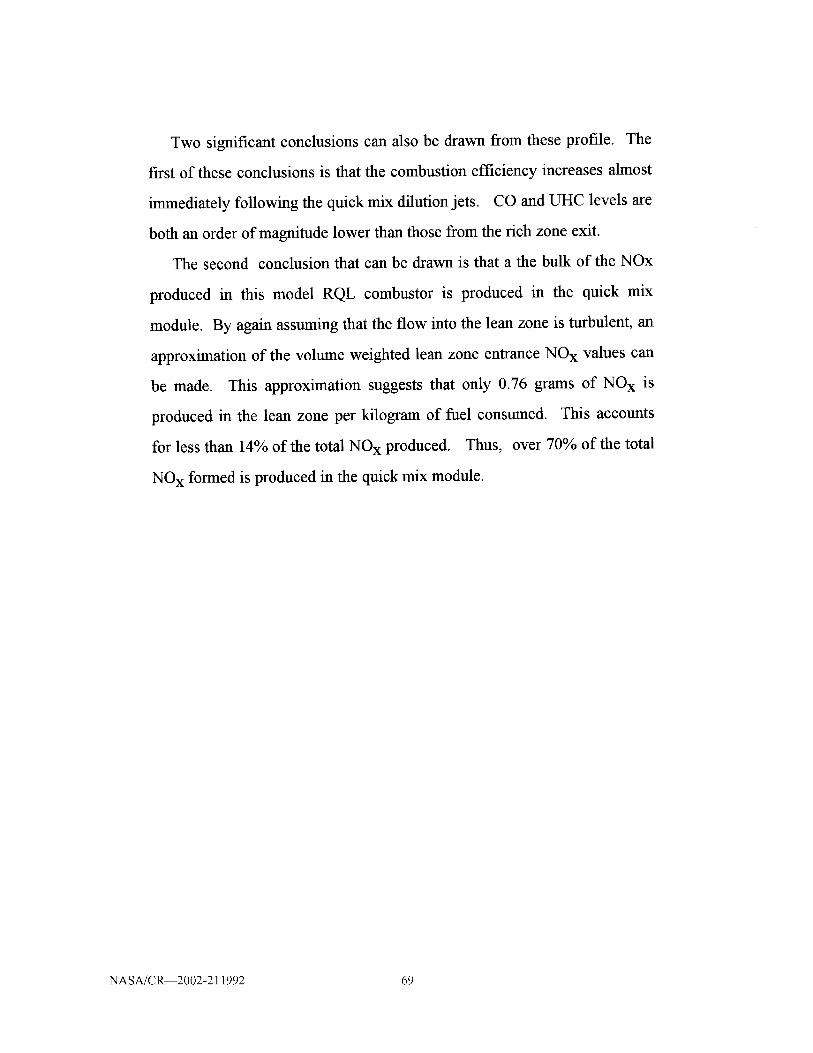
this near linear relationship (Figure 5.3).
xOZ
E
xOZ
M
t.d
12,_ 367 K
10 .....................................................................................................................O 533 K
6 ........... :..................... _ ............ i ...........
2 ,,
0
2 4 6 8 10
Pressure (arm)
Figure 5.1 - EI(NOx) for RZ qb = 1.5, LZ • = 0.3, Ref Vel = 10 m/s
NASA/C_2002-211992 49
Page 58
--I
Y
xoZ
E
x0Z
m
I,I
18
15
12
9
6
3
0
I I I
367 K ', 1 ',533 R'" "_ ........ '........... _,...........
.... 'V'"g67" K'' ........... '......................... -27. ...... T.....I I I I I
I I I I I
I I I I I
I I I I I
...... T ........... ," ................................. T .....I I I I
I ] I I
I - I I I,, :ii iiiiiii,...... .L ..................... I....................... .I. .....
I I I
I I I I
I I I I
I I 1 _ I
........ _ J" .....
1 'JI I I
I I
I
........................... I I_
I
I
I
I I
2 4 6 8 10
Pressure (Gtm)
Figure 5.2 - EI(NOx) for RZ _ = 1.5, LZ • = 0.3, RefVel = 15 m/s
CD
vA
oZ
E
xoZ
V
m
I,I
18
15
!2
9
6
3
0
I
I
I
2 4 6 8 10
Pressure (otto)
Figure 5.3 - EI(NOx) for RZ _ = 1.5, LZ • = 0.3, RefVel = 20 m/s
NASA/C_2002-211992 50
Page 59
Past studies (Allen, 1976; Lipfert, 1976; Donovan et al., 1978; Fowler et
al., 1993) have shown that EI(NOx) production can be related to inlet
pressure by the following equation:
EI(NOx) cz pn
The physical reason behind this
However, much of it can be
increased reaction temperature
where n can vary from 0.5 to 0.75.
correlation is not entirely understood.
attributed to the relationship between
resulting from increased pressure.
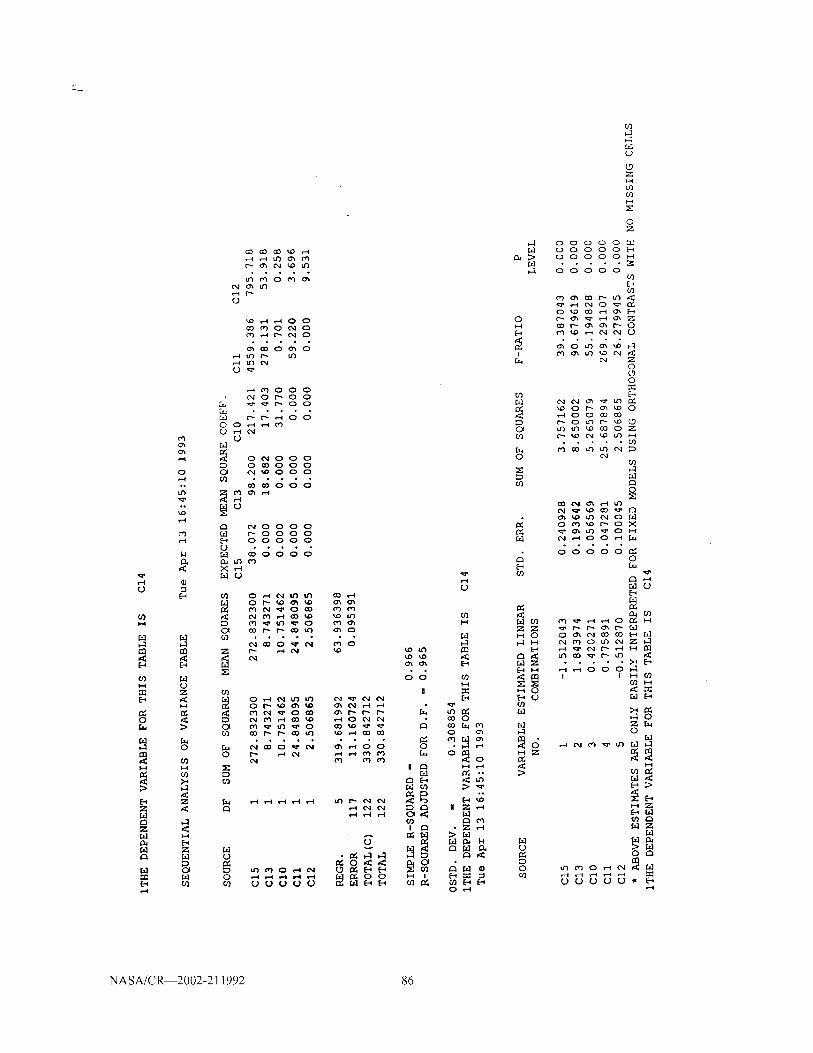
Regression analysis of these data (Refer to Appendix C), however,
showed that for this staged combustor, the EI(NOx) varied proportionally
with combustion pressure to the 0.4 power:
EI(NOx) ot P 0.4
Figures 5.1 through 5.3 also illustrate the effect of increases in inlet
temperature on NOx production for the 0.3, 1.5 cases. As expected,
constant incremental increases in inlet temperature result in continuously
larger increases in NOx production. For example, in the case where
pressure and reference velocity are held constant at 4 atmospheres and
15 m/s (Figure 5.2), the EI(NOx) increases from 1.76 to 3.04 to 5.3 to 9.05
as inlet temperature is raised from 367 K to 533 K to 700 K to 867 K. This
trend supports the exponential relation between reaction temperature and
the rate of NO x formation described by Zeldovich.
The effect of reference velocity is not quite as pronounced as that of
either temperature or pressure. Generally, there is a noticeable drop in the
NASA/CR 2002-211992 51
Page 60
EI(NOx) as reference velocity increases. For example, with inlet
temperature and operating pressure held constant at 700 K and
2 atmospheres, an increase in reference velocity from 15 m/s to 20 m/s
coincides with a slight decrease in EI(NOx) from 3.12 to 2.45. A
significant factor leading to this drop is the resulting decrease in residence
time due to the increased flow velocity. In passing from the rich zone to
the lean zone, the combustion products must pass through region of
stoichiometry. Within this region, reaction temperature reaches a maximum
as does NOx production. A decrease in reference velocity results in an
increase in residence time for the combustion products within this region.
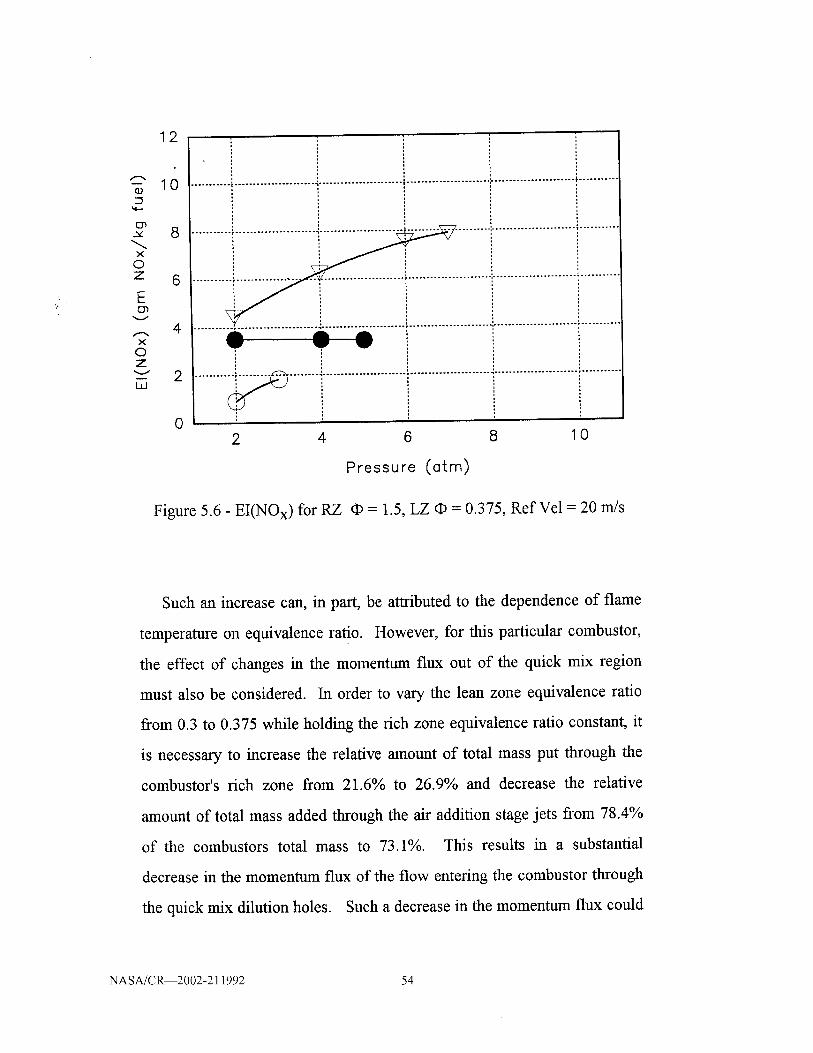
Rich Zone • = 1.5, Lean Zone • = 0.375. Figures 5.4 through 5.6
present the results obtained from the cases where the lean zone equivalence
ratio was raised to 0.375, while the rich zone equivalence ratio was held
constant at 1.5.
This increase in lean zone equivalence ratio (qblz) results in a general
increase of the EI(NOx) by 20%. For example, in Figure 5.4, an EI(NOx)
value of 8.9 results from operation of the model combustor when the inlet
temperature, pressure and reference velocity are 700 K, 7 atmospheres, and
10 m/s respectively (Figure 5.4). This is a 25% increase in EI(NOx) for the
model RQL operating at the same conditions with a lean zone equivalence
ratio of 0.3 (Figure 5.1).
NASA/CR 2002-211992 52
Page 61
"--'i
xOZ
E
V
xOZ
kd
12
10
8
6
4
367 K
........._ _33K i .........
iiiiiiiii iiiiiiiii
iiiiiiiii iiiiii..............................i.............iiiiiiiiiiiiiiiiiiiiiiiiiiiiiiiil!iiiiiiiiill2 4
Figure 5.4 - EI(NOx) for RZ
6 8 10
Pressure (arm)
= 1.5, LZ • = 0.375, RefVel = 10 m/s
12
m
-1q.-
03X¢
XO/_.
EUD
XOZ
Ld
10
8
6
4
2
0
........... r...................... ' ....................... r .............................................. r ...........
2 4 6 8 10
Pressure (otm)
Figure 5.5 - EI(NOx) for RZ _ = 1.5, LZ _ = 0.375, RefVel = 15 m/s
NASA/C_2002-211992 53
Page 62
12
10-1
E_-_ 8xx
X
O
z 6
E133
,.-, 4X
Oz
2t.d
0
........... _............................................................................................ t ..........
2 4 6 8 10
Pressure (cntm)
Figure 5.6 - EI(NOx) for RZ qb = 1.5, LZ • = 0.375, RefVel = 20 m/s
Such an increase can, in part, be attributed to the dependence of flame
temperature on equivalence ratio. However, for this particular combustor,
the effect of changes in the momentum flux out of the quick mix region
must also be considered. In order to vary the lean zone equivalence ratio
from 0.3 to 0.375 while holding the rich zone equivalence ratio constant, it
is necessary to increase the relative amount of total mass put through the
combustor's rich zone from 21.6% to 26.9% and decrease the relative
amount of total mass added through the air addition stage jets from 78.4%
of the combustors total mass to 73.1%. This results in a substantial
decrease in the momentum flux of the flow entering the combustor through
the quick mix dilution holes. Such a decrease in the momentum flux could
NASA/C_2002-211992 54
Page 63
7
result in substantially lower air jet penetration and degraded mixing with its
resultant increase in NOx production.
For this set of equivalence ratios, the same general trends are found
regarding pressure, inlet temperature and reference velocity. EI(NO x)
increases to a fractional power with increased pressure and temperature and
decreases with increased reference velocity.
Rich Zone @ = 2.0, Lean Zone @ = 0.4. Figures 5.7 through 5.9 present
the computed EI(NOx) values for the cases where the rich zone equivalence
ratio was increased to 2.0 and the lean zone equivalence ratio was increased
to 0.4.
14
---12
x_ 10
o 8
4Z
0
, , , , ,
I I I I
(_ 367 K ....I l I l
I I I
• _aa_i ....................... •........... _............ I I I
I I I I700 K ....I u I I
I I I I..... T____67_x ..........................................I I I I
I I I
I I I
I I I I
I I I ..... I .....
.... fill ........... ("It ..........., Ii ....... 711 ...... III
l I I l
I I I I
I I I 1 I
I I I I
_-. . _ ! ,_.._
.................... I ........... =1 ........... T .....
I I I I
-2- ' ' ' ;I I ! I
'_--__ _ ,' ,u I
u I I I I
2 4
Figure 5.7 - EI(NOx) for RZ
6 8 10
Pressure (otm)
@ = 2.0, LZ @ = 0.4, RefVel = 10 rn/s
NASA/C_2002-211992 55
Page 64
18
15
c_v 12
x0
z 9
3
,;5
0
I I I I
I I I t
I I I I
II I I
i ................ i_ ........... I ........... J ........ I .....
I I t l
I I I
I I I
I I I
I I I
I I
................ r ......... I ...................... 't" - - -
I I I
I I
I I
I I
I I I
........... L ........... I ...................... / _
I I I
I I I
I I I
I
:................ )" ......... I........... "1 ........... 1" .....
I I
I I
J
I
I
........ ,J .................
I
2 4 6 8 10
Pressure (arm)
Figure 5.8 - EI(NOx) for RZ @ = 2.0, LZ @ = 0.4, RefVel = 15 m/s
18
-_ 15-1
w,,,-
CD,," 12
XO
7 9
E
,.-.. 6X
OZ
_v 3laJ
0
r t t
I I I
I I I
I I I
I I I
..... J. ........... L ........... I ........... J ................
!
I
......................... ._ IIII............................ III
.... 'i ................ i........... !,,,................I
I
I
I
I
................... / ................
I
I
! I
I I I
I I I
I I I
2 4 6 8 10
Pressure (atm)
Figure 5.9 - EI(NOx) for RZ @ = 2.0, LZ @ = 0.4, Ref Vel = 20 nds
NASA/CRy2002-211992 56
Page 65
A comparison of this data with that from the previous set (where the
lean zone equivalence ratio was maintained at 0.375) reveals the effect of
increased rich zone equivalence ratio. Increasing the rich zone equivalence
ratio, while increasing the lean zone equivalence ratio only slightly results
in a slight decrease in the production of NO x. This tendancy is illustrated
by the 15 m/s, 700 K cases for the 2.0 and 1.5 rich zone equivalence ratio
tests (Figures 5.5 and 5.8 respectively). When the combustor operates at a
rich zone equivalence ratio of 1.5, EI(NOx) increases from 3.5 to 8.8 as
pressure is increased from 2 to 7 atmospheres. However, when the
combustor rich zone equivalence ratio is increased to 2.0, the EI(NOx) only
increases from 3.3 to 7.2 over the same pressure interval. Such a decrease
is due in part to the reduced gas temperature exiting the rich zone at the
higher equivalence ratio. This also corresponds to a shortening of the
residence time in the quick mix section where the local equivalence ratio is
equal to 1.0. This decrease is most noticeable in the lower pressure cases.
As in the previous cases, the increase in NO x production, and EI(NOx)
becomes more apparent for the higher inlet temperatures. The trends
involving pressure and reference velocity appear to remain the same as the
earlier cases.
Rich Zone qb = 2.0, Lean Zone • = 0.5. The increase in EI(NOx), due to
rising lean zone equivalence ratio, is further illustrated as the lean zone
equivalence ratio is changed to 0.5, while the rich zone equivalence ratio is
held constant at 2.0. (Figures 5.10 through 5.12) Increasing the lean zone
equivalence ratio from 0.4 to 0.5 results in an additional 33% increase in
the resulting EI(NOx).
NASA/CR 2002-211992 57
Page 66
X
OZ
E
v
X
OZ
tM
12
10
8
6
4
2
0
........... i ..............................
........... _...................... _(....................... ,....................... .,...... ............... _ ...........
2 4 6 8 10
Pressure (Gtm)
Figure 5.10 - EI(NOx) for RZ (I) = 2.0, LZ _ = 0.5, RefVel = 10 m/s
09
N.--
,¢
X
OZ
E
X
OZ
i
bA
12
10
8
6
4
2
0
...........i......................i.....................i......................r _ ............ r ..................................... T ...........
iiiiiiii iiiiiiiiiiiiiiiiiiiiiiiiiiiiiiii!iiiiiiiiiiiiiiiiiiiiiiiiiiiiiiiiill2 4 6 8 10
Pressure (atm)
Figure 5.11 - EI(NOx) for RZ cI) = 2.0, LZ cI) = 0.5, RefVel = 15 m/s
NASA/C_2002-211992 58
Page 67
12
m
(1)
X
OZ
E
v
X
OZ
b2
10
8
6
4
2
0
........... F ...................... _ .............................................. '....................... t ...........
........... r ...................... ":............................................. 2....................... v ...........
2 4 6 8 10
Pressure (arm)
Figure 5.12 - EI(NOx) for RZ F = 2.0, LZ F = 0.5, RefVel = 20 m/s
5.1.2 NO x PRODUCTION AND REACTION TEMPERATURE
Additional insight can be gained from a comparison of EI(NOx) to lean
zone reaction temperature. For this comparison, local lean zone
equivalence ratios were determined using the measured emission values and
the following approximation (SAE, 1971):
¢ lz = [(Cco + CCO2 + CUHC)Mfx 10"6]
/ [0.064Mpnc{ 1-1/2{ 1/2r(Cco +
CCO2)X10-6 + Ccoxl0 -6} }]
NASA/C_2002-211992 59
Page 68
By using these computed local equivalence ratios and relating
adiabatic flame temperature to inlet air temperature and equivalence ratio,
(assuming Jet-A combustion with dry air for pressures from 50 kPa to 5000
kPa and equivalence ratios from 0 to 2.0), the flame temperature within the
lean zone of the model combustor was computed for each of the 122 test
cases. Each of these theoretical flame temperature values were then
compared to their corresponding EI(NOx) values.
Figure 5.13 presents the comparison of the theoretically computed
reaction temperatures with the normalized NO x data. The data was
normalized by dividing each EI(NOx) value by the largest test value
recorded. The shotgun appearance of this plot, which can be attributed to
the numerous varying combustion parameters, makes it complicated to draw
definite conclusions. However, some insight can be gained from the
quadratic least squares fit approximations for each of the four equivalence
ratio combinations. These approximations point out the significant effect
of reaction temperature on the rate of NO x formation, and also suggest that
rich zone equivalence ratio has an important impact on NOx production.
Increasing the rich zone equivalence ratio from 1.5 to 2.0 results in a
substantial drop in EI(NOx) for a given inlet air temperature. This increase
in NO x production, accompanying the decrease of rich zone equivalence
ratio, can be attributed to higher reaction temperatures, and decreased
concentrations of HC radicals.
NASA/CR 2002-211992 60
Page 69
XoZm
". Ill
N.-.
E
0Z
1
0.9
0.8
0.7
0.6
0.5
0.4
0.3
0.2
0.1
0
O
o o "j
a I_ ' A .._. 1
O A• A
_°I
/
"& / _ / J,k
o 2,
-Z''I _I
_/,.Q& ._/ .." I
u
1000
°
1200
O.3, 1.5 DATA
0.3, 1.5 APPRX
0.4, 2.0 DATA
-- - n A 2 0 APPR Y%#.-1"9 • i o v
1400 1600 1800
Flame Temperature (K)
= 0.5, 2.0 DATA
....... 0.5, 2.0 APPRX
" 0.375, 1.5 DATA
0.375, 1.5 APPRX
Figure 5.13 - EI(NOx) vs Reaction Temperature
2000
NASA/CR--2002-211992 61
Page 70
5.1.3 COMBUSTION EFFICIENCY
Using measured emissions for CO, the combustion efficiency was
computed with the equation (Annonymous, 1971):
rl = 1- EI(CH2.67 ) x 10 "3 0.227 [EI(CO)- EI(CO)e q ] x 10 -3
where EI(x) are the computed emissions indices for CO and UHC, which
are all assumed to be of the form CH2.67. For cases where the lean zone
equivalence ratio is less than 1.0, the El for UHC was negligible.
The resulting data (Figures 5.14 through 5.17) suggests that combustion
efficiency improves with increased inlet air temperature with values of 99%
being achieved for preheat air temperatures greater than 367 K.
Combustion efficiency also appears to increase with residence time for
cases involving lower inlet and lower lean zone equivalence ratios. For the
0.3 lean zone equivalence ratio, 367 K inlet temperature case, combustion
efficiency drops to nearly 90% when the reference velocity is set to 20 m/s
(Figure 5.14). Combustion efficiency increases to 97% when the reference
velocity is decreased to 15 m/s. When the lean zone equivalence ratio is
increased to 0.375, with inlet temperature constant at 367 K, combustion
efficiency increases to 97% for a reference velocity of 20 m/s (Figure 5.15).
The basis for the relationship between increased efficiency and increased
lean zone equivalence ratio lies in the relationship between equivalence
ratio and flame temperature. There appears to be no significant relation
between combustion efficiency and pressure. These results would tend to
agree with the trade off of NO x for CO expected for typical combustion.
As illustrated in Figures 5.1 and 5.14, for 367 K preheat, low NOx
production is accompanied by high CO and UHC.
NASA/CR--2002-211992 62
Page 71
1
0.99
0.98
_" 0.97
_. 0.96t,u_" 0.95O
.w
0.94
E 0.93O
0.92
0.91
0.9
[3
Z_
I,%
+
O
@i
i
[] 200F, 10m/s • 500F, 20m/s --_
_1<> 200F, 15m/s • 800F, 10m/s
a 200F, 20m/s '* 800F, 15m/s --
•' 500F, 10m/s • 800F, 20m/s
,, 500F, 15rnls
0 2 4 6 8 10
Pressure (atm)
Figure 5.14 - Combustion Efficiency for 1.5 Rich Zone, 0.3 Lean Zone
"6
IdA
e,,O
.m
.gl
EOO
1
0.9975
0.995
0.9925
0.99
0.9875
0.985
0.9825
0.98
0.9775
0.975
0.9725
I
A
0 2 4 6 8 10
Pressure (atm)
Figure 5.15 - Combustion Efficiency for 1.5 Rich Zone, 0.375 Lean Zone
NASA/C_2002-211992 63
Page 72
>,
E=LU
0
J=Eo(J
1
0.999
0.998
0.997
0.996
0.995
0.994
0.993
0.992
0.991
0.99
0 2 4 6 8 10
Pressure (arm)
Figure 5.16 - Combustion Efficiency for 2.0 Rich Zone, 0.4 Lean Zone
1
0.9995
0.999
0.9985U
S 0.998w
0.9975o
,m
_ 0.997
_ 0.9965
0.99@
0.9955
0.995
[]
0 2 4 6 8
Pressure (atm)
lO
Figure 5.17 - Combustion Efficiency for 2.0 Rich Zone, 0.5 Lean Zone
NASA/C_2002-211992 64
Page 73
5.2 PHASE 2 TESTING
5.2. i RICH ZONE EXIT EMISSION PROFILE
The traversable emissions probe sampled emissions from the 5.0 cm
diameter rich zone exit while the combustor was operated at the following
conditions: T3 = 70OK, P3 = 400 kPa, reference velocity = 10 m/s, and rich
zone equivalence ratio = 1.5. A 3:1 flow split was used. Therefore, the
corresponding reference velocity in the rich zone was 2.5 m/s and the
corresponding lean zone equivalence ratio was 0.375. The measured
profiles for NOx, CO, and UHC at the rich zone exit are presented in
Figures 5.18 and 5.19.
200I I I I
1,4Q
150
100
00.0
i °°°°°°'°°° 0..o°°°o'f°
0
e
e _
0
I I 1 I
0.2 0.4 0.6 0.8
Radial Position
i
1.0
Figure 5.18 - NOx Profile at Exit of Rich Zone
NASA/C_2002-211992 65
Page 74
"1"
1000
900(
8OO
700
E 600Q..
500 -cD"i-o 400
I300 -
200 -
100 -
00.0
I
- CO ppm
0 - UHC ppm
I • i I
m
0 '
w
I I
0.2 0.4
I I 00.6 0.8 1.0
Radial Position
10000
8000
6OOO
4-000
2000
Eel.13.
0(.3
Figure 5.19 - CO and UHC Profiles at Exit of Rich Zone
Since the combustor was axis-symetric, only half of the exit was
profiled. For these plots, the radial distance of the probe sample port from
the rich zone exit centerline has been normalized, with 0.0 indicating the
centerline and 1.0 indicating a distance 2.54 cm from the centerline (the
wall).
From these profiles, two significant conclusions can be drawn. The fu'st
of these conclusions is that the mixing within the current rich zone module
is not uniform. Low CO and UHC levels near the wall of the exit suggest
that the reaction does not expand very far from the centerline. The NO x
spike can be attributed to a transition from a fuel rich mixture at the center
of the rich zone to a fuel lean mixture at the wall.
NASA/C_2002-211992 66
Page 75
The second conclusion that can be drawn is that a relatively small
portion of the total NO x produced in this model RQL combustor is
produced in the rich zone. Exit plane measurements from Phase 1 tests
revealed that, for these conditions, the model combustor produced 5.5
grams of NOx per kilogram of fuel consuled. A reasonable approximation
of the volume weighted rich zone NO x values (made by assuming a
turbulent pipe flow though the rich zone exit) suggests that only 0.88 grams
of NOx is produced in the rich zone per kilogram of fuel consumed. This
accounts for only 16% of the total NO x produced.
5.2.2 LEAN ZONE ENTRANCE EMISSION PROFILE
The traversable emissions probe also sampled emissions from the 5.0
cm diameter lean zone entrance. The same operating conditions were used
as for the rich zone emission profile test: T3 = 700 K, P3 = 400 kPa,
reference velocity = 10 m/s, rich zone equivalence ratio = 1.5, and lean
zone equivalence ratio = 0.375.
The measured profiles for NO x, CO, and UHC at the lean zone entrance
are presented in Figures 5.20 and 5.21. Again, because of symmetry, only
half of the entrance was profiled. Similar to the plots in Figures 5.18 and
5.19, the radial distance of the probe sample port from the lean zone
entrance centerline has been normalized, with 0.0 indicating the centerline
and 1.0 indicating a distance 2.54 cm from the centefline (the wall).
NASA/CR 2002-211992 67
Page 76
200I I I I
o
q150
100 -
50 -
D-"0 00
• " •
0...0
0°
0.- 0.--I
0 I I I I
0.0 0.2 0.4 0.6 0.8 1.0
Radial Position
Figure 5.20 - NO x Profile at Entrance of Lean Zone
50I I I I 1000
40
E 3o(Q.Q..
-r-m 20
lO
oo.o
- CO ppm
0 - UHC ppm
- 900
- 800
- 700
- 600
- 500
- 400
i"" _ .... 300.... 200
IO0
I 1 00.2 0.4. 0.6 0.8 1.0
Radial Position
Figure 5.21-CO and UHC Profiles at Entrance of Lean Zone
NASA/C_2002-211992 68
o_3
Page 77
Two significant conclusions can also be drawn from these profile. The
first of these conclusions is that the combustion efficiency increases almost
immediately following the quick mix dilution jets. CO and UHC levels are
both an order of magnitude lower than those from the rich zone exit.
The second conclusion that can be drawn is that a the bulk of the NOx
produced in this model RQL combustor is produced in the quick mix
module. By again assuming that the flow into the lean zone is turbulent, an
approximation of the volume weighted lean zone entrance NOx values can
be made. This approximation suggests that only 0.76 grams of NO x is
produced in the lean zone per kilogram of fuel consumed. This accounts
for less than 14% of the total NO x produced. Thus, over 70% of the total
NO x formed is produced in the quick mix module.
NASA/CR 2002-211992 69
Page 78
6.0 SUMMARY AND CONCLUSIONS
6.1 SUMMARY
This research examined the role inlet temperature, pressure,
reference velocity, rich zone equivalence ratio, and lean zone equivalence
ratio play in the production of emissions from a model rich burn - quick
mix - lean burn combustor in the fuel rich zone (first stage) and the fuel
lean zone (third stage). The first task of the research involved modifying an
existing testing facility in order to make it capable of simulating actual gas
turbine engine combustor operating conditions. The second task of the
research involved the development of a model RQL combustor that would
simulate the plenum air feed of real gas turbine engines. The third task of
the research involved the acquisition of emissions data from the model
combustor operated at realistic conditions. This task was divided into four
parts: experimental development, flow splits tests, Phase 1 emissions
testing, and Phase 2 emissions testing.
During the experimental development, operating parameters to be
examined in relation to NO/NOx emissions were selected. During the flow
splits testing, the plenum feeding of the model RQL combustor was
examined and characterized. During the Phase 1 testing the influence of
several operating parameters on NOx emissions and combustion efficiency
were evaluated. And finally, during the Phase 2 testing, emission profiles
were obtained in the rich zone exit and lean zone entrance of the model
combustor, while the combustor was operated at realistic conditions.
Emission profiles at the rich zone exit and lean zone entrance revealed
that the bulk of the NOx formed in the model RQL combustor was
NASA/CR 2002-211992 70
Page 79
produced in the quick mix module. The profiles also revealed that mixing
within the rich zone module was not uniform.
6.2 CONCLUSIONS
From the measured emissions data, several conclusions can be drawn.
NOx production in an RQL can combustor, operating at fixed inlet air
temperature and pressure, can be minimized by: decreasing lean zone
equivalence ratio, increasing rich zone equivalence ratio, and
decreasing lean zone residence time.
NOx production increases with operating pressure to the 0.4 power.
Also, as expected, NOx production increases with increasing inlet air
temperature.
Combustion efficiency can be maximized by: increasing inlet air
temperature, increasing operating pressure and increasing overall
residence time. For the RQL combustor operating with inlet air
preheat temperatures greater than 367 K, combustion efficiency will
exceed 99%.
The rich zone is not uniform and accounts for on the order of 16% of
the total NO x produced.
NASA/C_2002-211992 71
Page 80
REFERENCES
Allen, L. and Slusher, G.R., "Ambient Temperature and Humidity Factors
for Exhaust Emissions from Two-Classes of Aircraft Turbine Engines,"
FAA-RD-76-149, AD A031923, October 1976, National Aviation Facilities
Experimental Center, Atlantic City, NJ
Anderson, D.N., "Effects of Equivalence Ratio and Dwell Time on Exhaust
Emissions from an Experimental Premixing Prevaporizing Burner," ASME
Paper 75-GT-69, 1975
Annonymous, Procedures for the Continuous Sampling and Measurement
of Gaseous Emissions from Aircraft Turbine Engines. Aerospace
Recommended Practice 1256, SAE, 1971.
Brady, R.A., "A Study of Dome Region Fuel-Air Mixing in a Model Rich
Burn - Quick Mix -Lean Burn Combustor," MS Thesis, UCI, 1991.
Bryce, G.R., "Data Analysis in RUMMAGE - A User's Guide," Brigham
Young University, Statistics Department, Provo, UT (1980)
Be6r, J.M., Jacques, M.T., Farmayan, W.F., Gupta, A,K., and Hanson, S.,
"Reduction of NO x and Solid Emissions By Staged Combustion of Coal
Liquids Fuels," 19th Symposium on Combustion, The Combustion Institute,
1982, pp. 1301-1309
Donovan, P. and Cackette, T., "The Effects of Ambient Conditions on Gas
Turbine Emissions - Generalized Correction Factors," ASME Paper No. 78-
GT-87
Drennan, S.A., "The Development of a High Pressure Nozzle
Characteristion Facility with Optical Access," Master's Thesis, UCI
Combustion Laboratory Report ARTR-90-7, University of California,
Irvine, 1990
NASA/CR 2002-211992 72
Page 81
Drennan, S.A., Peterson, C.O., Khatib, F.M., Sowa, W.A., Samuelsen,
G.S., "Pollutant Emissions From and Within a Model Gas Turbine
Combustor at Elavated Pressures and Temperatures," UCI Combustion
Laboratory, University of California, Irvine, 1993
Drennan, S.A., Sowa, W.A., and Samuelsen, G.S., "The Effects of
Ambient Pressure on the Spray Characteristics of a Twin-Fluid Atomizer,"
1990, ASME Paper 90-GT-393
Fenimore, C.P., 13th Symposium on Combustion, The Combustion Institute,
1971, p. 373
Fenirnore, C.P., Drake, M.C., Correa, S.M., Pitz, R.W., and Shyy, W.,
"Superequilibrium and Thermal Nitric Oxide Formation in Turbulent
Diffusion Flames", Combustion and Flame 69, pp. 347-365, 1987
Fowler, J, Honnery, D., "The Influence of Pressure on NOx Production
from Turbulent H2-Air Diffusion Flames," Western States Section of the
Combustion Institute, Paper 93-041, 1993
Gardiner, W.C., Combustion Chemistry, Springer-Verlag, New York, 1987
Grove, J.W., and Samuelsen, G.S., "Transformation of Nitrogen Oxides
While Sampling Combustion Products," University of California, Irvine,1984
Glassman, I., Combustion, Second Edition, Academic Press, Orlando, 1987.
Haynes, B.S., Iverach, D., and Kirov, N.Y., 15th Symposium on
Combustion, The Combustion Institutem 1975, p. 1103
Herberling, P.V., "Prompt NO" Measurements at High Pressures, 16th
Symposium on Combustion, The Combustion Institute, 1976, pp. 159-168
NASA/CR 2002-211992 73
Page 82
Hori, Morio, "Experimental Study of NO2 Formation in Combustion
Systems," 21st Symposium on Combustion, The Combustion Institute, 1986,
pp. 1181-1188
ICAO, US Extension of the ICAO Standard Atmosphere, 1958
Iverach, D., Basden, K.S., and Kirov, N.Y., "Formation of Nitric Oxide in
Fuel-Lean and Fuel Rich Flames," 14th Symposium on Combustion, The
Combustion Institute, 1974, pp. 767 -775
Johnston, H., "Reduction of Stratospheric Ozone by Nitrogen Oxide
Catalysts from Supersonic Aircraft Exhaust," Science, Vol. 173, 1971, pp.517-521
Jones, Robert E.; Trout, Arthur M., Wear, Jerrold D., McBride, Bonnie J.,
"Combustion Gas Properties: I-ASTM Jet A Fuel and Dry Air," Lewis
Research Center, Cleveland, OH, 1984.
Lefebvre, A.H., Gas Turbine Combustion, Hemisphere Publishing, New
York, 1983
Lipfert, F.W., "Correlation of Gas Turbine Emissions Data," ASME Paper
No. 72-GT-60
Martel, Charles, R., "Molecular Weight and Average Composition of JP-4,
JP-5, JP-8 and Jet-A", AFWAL/POSF, 1988
Martin, F.J., and Dederick, P.K., "NOx From Fuel Nitrogen in Two-Stage
Combustion," 16th Symposium on Combustion, The Combustion Institute,
1976, pp. 191- 198
NASA/CR 2002-211992 74
Page 83
Mattingly, Jack D., Heiser, William H., Daley, Daniel H., Aircraft Engine
Design, American Institute of Aeronautics and Astronautics, Inc., 1987, pp.
332,333
Miller, James A., and Bowman, Craig T., "Mechanism and Modeling of
Nitrogen Chemistry in Combustion," Progress in Energy and Combustion
Science, 1991
Mosier, S.A., Pierce, R.M., Smith, C.E., and Hinton B.S., "Advanced
Combustor Systems for Stationary Gas Turbines," Final Report FR 11405,
Contract No. 68-02-2136, U.S. Environmental Protection Agency,
31 March, 1980
Natarajan, K., and Roth, P., "A Shock Tube Study of CN Radical Reactions
with H2 and NO Verified by H, N, and O Atom Measurements," 21st
Symposium on Combustion, The combustion Institute, 1986, pp. 729-737
Odgers, J., "Current Theories of Combustion Within Gas Turbine
Chambers," 15th Symposium on Combustion, The Combustion Institute,
1974
Odgers, J., and Kretschmer, D., The Design and Development of Gas
Turbine Combustors - Volume 1, Northern Research and Engineering
Corporation, Woburn, Mass., 1980, p. 1.27
Peterson, C.R., and Hill, P.G., Mechanics and Thermodynamics of
Propulsion, Addison-Wesley, Mass, 1965, pp. 157,158
Pratt & Whitney Operating Instructions 200, The Aircraft Gas Turbine
Engine and its Operation, United Technologies Corporation, 1988
Sadakata, M., Fujioka, Y., mad Kunii, D., "Effects of Air Preheating on
Emissions of NO, HCN, and NH3 from Two-Stage Combustion," 18th
Symposium on Combustion, The Combustion Institute, 1981, pp. 65-72
NASA/CR 2002-211992 75
Page 84
Semerjian, H., and Vranos, A., "NOx Formation in Turbulent Premixed
Flame," 16th Symposium on Combustion, The Combustion Institute, 1976,
pp. 169-178
Samuelsen, G.S., "The Combustion Aspects of Air Pollution," Advances in
Environmental Science and Technology, Wiley, New York, NY, pp. 219-
322, 1975.
Smith, I.E., Combustion in Advanced Gas Turbine Systems, Proceedings of
an International Propulsion Symposium held at the College of Aeronautics,
Cranfield, 1968
Szekely, A., Hanson, R.K., and Bowman, C.T., International Journal of
Chemical Kinetics. No 15, p 915, 1983
Personal Communication with Charles Westbrook, Sept, 1992
Yamagishi, Kazuo, Nozawa, Masaaki, Yoshie, Terukazu, Tokumoto,
Tsunenori, and Kakegawa, Yasuo, "A Study of NOx Emissions
Characteristics in Two-Stage Combustion," 15th Symposium on
Combustion, The Combustion Institute, pp. 1157-1166, 1975
Zeldovich, J., "The Oxidation of Nitrogen in Combustion and Explosions,"
Acta Physicochimica, URSS, Vol. 21, 4, pp. 577-628., 1946.
NASA/CR 2002-211992 76
Page 85
APPENDIX A: EI(NOx) EQUATION DERIVATION
The equation used to convert the measured ppm value for NOx to the
corresponding emissions index was derived in the following manner:
By definition:
EI(NOx) = (grams of NO x produced / kg of fuel consumed)
Grams of NO x can be expressed in terms of ppm NO x using the following
equation:
grams NOx = ppm NO x [(MW NOx / MW exhuast)] grams of
exhaust
Since the ppm measurements are recorded based on a dry sample volume,
they must be corrected to account for the volume of condensed water.
EI(NOx) = (MW NOx/MWdry exhaust) [(100- %H20)/100 ]
(grams of exhaust / kg of fuel consumed) NO x ppm
For this thesis, the % of NO x that was NO was greater than 90%. The
convention, however, is that the molecular weight of NOx is that of NO 2.
Therefore:
EI(NOx) = (MW NO2/MWdry exhaust) [(100- %H20)/100 ]
(grams of exhaust / kg of fuel consumed) NO x ppm
NASA/C_2002-211992 77
Page 86
APPENDIX B: EMISSIONS ANALYZERS
Thermo Electric Model 10A Chemiluminescent NO/NO x Analyzer
In the NO/NO x analyzer, the chemiluminescent reaction of NO and 0 3
provided the basis for the analysis. Specifically,
NO + 0 3 "--) NO 2 + 0 2 + hv
Light emission results when electronically excited NO 2 molecules revert to
their ground state.
To measure NO concentrations, the gas sample to be analyzed was
blended with 0 3 in a reaction chamber. The resulting chemiluminescence
was monitored through an optical filter by a high-sensitivity photomultiplier
positioned at one end of the chamber. The filter/photomultiplier
combination responded to light in a narrow-wavelength band unique to the
above reaction (hence, no interference). The output from the
photomultiplier was linearly proportional to the NO concentration.
To measure NOx concentrations (i.e., NO plus NO2), the sample gas
flow was diverted through to an NO2 to NO converter. The
chemiluminescent response in the reaction chamber to the converter
effluent was linearly proportional to the NO x concentration entering the
converter.
Beckman Model 755 0 2 Analyzer
The Beckman Industrial Model 755 02 analyzer measured the
magnetic susceptibility of the sample gas. 02 is strongly paramagnetic.
NASA/CR 2002-211992 78
Page 87
Other gases, "with few exceptions, are weakly diamagnetic. Of these
exceptions, none constitute a substantial component of combustion exhaust.
Horiba Model PIR 2000 CO/CO 2 Analyzers
The Horiba Model PIR 2000 analyzers continuously determined the
concentration change of CO and CO 2 by measuring tahe infrared absorption
specific to the species of interest. Both of these molecules absorb infrared
radiation of a specific wavelength and the degree of absorption is
proportional to the concentration at constant pressure.
More specifically, the Horiba analyzers used the following design.
Infrared radiation was emitted from a light source and passed through a
sample cell containing emissions sample and a reference cell containing air.
After passing through the cells, the radiation was modulated by a rotating
chopper, ff a portion of the infrared radiation passing through the sample
cell was absorbed by the sample gas, a decrease in amount of radiation
reaching the sample side of the detector would result. This difference
caused a membrane between the sample and reference cells in the detector
to produce an electrical output which was amplified and directed to a meter.
Horiba MEXA-554GE and Hot FID,, Model 1120 TPd-F UHC Analyzers
The first of the hydrocarbon detectors, the MEXA-554GE table top
analyzer, was loaned to UCI by ttoriba. This Model's primary designed
usage is in the auto smog servicing industry.
The second hydrocarbon analyzer was the Horiba Hot FID, Model 1120
TRI-F. This unit measured the concentration of the total hydrocarbons
present in a sample of gas by means of a hydrogen flame ionization
detector, or FID. The principle of the hydrogen flame ionization detection
NASA/CRY002-211992 79
Page 88
method is that if a trace amount of hydrocarbons is introduced into a
hydrogen flame within the analyzer, the hydrocarbons decompose by the
high temperature energy of the flame. As a result of this reaction, a number
of ions proportional to the number of carbon atoms are generated. By
applying a direct voltage across the flame and placing a collective electrode
around the flame, ions are collected. In this manner, the current
proportional to the number of carbon atoms is passed through the collective
electrode and is processed as a signal. The hydrogen flame ionization
detection method is least sensitive to inorganic gases (such as CO, CO2,
NO, NO2, SO2, and N2) which normally coexist in the sample.
NASA/CR 2002-211992 80
Page 89
APPENDIX C: DATA FROM RUMMAGE II
The Rummage II linear regression program (Bryce, 1980) used to
analyze the data from the Phase 1 testing assumes the operating parameters
of the model RQL combustor (inlet pressure, inlet temperature, reference
velocity, rich zone equivalence ratio and lean zone equivalence ratio) can
be related to the computed EI(NOx) value by the following equation:
ln[EI(NOx) ] = Clln(P3) + C21n(T3 ) + C31n(Ref Vel) +
C41n(_rz ) + C51n(_lz )
Where C 1, C2, C3, C4, and C 5 are constants determined to fit the data.
This equation can be expressed in the following form:
ln(EI(NOx) ) = ln(p3C1 • T3C2, Ref Vel C3 , _rz C4 • _lz C5)
Taking the exponential from both sides reveals:
EI(NOx) = P3 C1 * T3 C2 * RefVel C3 * _rz C4 * _lz C5
NASA/CR 2002-211992 81
Page 90
The constants computed by Rummage were:
C 1 = 0.42
C 2 = O.77
C 3 -- - 0.51
C 4 = - 1.51
C 5 = 1.84
NASA/CR 2002-211992 82
Page 91
=2
_. OO_
O_',_,(N
o "_'_ o
_0
_oo
u_C, qr".-.
O41,O,-q
_IO0
odd
0 _ 0 _H 00_ H _
I I
O to _ ,,_, OI
• ° .
o _
(0 ¢.,9
0 t_l H
i_ ¢e) ¢"10
d ,4d_; d
,..._ ¢q ¢v,/
ko ,-.4 e-i
ooo
0_ _ 00_
• 0
O _ O
_0 _ _0 _ _0
_00 _ 000 _ _00
m
mM
_ H
>
_ _ _o
o _mo _ _ zzm__0_0oH OMO _HO_O _H_O
0_0 _0 _0
0 HO _0
H_ HZ
c.(2 ,no
-0 ,_ -0
,-t o4
_,_ r..)•
0_: -0
,-4
•m 0
¢%1
NASA/CRy2002-211992 83
Page 92
O
ffl
t,) U
4,o,t
+
O
o
tt O e,lO
Im e,_eO
t I 0
0
0
.I
O
0
o4
0
S
_J
0
U
8
,IB
8
O
t)
t9
B
0
u_
O
c) z0
0 <
! I I I
NASA/CR 2002-211992 84
Page 93
o
o
o
o',
o
0
o-,
0
0t_¢h
0
oo0o
o
o
o00o0
0
o000
0
0
00
0
cO
oo0
00
003erl
000
_3
00
ou3
0
0o0
000
0
0000
u_ o
0
00o 0
0 r_
00¢0
0
0 ,4=,
o ch
oI
00 0
00
0 ¢'_0000
o4 I'-
o
o_
0 cO
0o o_0 Lt_
o._
0 _h000 ,-t
0
I
o ¢_
0 1"_0 uO0 ch
0
0 l_-000 cq00
00
o4 I'_
00
000
0
,-.4
o%
c_
0 c"_0 00 000
O,--4
00 o400o o_
I
0 _')0 I'_0 u_,0 o_,
0 o4
0 1_0 0
0o 0
0 0
o_ I_-
og
00000 ,.o0 o,,
0 In
00
0 o4
0 o%
,.-d!
0 _'_0
0 _'_
0 e,I
0 I"_
00
0000
o4 I _
000o00_00__0000000o0_0_0_
_0 0_0_0__ °..°°.°.°.°.°0°
000000000__ZO0000000__
_000_0__°e.°.0....°l.°.
_0_0000000_o0
_00_000000000
_ __0_0_
...............
00_ _0__00_0_0_ _ I
4"-
_+
+CO_-_ 0
r_ +
0r,, e_
.-4
_4rn +
0
N
NASA/C_2002-211992 85
Page 94
r,1o oO
O
,-4
O Cl
zm
aM
o_4 M
< ::,4
O
m ag
(21ul M m
m m z,,_ ,< ,<
O
m o7 _ ==
,<DI Z r.
Ul
Z ,<M
Z Mt-_ M O
M O
....°_o_
O
_oo_o_o
O_
..°0°
o_oooo_ooo_OOO
..°o.
_0000_000000000
.,,0._0000
o_ _
,,,.,_o_ _o
_o_
o% o%
dd
1
0r.,
I
c_ E_C_ cn
1210,¢,ffl
Z
H
m<
_n
m O
o
_NS
| Z ,-_MC: ¢n
O
Z
OZ
ooooo_ooooo_
_ ooooo_
ooooo
O __Z
O
O
O
O_OX
d o
HO o__
_H _000_
_ , ,_
_0
0
<
HE
MZ
0 _0_
NASA/C_2002 211992 86
Page 95
r..
00
c_
r-t
/4
O
< M
II1
[.i
<
Z
eOZ
I-4
D
>Ct)
r uO
Offl
m
<Z r.
t_
r., o
o
c)
u3
o
oo
ooo
o
c__D
,4
if)
,4
u3
000_000_000_
.°..000_
0000
00_000_0
0_00
00000_00
_000
_000
_000
000000000000
dd_d
Hu_ ,-1
< d
oo__0_00__0_
....._
Z
M_ O
O _
_o__ 0
o
oo
o
c_
c_
oo
o
o
o
0
0") 0 0"_Lr) o
,:; d ,:;
III
0 I 0
_,_ r_ I C-_0
0o0
0
CO
co
r--
0u-)_D
o
0
c_ cou') t'-._,0 ,.0
0
o,I
0
o
II
IiI 0
0
0
oo
o
o
II
[
0
O
NASA/C_2002 211992 87
Page 96
C_O u3 t_ (0 t_ _ _ "q_ O_ _0 O3
I I I
0 0 0 0 _ 0 o 0 0 o
O 0 0 ¢D 0 0 0 0 0 0 0
_D
C}C9
CO C_
m_b]
o_
Z
D_O_
0
to b3 _ tO _.o _ i'_ LO _ _o_.o
o o _ o o o 3 o o d o! ! !
t_ _ bO Lo c'_ cO _ _ _P0 _ _x; ¢0 0 ,'_ 4.O _0 b3 _ o_
0
-.I* ÷ + + +
Q_
°0._
O
oo
+O
03,.,.-I
O
++I/3
e_
NASA/CR 2002-211992 88
Page 97
z
r-4
r-I
,-4
i-4 f-!
_-t v-t
I
II
+IIII+IIII+IIII+II0 0 0 00 0 0 0
_ _ 0
r-Ii-4
v-I
i-I t-I
i'-4r-I
00
+C_
+
00
+
4"
II+IIII+IIII+0 0 0o o o
! I I
-t-
+
+
OO
i,,-4
OO
O
o
if')
0,1
O
r-I
O
O
NASA/C_2002-211992 89
Page 98
2"
0
dr.,.l
co
ra.l
o _
• o
_1 ,--4_ *.
ffl
r-i
I.i
_u
o-i
if)ol c_l
if)
r-4 _
_.1 f-i
+IIII_IIII+IIII+IIII@I0 0 0 0 00 0 0 0 0
• •
0
r-4t-4
I I I
NASA/C_2002-211992 90
Page 99
Form ApprovedREPORT DOCUMENTATION PAGEOMB No. 0704-0188
Public reporting burden for this collection of information is estimated to average 1 hour per response, including the time for reviewing instructions, searching existing data sources,
gathering and maintaining the data needed, and completing and review#lg the collection of information. Send corrlments regarding this burden estimate or any other aspect of this
collection of information, including suggestions for reducing this burden, to Washington Headquarters Services. Dhectorate for Information Operations and Reports, 1215 Jefferson
Davis Highway, Suite 1204, Arlington, VA 22202-4302, and to the Office of Management and Budget Paperwork Reduction Project (0704-.0188), Washington, DC 20503.
1. AGENCY USE ONLY (Leave blank) 2. REPORT DATE 3. REPORT TYPE AND DATES COVERED
December 2002 Final Contractor Report
4, TITLE AND SUBTITLE 5, FUNDING NUMBERS
Performance of a Model Rich Burn-Qnick Mix-Lean Bum Combustor at Elevated
Temperature and Pressure
6. AUTHOR(S) WBS-22-714-02-08NAG3-1110
Christopher O. Peterson, William A. Sowa, and G.S. Samuelsen
7. PERFORMING ORGANIZATION NAME(S) AND ADDRESS(ES) 8. PERFORMING ORGANIZATIONREPORT NUMBER
University of California, Irvine
It'vine, California 92697-3550 E-13663
9. SPONSORING/MONITORING AGENCY NAME(S) AND ADDRESS(ES) 10. SPONSORING/MONITORINGAGENCY REPORT NUMBER
National Aeronautics and Space Administration
Washington, DC 20546-0(101 NASA CR-------2002-211992
11. SUPPLEMENTARY NOTES
Project Manager, Robert R. Tacina, Turbomachinery and Propulsion Systems Division, NASA Glenn Research Center,
216---433---3388.organization code 5830, - '
12a. DISTRiBUTION/AVAILABILITY STATEMENT
Unclassified- Unlimited
Subject Category: 07 Distribution: Nonstandard
Available electronically at http://_ltrs.grc.n_a.gov
][his publication is available from the NASA Center for AeroSpace Infonnaiom 301-621-0390.
12b. DISTRNBUTION CODE
13. ABSTRACT (Maximum 200 words)
As interest in pollutant emission from stationaD" and aero-engine gas turbines increases, combustor engineers must consider various
configurations. One configuration of increasing interest is the staged, rich bum - quick mix - lean burn (RQL) combustor. This report
summarizes an investigation conducted in a recently developed high pressure gas turbine coml-mstor facility-. The model RQL
combustor was plenum fed and modular in design. The %el used for this study is Jet-A which was injected from a simplex atomizer.
Emission (CO 2, CO, O 2, UHC, NOx) measurements were obtained using a stationm 7 exit plane water-cooled probe and a traversing
water-cooled probe which sampled from the rich zone exit and the lean zone entrance. The RQL combustor was operated at inlet
temperatures ranging from 367 to 700 K, pressures ranging from 200 to 1000 kPa, and combustor reference velocitites ranging from
10 to 20 m/s. Variations were also made in the rich zone and lean zone equivalence ratios. Several significant trends were observed.
NO x production increased with reaction temperature, lean zone equivalence ratio and residence time and decreased with increased
rich zone equivalence ratio. NO× production in the model RQL coml-mstor increased to the 0.4 power with increased pressure. This
correlatiom compared to those obtained for non-staged combustors (0.5 to 0.7), suggests a reduced dependence on NO x on pressure
for staged combustors. Emissions profiles suggest that rich zone mixing is not uniform and that the rich zone contributes on the order
of 16 percent to the total NO x produced.
14. SUBJECT TERMS
Combustion chambers; Gas turbines; El-nissions; Contaminants; Burners; Nitric oxide;
Jet mixing flow
17. SECURITY CLASSIFICATIONOF REPORT
Unclassified
NSN 7540-01-280-5500
15. NUMBER OF PAGES
9)16. PRICE CODE
18, SECURITY CLASSiFICATiON 19. SECURITY CLASSIFICATION 20. LIMiTATiON OF ABSTRACTOF THIS PAGE OF ABSTRACT
Unclassified Uncl assifi ed
Standard Form 298 (Rew 2-89)
Prescribed by ANSI Std. Z39-18298-102