Performance of automated scoring of ER, PR, HER2, CK5/6 and EGFR in breast cancer tissue microarrays in the Breast Cancer Association Consortium William J Howat, 1 Fiona M Blows, 2 Elena Provenzano, 3 Mark N Brook, 4 Lorna Morris, 1,5 Patrycja Gazinska, 6 Nicola Johnson, 1 Leigh-Anne McDuffus, 1 Jodi Miller, 1 Elinor J Sawyer, 7 Sarah Pinder, 8 Carolien H M van Deurzen, 9 Louise Jones, 10,11 Reijo Sironen, 12,13 Daniel Visscher, 14 Carlos Caldas, 1 Frances Daley, 15 Penny Coulson, 4 Annegien Broeks, 16 Joyce Sanders, 17 Jelle Wesseling, 17 Heli Nevanlinna, 18 Rainer Fagerholm, 18 Carl Blomqvist, 19 P€ aivi Heikkil € a, 20 H Raza Ali, 1 Sarah-Jane Dawson, 1 Jonine Figueroa, 21 Jolanta Lissowska, 22 Louise Brinton, 21 Arto Mannermaa, 12,13 Vesa Kataja, 23,24 Veli-Matti Kosma, 12,13 Angela Cox, 25 Ian W Brock, 25 Simon S Cross, 26 Malcolm W Reed, 25 Fergus J Couch, 14 Janet E Olson, 27 Peter Devillee, 28 Wilma E Mesker, 29 Caroline M Seyaneve, 30 Antoinette Hollestelle, 30 Javier Benitez, 31,32 Jose Ignacio Arias Perez, 33 Primitiva Menendez, 34 Manjeet K Bolla, 35 Douglas F Easton, 2,35 Marjanka K Schmidt, 36 Paul D Pharoah, 2,35 Mark E Sherman 21y and Montserrat Garc ıa-Closas 4,15y, * 1 Cancer Research UK Cambridge Institute, University of Cambridge, Cambridge, UK 2 Centre for Cancer Genetic Epidemiology, Department of Oncology, University of Cambridge, Cambridge, UK 3 Breast Pathology, Addenbrookes Hospital, Cambridge, UK 4 Division of Genetics and Epidemiology, The Institute of Cancer Research, London, UK 5 Department of Oncology, University of Cambridge, Cambridge, UK 6 Breakthrough Breast Cancer Research Unit, Division of Cancer Studies, King’s College London, Guy’s Hospital, London, UK 7 Division of Cancer Studies, NIHR Comprehensive Biomedical Research Centre, Guy’s & St. Thomas’ NHS Foundation Trust in partnership with King’s College London, London, UK 8 Research Oncology, Division of Cancer Studies, King’s College London, Guy’s Hospital, London, UK 9 Department of Pathology, Erasmus University Medical Center, Rotterdam, The Netherlands 10 Centre for Tumour Biology, Barts Institute of Cancer, Barts, UK 11 The London School of Medicine and Dentistry, London, UK 12 School of Medicine, Institute of Clinical Medicine, Pathology and Forensic Medicine, Cancer Center of Eastern Finland, University of Eastern Finland, Kuopio, Finland 13 Imaging Center, Department of Clinical Pathology, Kuopio University Hospital, Kuopio, Finland 14 Department of Laboratory Medicine and Pathology, Mayo Clinic, Rochester, MN, USA 15 Breakthrough Breast Cancer Research Centre, Division of Breast Cancer Research, The Institute of Cancer Research, London, UK 16 Core Facility for Molecular Pathology and Biobanking, Netherlands Cancer Institute, Antoni van Leeuwenhoek Hospital, Amsterdam, The Netherlands 17 Department of Pathology, Division of Diagnostic Oncology, Netherlands Cancer Institute, Antoni van Leeuwenhoek Hospital, Amsterdam, The Netherlands 18 Department of Obstetrics and Gynecology, University of Helsinki and Helsinki University Central Hospital, Helsinki, Finland 19 Department of Oncology, Helsinki University Central Hospital, Helsinki, Finland 20 Department of Pathology, Helsinki University Central Hospital, Helsinki, Finland 21 Division of Cancer Epidemiology and Genetics, National Cancer Institute, Rockville, Maryland, USA 22 Department of Cancer Epidemiology and Prevention, M. Sklodowska-Curie Memorial Cancer Center & Institute of Oncology, Warsaw, Poland 23 Kuopio University Hospital, Cancer Center, Kuopio, Finland 24 School of Medicine, Institute of Clinical Medicine, University of Eastern Finland, Oncology and Central Hospital of Central Finland, Central Finland Hospital District, Kuopio, Finland 25 CRUK/YCR Sheffield Cancer Research Centre, Department of Oncology, University of Sheffield, Sheffield, UK 26 Academic Unit of Pathology, Department of Neuroscience, University of Sheffield, Sheffield, UK 27 Department of Health Sciences Research, Mayo Clinic, Rochester, MN, USA 28 Department of Human Genetics & Department of Pathology, Leiden University Medical Center, Leiden, The Netherlands 29 Department of Surgical Oncology, Leiden University Medical Center, RC Leiden, The Netherlands 30 Family Cancer Clinic, Department of Medical Oncology, Erasmus MC Cancer Institute, Rotterdam, The Netherlands 31 Human Genetics Group, Human Cancer Genetics Program, Spanish National Cancer Research Centre (CNIO), Madrid, Spain 32 Centro de Investigaci on en Red de Enfermedades Raras (CIBERER), Valencia, Spain 33 Servicio de Cirug ıa General y Especialidades, Hospital Monte Naranco, Oviedo, Spain Original Article V C 2014 John Wiley and Sons Ltd and The Pathological Society of Great Britain and Ireland J Path: Clin Res January 2015; 1: 18–32 This is an open access article under the terms of the Creative Commons Attribution NonCommercial License, which permits use, distribution and reproduction in any medium, provided the original work is properly cited and is not used for commercial purposes. The Journal of Pathology: Clinical Research J Path: Clin Res January 2015; 1: 18–32 Published online 4 December 2014 in Wiley Online Library (wileyonlinelibrary.com). DOI: 10.1002/cjp2.3
Transcript
Performance of automated scoring of ER, PR, HER2, CK5/6 andEGFR in breast cancer tissue microarrays in the Breast CancerAssociation Consortium
William J Howat,1 Fiona M Blows,2 Elena Provenzano,3 Mark N Brook,4 Lorna Morris,1,5 Patrycja Gazinska,6
Rainer Fagerholm,18 Carl Blomqvist,19 P€aivi Heikkil€a,20 H Raza Ali,1 Sarah-Jane Dawson,1 Jonine Figueroa,21
Jolanta Lissowska,22 Louise Brinton,21 Arto Mannermaa,12,13 Vesa Kataja,23,24 Veli-Matti Kosma,12,13
Angela Cox,25 Ian W Brock,25 Simon S Cross,26 Malcolm W Reed,25 Fergus J Couch,14 Janet E Olson,27
Peter Devillee,28 Wilma E Mesker,29 Caroline M Seyaneve,30 Antoinette Hollestelle,30 Javier Benitez,31,32
Jose Ignacio Arias Perez,33 Primitiva Men�endez,34 Manjeet K Bolla,35 Douglas F Easton,2,35
Marjanka K Schmidt,36 Paul D Pharoah,2,35 Mark E Sherman21y and Montserrat Garc�ıa-Closas4,15y,*
1 Cancer Research UK Cambridge Institute, University of Cambridge, Cambridge, UK2 Centre for Cancer Genetic Epidemiology, Department of Oncology, University of Cambridge, Cambridge, UK3 Breast Pathology, Addenbrookes Hospital, Cambridge, UK4 Division of Genetics and Epidemiology, The Institute of Cancer Research, London, UK5 Department of Oncology, University of Cambridge, Cambridge, UK6 Breakthrough Breast Cancer Research Unit, Division of Cancer Studies, King’s College London, Guy’s Hospital, London, UK7 Division of Cancer Studies, NIHR Comprehensive Biomedical Research Centre, Guy’s & St. Thomas’ NHS Foundation Trust in partnership
with King’s College London, London, UK8 Research Oncology, Division of Cancer Studies, King’s College London, Guy’s Hospital, London, UK9 Department of Pathology, Erasmus University Medical Center, Rotterdam, The Netherlands10 Centre for Tumour Biology, Barts Institute of Cancer, Barts, UK11 The London School of Medicine and Dentistry, London, UK12 School of Medicine, Institute of Clinical Medicine, Pathology and Forensic Medicine, Cancer Center of Eastern Finland, University of
Eastern Finland, Kuopio, Finland13 Imaging Center, Department of Clinical Pathology, Kuopio University Hospital, Kuopio, Finland14 Department of Laboratory Medicine and Pathology, Mayo Clinic, Rochester, MN, USA15 Breakthrough Breast Cancer Research Centre, Division of Breast Cancer Research, The Institute of Cancer Research, London, UK16 Core Facility for Molecular Pathology and Biobanking, Netherlands Cancer Institute, Antoni van Leeuwenhoek Hospital, Amsterdam,
The Netherlands17 Department of Pathology, Division of Diagnostic Oncology, Netherlands Cancer Institute, Antoni van Leeuwenhoek Hospital, Amsterdam,
The Netherlands18 Department of Obstetrics and Gynecology, University of Helsinki and Helsinki University Central Hospital, Helsinki, Finland19 Department of Oncology, Helsinki University Central Hospital, Helsinki, Finland20 Department of Pathology, Helsinki University Central Hospital, Helsinki, Finland21 Division of Cancer Epidemiology and Genetics, National Cancer Institute, Rockville, Maryland, USA22 Department of Cancer Epidemiology and Prevention, M. Sklodowska-Curie Memorial Cancer Center & Institute of Oncology, Warsaw,
Poland23 Kuopio University Hospital, Cancer Center, Kuopio, Finland24 School of Medicine, Institute of Clinical Medicine, University of Eastern Finland, Oncology and Central Hospital of Central Finland, Central
Finland Hospital District, Kuopio, Finland25 CRUK/YCR Sheffield Cancer Research Centre, Department of Oncology, University of Sheffield, Sheffield, UK26 Academic Unit of Pathology, Department of Neuroscience, University of Sheffield, Sheffield, UK27 Department of Health Sciences Research, Mayo Clinic, Rochester, MN, USA28 Department of Human Genetics & Department of Pathology, Leiden University Medical Center, Leiden, The Netherlands29 Department of Surgical Oncology, Leiden University Medical Center, RC Leiden, The Netherlands30 Family Cancer Clinic, Department of Medical Oncology, Erasmus MC Cancer Institute, Rotterdam, The Netherlands31 Human Genetics Group, Human Cancer Genetics Program, Spanish National Cancer Research Centre (CNIO), Madrid, Spain32 Centro de Investigaci�on en Red de Enfermedades Raras (CIBERER), Valencia, Spain33 Servicio de Cirug�ıa General y Especialidades, Hospital Monte Naranco, Oviedo, Spain
Original Article
VC 2014 John Wiley and Sons Ltd and The Pathological Society of Great Britain and Ireland J Path: Clin Res January 2015; 1: 18–32This is an open access article under the terms of the Creative Commons Attribution NonCommercial License, which permits use, distribution andreproduction in any medium, provided the original work is properly cited and is not used for commercial purposes.
The Journal of Pathology: Clinical Research
J Path: Clin Res January 2015; 1: 18–32
Published online 4 December 2014 in Wiley Online Library
34 Servicio de Anatom�ıa Patol�ogica, Hospital Monte Naranco, Oviedo, Spain35 Centre for Cancer Genetic Epidemiology, Department of Public Health and Primary Care, University of Cambridge, Cambridge, UK36 Division of Molecular Pathology, Netherlands Cancer Institute, Antoni van Leeuwenhoek Hospital, Amsterdam, The Netherlands
*Correspondence to: Montserrat Garcia-Closas, Molecular EpidemiologyTeam, Division of Genetics and Epidemiology,The Institute of CancerResearch,15 Cotswold Rd, Belmont, Sutton, Surrey SM2 5NG,United Kingdom.e-mail: [email protected]
Abstract
Breast cancer risk factors and clinical outcomes vary by tumour marker expression. However, individual studiesoften lack the power required to assess these relationships, and large-scale analyses are limited by the need forhigh throughput, standardized scoring methods. To address these limitations, we assessed whether automatedimage analysis of immunohistochemically stained tissue microarrays can permit rapid, standardized scoring oftumour markers from multiple studies. Tissue microarray sections prepared in nine studies containing 20 263cores from 8267 breast cancers stained for two nuclear (oestrogen receptor, progesterone receptor), two mem-branous (human epidermal growth factor receptor 2 and epidermal growth factor receptor) and one cytoplasmic(cytokeratin 5/6) marker were scanned as digital images. Automated algorithms were used to score markers intumour cells using the Ariol system. We compared automated scores against visual reads, and their associationswith breast cancer survival. Approximately 65–70% of tissue microarray cores were satisfactory for scoring.Among satisfactory cores, agreement between dichotomous automated and visual scores was highest for oestro-gen receptor (Kappa 5 0.76), followed by human epidermal growth factor receptor 2 (Kappa 5 0.69) and proges-terone receptor (Kappa 5 0.67). Automated quantitative scores for these markers were associated with hazardratios for breast cancer mortality in a dose-response manner. Considering visual scores of epidermal growth fac-tor receptor or cytokeratin 5/6 as the reference, automated scoring achieved excellent negative predictive value(96–98%), but yielded many false positives (positive predictive value 5 30–32%). For all markers, we observedsubstantial heterogeneity in automated scoring performance across tissue microarrays. Automated analysis is apotentially useful tool for large-scale, quantitative scoring of immunohistochemically stained tissue microarraysavailable in consortia. However, continued optimization, rigorous marker-specific quality control measures andstandardization of tissue microarray designs, staining and scoring protocols is needed to enhance results.
Keywords: breast tumours; immunohistochemistry; tissue microarrays; digital pathology; automated scoring
Received 11 March 2014; accepted 28 May 2014†These authors jointly directed this work.
Conflict of interest: The authors have declared no conflicts of interest.
Introduction
Breast cancer is a biologically heterogeneous disease,which comprises multiple distinctive subtypes thatare distinguishable by immunohistochemistry (IHC)[1,2] or molecular analysis such as transcriptomicprofiling [3–5]. Clinically, IHC staining for oestrogenreceptor (ER), progesterone receptor (PR) and epider-mal growth factor receptor 2 (HER2) is routinely per-formed in most diagnostic laboratories to help selectadjuvant treatment and to assess prognosis [6,7].Research studies demonstrate that expanding thisIHC panel to include markers of basal breast cancers,such as cytokeratin 5/6 (CK5/6) and epidermalgrowth factor receptor 1 (EGFR or HER1), can ena-ble more detailed molecular subtyping, approximat-ing taxonomies based on molecular profiling [1,8,9].
Evaluating differences across breast cancer sub-
types is central to etiological and clinical research.
However, such studies require large sample sizes in
order to include sufficient numbers of the less com-
mon subtypes, many of which are clinically impor-
tant. Tissue microarrays (TMAs) can be used to
assess IHC results for multiple cases in one tissue
section [10], enabling standardized IHC staining and
facilitating scoring. Given that visual scoring is
labour intensive and suffers from imperfect inter-
sis has been proposed as an alternative that may offer
logistical advantages with good reliability.Automated analysis of pathology images has been
in use for more than 20 years [11] and has beenapplied extensively in recent years in the study ofbreast cancer with increasingly complex algorithms
Automated scoring of breast tumour TMAs 19
VC 2014 John Wiley and Sons Ltd and The Pathological Society of Great Britain and Ireland J Path: Clin Res January 2015; 1: 18–32
and improved concordance with visual scores [12–18]. However, most comparisons are based on TMAsof a few hundred to a few thousand tumours con-structed and stained in a single pathology laboratory.Although centralized construction and staining ofTMAs is desirable to obtain comparable data [19],this is not always practical in large collaborativeinvestigations that aggregate pathology samples frommultiple studies.
This article details the application of fully auto-mated image analysis of 8267 breast cancers collatedfrom nine studies within the Breast Cancer Associa-tion Consortium (BCAC) [20]. Automated imageanalysis was applied to score nuclear (ER, PR),membranous (HER2, EGFR) and cytoplasmic (CK5/6) markers to determine the usefulness and pitfalls ofthis approach and to identify limitations that mightbe addressed with methodological research.
Materials and methods
Study populations
This report includes nine BCAC studies withformalin-fixed, paraffin-embedded tumour blocks thathad been previously prepared as TMAs (supplemen-tary material Table 1). Relevant research ethics com-mittees approved all studies; samples wereanonymized before being sent to two coordinatingcentres at Strangeways Research Laboratory (Univer-sity of Cambridge, Cambridge, UK) and Break-through Pathology Core Facility (Institute of CancerResearch, London, UK) for analysis. A total of 8267cases with information on clinico-pathological char-acteristics of the tumour, obtained from clinicalrecords or centralized review of cases, were includedin the analyses (supplementary material Table 2).
TMA immunohistochemistry
Three studies (ABCS, PBCS and SEARCH) providedpreviously stained TMA slides of ER and PR, fourstudies (ABCS, HEBCS, PBCS and SEARCH) ofHER2, three studies (ABCS, KBCP, PBCS) of CK5/6 and three studies (HEBCS, KBCP, PBCS) ofEGFR. Studies lacking pre-existing stained TMAs forspecific stains provided unstained TMA slides forcentralized staining. Staining centres and protocolsare detailed in supplementary material Table 3.
Automated Ariol scanning and scoring of TMAs
All TMA slides were scanned and analysed on theLeica Ariol system (Leica Biosystems, Newcastle
upon Tyne, UK) using standard procedures and prede-fined algorithms tuned by an image analysis expert(see details in supplementary material). A single tunedalgorithm was then applied to all TMAs. For ER andPR nuclear staining, we obtained automated measuresof average stain intensity and percentage of cellsstained. For HER2, the system calculated theHercepTest score [21] (0, 11, 21, 31). For CK5/6and EGFR, we obtained a continuous automated score(0–300) based on a weighted sum of the percentage ofpositive cells in three bins of weakly, intermediateand strongly positive cells. Quality control proceduresare described in the supplementary material.
Visual scoring of TMAs
Randomly selected cores from each study were re-arrayed in ‘virtual TMAs’ for visual scoring (see sup-plementary material). This resulted on a total of 942,952 and 998 core images being visually scored induplicate by two pathologists (M.E.S. and E.P.) forER, PR and HER2, respectively. The Allred scoringsystem and intensity score was used for ER and PR[22]. Stains for ER and PR were considered positiveif the Allred score was �3. For HER2, the Herceptestscoring system was used for visual scoring. Positivestains for HER2 were defined in two groups as hav-ing an intensity score of 2 or 3 (HER2 21) or 3 only(HER2 31).
TMA slides of CK5/6 from four studies (CNIO-BCS, MCBCS, ORIGO, SBCS) and slides of EGFRfrom six studies (ABCS, CNIO-BCS, MCBCS,KBCP, ORIGO, SBCS) that had been centrallystained at CRUK-CI were visually scored using theSlidePath system (see supplementary material). Tenscorers scored a total of 5771 cores for CK5/6 and8259 for EGFR. MES served as the reference pathol-ogist and scored a random sample of up to 100 coresper study/centre assigned to each of the other scoresto evaluate inter-scorer agreement. CK5/6 and EGFRpositive score by visual scoring was defined as>10% of positive cells.
Scorers assigned each core the following qualitycontrol categories: 1) satisfactory core (invasivetumour), 2) DCIS only, 3) no tumour/few tumourcells, 4) no core and 5) unsatisfactory for otherreasons.
Statistical methods
The correlation between automated continuous scoresand visual ordinal scores was evaluated by the Spear-man’s correlation coefficient, using data from the vir-tual TMA. The area under the curve (AUC) of
20 WJ Howat et al
VC 2014 John Wiley and Sons Ltd and The Pathological Society of Great Britain and Ireland J Path: Clin Res January 2015; 1: 18–32
receiver operating characteristic (ROC) graphs wasused to evaluate the discriminatory accuracy of theER, PR combined-automated scores (intensity*per-centage) to distinguish between visual positive andnegative scores. The automated score that optimizedthe sensitivity and specificity in the ROC graph wasapplied as the cut-off point to define marker statusfor all analysed cores (not just the ones in the virtualTMA). We also evaluated an alternative method todefine the cut-off for positive and negative scores, asdescribed by Ali et al [15]. Briefly, the cut-off underthis method is determined by the distribution of auto-mated percentage and intensity scores for all cores,ie, it does not use information on visual scores froma subset of tumours in the virtual TMAs to define acut-off point.
The kappa statistic was used as a measure ofagreement between dichotomous or semi-quantitativescores. Sensitivity and specificity were calculated asmeasures of validity using the visual score as the ref-erence; positive predictive value (PPV) and negativepredictive value (NPV) were calculated as a measureof the value of automated dichotomous scores to pre-dict visual dichotomous scores.
Comparisons between automated scores and visualscores were performed at the core level for cores inthe virtual TMAs. Subject-level scores for ER, PR,HER2 were derived by selecting the maximum scoreof all available cores for a given subject, after havingexcluded cores identified as having few or no tumourcells or no cores by the pathologist. These were com-pared to positive/negative status in the BCAC data-base, based primarily on medical records, orcentralized reviews by study centres.
Kaplan–Meier survival plots were used to plot sur-vival functions by subject-level IHC scores. Associa-tions with 10-year breast cancer-specific survivalwere assessed using a Cox proportional-hazardsmodel, providing estimates of hazard ratio (HR) and95% confidence interval (95% CI). Violations of the
proportional-hazards assumption were accounted forby the T coefficient that varied as a function of logtime. We used penalized-likelihood criteria, ie,Akaike Information Criterion (AIC) and BayesianInformation Criterion (BIC), to compare model parsi-mony and fit of alternative non-nested Cox regressionmodels including visual versus automated scores.Models with lower values for AIC or BIC have a bet-ter balance between model parsimony and fit. All sta-tistical analyses were conducted in Stata/MP version12.1 (StataCorp, College Station, TX, USA).
Results
Differences in TMAs and clinico-pathologicalcharacteristics of cases across studies
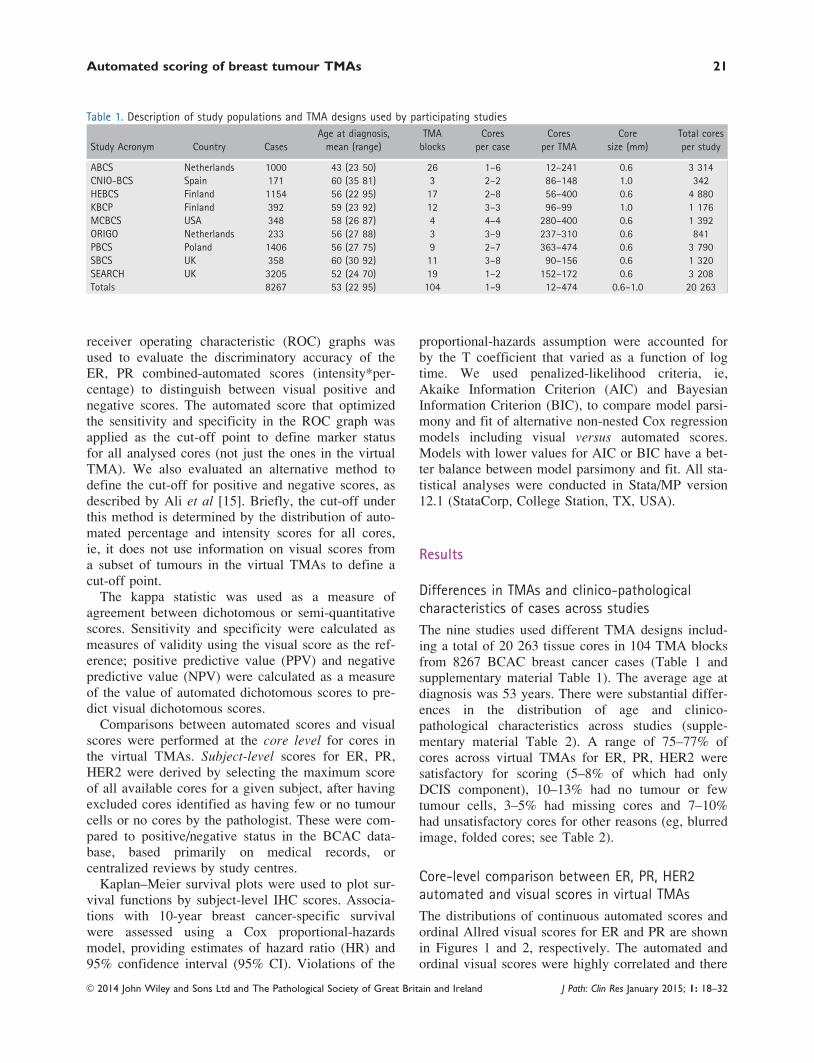
The nine studies used different TMA designs includ-ing a total of 20 263 tissue cores in 104 TMA blocksfrom 8267 BCAC breast cancer cases (Table 1 andsupplementary material Table 1). The average age atdiagnosis was 53 years. There were substantial differ-ences in the distribution of age and clinico-pathological characteristics across studies (supple-mentary material Table 2). A range of 75–77% ofcores across virtual TMAs for ER, PR, HER2 weresatisfactory for scoring (5–8% of which had onlyDCIS component), 10–13% had no tumour or fewtumour cells, 3–5% had missing cores and 7–10%had unsatisfactory cores for other reasons (eg, blurredimage, folded cores; see Table 2).
Core-level comparison between ER, PR, HER2automated and visual scores in virtual TMAs
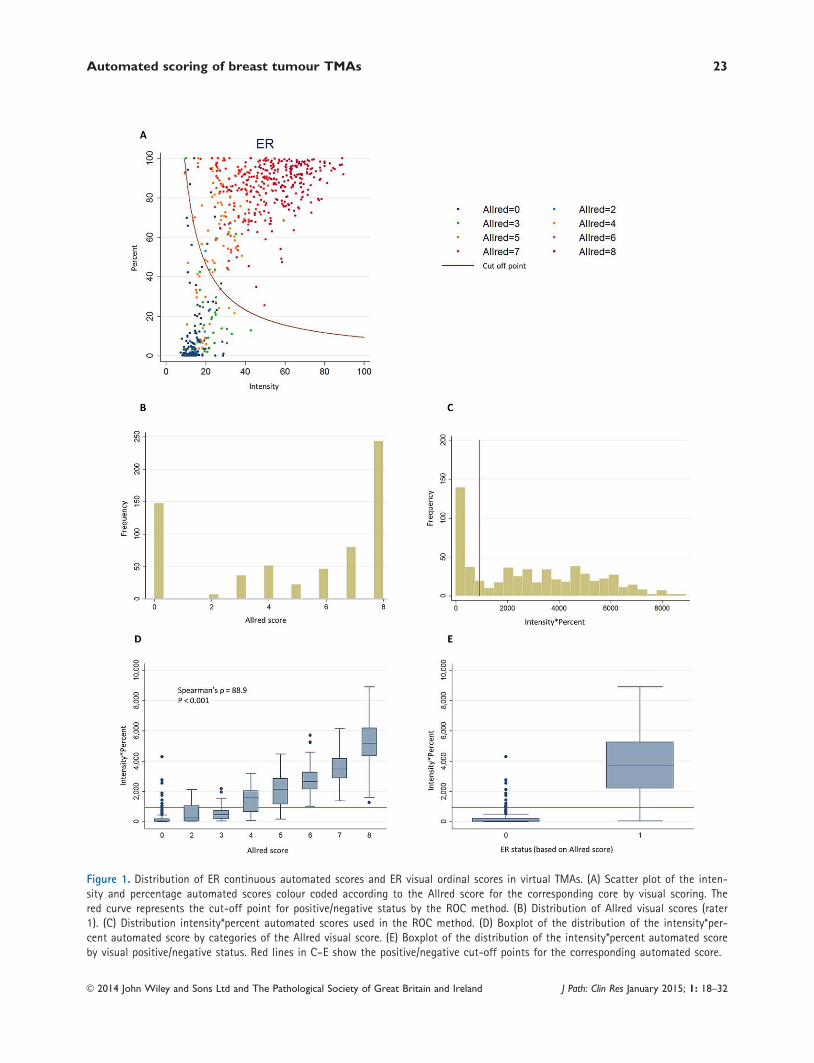
The distributions of continuous automated scores andordinal Allred visual scores for ER and PR are shownin Figures 1 and 2, respectively. The automated andordinal visual scores were highly correlated and there
Table 1. Description of study populations and TMA designs used by participating studies
VC 2014 John Wiley and Sons Ltd and The Pathological Society of Great Britain and Ireland J Path: Clin Res January 2015; 1: 18–32
was a clear separation of the distribution of auto-mated scores by the visual positive/negative scores(Figures 1D, 1E and 2D, 2E). There were differencesin distributions of automated scores across studiesthat could reflect different clinico-pathological char-acteristics of the tumours or staining quality (supple-mentary material Figures 3 and 4).
The AUC for ER and PR showed excellent dis-crimination (Table 3). For dichotomous scores, therewas excellent inter-rater agreement for ER and PRand substantial agreement between automated andvisual scores, which were better for ER than PR(Table 3, see supplementary material Table 4 forcross-tabulations). The automated system had goodsensitivity and specificity. The NPV was substantiallylower for the automated to rater comparisons thanthe inter-rater comparison (�70% versus 95%). Useof study-specific cut-off points for negative versuspositive scores did not substantially improve themeasures of agreement (data not shown). Measuresof relative performance of automated versus visualscoring were similar when we used the Ali et al [15]method to select a cut-off point for positive and neg-ative automated score (data not shown).
The kappa statistics for HER2 Herceptest scoreshowed substantial agreement for both inter-rater andautomated to visual comparisons (kappa 5 0.62–0.71;Table 4). Although the agreement for the HER2 21
dichotomous classification was substantial for bothinter-rater and rater-automated comparisons, theagreement for HER2 31 was only moderate for oneof the raters. Sensitivity to identify HER2 31 coreswas low, both in inter-rater and rater-automated com-parisons (Table 4). When we examined cross-tabulations to evaluate the sources of disagreement(supplementary material Table 4), it could be seenthat extreme discrepancies, ie, Ariol scores of 0where pathologist scores were 3 were very infre-quent. Of the 13 discrepant cores, five were deter-mined as pathologist error and re-evaluated; fourwere due to poor tissue or staining quality (eitherthrough folds, high level of background staining or
edge artifact, small tumour fragment) and four weredue to Ariol error. The kappa statistics for rater-automated agreement changed little when pathologyerrors and staining errors were removed from theanalysis (data not shown).
Subject-level comparison for ER, PR, HER2automated scores to positive/negative scores inBCAC database
Figure 3 shows scatter plots and distributions of auto-mated scores for all cases (6424 cases for ER and6385 cases for PR) by positive/negative status previ-ously assigned by each individual study. The agree-ment between subject-level automated scores andmarker status was substantial to moderate, generallylower than the core-level comparisons in the virtualTMAs (Table 5; see supplementary material Table 5for cross-tabulations). There were substantial differ-ences in the measures of agreement by study (supple-mentary material Table 6).
To evaluate the impact of core quality on measuresof agreement, we used automated estimates of thenumber of tumour nuclei to identify cores with no orfew tumour cells. Measures of agreement improvedonly slightly after these exclusions; however, thisresulted in a substantial reduction in the number ofsubjects with valid scores (data not shown). We,therefore, decided not to make these exclusions inthe remaining analyses.
Survival analysis for ER, PR, HER2 automatedscores compared to positive/negative scores fromindividual studies
Kaplan–Meier survival curves drawn from the fullsubject-level dataset demonstrated that the automatedanalysis generated the expected survival associationsfor ER, PR and HER2 (Figures 4–6). While estimatesof HR for automated data showed weaker associa-tions with survival for dichotomous scores, auto-mated scores allowed classification of cases intomeaningful quantitative levels of ER and PR expres-sion. Quintiles of the automated scores resulted in arefinement of the associations with survival (Figures4 and 5). However, models with automated scoreshad a worse fit than models with dichotomous visualscores (see AIC/BIC values in Figures 4 and 5).
The HRs for women in the lowest quintiles for ERand PR were similar to those for receptor negativecases according to the BCAC database (representing25.3% of the cases for ER 36.2% of cases for PR).The percentage of cores classified as negative in theBCAC database included in each of the quintiles for
Table 2. Distribution of quality control measures for tissue coresstained for ER, PR and HER2 in the virtual TMAs
Unsatisfactory core for other reasons 71 8 91 10 70 7
Total 942 952 998
22 WJ Howat et al
VC 2014 John Wiley and Sons Ltd and The Pathological Society of Great Britain and Ireland J Path: Clin Res January 2015; 1: 18–32
Figure 1. Distribution of ER continuous automated scores and ER visual ordinal scores in virtual TMAs. (A) Scatter plot of the inten-sity and percentage automated scores colour coded according to the Allred score for the corresponding core by visual scoring. Thered curve represents the cut-off point for positive/negative status by the ROC method. (B) Distribution of Allred visual scores (rater1). (C) Distribution intensity*percent automated scores used in the ROC method. (D) Boxplot of the distribution of the intensity*per-cent automated score by categories of the Allred visual score. (E) Boxplot of the distribution of the intensity*percent automated scoreby visual positive/negative status. Red lines in C–E show the positive/negative cut-off points for the corresponding automated score.
Automated scoring of breast tumour TMAs 23
VC 2014 John Wiley and Sons Ltd and The Pathological Society of Great Britain and Ireland J Path: Clin Res January 2015; 1: 18–32
Figure 2. Distribution of PR continuous automated scores and PR visual ordinal scores in virtual TMAs. (A) Scatter plot of the inten-sity and percentage automated scores colour coded according to the Allred score for the corresponding core by visual scoring. Thered curve represents the cut-off point for positive/negative status by the ROC method. (B) Distribution of Allred visual scores (rater1). (C) Distribution of intensity*percent automated scores. (D) Boxplot of the intensity*percent automated score by categories of theAllred visual score. (E) Boxplot of the intensity*percent automated score by visual positive/negative status. Red lines in C–E show thepositive/negative cut-off points for the corresponding automated score.
24 WJ Howat et al
VC 2014 John Wiley and Sons Ltd and The Pathological Society of Great Britain and Ireland J Path: Clin Res January 2015; 1: 18–32
ER and PR is shown in supplementary material Table8. Automated scores for HER2 also allowed estima-tion of HR by HER2 semi-quantitative scores, show-ing increasing hazard for increasing scores (Figure6). However, as for ER and PR, the model fit wasworse for automated that visual scores (see AIC/BICvalues in Figure 6)
Comparison of automated and visual scores forCK5/6 and EGFR
An initial analysis for CK5/6 and EGFR in the entireTMA dataset resulted in very poor performance ofautomated scoring compared with visual scores byrater 1 or rater 2 (data not shown). A subsequent re-analysis was performed only in the SEARCH study todemonstrate if limiting the tuning and analysis to a sin-gle study helped. Although this resulted in a markedimprovement, the PPV was still poor (49.2% for CK5/6 and 30.0% for EGFR) reflecting a large number offalse positives (Table 6). Performance was better for
ER-negative than ER-positive tumours, the formerincluding a higher percentage of CK5/6 and EGFR-positive tumours. Examination of discordant coresshowed that the disagreements were primarily relatedto false positives due to scoring of normal cells byAriol. We, therefore, scored visually all cores that hadnot been previously scored by individual studies (ie,5771 cores stained for CK5/6 and 8259 cores stainedfor EGFR). The distribution of quality control scoresfor these TMAs was similar to those seen for ER, PRand HER2 (supplementary material Table 9). Exami-nation of inter-rater agreement on a subset of 357CK5/6 cores and 760 EGFR cores scored visually by areference pathologist for QC showed a better agree-ment than the automated versus visual agreement seenin the SEARCH study; however, the PPV was also rel-atively low (Table 6). Evaluation of discordant pairsrevealed that disagreements between visual scoreswere primarily due to disagreements between patholo-gists in identifying whether immunostained cells werenormal cells versus cancer cells.
Table 3. Inter-rater agreement and agreement between each rater and Ariol automated quantitative ER, PR scores for cores in thevirtual TMA
Raters scores are dichotomous (positive/negative), and Ariol automated scores are considered as continuous and dichotomous.% Pos., % positive cores for reference rater; Se, sensitivity; Sp, Specificity; PPV, positive predictive value; NPV, negative predictive value.
Table 4. Inter-rater agreement and agreement between each rater and Ariol automated quantitative HER2 scores for cores in thevirtual TMA
VC 2014 John Wiley and Sons Ltd and The Pathological Society of Great Britain and Ireland J Path: Clin Res January 2015; 1: 18–32
Discussion
Automated image analysis of TMAs using many dif-ferent systems has been shown to perform well formultiple markers [12–18,23,24]. However, most stud-ies have been based on relatively small comparisonsof TMAs from one or few centres. Our report is alarge-scale evaluation of the performance of auto-mated image analysis in the scoring of TMAs from
different source institutions across different countriesin a consortium of breast cancer studies.
The core-level measures of agreement betweenautomated and visual scores for the virtual TMAs inour report are most comparable to those in previousreports as they were based on comparisons of thesame exact images. For ER, PR and HER2, theywere lower than previously reported by our groupusing the Ariol system [14], or an automated scoringalgorithm adapted from astronomy [15], possibly
Figure 3. Distribution of ER (A–C) and PR (D–F) continuous automated scores (subject level) and positive/negative status in BCAC data-base, including 6424 cases for ER and 6385 cases for PR from nine studies. (A) Scatter plot of the intensity and percentage automatedscores colour coded according to the BCAC ER status (red for positive and blue for negative). The red curve represents the cut-off pointfor positive/negative status by the ROC method. The smaller inserted plots show ER-positive and ER-negative cases separately (B) Distri-bution of intensity*percent automated scores. (C) Boxplot of the intensity*percent automated score by BCAC ER status. Red lines showthe positive/negative cut-off points for the corresponding automated score. Figures D–F show similar plots for PR.
Table 5. Agreement between Ariol automated quantitative ER, PR and HER2 scores for each subject and marker status from clinical/study records
Clinical/study scores are dichotomous (positive/negative), and ER, PR Ariol scores are considered both as continuous and dichotomous.% Pos., % positive cores for reference rater; Se, sensitivity; Sp, Specificity; PPV, positive predictive value; NPV, negative predictive value.
26 WJ Howat et al
VC 2014 John Wiley and Sons Ltd and The Pathological Society of Great Britain and Ireland J Path: Clin Res January 2015; 1: 18–32
reflecting the greater variability in tissue preparationrelated to multiple specimen sources. Bolton et al[14] used TMAs stained by ER, PR and HER2 fromPBCS, and Ali et al [15] used ER and HER2 stainedTMAs from SEARCH. While these TMAs were alsoincluded in our study, the automated image analysisof the TMAs was done independently using differentmethods. Patient characteristics, modes of tumourdetection, pathologic features and tissue handling inthis report were likely highly variable because of theinclusion of multiple studies, but representative of‘real world’ population-based samples collected overmany years in international collaborations.
As expected, the agreement for subject-level com-parisons was lower than for core-level comparisonssince the latter are comparing scores based on differ-ent pieces of the tumour tissue, and the visual scorescame from multiple sources (mainly clinical recordsand central review of cases by individual studies).Arguably, however, these comparisons are most rele-vant for answering scientific questions. A key
advantage of automated image analysis is that it doesnot use pathologists’s time and can be run continu-ously, including overnight. The analysis time isdependent on the type of stain, size of cores andnumber of cores per TMA. For instance, the time toscore a TMA with 183 cores of 0.6 mm diameter canrange from 25 min for a simple nuclear analysis (ER)to 70 min for a cytoplasmic analysis (CK5/6). Theentire dataset was analysed over the course of a weekusing four batch processors. This is in comparison toapproximately 35–40 min for a simple manual ERscore of a similar TMA by a skilled pathologist usingcomputer-assisted scoring methods. A limitation ofthe automated approach is that 20–25% of cores inTMAs are unsatisfactory for scoring, but imagingsystems do not perform well in triaging such cores.QC assessment of each core by visual inspection toidentify unsatisfactory cores would improve the per-formance of the automated scoring. Similarly, study-specific training of algorithms could also improveperformance. Although during TMA production,
Figure 4. Kaplan–Meier survival curves and hazard ratios (HR) for 10-year breast cancer survival by ER, based on 6135 subjects and981 breast cancer specific deaths, using (A) pathologists data from study sites (positive/negative), (B) dichotomized (positive/negative)automated scores and (C) automated scores classified in quintiles.
Automated scoring of breast tumour TMAs 27
VC 2014 John Wiley and Sons Ltd and The Pathological Society of Great Britain and Ireland J Path: Clin Res January 2015; 1: 18–32
tissue cores are targeted to tumour areas, contamina-tion by normal elements is unavoidable. Identificationof tumour cells by semi-automated systems includingmanual demarcation of tumour areas prior to auto-
mate scoring could improve the performance of auto-mated systems. However, these additional proceduresare time consuming, and the added efforts to improvescoring diminish the relative value of automation.
Figure 5. Kaplan–Meier survival curves and hazard ratios (HR) for 10-year breast cancer survival by PR, based on 6115 subjects and998 breast cancer specific deaths, using (A) pathologists data from study sites (positive/negative), (B) dichotomized (positive/negative)automated scores and (C) automated scores classified in quintiles.
Figure 6. Kaplan–Meier survival curves and hazard ratios (HR) for 10-year breast cancer survival by PR, based on 6039 subjects and997 breast cancer specific deaths, using (A) pathologists data from study sites (positive/negative), and (B) semi-quantitativeautomated scores.
28 WJ Howat et al
VC 2014 John Wiley and Sons Ltd and The Pathological Society of Great Britain and Ireland J Path: Clin Res January 2015; 1: 18–32
Automated pattern-recognition software to identifytumour areas such as Definiens [24] are promisingbut it is still difficult to get accurate identification ofbreast tumour cells, particularly in heterogeneous setsof tissue samples such as those derived from interna-tional consortia.
The performance of automated scoring for PR wasworse than ER stains, possibly partly explained by ahigher regional heterogeneity in positive staining forPR than ER [16,25]. HER2 scoring performed usingFDA-approved commercial algorithms in brightfield[26–28] and in fluorescence [29] has demonstratedsubstantial agreement with visual assessment in stud-ies of varying size and design. We observed a sub-stantial agreement for HER2 semi-quantitative scoresfor inter-rater or automated-rater comparisons, whichwas similar to that demonstrated previously on theAriol system in our hands [14].
Dichotomous classification of automated scores forER, PR and HER2 achieved less separation of prog-nostic groups by marker expression than the clinical/study scores. Because these three markers are rou-tinely determined in most clinical settings, the mainadvantage of the automated scores was providingquantitative measures of expression that allowedrefinement in the groups of patients with differentprognosis. Although semi-quantitative scores can alsobe obtained from clinical records, the reporting is nothomogeneous and this information is not available inmany epidemiological studies.
The performance of automated analysis of thecytoplasmic CK5/6 and membranous EGFR stainswas much worse than for the time-tested nuclear ER/PR and membranous HER2 antibodies, resulting inmany false positive results. Automated scoring ofcytoplasm stains such CK5/6 is particularly challeng-ing since most systems use colour de-convolution toremove the nuclear counterstain from the brown stainin order to identify nuclei and determine the cell
type. This method reduces resolution so the accuracyof identification decreases. The poor performance forCK5/6 and EGFR was also an issue for the inter-rater comparison, although to a lesser extent. Exami-nation of discordant scores revealed that both theinter-rater and automated-visual discordances wereoften due to scoring immunopositive normal cells.Automated image analyses for CK5/6 and EGFRmay provide useful triage; negative results may beconsidered final, whereas positive results require vis-ual confirmation. This would potentially reduce scor-ing workloads by about 75%, and could be furtherrefined by limiting visual review to ER-negative ortriple negative (ER2/PR2/HER22) cancers express-ing basal markers. However, image managementcould present challenges for targeted visual reviews.
In conclusion, using automated image analysis ofTMAs stained by ER, PR and HER2 can be a usefultool to obtain quantitative scores for these markers inlarge collaborative studies including heterogeneousTMAs. However, automated scoring does not resultin an improved performance of survival models,compared to visual scores. Automated scoring ofCK5/6 and EGFR may permit triage of negativecores but positive results require visual review.Efforts to improve the performance of automatedanalysis should focus on standardization of specimenhandling, TMA construction [30,31] and use of cen-tralized optimized IHC-staining protocols. Improvedstandardization and optimization of key steps in theseprocedures combined with technical advances inautomated analysis of IHC stains would facilitatelarge population-based studies of breast cancer.
Acknowledgements
We would like to thank Rob Sykes from Leica Biosys-tems who helped to retrain the SEARCH image analysis
Table 6. Inter-rater agreement and agreement between Ariol automated CK56 and EGFR scores (dichotomized using the ROC method)for cores in TMAs from participating studies
Marker Comparison N % Pos. Observed Agreement Kappa (95%CI) Se (%) Sp (%) PPV (%) NPV (%)
% Pos., % positive cores for reference rater; Se, sensitivity; Sp, Specificity; PPV, positive predictive value; NPV, negative predictive value.*Includes data from CNIO-BCS, MCBCS, ORIGO, SBCS.†Includes data from SEARCH re-analysis.‡Includes data from ABCS, CNIO-BCS, KBCP, MCBCS, ORIGO, SBCS.
Automated scoring of breast tumour TMAs 29
VC 2014 John Wiley and Sons Ltd and The Pathological Society of Great Britain and Ireland J Path: Clin Res January 2015; 1: 18–32
for EGFR and CK5/6. We would also like to thankMike Irwin at the Institute of Astronomy, Cambridge,for assistance with methods in the automated analysis.ABCS was supported by the Dutch Cancer Society[grants NKI 2007-3839; 2009 4363]; BBMRI-NL,which is a Research Infrastructure financed by theDutch government (NWO 184.021.007); and the DutchNational Genomics Initiative. CNIO-BCS was sup-ported by the Genome Spain Foundation, the RedTem�atica de Investigaci�on Cooperativa en C�ancer andgrants from the Asociaci�on Espa~nola Contra el C�ancerand the Fondo de Investigaci�on Sanitario (PI11/00923and PI081120). The Human Genotyping-CEGEN Unit(CNIO) is supported by the Instituto de Salud CarlosIII. HEBCS was financially supported by the HelsinkiUniversity Central Hospital Research Fund, Academyof Finland (132473), the Finnish Cancer Society, TheNordic Cancer Union and the Sigrid Juselius Founda-tion. The KBCP was financially supported by the spe-cial Government Funding (EVO) of Kuopio UniversityHospital grants, Cancer Fund of North Savo, the FinnishCancer Organizations, the Academy of Finland and bythe strategic funding of the University of Eastern Finland.The MCBCS was supported by an NIH Specialized Pro-gram of Research Excellence (SPORE) in Breast Cancer[CA116201], the Breast Cancer Research Foundation,the Mayo Clinic Breast Cancer Registry and a generousgift from the David F. and Margaret T. Grohne FamilyFoundation and the Ting Tsung and Wei Fong ChaoFoundation. ORIGO authors thank E. Krol-Warmerdam,and J. Blom; The contributing studies were funded bygrants from the Dutch Cancer Society (UL1997-1505)and the Biobanking and Biomolecular ResourcesResearch Infrastructure (BBMRI-NL CP16). PBCS wasfunded by Intramural Research Funds of the NationalCancer Institute, Department of Health and Human Serv-ices, USA. SBCS was supported by Yorkshire CancerResearch S295, S299, S305PA. SEARCH is funded byprogramme grant from Cancer Research UK [C490/A10124. C490/A16561] and supported by the UKNational Institute for Health Research BiomedicalResearch Centre at the University of Cambridge. Part ofthis work was supported by the European CommunityCsSeventh Framework Programme under grant agreementnumber 223175 (grant number HEALTH-F2-2009-223175) (COGS). We acknowledge funds from Break-through Breast Cancer, UK, in support of MGC and MB.
Author contributions
WJH, FMB, EP, PDP, MES, MG-C conceived andcarried out the study; WJH, LM, PG, NJ, L-AMcD,
JM, FD carried out the centralized laboratory work;EP, MES, EJS, SP, CHMvanD, LJ, RS, DV per-formed visual scoring; PC performed data manage-ment; MG-C, MNB analysed data; CC, AB, JS, JW,HN, RF, CB, PH, HRA, S-JD, JF, JL, LB, AM, VK,V-MK, AC, IWB, SSC, MWR, FJC, JEO, PD,WEM, CMS, AH, JB, JIAP, PM, MKB, DFE, MKScontributed to data collection and/or data manage-ment. All authors were involved in writing the paperand gave final approval of the submitted and pub-lished versions.
References
1. Blows FM, Driver KE, Schmidt MK, et al. Subtyping of breast
cancer by immunohistochemistry to investigate a relationship
between subtype and short and long term survival: a collaborative
analysis of data for 10 159 cases from 12 studies. PLoS Med
2010; 7: e1000279.
2. Cuzick J, Dowsett M, Pineda S, et al. Prognostic value of a com-
bined estrogen receptor, progesterone receptor, Ki-67, and human


![Nottingham Pathology 2016 - path.org.uk · 09.00–17.00 Apg40 [Gallery 1] Symposium: The AIDPATH Project: Her2 Automated Scoring Contest For programme details visit: 08.55–12.00](https://static.documents.pub/doc/80x56/5b6c67467f8b9aa5478ba1e1/nottingham-pathology-2016-pathorguk-09001700-apg40-gallery-1-symposium.jpg)


