+ All Categories
Home > Documents > Performance of Health Financing Function and Overview of Main Policy Challenges Georgian Health Care...

Performance of Health Financing Function and Overview of Main Policy Challenges Georgian Health Care...

Date post: 24-Dec-2015
Category:
Upload: brandon-thornton
View: 214 times
Download: 0 times
Share this document with a friend
Popular Tags:
34
Performance of Health Financing Function and Overview of Main Policy Challenges Georgian Health Care 2020 Washington DC, February 1-2, 2010 Bakhuti Shengelia Senior Health Specialist East Asia and Pacific Region, Human Development Network The World Bank
Transcript

Performance of Health Financing Function and Overview of Main Policy Challenges

Georgian Health Care 2020Washington DC, February 1-2, 2010

Bakhuti ShengeliaSenior Health Specialist

East Asia and Pacific Region, Human Development NetworkThe World Bank

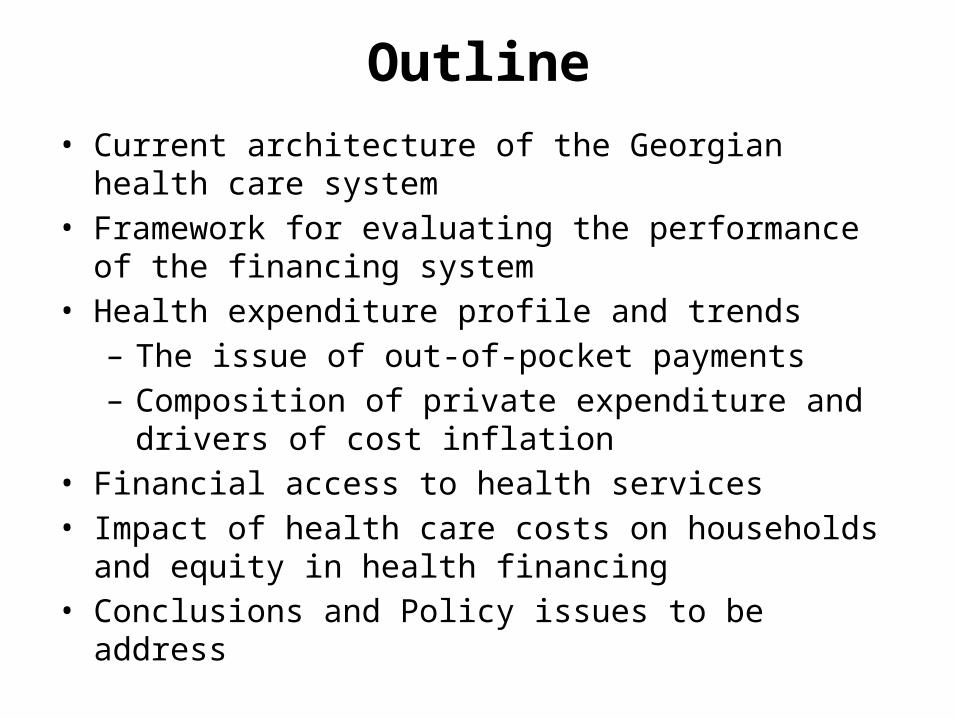
Outline• Current architecture of the Georgian health care system• Framework for evaluating the performance of the financing

system• Health expenditure profile and trends

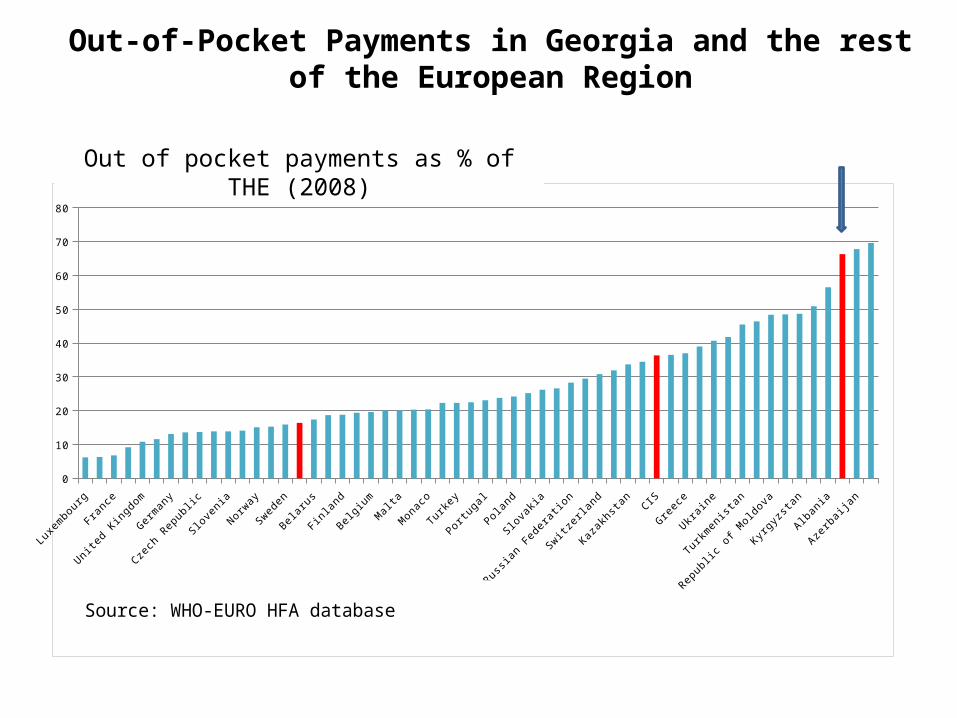
– The issue of out-of-pocket payments– Composition of private expenditure and drivers of cost

inflation• Financial access to health services• Impact of health care costs on households and equity in

health financing• Conclusions and Policy issues to be address

Organization of Health Financing

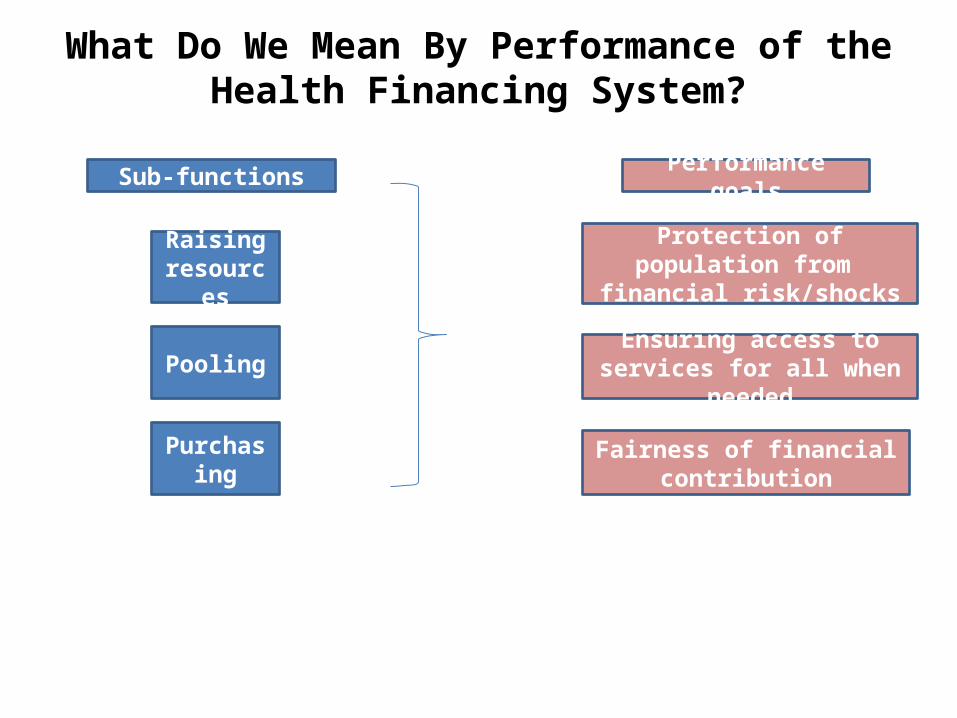
What Do We Mean By Performance of the Health Financing System?

Raising resources

Pooling

Purchasing

Protection of population from financial risk/shocks

Ensuring access to services for all when needed

Fairness of financial contribution

Sub-functions Performance goals

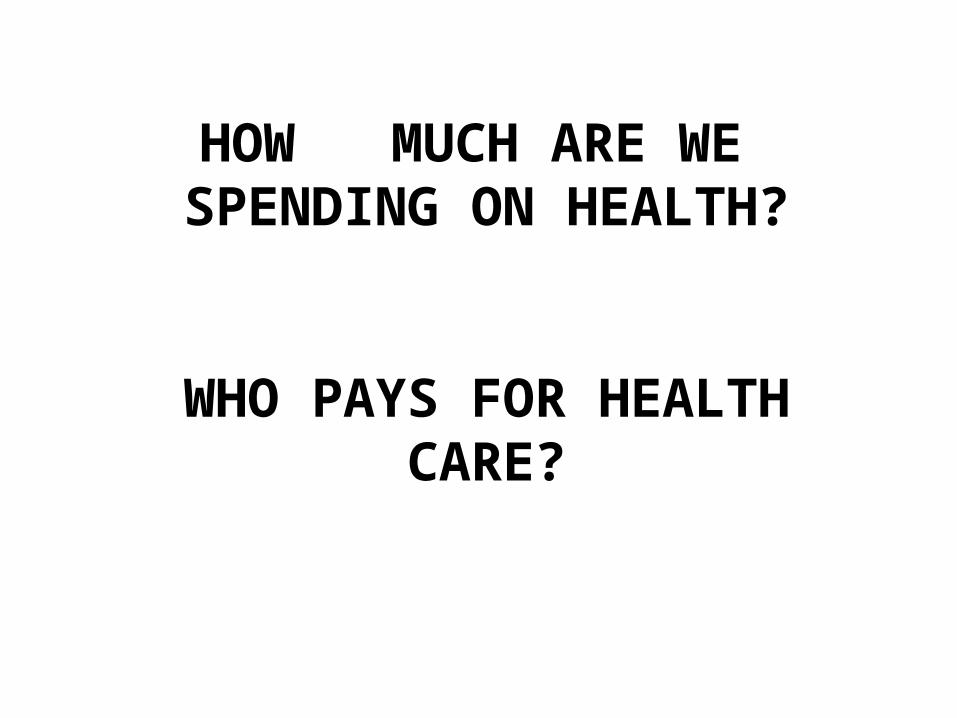
HOW MUCH ARE WE SPENDING ON HEALTH?

WHO PAYS FOR HEALTH CARE?

Health Expenditures in Relation to GDP

In 2007 - 8.6% of GDPIn 2009 – 10.1% of GDP

EU – 8.9%CIS – 5.5%

Per Capita Total Health Spending

• US$245 equivalent (GEL409.9) • In $PPP terms – $459• CIS in $PPP terms – $621

Switz

erlan

dMalt

a

Fran

ce

German

y

Denmark

Belgium

United Kingd

om

Finlan

d EU Italy

Monaco

Israe

l

Euro

pean Reg

ion

Czech Rep

ublic

Hungary

Estonia

Poland

Bulgaria

Russian

Federa

tion

Belaru

s

Turke

y CIS

Ukraine

Kazakh

stan

Azerbaij

an

Kyrgyzs

tan

Turkm

enist

an0

500

1000

1500

2000

2500

3000

3500

4000

4500

5000

Per capita health spending in EURO region in $PPP (2008)

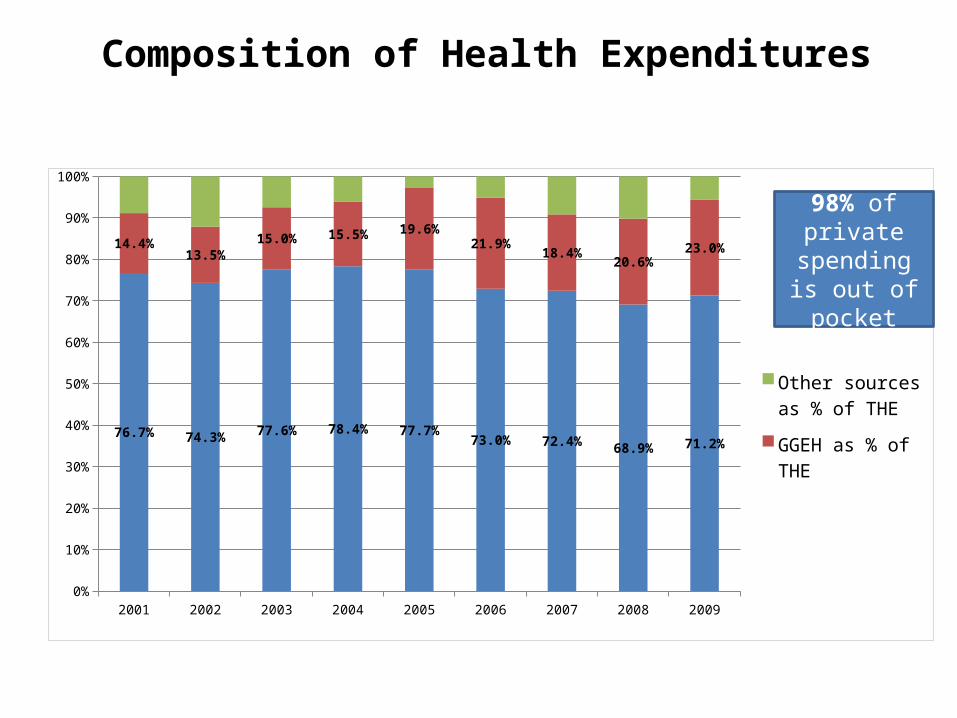
Trends in Health System Financing2001-2009 (GEL,000,000)

2001 2002 2003 2004 2005 2006 2007 2008 20090

200

400

600

800

1000

1200

1400

1600

1800

2000

400 484 563655

775 8461003

11441295

7588

109130

196254

255

343

419

46 79

54 51

27

59

128

174

105

External sourcesPublic expendituresPrivate expenditures

Source: National Health Accounts 2001-2009, MOH

Private increased by 320%Public increased by 560%Other sources by 230%

Composition of Health Expenditures

2001 2002 2003 2004 2005 2006 2007 2008 20090%

10%

20%

30%

40%

50%

60%

70%

80%

90%

100%

76.7% 74.3% 77.6% 78.4% 77.7%73.0% 72.4% 68.9% 71.2%

14.4%13.5%

15.0% 15.5% 19.6%21.9%

18.4%20.6%

23.0%

Other sources as % of THE

GGEH as % of THE

PE as % of THE

98% of private spending is

out of pocket

Out-of-Pocket Payments in Georgia and the rest of the European Region

0

10

20

30

40

50

60

70

80

Source: WHO-EURO HFA database

Out of pocket payments as % of THE (2008)

Why Are the Out-of-Pocket Payments Bad?

How Much Priority Does the Health Sector Enjoy in the Government Spending?

2001 2002 2003 2004 2005 2006 2007 2008 20090.0

2.0

4.0

6.0

8.0

10.0

12.0

14.0

16.0

6.1 6.36.7

5.46.0 5.7

4.24.9

7.8

12.0 12.0 12.4 12.6 12.7 12.8 12.8 12.9 12.913.7 14.0 14.3 14.4 14.6 14.8 15.0 15.0 15.0

8.9 8.9 9.1 9.2 9.29.7 9.4 9.3 9.3

GeorgiaEUROEU CIS

The size of the health care spending in the total government spending is the direct measure of how much priority the government gives to the health of the nation!

Source: National Health Accounts, Georgia, WHO HFA database.

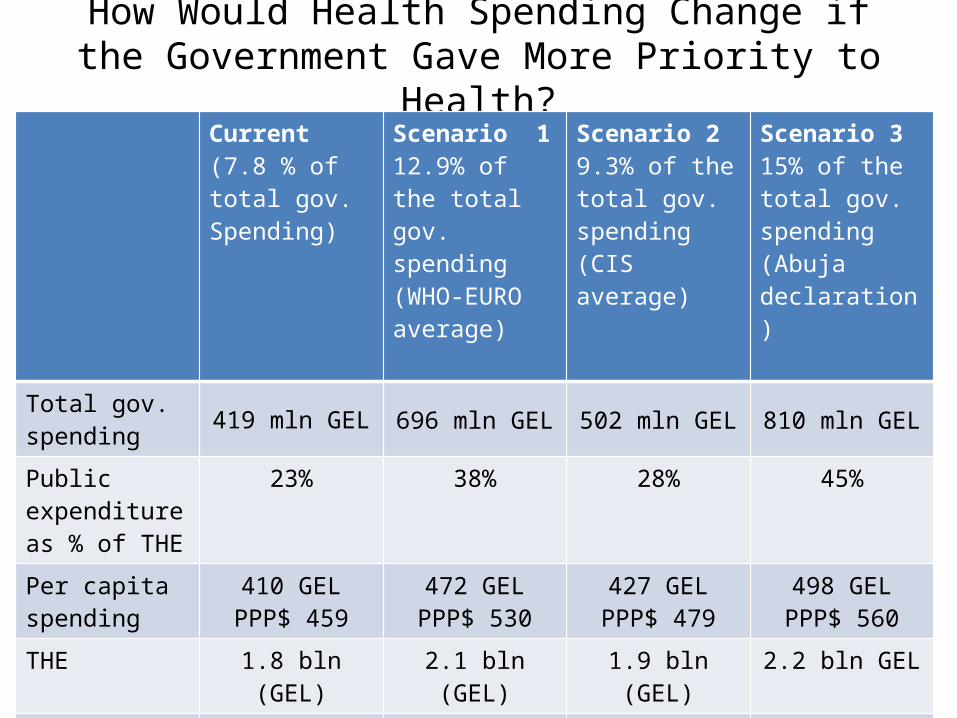
How Would Health Spending Change if the Government Gave More Priority to Health?

Current(7.8 % of total gov. Spending)

Scenario 112.9% of the total gov. spending (WHO-EURO average)

Scenario 29.3% of the total gov. spending (CIS average)

Scenario 315% of the total gov. spending (Abuja declaration)

Total gov. spending 419 mln GEL 696 mln GEL 502 mln GEL 810 mln GEL

Public expenditure as % of THE

23% 38% 28% 45%

Per capita spending

410 GELPPP$ 459

472 GELPPP$ 530

427 GELPPP$ 479

498 GELPPP$ 560

THE 1.8 bln (GEL) 2.1 bln (GEL) 1.9 bln (GEL) 2.2 bln GEL

Health spending as % of GDP

10.1% 11.7% 10.6% 12.2%

Does Health Financing System Provide Adequate Access?

Can People Get Care When They Need it?

Trends in Health Insurance Coverage

Utilization of Health Services

Indicator Year Total Urban Rural

Average number of consultations / contacts per person per annum (all sources of care) (2)

2007 2.01 2.36 1.67

2010 1.91 1.85 *** 1.97 **

Average number of outpatient consultations (all types) per person per annum (1)

2007 1.74 2.03 1.46

2010 1.66 1.60 1.72

Percentage of total population who reported being sick with any condition in last 6 months and consulted a healthcare provider (2)

2007 59.5 59.8 59.3

2010 60.3 59.6 60.9

Percentage of occurrences of acute illness in the past 30 days where a healthcare provider was consulted (2)

2007 56.5 55.6 57.9

2010 66.0 *** 68.0 *** 64.3 *

Notes: (1) Significance of difference not tested; (2) Statistical significance of difference with baseline figure: *** p<0.01; ** p<0.05; * p<0.1.

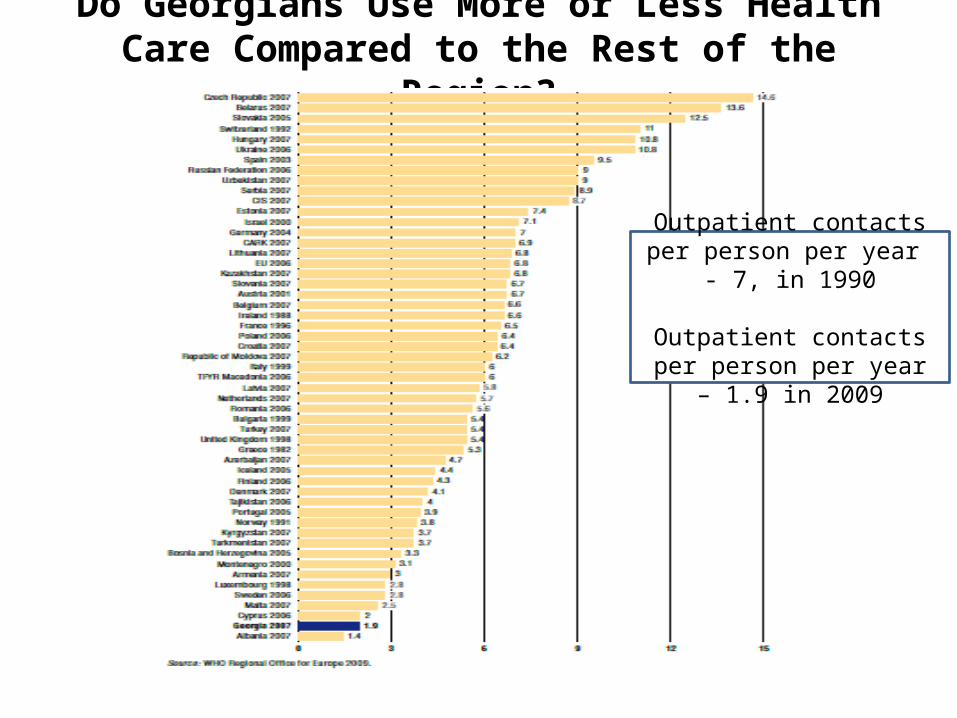
Do Georgians Use More or Less Health Care Compared to the Rest of the Region?

Outpatient contacts per person per year - 7, in 1990

Outpatient contacts per person per year – 1.9 in 2009

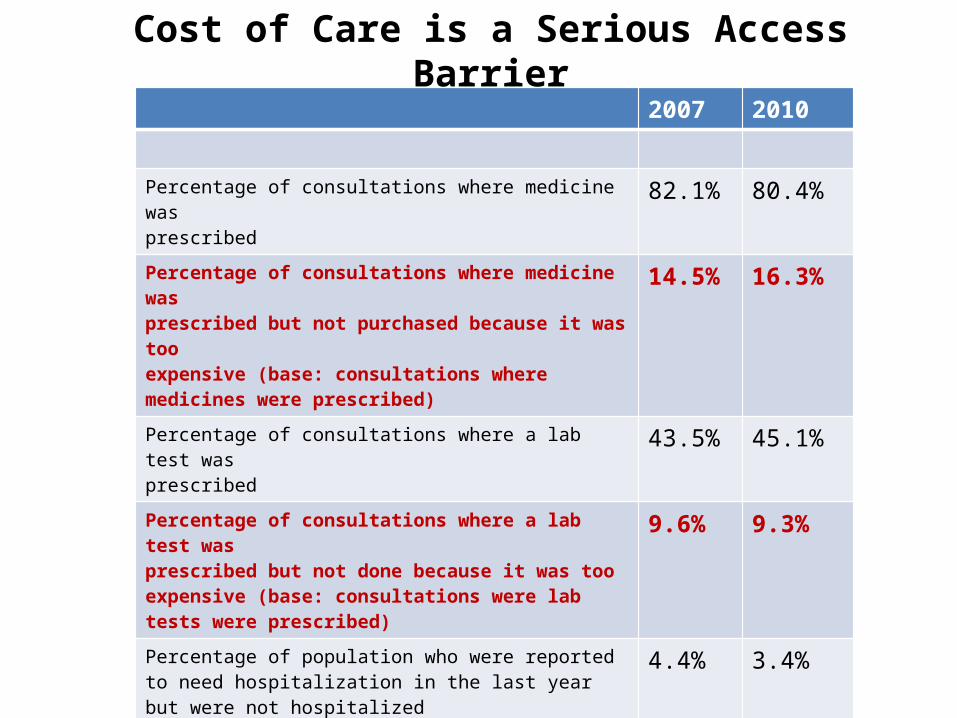
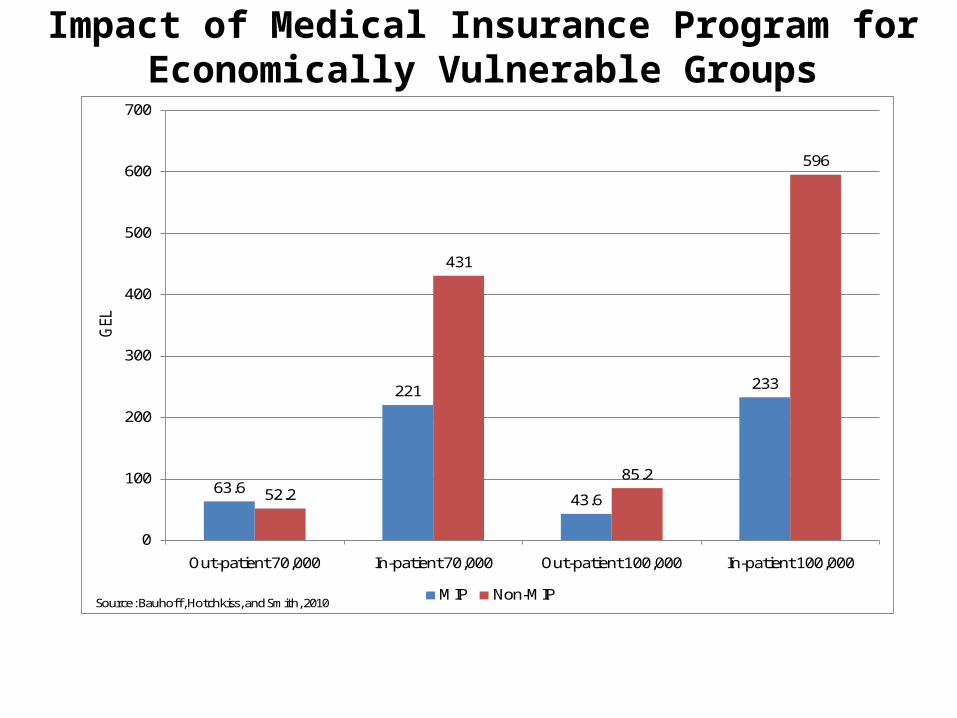
Cost of Care is a Serious Access Barrier2007 2010

Percentage of consultations where medicine wasprescribed

82.1% 80.4%

Percentage of consultations where medicine wasprescribed but not purchased because it was tooexpensive (base: consultations where medicines were prescribed)

14.5% 16.3%

Percentage of consultations where a lab test wasprescribed

43.5% 45.1%

Percentage of consultations where a lab test wasprescribed but not done because it was too expensive (base: consultations were lab tests were prescribed)

9.6% 9.3%

Percentage of population who were reported to need hospitalization in the last year but were not hospitalized

4.4% 3.4%

Percentage of population who were reported to needhospitalization in the last year but were not hospitalizedbecause it was too expensive/they did not haveenough money (base: those that were not hospitalized)

89% 76.4%

Composition of Per Capita Private Spending (in GEL)

2001 2002 2003 2004 2005 2006 2007 2008 20090

50

100

150

200

250

300

350

22 24 28 33 38 44 51 65 71 17 19 21 25 31 35 41

45 50

35 51

67 76

89 89

105

128

151

1013

1518

2026

33

41

59 The rest of private expenditure

Medicines and other consumables

Outpatient

Inpatient care

Source: National Health Accounts, MoH

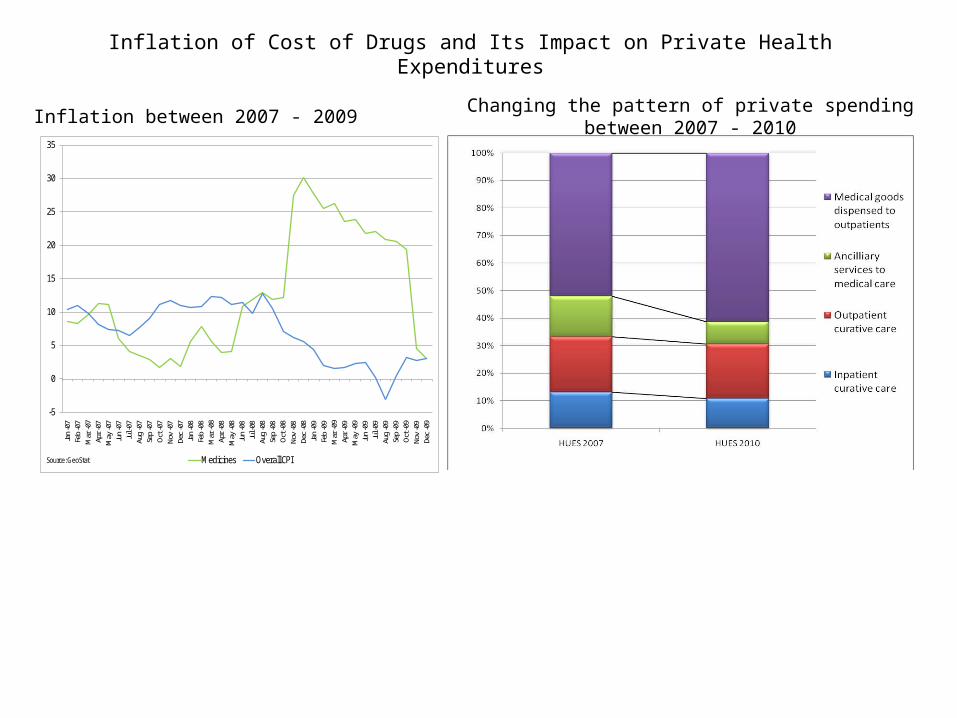
435% increase in pharmaceutical spending323% increase in inpatient spending289% increase in outpatient spending

Expenditure on Pharmaceuticals as % of Total Health Expenditure (OECD versus Georgia, 2008)

New Ze

aland

Netherl

ands

Icelan

d

Swed

en

Belgium

German

y

Canad

a

France

Slove

niaSp

ain

Estonia

Czech Rep

ublic

Poland

Korea

Hungary

Georgi

a0

5

10

15

20

25

30

35

40

45

5043.2

2001 2002 2003 2004 2005 2006 2007 2008 20090.0%

10.0%

20.0%

30.0%

40.0%

50.0%

60.0%

48.0%53.1%

56.7% 54.4%51.5% 50.2% 51.3%

45.0%

56.4%

Private Expenditure of Pharmaceuticals as % of Total Private Expenditure on Health

Sources: NHA 2009, Georgia, MOH; OECD health database, HUES Georgia 2010.

Inflation of Cost of Drugs and Its Impact on Private Health Expenditures

-5

0

5

10

15

20

25

30

35

Jan

-07

Feb

-07

Mar

-07

Apr-

07M

ay-0

7Ju

n-0

7Ju

l-07

Aug

-07

Sep

-07

Oct-

07No

v-07

Dec-

07Ja

n-0

8Fe

b-0

8M

ar-0

8Ap

r-08

May

-08

Jun

-08

Jul-

08Au

g-0

8Se

p-0

8Oc

t-08

Nov-

08De

c-08

Jan

-09

Feb

-09

Mar

-09

Apr-

09M

ay-0

9Ju

n-0

9Ju

l-09

Aug

-09

Sep

-09

Oct-

09No

v-09

Dec-

09

Medicines Overall CPISource: GeoStat

Inflation between 2007 - 2009 Changing the pattern of private spending between 2007 - 2010

Price of Drugs in Georgia Versus Other EU Countries

-100%

-50%

0%

50%

100%

150%%

diff

eren

ce

Brand

Generic

Source: WB survey and OBIG

Estimated Average Combined Wholesale and Retail Margins, Georgia and Five EU Countries

102%

35%

46%

27%

49%

32%

0%

20%

40%

60%

80%

100%

120%

Georgia Czech Rep. Greece Hungary Italy Poland

% m

argi

n

CountrySource: WB survey and OBIG

Source: Georgia Programmatic Poverty, Technical Note #2, June 28, 2010. World Bank (data based on the WB survey and OBIG)

How Do Health Care Costs Impact Households?

How Equitable is the System?

Private Spending on Health in Relation to Total Household Private Consumption

2001 2002 2003 2004 2005 2006 2007 2008 20090%

2%

4%

6%

8%

10%

12%

14%

3 33 4 4 4 5 5

6

2 2 2 33 3 4 3 44

6

8 8

99

10 10

12

1 1 2 2 23

33

5

Inapatient care Outpatient Medicines and other consumables Rest

Source: National Health Accounts

Impact of Out of Pocket Expenditures on Household Economy

Catastrophic Health Expenditures

Source: Georgia Poverty Assessment, 2009, World Bank.

Health Care is an Important Domestic Policy Issue

54.6%

42.8%

52.0%

44.9%

66.1%

57.3% 57.7%

33.3%

0%

10%

20%

30%

40%

50%

60%

70%

Buying medicines Medical services Unemployment Hunger, undernourishment

% o

f h

ou

seh

old

s

2007

2009

Source: WB LSMS and UNICEF WMS

Main problems cited by households, 2007-2009

Equity In Financial AccessIndicator Year Poorest

20%Second Middle Fourth Richest

20%% of acute sickness in last 30 days where no consultation was sought because it was too expensive

2007 21.5 18.7 23.7 15.2 11.3

2010 27.7 21.9 21.6 20.5 7.3

% of consultations where medicines where prescribed but not purchased because it was too expensive

2007 16.4 11.6 11.6 12.2 7.3

2010 21.7 14.2 11.1 9.4 10.3

% of population needing hospitalization but not hospitalized because it was too expensive

2007 4.7 3.9 3.3 4.7 3.4

2010 3.5 1.8 2.3 2.8 2.6

% of population covered by any type of health insurance 2007 18.5 14.8 12.5 14.4 8.6

2010 39.9 31.1 26.6 23.7 26.2

% of population in households covered by MIP/MAP 2007 14.3 13.2 8.3 9.3 4.2

2010 39.2 26.8 20.1 16.7 13.1

Government Tries to Improve Financial Access for Economically Vulnerable Groups

89%

46%

11%

54%

0% 25% 50% 75% 100%

Not a MIP Beneficiary

MIP Beneficiary

Odds Ratio = 9.8; p<0.01

Paid for services Received free treatment

82%

34%

18%

66%

0% 25% 50% 75% 100%

Vulnerable =No

Vulnerable=Yes

Odds Ratio = 8.8; p<0.01

Paid for services Received free treatment

Free hospital benefits among various groups in 2010

Source: HSUE Survey 2010

Impact of Medical Insurance Program for Economically Vulnerable Groups

63.6

221

43.6

233

52.2

431

85.2

596

0

100

200

300

400

500

600

700

Out-patient 70,000 In-patient 70,000 Out-patient 100,000 In-patient 100,000

GEL

MIP Non-MIPSource: Bauhoff, Hotchkiss, and Smith, 2010

Targeting Performance of MIP

0%

5%

10%

15%

20%

25%

30%

35%

1 2 3 4 5

%

Quintile

% of MIP benefits received by each quintile

Source: UNICEF WMS

Investing in Health Care is Considered top Policy Priority for the Government by Predominant Majority of the Population

Source: Georgia Poverty Assessment, World Bank, April 2009

Main Policy Challenges

• Increasing the role of the state in financing health care and increasing its

strategic purchasing role

• Pooling the private resources to ensure better risk coverage, solidarity and

cross subsidization among the population

• Reducing the out-of-pocket expenditures and increasing the share of pre-paid

expenditure in the private spending

• Stronger regulation of pharmaceutical sector and reducing the price of

medicines

• Extending the benefit package to include drug benefits

• Improve targeting of Medical Insurance Program for the poor and deepening

the coverage

• Increasing the awareness of population about their health care benefits


Recommended