56
Performance of Thermal Exposure Sensors in Personal Alert Safety System (PASS) Devices Nelson Bryner Daniel Madrzykowski David Stroup NISTIR 7294
Performance of Thermal Exposure Sensors inPersonal Alert Safety System (PASS) Devices
Nelson BrynerDaniel Madrzykowski
David Stroup
NISTIR 7294
NISTIR 7294
Performance of Thermal Exposure Sensors inPersonal Alert Safety System (PASS) Devices
Nelson BrynerDaniel Madrzykowski
David StroupBuilding and Fire Research Laboratory
National Institute of Standards and TechnologyGaithersburg, MD 20899-8661
September 2005
U.S. Department of CommerceCarlos M. Gutierrez, Secretary
Technology AdministrationMichelle O'Neill, Acting Under Secretary of
Commerce for TechnologyNational Institute of Standards and Technology
William A. Jeffrey, Director
Department of Homeland SecurityMichael Chertoff, SecretaryU.S. Fire AdministrationR, David Paulison, Administrator

Table of Contents
List of Figures............................................................................................................................... iiiList of Tables ................................................................................................................................. vList of Tables ................................................................................................................................. vAbstract.......................................................................................................................................... 1II. Thermal Exposure Sensors in PASS Devices ....................................................................... 3III. Experimental Apparatus ....................................................................................................... 6
A. Laboratory Experiment – Static Oven............................................................................. 6B. Laboratory Experiment – Flow Loop .............................................................................. 8C. Full Scale Experiments- Mannequin Tests .................................................................... 10D. Analog Signal from PASS Devices............................................................................... 13E. Vibration or Shaker Device ........................................................................................... 15F. Data Acquisition System................................................................................................ 15
IV. Results................................................................................................................................... 16A. Static Oven Tests........................................................................................................... 16B. Flow Loop Tests ............................................................................................................ 19C. Full-Scale Mannequin Experiments .............................................................................. 22D. Uncertainty Analysis ..................................................................................................... 27
V. Discussion.............................................................................................................................. 38A. Thermal Exposure Sensor Activation............................................................................ 38B. Standard Test Protocol................................................................................................... 42
VI. Conclusions .......................................................................................................................... 43VII. Acknowledgements ............................................................................................................. 44VIII. References .......................................................................................................................... 44IX. Other Resources................................................................................................................... 45
iii
List of Figures
Figure 1. Personal Alert Safety System (PASS) devices from various manufacturers. ................ 4Figure 2. Temperature response curves. ........................................................................................ 5Figure 3. Schematic of static oven apparatus................................................................................. 7Figure 4. Photograph of static oven apparatus............................................................................... 7Figure 5. Schematic of flow loop experimental apparatus. ........................................................... 9Figure 6. Photograph of flow loop experimental apparatus........................................................... 9Figure 7. Instrumented mannequin for full-scale field experiments............................................ 11Figure 8. Thermocouple and mannequin elevations. ................................................................... 11Figure 9. PASS devices positioned on front of mannequin. ........................................................ 12Figure 10. PASS devices positioned on rear of mannequin......................................................... 12Figure 11. Full-scale townhouse fire test used to expose instrumented mannequin.................... 13Figure 12. Diagram of townhouse floor plan............................................................................... 14Figure 13. Static oven gas temperature versus PASS analog signal for device A-2. .................. 17Figure 14. Static oven gas temperature versus PASS analog signal for device B-3.................... 17Figure 15. Static oven gas temperature versus PASS analog signal for device C-2.................... 18Figure 16. Flow loop gas temperature versus PASS analog signal for device A-1. .................... 18Figure 17. Flow loop gas temperature versus PASS analog signal for device B-4. .................... 20Figure 18. Flow loop gas temperature versus PASS analog signal for device C-3. .................... 20Figure 19. Gas temperatures versus time for full-scale townhouse burn in Unit 1. .................... 23Figure 20. Thermal heat flux versus time for full-scale townhouse burn in Unit 1..................... 23Figure 21. Temperature (Room) and thermal sensor activation for PASS device A in Unit
1. .............................................................................................................................. 24Figure 22. Temperature (Room) and thermal sensor activation for PASS device C in Unit
1. .............................................................................................................................. 24Figure 23. Temperature (Mannequin front and rear) and thermal sensor activation for
PASS device A in Unit 1......................................................................................... 25Figure 24. Temperature (Mannequin front and rear) and thermal sensor activation for
PASS device C in Unit 1. ........................................................................................ 25Figure 25. Gas temperatures versus time for full-scale townhouse burn in Unit 2. .................... 30Figure 26. Thermal heat flux versus time for full-scale townhouse burn in Unit 2..................... 30Figure 27. Temperature (room) and thermal sensor activation for PASS device A in Unit
2. .............................................................................................................................. 31Figure 28. Temperature (room) and thermal sensor activation for PASS device C in Unit 2 ..... 31Figure 29. Temperature (mannequin front and rear) and thermal sensor activation for
PASS device A in Unit 2......................................................................................... 32Figure 30. Temperature (mannequin front and rear) and thermal sensor activation for
PASS device C in Unit 2 ......................................................................................... 32Figure 31. Gas temperatures versus time for full-scale townhouse burn in Unit 3. .................... 33Figure 32. Thermal heat flux versus time for full-scale townhouse burn in Unit 3..................... 33Figure 33. Temperature (room) and thermal sensor activation for PASS device A in Unit
3. .............................................................................................................................. 34

iv
List of Figures cont'd
Figure 34. Temperature (room) and thermal sensor activation for PASS device C in Unit3. .............................................................................................................................. 34
Figure 35. Temperature (mannequin front and rear) and thermal sensor activation forPASS device A in Unit 3......................................................................................... 35
Figure 36. Temperature (mannequin front and rear) and thermal sensor activation forPASS device C in Unit 3. ........................................................................................ 35

v
List of Tables
Table 1. Static oven exposure tests for PASS devices. ................................................................ 19Table 2. Flow loop exposure tests for PASS devices. ................................................................. 21Table 3. Full-scale townhouse exposure tests for PASS devices (room peak temperatures). ..... 28Table 4. Full-scale townhouse exposure tests for PASS devices (mannequin peak
temperatures). .......................................................................................................... 29Table 5. Uncertainty in static oven and flow loop experimental data. ........................................ 36Table 6. Uncertainty in full scale experimental data. .................................................................. 37
1
Performance of Thermal Exposure Sensors in Personal Alert Safety System(PASS) Devices
by
Nelson BrynerDaniel Madrzykowski
David Stroup
Abstract
Fire fighters can be overcome by heat or smoke of a fire and may be unable to alert otherfire ground personnel to their need for assistance. Personal Alert Safety System (PASS) devicesare designed to signal for aid if a fire fighter becomes incapacitated. Thermal exposure sensortechnology has already been included in a number of PASS devices, but no standard exists fortesting the performance of the thermal sensor.
A series of static oven, flow loop, and full-scale experiments were conducted todemonstrate the performance of different PASS devices. This limited set of temperature versusthermal sensor activation data indicates that sensors respond differently under static, flowing,and radiation intense conditions. The full-scale data demonstrate that current thermalsensing/PASS implementations are unlikely to provide a fire fighter with sufficient warning ofan acute thermal hazard. Current PASS devices may provide information to fire fighters abouttheir longer term exposure to thermal conditions, but there is a significant delay of 25 s to 120 sbefore the fire fighter receives this alarm or information.
This limited series of experiments demonstrates the need to develop a standard testingprotocol to insure that all PASS devices provide adequate protection for fire fighters. Thistesting protocol must evaluate the performance of thermal sensors under a range of fireenvironments that fire fighters may realistically encounter on a routine basis. This experimentaldata was used to develop a prototype standard test protocol which can used to quantify thethermal sensor performance.
Keywords: Personal Alert Safety System, PASS, PASS device, thermal exposure, thermalsensor, thermal response data
2
I. Introduction
Fire fighters can be quickly overcome by the heat or smoke of a fire and may be unable toalert other fire ground personnel to their need for assistance. Personal Alert Safety System(PASS) devices are designed to signal for aid if a fire fighter becomes incapacitated on the fireground. From 1994 to 1998, an average of 725 fire fighters per year were caught or trapped instructure fires that resulted in injury or death of fire fighters, according to an analysis of NationalFire Incident Reporting System (NFIRS) data by the National Fire Protection Association(NFPA) [1]. Fire fighters fatalities resulting from being caught or trapped in structures caused15 deaths out of a total of 97 fire fighter fatalities according to NFPA statistics for 2002 [2] andrepresented the third leading cause of fire fighter fatalities after stress/overexertion and struck byobjects [2]. US Fire Administration statistics for 2003 indicate that caught/trapped or collapseaccounted for 12 fire fighter fatalities in 2003 [3]. Two NFPA studies examined fatalities dueto structural collapse for 1979-1988 [4] and for 1983-1992 [5] and reported that 60 % of firefighter deaths in structures were caused by being caught or trapped in the structure. Brasselland Evans [6] reported that this percentage increased to over 85 % for the period 1994 to 2002.Fire fighter becoming caught or trapped in structures has been a major hazard for fire fighters forthe past 20 years. If properly implemented, the PASS device can serve as a platform for theincorporation of additional and more innovative technology to help reduce fatalities and injuriesresulting from caught or trapped fire fighters.
Personal Alert Safety System devices are designed to signal for aid via an audible alarmsignal if a fire fighter becomes incapacitated on the fire ground. Typically, PASS devices sensemovement or lack of movement and activate a 95-decibel alarm signal if the lack of motionexceeds a specific time period. The loud alarm signal alarm alerts other personnel that a firefighter has become motionless and may be incapacitated. The loud alarm helps to guide rescuepersonnel to the location of the incapacitated fire fighter. Performance standards and testingprotocols for motion or lack of motion detectors is described by NFPA Standard 1982 [7]. Whilethe current NFPA Standard for PASS devices (NFPA 1982) requires only a motion detector,some PASS device manufacturers are beginning to incorporate additional technology into PASSdevices to improve fire ground safety. If properly implemented, new technology includingthermal sensors could significantly improve the safety and effectiveness of fire fighters on thefire ground.
Thermal exposure sensor technology has already been included in a number of models ofPASS devices. However, there are currently no standards or testing protocols with which toassess the performance of these thermal exposure sensors. While it is commendable thatmanufacturers seek to include more technology in order to increase the safety of fire fighters, thefire service does not have the resources to evaluate the thermal exposure sensor performance inPASS devices. There is a need for a well-designed testing protocol that would include differentfire conditions that fire fighters typically encounter. This would allow the fire service tounderstand better the performance characteristics of the thermal sensors. In addition, astandardized testing protocol would allow the manufacturers to match the performance of theirdevices with the requirements of the fire service.
In the future, additional capabilities and technologies may be incorporated into PASSdevices. Emerging technologies which would provide valuable capabilities to the fire serviceinclude fire fighter location and tracking, fire ground accountability, toxic gas analyzers, and
3
physiological and stress monitors. It would also be useful if future PASS devices couldincorporate the capability to communicate information such as location, gas concentrations, andheart rate to the incident commander outside the structure. It is critical that a standardizedtesting protocol be in place as each these technologies are integrated into PASS devices so thatthe fire service understands the performance as well as the limitations of their equipment. Theoverall goal of this work is to improve the safety and effectiveness of fire fighters. Toaccomplish this goal, the fire service must be able to incorporate state-of-the-art technology intoall of its equipment. But, in order for the fire service to integrate new technology safely, it mustbe able to understand the performance and the limitations of this new technology.
The first part of this study examines the performance of the thermal exposure sensors in aseries of laboratory as well as real scale experiments. Exploring new technologies, such as firefighter locator, fire ground accountability, toxic gas analyzers, and physiological monitors,which might enhance performance of future PASS devices and developing a prioritized plan toincorporate new technology will be addressed in a separate report.
II. Thermal Exposure Sensors in PASS Devices
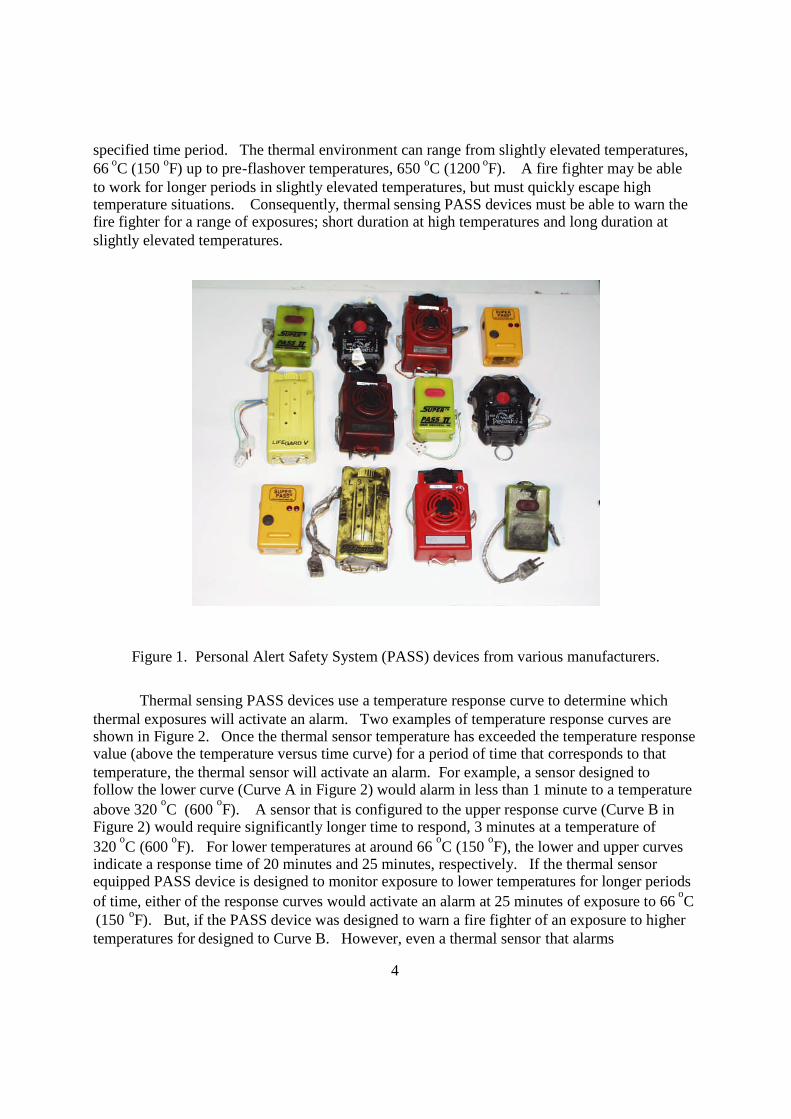
Thermal exposure sensor technology has been incorporated into motion detector PASSdevices by a number of manufacturers, but not all PASS suppliers have incorporated thermalsensors into their devices. Examples of different PASS devicesare shown in Figure 1. Someof the PASS devices that are shown in Figure 1 have been modified by adding external wireswhich allowed the alarm signal to be monitored externally. This modification is discussed laterin this report. Not all the devices shown in Figure 1 incorporate thermal exposure sensors.This thermal sensing capability is not required by NFPA Standard 1982. Currently, the lack ofan equipment standard or testing protocol for the thermal sensors has resulted in eachmanufacturer developing their own specific implementation of thermal sensing technology.Typically, the thermal sensor utilizes a single, small sensing element, usually less than 3.2 mm(0.125 in) in diameter. The temperature-sensing component is located inside the case of eachPASS device. Each thermal sensor monitors a temperature and if the temperature exceeds a pre-determined value for a specific period of time, the PASS device is designed to go into alarm.The electronics necessary to process the temperature data are typically incorporated onto thecircuit board that collects and processes the information from the motion detector. The PASSdevice generates a 95-decibel alarm signal when either the temperature sensor or motion detectorhas been activated.
Fire fighters wear protective gear that effectively insulates them from the thermalenvironment around them. At times, it is difficult for the fire fighter to appreciate how muchheat flux or thermal stress they have been exposed to during fire fighting operations. Thermalsensor equipped PASS devices are worn on the outside of the protective gear and monitor thethermal exposure. Thermal sensors continuously track the thermal environment and aredesigned to alarm at pre-set exposure values when the set-point temperature is exceeded for a
Certain trade names and company products are mentioned in the text or identified in an illustration in order tospecify adequately the experimental procedure and equipment used. In no case does such identification implyrecommendation or endorsement by the National Institute of Standards and Technology, nor does it imply that theproducts are necessarily the best available for the purpose.
4
specified time period. The thermal environment can range from slightly elevated temperatures,66 oC (150 oF) up to pre-flashover temperatures, 650 oC (1200 oF). A fire fighter may be ableto work for longer periods in slightly elevated temperatures, but must quickly escape hightemperature situations. Consequently, thermal sensing PASS devices must be able to warn thefire fighter for a range of exposures; short duration at high temperatures and long duration atslightly elevated temperatures.
Figure 1. Personal Alert Safety System (PASS) devices from various manufacturers.
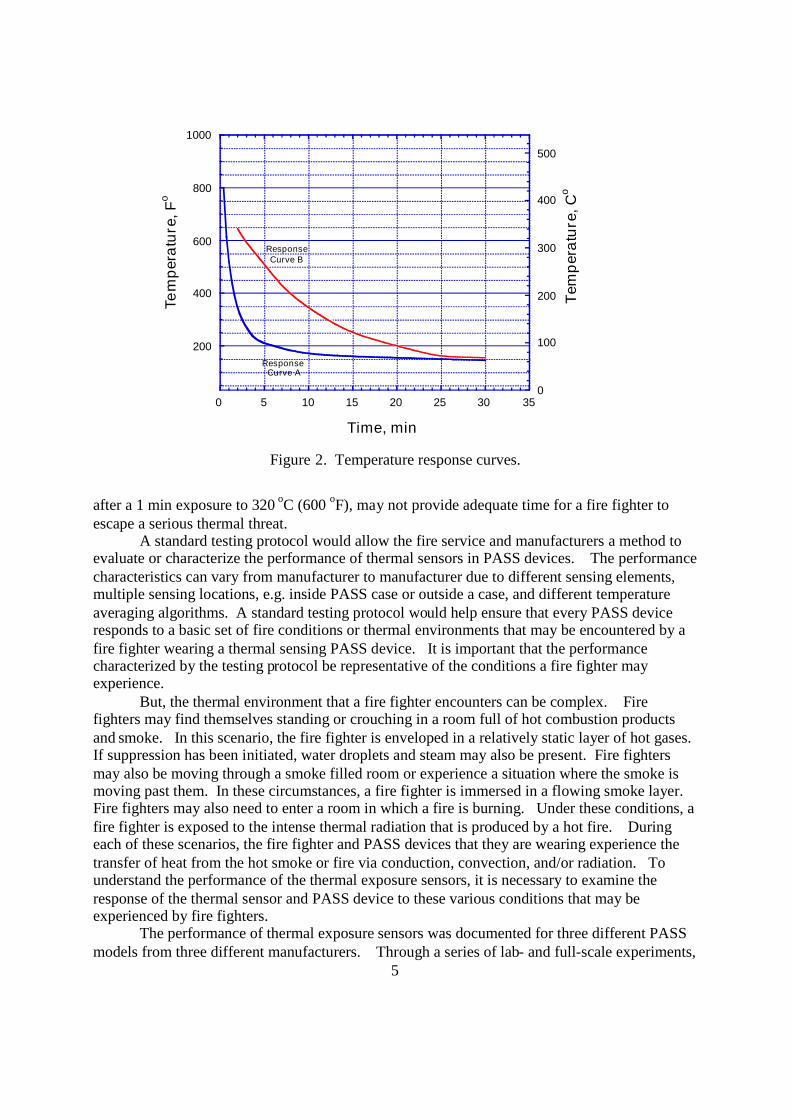
Thermal sensing PASS devices use a temperature response curve to determine whichthermal exposures will activate an alarm. Two examples of temperature response curves areshown in Figure 2. Once the thermal sensor temperature has exceeded the temperature responsevalue (above the temperature versus time curve) for a period of time that corresponds to thattemperature, the thermal sensor will activate an alarm. For example, a sensor designed tofollow the lower curve (Curve A in Figure 2) would alarm in less than 1 minute to a temperatureabove 320 oC (600 oF). A sensor that is configured to the upper response curve (Curve B inFigure 2) would require significantly longer time to respond, 3 minutes at a temperature of320 oC (600 oF). For lower temperatures at around 66 oC (150 oF), the lower and upper curvesindicate a response time of 20 minutes and 25 minutes, respectively. If the thermal sensorequipped PASS device is designed to monitor exposure to lower temperatures for longer periodsof time, either of the response curves would activate an alarm at 25 minutes of exposure to 66 oC(150 oF). But, if the PASS device was designed to warn a fire fighter of an exposure to highertemperatures for designed to Curve B. However, even a thermal sensor that alarms
5
200
400
600
800
1000
0
100
200
300
400
500
0 5 10 15 20 25 30 35
Tem
per
atu
re,F
o
Tem
per
atu
re,C
o
Time, min
ResponseCurve A
ResponseCurve B
Figure 2. Temperature response curves.
after a 1 min exposure to 320 oC (600 oF), may not provide adequate time for a fire fighter toescape a serious thermal threat.
A standard testing protocol would allow the fire service and manufacturers a method toevaluate or characterize the performance of thermal sensors in PASS devices. The performancecharacteristics can vary from manufacturer to manufacturer due to different sensing elements,multiple sensing locations, e.g. inside PASS case or outside a case, and different temperatureaveraging algorithms. A standard testing protocol would help ensure that every PASS deviceresponds to a basic set of fire conditions or thermal environments that may be encountered by afire fighter wearing a thermal sensing PASS device. It is important that the performancecharacterized by the testing protocol be representative of the conditions a fire fighter mayexperience.
But, the thermal environment that a fire fighter encounters can be complex. Firefighters may find themselves standing or crouching in a room full of hot combustion productsand smoke. In this scenario, the fire fighter is enveloped in a relatively static layer of hot gases.If suppression has been initiated, water droplets and steam may also be present. Fire fightersmay also be moving through a smoke filled room or experience a situation where the smoke ismoving past them. In these circumstances, a fire fighter is immersed in a flowing smoke layer.Fire fighters may also need to enter a room in which a fire is burning. Under these conditions, afire fighter is exposed to the intense thermal radiation that is produced by a hot fire. Duringeach of these scenarios, the fire fighter and PASS devices that they are wearing experience thetransfer of heat from the hot smoke or fire via conduction, convection, and/or radiation. Tounderstand the performance of the thermal exposure sensors, it is necessary to examine theresponse of the thermal sensor and PASS device to these various conditions that may beexperienced by fire fighters.
The performance of thermal exposure sensors was documented for three different PASSmodels from three different manufacturers. Through a series of lab- and full-scale experiments,
6
the overall performance of a PASS device to alarm in response to a specific thermal insult orcondition was evaluated. This limited set of experiments was designed to provide a betterunderstanding of the response characteristics of PASS devices equipped with thermal sensors inorder to help develop a standard test protocol.
These experimental series was not intended to be “product testing” and is too limited tobe used to rank the individual PASS devices. Since the focus of this work is to develop astandard test protocol which does not favor any one specific thermal sensor technology, PASSdevices will only be identified as Model A, Model B, and Model C. Multiple PASS devices ofthe same model from the same manufacturer will be identified as A-1, A-2, and A-3.
III. Experimental Apparatus
The performance of different PASS models from various manufacturers was examinedduring experiments in a static oven, in a heated flow loop, and on a mannequin in field tests.Four different models of PASS devices were exposed to static hot gases, flowing hot gases, orreal scale combustion gases. Three of the models had thermal sensors and one model did not.This study will focus on the temperature versus alarm activation data for the three models thatincorporated thermal sensors. While not the focus of this study, the impact of repeated thermalexposures on the motion repeated thermal exposures did not appear to impact the motion sensingcapability of the PASS devices, with or without the thermal sensor. The performance ofthermal sensor equipped PASS devices were examined in 60 tests in a static oven, 48 runs in aheated flow loop, and four mannequin tests in townhouse fires.
The laboratory experiments involved exposing each thermal sensor equipped PASSdevice to a series of different temperature environments in a static oven as well as a flow loopthat allowed hot air to flow past each device. Both the static oven and flow loop experimentswere designed to allow careful monitoring of the temperature around each PASS device andwhen each PASS device alarmed. In each laboratory experiment, the temperature could beincreased gradually and in a controlled fashion. For each case, static or flowing, the temperatureof the hot gases was increased until the thermal sensor alarmed.
Field experiments were designed to expose each PASS device to realistic fire conditionsin which the temperatures may increase more quickly (and realistically) than in the laboratoryexperiments. Six PASS devices were mounted on a mannequin that was also instrumented withthermocouples on the front, rear, inside, and top of the protective gear. This instrumented andPASS equipped mannequin was then exposed to a series of townhouse burns when thetemperature and time history were monitored until the thermal sensors alarmed.
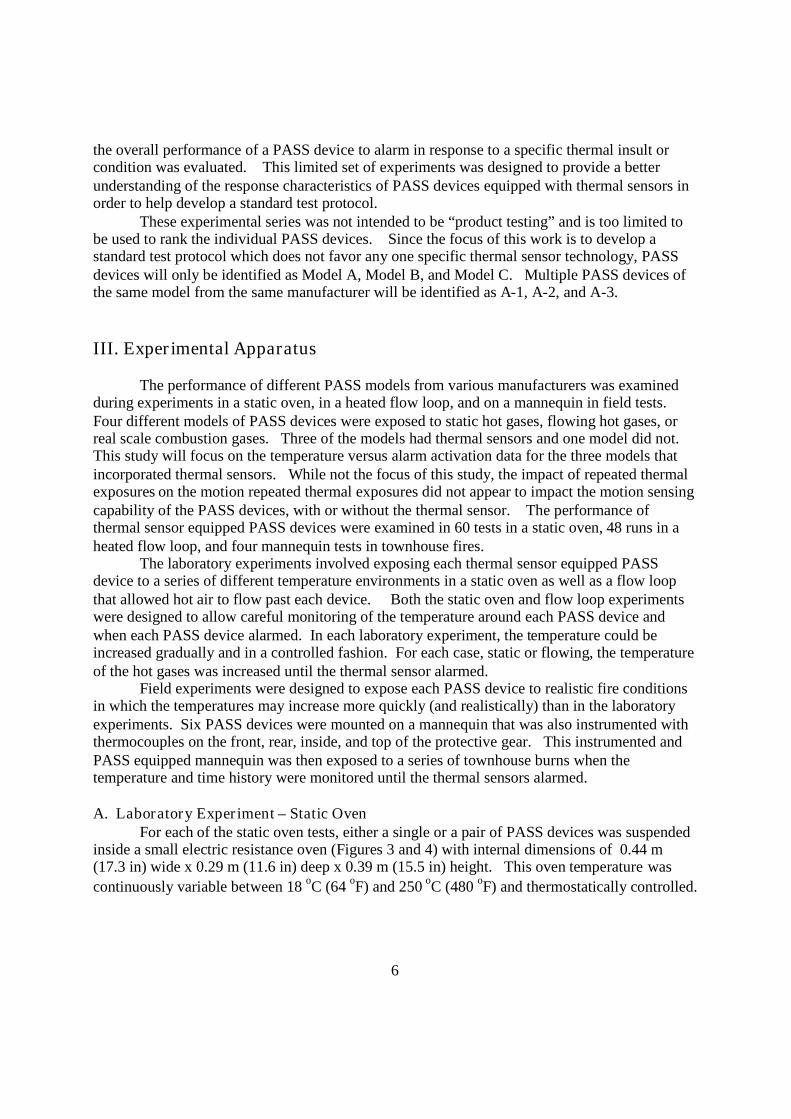
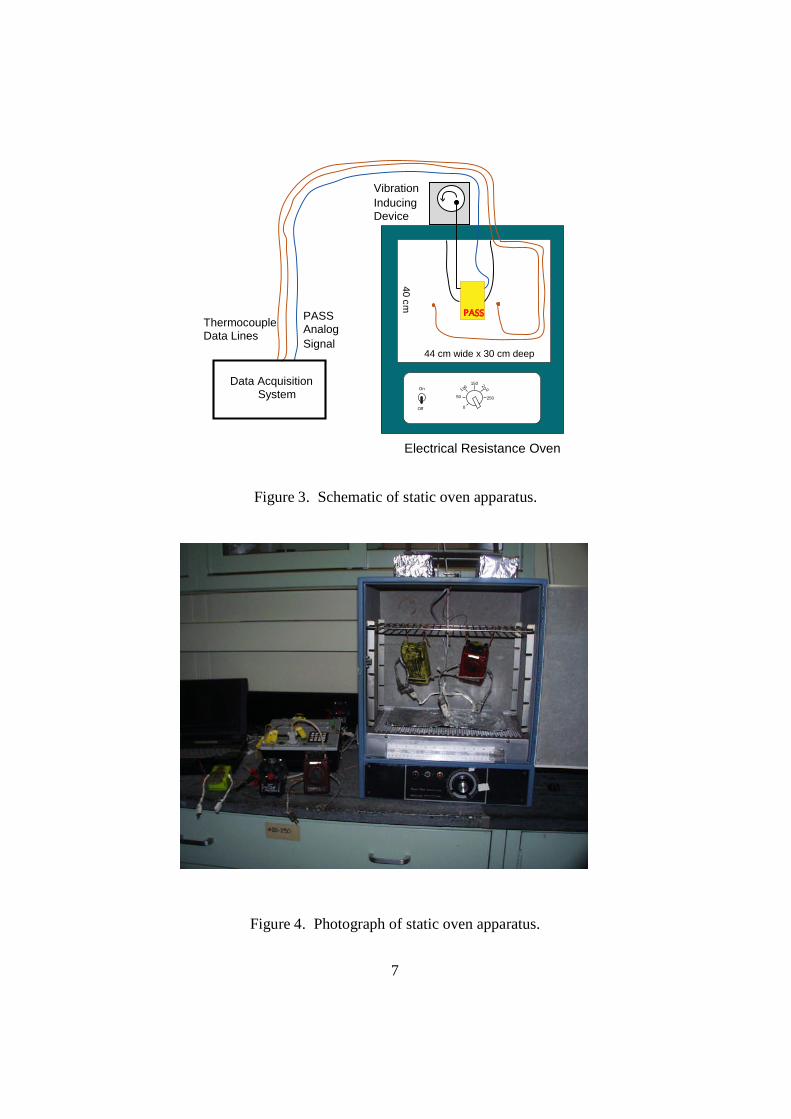
A. Laboratory Experiment – Static OvenFor each of the static oven tests, either a single or a pair of PASS devices was suspended
inside a small electric resistance oven (Figures 3 and 4) with internal dimensions of 0.44 m(17.3 in) wide x 0.29 m (11.6 in) deep x 0.39 m (15.5 in) height. This oven temperature wascontinuously variable between 18 oC (64 oF) and 250 oC (480 oF) and thermostatically controlled.
7
250
20 0
150
1 00
0
50
On
Off
44 cm wide x 30 cm deep
40cm
Electrical Resistance Oven
VibrationInducingDevice
PASSAnalogSignal
ThermocoupleData Lines
Data AcquisitionSystem
Figure 3. Schematic of static oven apparatus.
Figure 4. Photograph of static oven apparatus.
8
Each device was suspended approximately in the center of the oven and connected to the dataacquisition system. Each PASS device was instrumented front and rear with Chromel-Alumelthermocouples with bead diameters of 2 mm (0.08 in) diameter. Additional thermocouples wereplaced in the center of the oven and outside the oven to monitor the gas temperature and ambienttemperature, respectively. These thermocouples allowed the PASS device, gas, and ambienttemperatures to be monitored continuously. Prior to inserting the PASS devices into the staticoven, each device received a new 9 Volt battery.
For each oven test, the initial oven temperature was recorded, typically being between18 oC (64 oF) to 28 oC (82 oF). Each PASS device or pair of PASS devices was mounted alongthe centerline of the oven. Once mounted inside the oven, each PASS devices was connected tothe data acquisition system and to a vibration-inducing device. The vibration or shaker deviceinduced a slight movement (vertical direction) in each PASS devices in order to prevent falsealarms due to the motion sensor. The oven door was closed and the oven temperature was resetto 40 oC (105 oF). The temperature of the gas as indicated by a thermocouple in the center of theoven was allowed to reach the initial temperature set point. After ten minutes if the PASSdevice had not alarmed, the temperature set point was increased by 5 oC (9 oF). This process ofincreasing the temperature and exposing the PASS device to that temperature for 10 minutes wascontinued until the PASS alarmed or the oven temperature exceeded 120 oC (250 oF).
If two PASS devices had been mounted in the oven, then the device that had alarmed wasremoved from the oven and the test continued with the other PASS device alarm. After eachPASS device had alarmed, the PASS devices were removed and the oven was allowed to cooldown and then the procedure was initiated with the next two PASS devices. Each set ofexperiments for a given PASS device included at least three runs in the oven and at least twoPASS devices from each manufacturer were exposed.
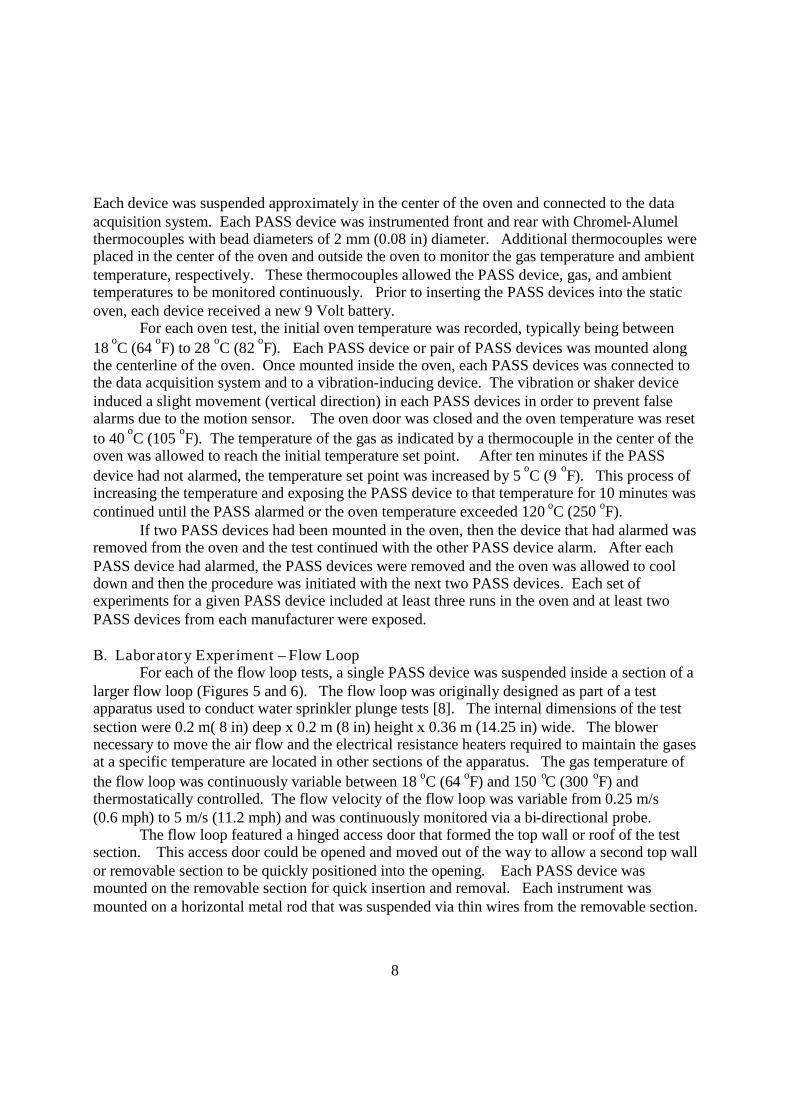
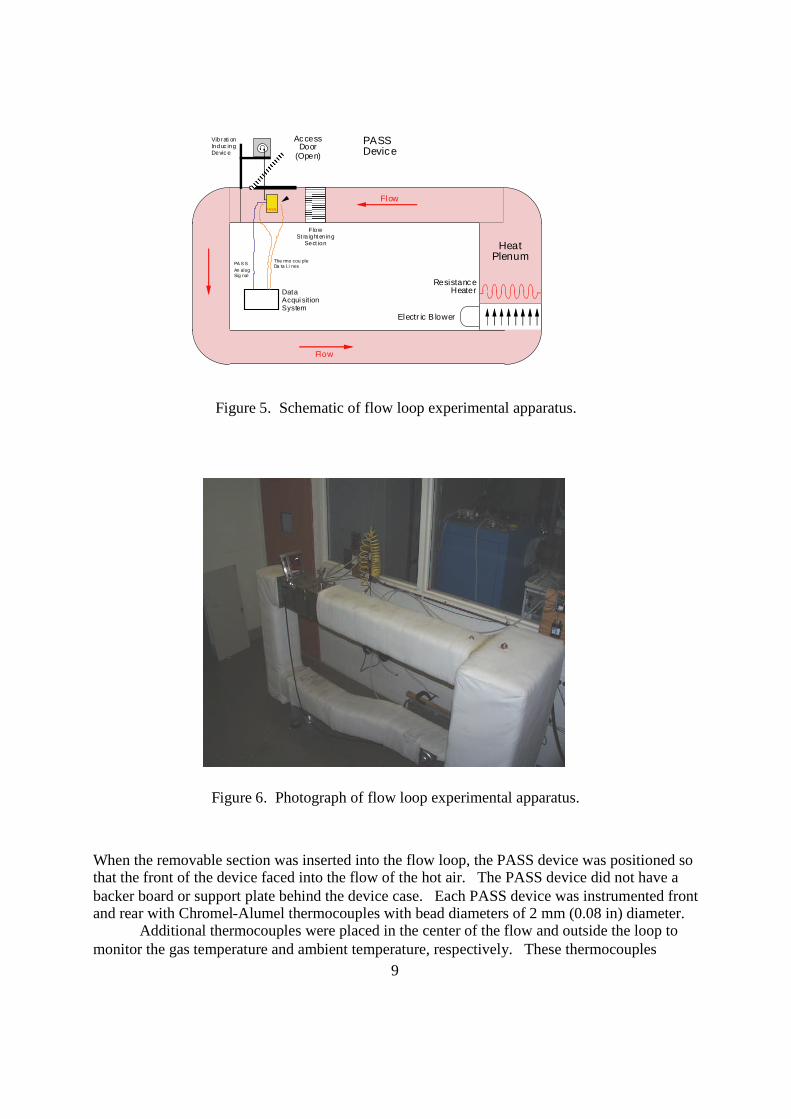
B. Laboratory Experiment – Flow LoopFor each of the flow loop tests, a single PASS device was suspended inside a section of a
larger flow loop (Figures 5 and 6). The flow loop was originally designed as part of a testapparatus used to conduct water sprinkler plunge tests [8]. The internal dimensions of the testsection were 0.2 m( 8 in) deep x 0.2 m (8 in) height x 0.36 m (14.25 in) wide. The blowernecessary to move the air flow and the electrical resistance heaters required to maintain the gasesat a specific temperature are located in other sections of the apparatus. The gas temperature ofthe flow loop was continuously variable between 18 oC (64 oF) and 150 oC (300 oF) andthermostatically controlled. The flow velocity of the flow loop was variable from 0.25 m/s(0.6 mph) to 5 m/s (11.2 mph) and was continuously monitored via a bi-directional probe.
The flow loop featured a hinged access door that formed the top wall or roof of the testsection. This access door could be opened and moved out of the way to allow a second top wallor removable section to be quickly positioned into the opening. Each PASS device wasmounted on the removable section for quick insertion and removal. Each instrument wasmounted on a horizontal metal rod that was suspended via thin wires from the removable section.
9
FlowSt ra ight en ing
Sect ion
Ac cessDoor
(Open)
PASS
Flow
Flow
HeatPlenum
Electr ic B lower
Resistanc eHeater
PASSDevice
DataAcqui sit ionSystem
The rmo cou pleDa ta Li nesPA S S
An alogSig nal
Vibrati onInduc ingDevic e
Control Panel
Figure 5. Schematic of flow loop experimental apparatus.
Figure 6. Photograph of flow loop experimental apparatus.
When the removable section was inserted into the flow loop, the PASS device was positioned sothat the front of the device faced into the flow of the hot air. The PASS device did not have abacker board or support plate behind the device case. Each PASS device was instrumented frontand rear with Chromel-Alumel thermocouples with bead diameters of 2 mm (0.08 in) diameter.
Additional thermocouples were placed in the center of the flow and outside the loop tomonitor the gas temperature and ambient temperature, respectively. These thermocouples
10
allowed the PASS device, gas, and ambient temperatures to be monitored continuously. Prior toinserting the PASS devices into the flow loop, each device received a new 9 Volt battery. EachPASS was then mounted on a removable section, connected to the data acquisition system andthe vibration-inducing device.
After the flow loop had reached a velocity of 1.3 m/s (3 mph), and maintained thatvelocity for several minutes, the temperature of the flow was recorded, typically being between24 oC (75 oF) to 28 oC (82 oF). The PASS device was turned on, the shaker device wasactivated, and the device equipped removable section was placed into the flow section. Afterchecking to insure that each PASS device was not alarming due to lack of motion, the removablesection and PASS device were lifted out of the flow section. The hinged access door was closedand the flow loop temperature was reset to 40 oC (105 oF).
For each of the flow loop tests, a PASS device was quickly inserted into a flow of heatedair. If the device did not alarm after ten minutes of exposure, the PASS device was removed.The temperature of the air was increased by 10 oC (18 oF). This process of increasing thetemperature and exposing the PASS device to that temperature for 10 minutes was continueduntil the PASS alarmed or the flow loop air temperature exceeded 120 oC (250 oF). Theseexperiments were repeated at least three times with each of the different PASS devices.
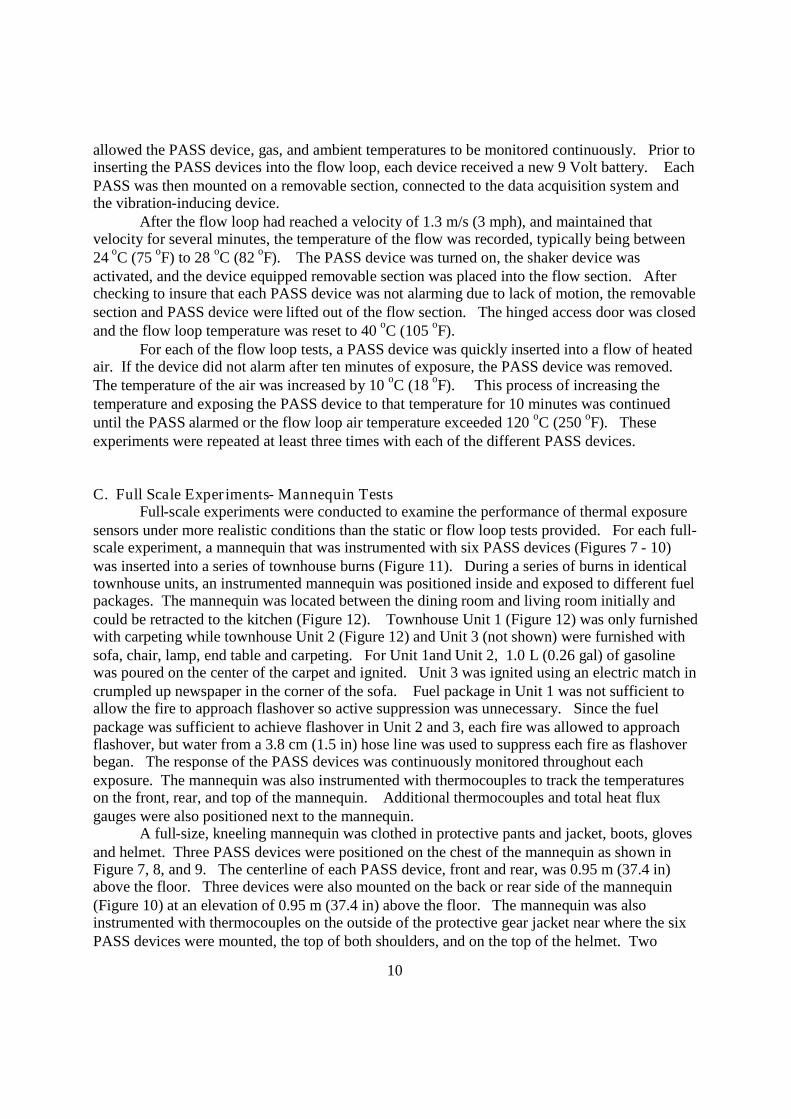
C. Full Scale Experiments- Mannequin TestsFull-scale experiments were conducted to examine the performance of thermal exposure
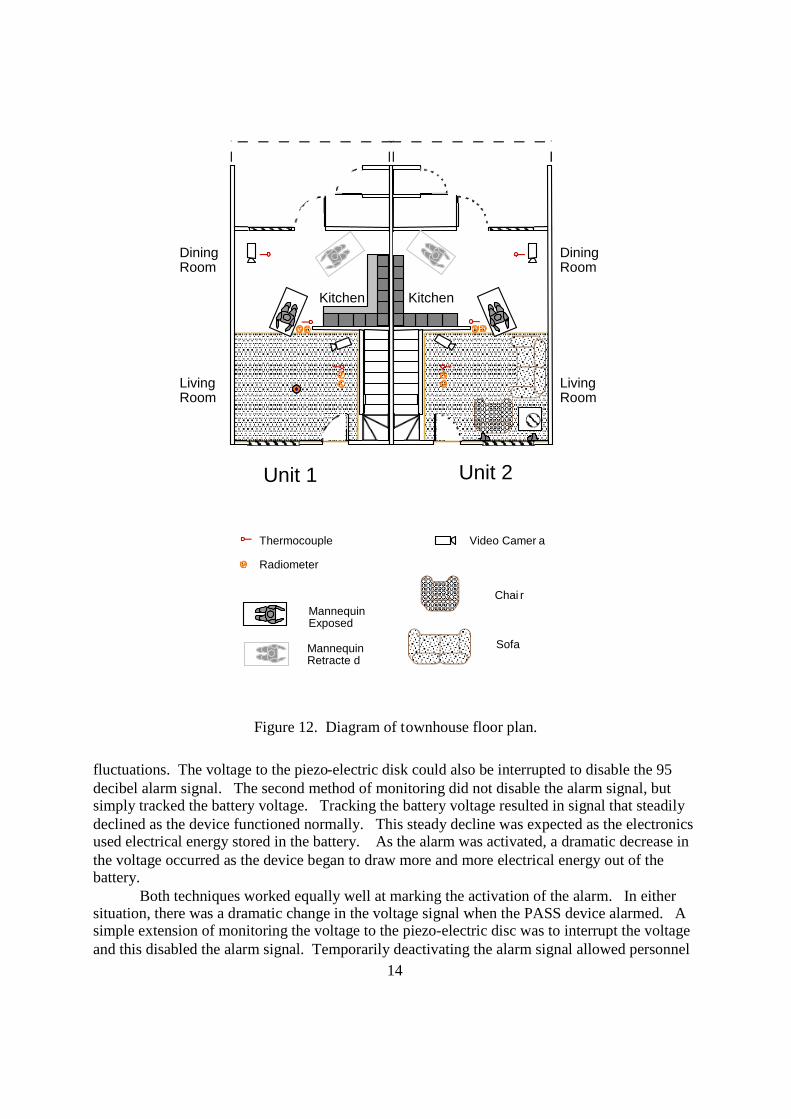
sensors under more realistic conditions than the static or flow loop tests provided. For each full-scale experiment, a mannequin that was instrumented with six PASS devices (Figures 7 - 10)was inserted into a series of townhouse burns (Figure 11). During a series of burns in identicaltownhouse units, an instrumented mannequin was positioned inside and exposed to different fuelpackages. The mannequin was located between the dining room and living room initially andcould be retracted to the kitchen (Figure 12). Townhouse Unit 1 (Figure 12) was only furnishedwith carpeting while townhouse Unit 2 (Figure 12) and Unit 3 (not shown) were furnished withsofa, chair, lamp, end table and carpeting. For Unit 1and Unit 2, 1.0 L (0.26 gal) of gasolinewas poured on the center of the carpet and ignited. Unit 3 was ignited using an electric match incrumpled up newspaper in the corner of the sofa. Fuel package in Unit 1 was not sufficient toallow the fire to approach flashover so active suppression was unnecessary. Since the fuelpackage was sufficient to achieve flashover in Unit 2 and 3, each fire was allowed to approachflashover, but water from a 3.8 cm (1.5 in) hose line was used to suppress each fire as flashoverbegan. The response of the PASS devices was continuously monitored throughout eachexposure. The mannequin was also instrumented with thermocouples to track the temperatureson the front, rear, and top of the mannequin. Additional thermocouples and total heat fluxgauges were also positioned next to the mannequin.
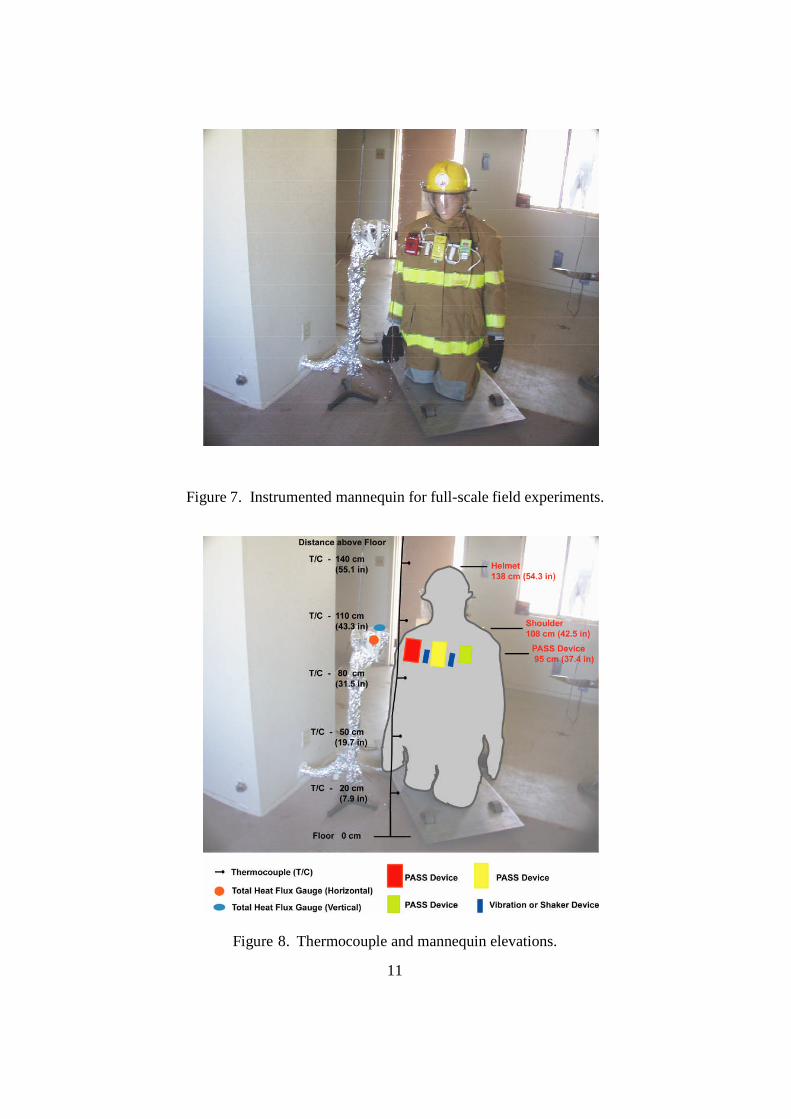
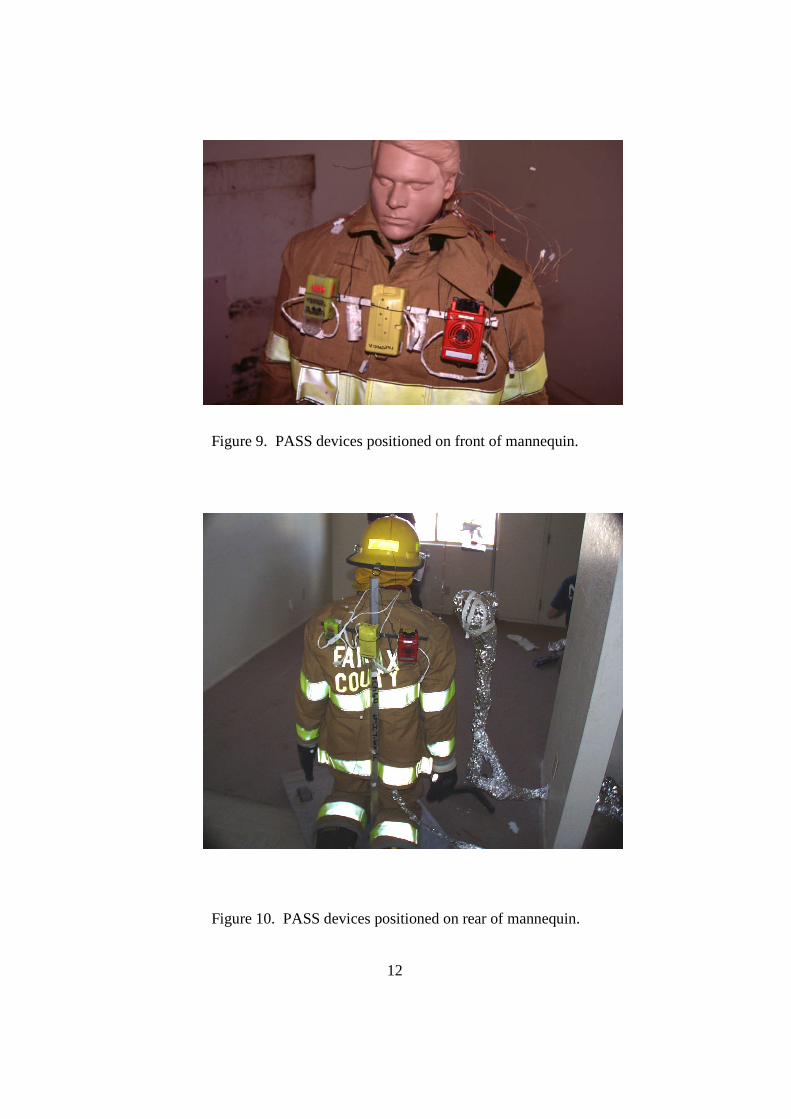
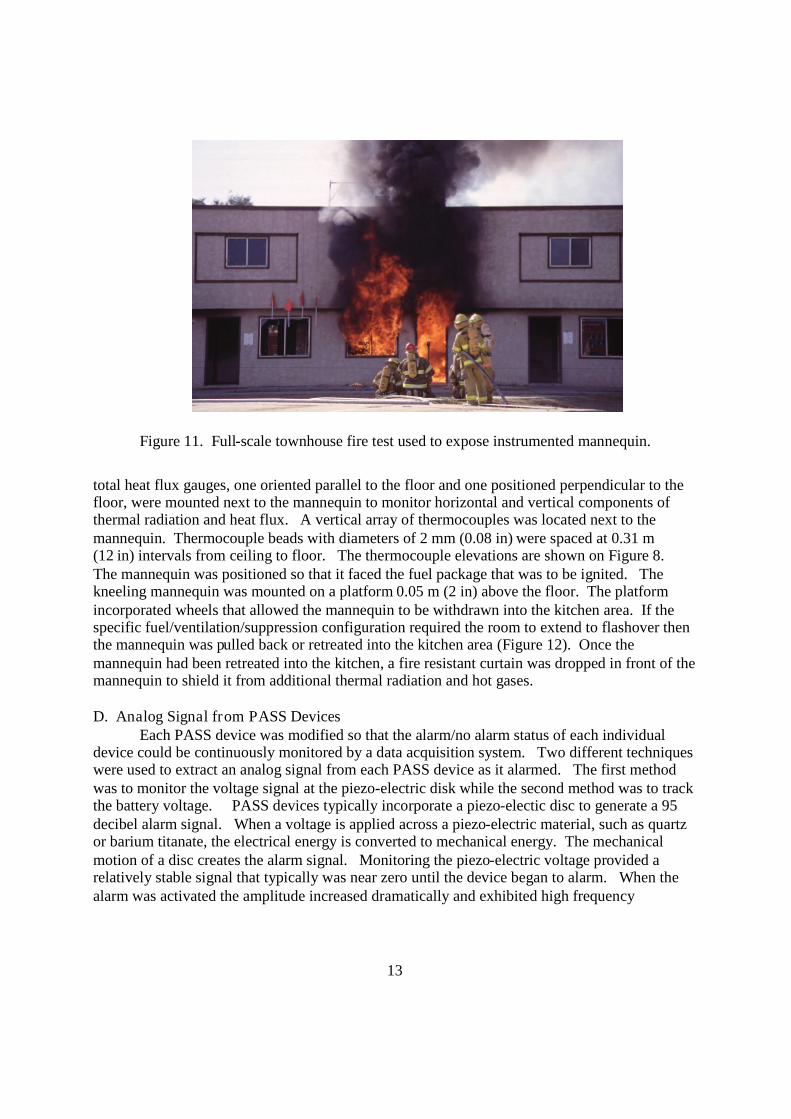
A full-size, kneeling mannequin was clothed in protective pants and jacket, boots, glovesand helmet. Three PASS devices were positioned on the chest of the mannequin as shown inFigure 7, 8, and 9. The centerline of each PASS device, front and rear, was 0.95 m (37.4 in)above the floor. Three devices were also mounted on the back or rear side of the mannequin(Figure 10) at an elevation of 0.95 m (37.4 in) above the floor. The mannequin was alsoinstrumented with thermocouples on the outside of the protective gear jacket near where the sixPASS devices were mounted, the top of both shoulders, and on the top of the helmet. Two
11
Figure 7. Instrumented mannequin for full-scale field experiments.
Figure 8. Thermocouple and mannequin elevations.
12
Figure 9. PASS devices positioned on front of mannequin.
Figure 10. PASS devices positioned on rear of mannequin.
13
Figure 11. Full-scale townhouse fire test used to expose instrumented mannequin.
total heat flux gauges, one oriented parallel to the floor and one positioned perpendicular to thefloor, were mounted next to the mannequin to monitor horizontal and vertical components ofthermal radiation and heat flux. A vertical array of thermocouples was located next to themannequin. Thermocouple beads with diameters of 2 mm (0.08 in) were spaced at 0.31 m(12 in) intervals from ceiling to floor. The thermocouple elevations are shown on Figure 8.The mannequin was positioned so that it faced the fuel package that was to be ignited. Thekneeling mannequin was mounted on a platform 0.05 m (2 in) above the floor. The platformincorporated wheels that allowed the mannequin to be withdrawn into the kitchen area. If thespecific fuel/ventilation/suppression configuration required the room to extend to flashover thenthe mannequin was pulled back or retreated into the kitchen area (Figure 12). Once themannequin had been retreated into the kitchen, a fire resistant curtain was dropped in front of themannequin to shield it from additional thermal radiation and hot gases.
D. Analog Signal from PASS DevicesEach PASS device was modified so that the alarm/no alarm status of each individual
device could be continuously monitored by a data acquisition system. Two different techniqueswere used to extract an analog signal from each PASS device as it alarmed. The first methodwas to monitor the voltage signal at the piezo-electric disk while the second method was to trackthe battery voltage. PASS devices typically incorporate a piezo-electic disc to generate a 95decibel alarm signal. When a voltage is applied across a piezo-electric material, such as quartzor barium titanate, the electrical energy is converted to mechanical energy. The mechanicalmotion of a disc creates the alarm signal. Monitoring the piezo-electric voltage provided arelatively stable signal that typically was near zero until the device began to alarm. When thealarm was activated the amplitude increased dramatically and exhibited high frequency
14
KitchenKitchen
LivingRoom
DiningRoom
LivingRoom
DiningRoom
Video Camer aThermocouple
Radiometer
MannequinExposed
MannequinRetracte d
Chai r
Sofa
Unit 1 Unit 2
Figure 12. Diagram of townhouse floor plan.
fluctuations. The voltage to the piezo-electric disk could also be interrupted to disable the 95decibel alarm signal. The second method of monitoring did not disable the alarm signal, butsimply tracked the battery voltage. Tracking the battery voltage resulted in signal that steadilydeclined as the device functioned normally. This steady decline was expected as the electronicsused electrical energy stored in the battery. As the alarm was activated, a dramatic decrease inthe voltage occurred as the device began to draw more and more electrical energy out of thebattery.
Both techniques worked equally well at marking the activation of the alarm. In eithersituation, there was a dramatic change in the voltage signal when the PASS device alarmed. Asimple extension of monitoring the voltage to the piezo-electric disc was to interrupt the voltageand this disabled the alarm signal. Temporarily deactivating the alarm signal allowed personnel
15
to conduct the test series without additional ear protection and caused less disturbance to nearbylaboratories and offices. In the field experiments, having all six of the PASS device on themannequin in alarm simultaneously would have required the operator to wear ear protection,earplugs or ear muffs. Monitoring the piezo-electric signal in the field again allowed for theexperiments to be conducted without ear protection.
E. Vibration or Shaker DeviceAs each thermal sensor was being exposed to a different thermal environment, whether it
was a static oven, flow loop, or full-scale fire test, it was necessary to prevent the PASS devicefrom alarming due to lack of motion. The lack of motion detector and thermal exposure sensorshared the same piezo-electric disks to generate the 95 decibel alarm signal. An alarm from thelack of motion could have been confused with the alarm from the thermal sensor. To preventthis confusion, each PASS device was connected to a shaker or vibration inducing device. Theshaker cause a relatively small movement, typically less than 0.013 m (0.5 in), and this wassufficient motion to prevent the motion detector from activating the alarm. For the lab-scaletests in the static oven and flow loop the shaker device was attached to each PASS device viahigh temperature wire and periodically lifted the device and allowed the PASS to drop backdown approximately 4 to 5 times a minute.
For the field experiments, it was impractical to use the lab-scale device to shake thePASS devices mounted on the mannequin. The lab-scale shaker was relatively large and waspowered via 120 volt AC house electricity. For the field work, smaller battery poweredshakers, each 2.54 cm (1 in) diameter and 8.9 cm (3.5 in) long, were attached to the harness thatheld the three PASS devices on the front and three devices on the rear of the mannequin. Twoof the battery powered vibration devices appear as white cylindrical shaped objects in betweenthe PASS devices in Figure 9 and blue rectangles in Figure 8. Each of the small shakersincorporated a small direct current (DC) motor that moved a small weight that resulted in a slightmovement of the shaker. Since each of the vibration inducing devices was attached to the sameharness the secured the PASS devices, the vibrations were transmitted to the PASS devices.Multiple shakers were necessary to obtain sufficient movement or vibrations to prevent thePASS devices from alarming due to lack of motion.
F. Data Acquisition SystemThe analog voltage signal from each PASS device as well as the electrical signal from
each of the thermocouples were connected to a 12 channel (Model CRX-23) or 70 channel(Model CR-7) portable data acquisition system from Campbell Scientific Instruments. The 12channel system was used for the static oven and flow loop experiments while the 70 channelsystem was utilized in the field experiments. Both of these battery powered data collectionboxes recorded the PASS and thermocouple data at 2 s intervals. The software available withthe data acquisition system also allowed the temperatures and alarm status of the PASS devicesto be continuously monitored via a laptop computer.
16
IV. Results
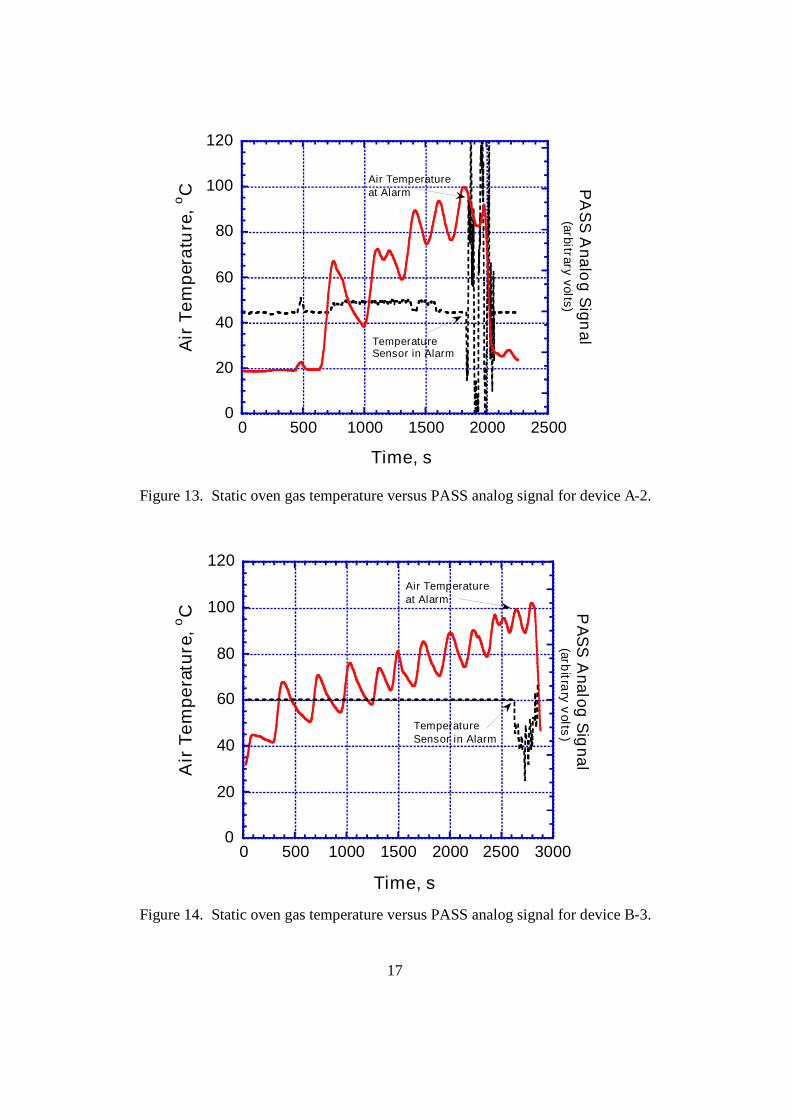
For each of the tests, the response of a PASS device and the temperature were monitoredas a function of time. Five different models from four different manufacturers were included inthis study. The focus of this study was to help develop a standard test protocol for testingthermal sensors, not to specifically evaluate the performance of any single PASS device. Eachmodel of PASS device was assigned an alphabetic letter as an identifier, such A, B, C, D, or E.Since there were multiple devices of each model, the first device was assigned the number B-1and the second B-2, and the third, B-3. Devices A through C included thermal sensors anddevices D and E did not include thermal sensors. The response and temperature data for thelaboratory tests are plotted versus time in Figures 13 - 15, and 16 - 18 for the static oven andflow loop tests, respectively. For the full-scale tests, each PASS device response, temperatureand total heat flux are plotted in Figures 19 - 22.
A. Static Oven TestsAs shown in Figure 13 - 15, the each test was started with the temperature at less than
25 oC (77 oF). Over a period of time, ranging from 25 minutes to 60 minutes, the oventemperature was gradually increased to 120 oC (250 oF). At temperatures above 120 oC (250oF), all the PASS devices began to emit odors that were suggestive of thermal decomposition andsince these PASS devices were also needed for flow tests and full scale tests, the static oven testswere limited to 120 oC (250 oF) exposures. As the temperature inside the oven increased, thePASS device would activate its alarm. For each test, alarm activation caused a change in theanalog signal from the PASS device. The corresponding gas or air temperature at the time ofthis alarm activation was recorded as the alarm temperature. Each alarm activation was con-firmed visually by the test operator who examined the LEDs on the front of each PASS device.
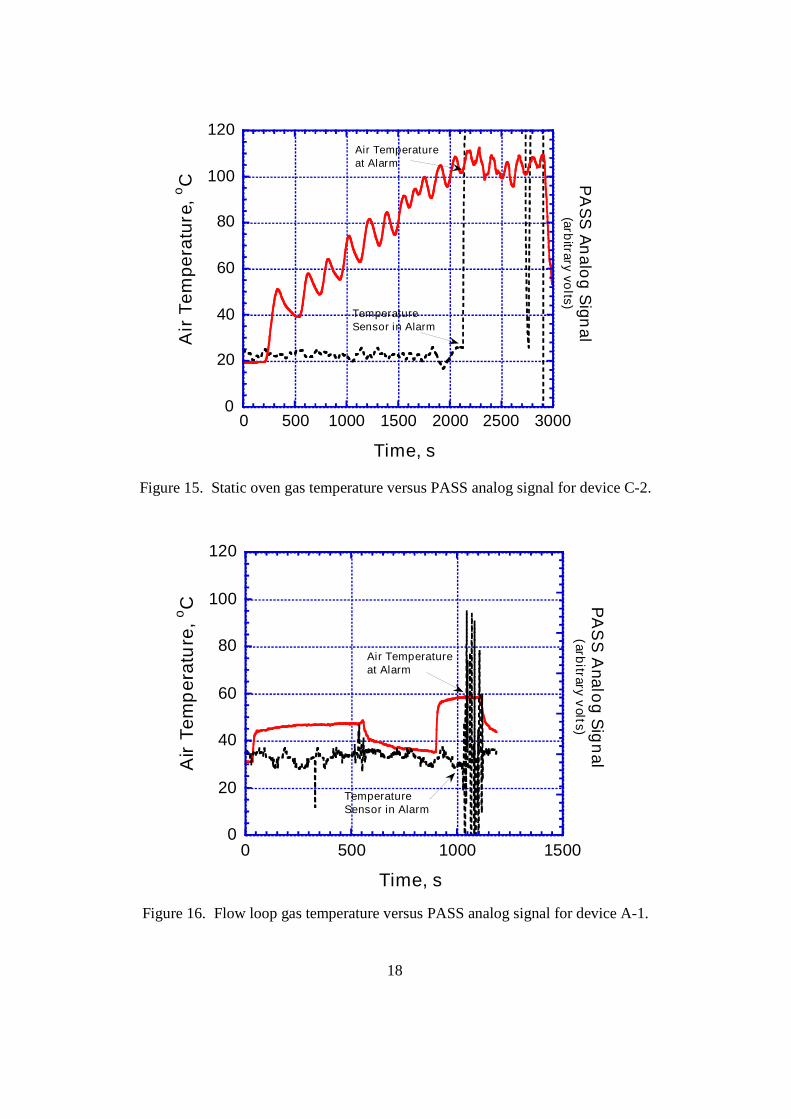
For PASS Device Model A, the average temperature (for each unit) at which the thermalexposure sensor alarmed for three different units was 98 oC (210 oF) to 100 oC (212 oF).Individual test alarm activations occurred between 88 oC (190 oF) and 105 oC (220 oF). Asshown in Figure 13, Model A-2 alarmed at 103 oC (217 oF) at 2170 s into the test. For PASSDevice Model B, theaverage temperature at which the thermal exposure sensor alarmed for three different units was82 oC (190 oF) to 98 oC (208 oF) which is slightly lower temperatures than for Model A.Individual test alarm activations occurred between 81 oC (178 oF) and 98 oC (208 oF). As shownin Figure 14, Model B-3 alarmed at 94 oC (201 oF) at 1880 s into the test. For PASS DeviceModel C, the average temperature at which the thermal exposure sensor alarmed for threedifferent units was 93 oC (199 oF) to 110 oC (230 oF) which is slightly higher temperatures thanfor Model A. Individual test alarm activations occurred between 80 oC (176 oF) and 122 oC(252 oF) . As shown in Figure 15, Model C-2 alarmed at 90 oC (194 oF) at 2630 s into the test.The static oven temperature versus response data for each of the PASS devices is included inTable 1. Overall, the reproducibility between different PASS devices from the samemanufacture was relatively good. The range of alarm temperatures for Model A and Model Bwas 17 oC (31 oF) and for all tests and all units. Model C exhibited a much larger variation intemperatures with a range of 42 oC (76 oF). The greatest variation in alarm temperatures wasalso exhibited by Model C devices.
17
0
20
40
60
80
100
120
0 500 1000 1500 2000 2500 3000
Air
Tem
pera
ture
,oC P
AS
SA
nalogS
ignal
(arbitra
ryv
olts)
Time, s
Air Temperatureat Alarm
TemperatureSensor in Alarm
Figure 13. Static oven gas temperature versus PASS analog signal for device A-2.
Figure 14. Static oven gas temperature versus PASS analog signal for device B-3.
0
20
40
60
80
100
120
0 500 1000 1500 2000 2500
Air
Tem
pera
ture
,oC P
AS
SA
nalog
Sign
al(arbitrary
volts)
Time, s
Air Temperatureat Alarm
TemperatureSensor in Alarm
18
0
20
40
60
80
100
120
0 500 1000 1500
Air
Tem
per
atu
re,o
C PA
SS
Analo
gS
ign
al(arb
itraryv
olts)
Time, s
Air Temperatureat Alarm
TemperatureSensor in Alarm
Figure 15. Static oven gas temperature versus PASS analog signal for device C-2.
Figure 16. Flow loop gas temperature versus PASS analog signal for device A-1.
0
20
40
60
80
100
120
0 500 1000 1500 2000 2500 3000
Air
Tem
pera
ture
,oC P
AS
SA
nalo
gS
ignal
(arbitrary
volts)
Time, s
Air Temperatureat Alarm
TemperatureSensor in Alarm
19
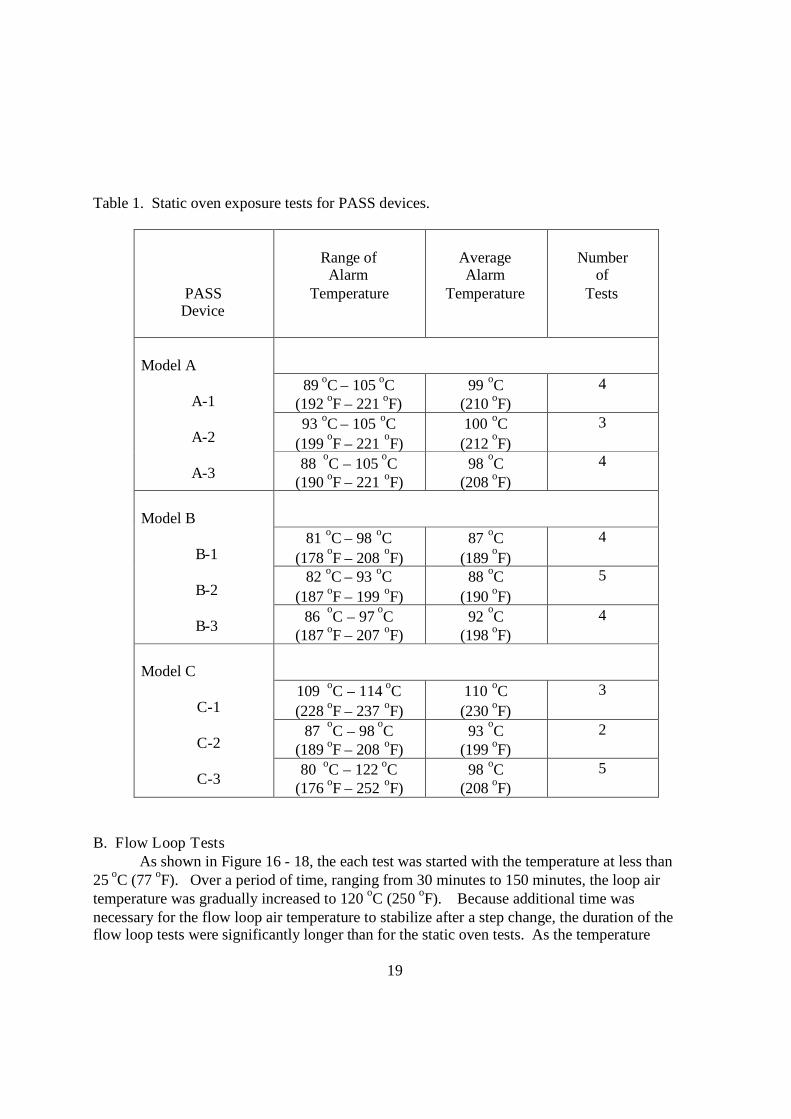
Table 1. Static oven exposure tests for PASS devices.
PASSDevice
Range ofAlarm
Temperature
AverageAlarm
Temperature
Numberof
Tests
89 oC – 105 oC(192 oF – 221 oF)
99 oC(210 oF)
4
93 oC – 105 oC(199 oF – 221 oF)
100 oC(212 oF)
3
Model A
A-1
A-2
A-3 88 oC – 105 oC(190 oF – 221 oF)
98 oC(208 oF)
4
81 oC – 98 oC(178 oF – 208 oF)
87 oC(189 oF)
4
82 oC – 93 oC(187 oF – 199 oF)
88 oC(190 oF)
5
Model B
B-1
B-2
B-3 86 oC – 97 oC(187 oF – 207 oF)
92 oC(198 oF)
4
109 oC – 114 oC(228 oF – 237 oF)
110 oC(230 oF)
3
87 oC – 98 oC(189 oF – 208 oF)
93 oC(199 oF)
2
Model C
C-1
C-2
C-3 80 oC – 122 oC(176 oF – 252 oF)
98 oC(208 oF)
5
B. Flow Loop TestsAs shown in Figure 16 - 18, the each test was started with the temperature at less than
25 oC (77 oF). Over a period of time, ranging from 30 minutes to 150 minutes, the loop airtemperature was gradually increased to 120 oC (250 oF). Because additional time wasnecessary for the flow loop air temperature to stabilize after a step change, the duration of theflow loop tests were significantly longer than for the static oven tests. As the temperature
20
Figure 17. Flow loop gas temperature versus PASS analog signal for device B-4.
Figure 18. Flow loop gas temperature versus PASS analog signal for device C-3.
0
20
40
60
80
100
120
0 1000 2000 3000 4000 5000 6000
Air
Tem
per
atu
re,o
C PA
SS
An
alogS
ignal(arb
itraryvo
lts)
Time, s
Air Temperatureat Alarm
TemperatureSensor in Alarm
0
20
40
60
80
100
120
0 2000 4000 6000 8000 10000
Air
Tem
per
atu
re,
o C PA
SS
Analog
Sig
nal(arbitrary
volts)
Time, s
Air Temperatureat Alarm
TemperatureSensor in Alarm
21
inside the loop increased, the PASS device would activate its alarm. For each test, alarmactivation caused a change in the analog signal from the PASS device. The corresponding gasor air temperature at the time of this alarm activation was recorded as the alarm temperature.Each alarm activation was confirmed visually by the test operator by examining the LEDs on thefront of the device.
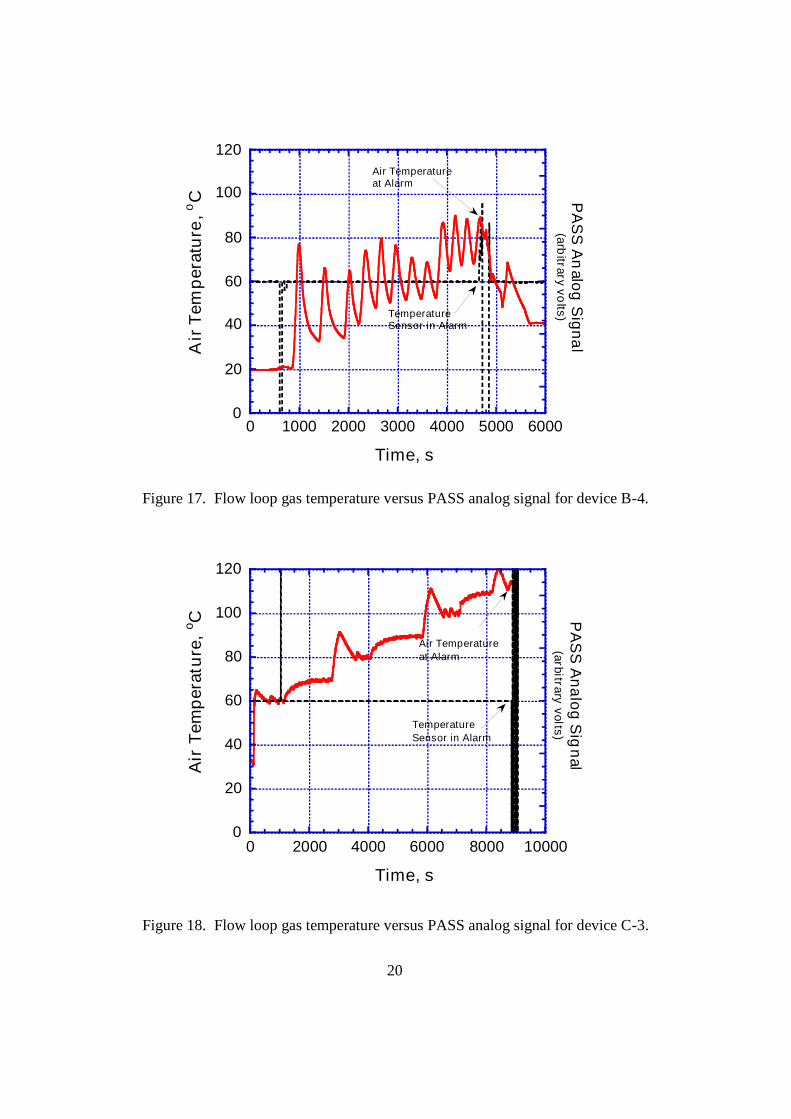
For PASS Device Model A, the average temperature (for each device) at which thethermal exposure sensor alarmed for three different units was 47 oC (117 oF) to 58 oC (136 oF).Individual test alarm activations occurred between 41 oC (106 oF) and 61 oC (142 oF). As shownin Figure 16, Model A-1 alarmed at 59 oC (138 oF) at 1030 s into the test. For PASS DeviceModel B, the average temperature at which the thermal exposure sensor alarmed for twodifferent units was 70 oC (158 oF) to 73 oC (163 oF) which is slightly higher temperatures thanfor Model A. Individual test alarm activations occurred between 55 oC (131 oF) and 90 oC(194 oF). As shown in Figure 17, Model B-4 alarmed at 90 oC (194 oF) at 4650 s into the test.
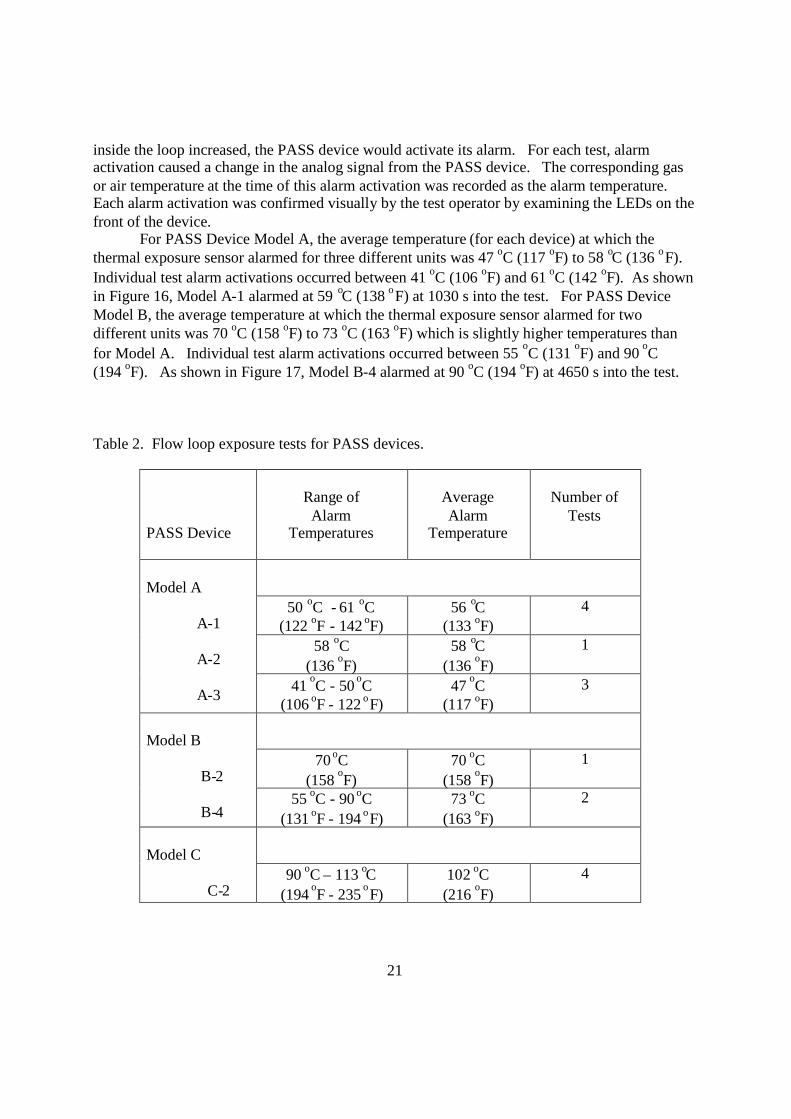
Table 2. Flow loop exposure tests for PASS devices.
PASS Device
Range ofAlarm
Temperatures
AverageAlarm
Temperature
Number ofTests
50 oC - 61 oC(122 oF - 142 oF)
56 oC(133 oF)
4
58 oC(136 oF)
58 oC(136 oF)
1
Model A
A-1
A-2
A-3 41 oC - 50 oC(106 oF - 122 oF)
47 oC(117 oF)
3
70 oC(158 oF)
70 oC(158 oF)
1Model B
B-2
B-455 oC - 90 oC
(131 oF - 194 oF)73 oC
(163 oF)2
Model C
C-290 oC – 113 oC
(194 oF - 235 oF)102 oC
(216 oF)4
22
For PASS Device Model C, the average temperature at which the thermal exposuresensor alarmed for a single unit was 102 oC (216 oF) which is slightly higher temperatures thanfor Model A or B. Individual test alarm activations occurred between 90 oC (194 oF) and 113 oC(235 oF). As shown in Figure 18, Model C-3 alarmed at 113 oC (235 oF) at 8900 s into the test.The flow loop temperature versus response data for each of the PASS devices is included inTable 2. Overall, the reproducibility between different PASS devices from the samemanufacturer was not as good as for the static oven tests. The range of alarm temperatures forModel A was 17 oC (31 oF) for all tests and all units. Model B demonstrated a wider range of35 oC (63 oF) for the flow tests Model C exhibited a somewhat lower variation in temperatureswith a range of 23 oC (41 oF), but all four tests exposed the same PASS device, C-2. Model B-4also exhibited the widest range alarm temperatures.
C. Full-Scale Mannequin ExperimentsData was collected from an instrumented mannequin that was exposed to realistic thermal
conditions during a series of townhouse field burns. The mannequin was positioned between thekitchen and living room (Figure 12). An array of thermocouples was positioned next to themannequin to monitor gas temperatures from floor to ceiling. Two total heat flux gauges werelocated next to the thermocouple array (Figures 8 and 12). One flux gauge was positionedvertically (looking at the ceiling) in order to track the thermal radiation from the upper layer.The other flux gauge was positioned horizontally (looking at the fire) to allow it to monitor thethermal radiation from the initial fuel package. The flux gauge viewing the upper layer wouldmonitor the thermal flux that the shoulders and helmet might experience from the upper layer ashe/she knelt in a room containing an active fire. The flux gauge viewing the fuel package wouldmonitor the thermal flux that the front side of the fire fighter might experience as he/she facesthe fire. For Unit 1and Unit 2, 1 L (0.26 gal) of gasoline was poured on the center of the carpetand ignited. Unit 3 was ignited using crumpled up newspaper in the corner of the sofa.
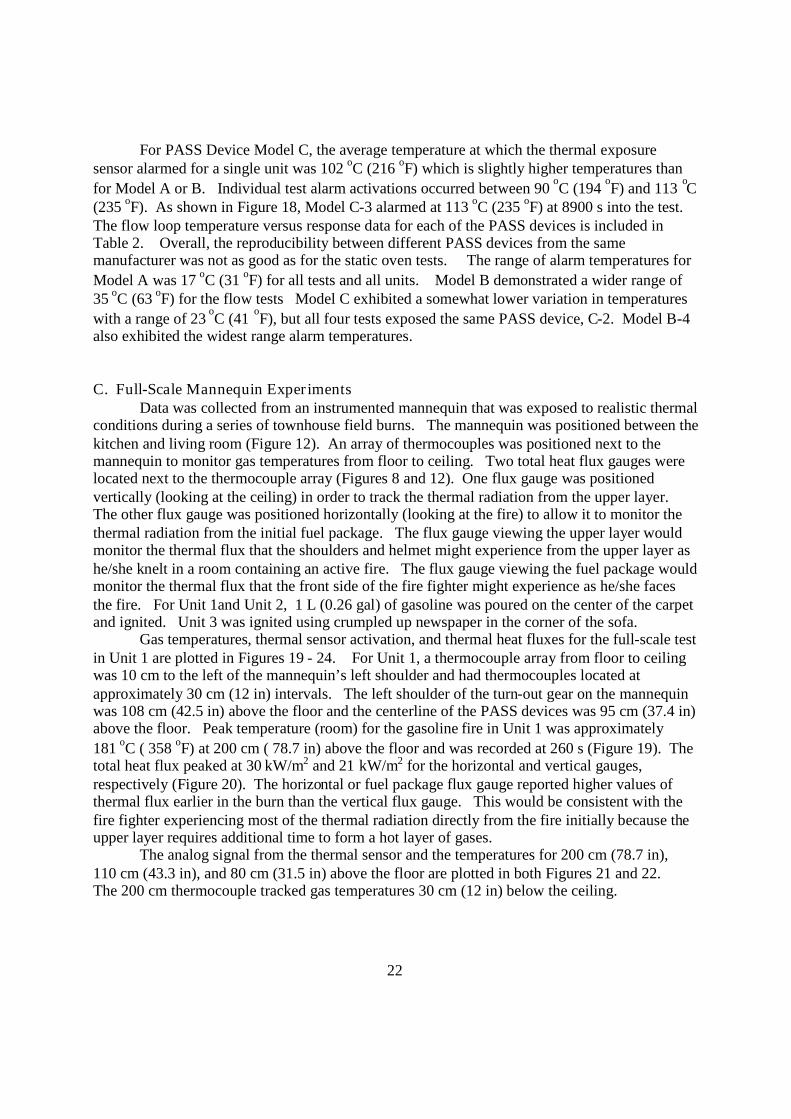
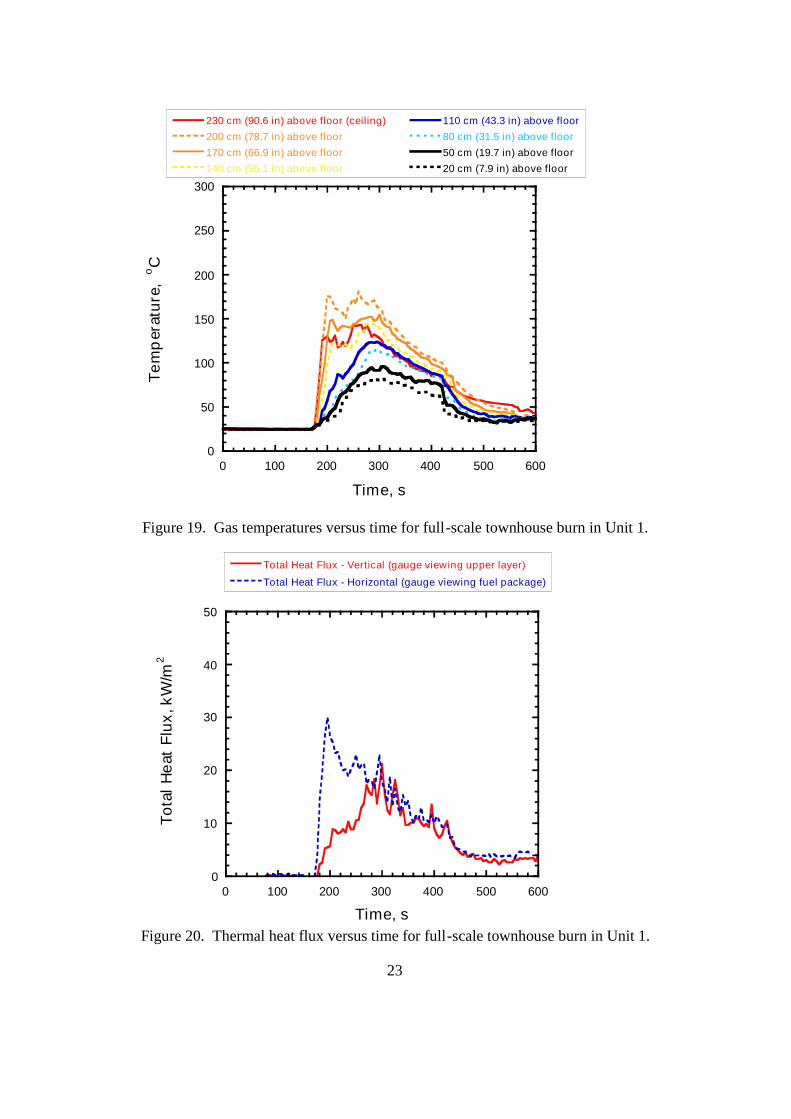
Gas temperatures, thermal sensor activation, and thermal heat fluxes for the full-scale testin Unit 1 are plotted in Figures 19 - 24. For Unit 1, a thermocouple array from floor to ceilingwas 10 cm to the left of the mannequin’s left shoulder and had thermocouples located atapproximately 30 cm (12 in) intervals. The left shoulder of the turn-out gear on the mannequinwas 108 cm (42.5 in) above the floor and the centerline of the PASS devices was 95 cm (37.4 in)above the floor. Peak temperature (room) for the gasoline fire in Unit 1 was approximately181 oC ( 358 oF) at 200 cm ( 78.7 in) above the floor and was recorded at 260 s (Figure 19). Thetotal heat flux peaked at 30 kW/m2 and 21 kW/m2 for the horizontal and vertical gauges,respectively (Figure 20). The horizontal or fuel package flux gauge reported higher values ofthermal flux earlier in the burn than the vertical flux gauge. This would be consistent with thefire fighter experiencing most of the thermal radiation directly from the fire initially because theupper layer requires additional time to form a hot layer of gases.
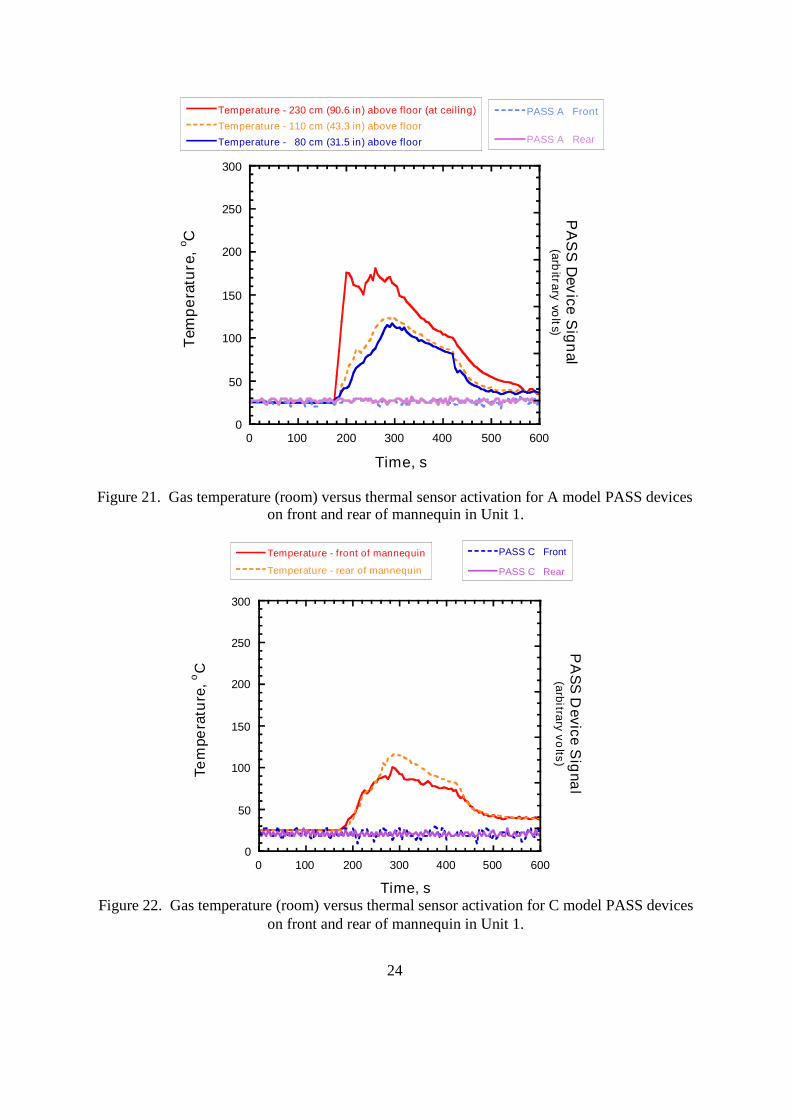
The analog signal from the thermal sensor and the temperatures for 200 cm (78.7 in),110 cm (43.3 in), and 80 cm (31.5 in) above the floor are plotted in both Figures 21 and 22.The 200 cm thermocouple tracked gas temperatures 30 cm (12 in) below the ceiling.
23
Figure 19. Gas temperatures versus time for full-scale townhouse burn in Unit 1.
Figure 20. Thermal heat flux versus time for full-scale townhouse burn in Unit 1.
0
50
100
150
200
250
300
0 100 200 300 400 500 600
Pinal County Test 1
230 cm (90.6 in) above floor (ceiling)
200 cm (78.7 in) above floor
170 cm (66.9 in) above floor
140 cm (55.1 in) above floor
110 cm (43.3 in) above floor
80 cm (31.5 in) above floor
50 cm (19.7 in) above floor
20 cm (7.9 in) above floorTe
mp
erat
ure,
oC
Time, s
0
10
20
30
40
50
0 100 200 300 400 500 600
Total Heat Flux - Vertical (gauge viewing upper layer)
Total Heat Flux - Horizontal (gauge viewing fuel package)
Tota
lHea
tFl
ux,k
W/m
2
Time, s
24
Figure 21. Gas temperature (room) versus thermal sensor activation for A model PASS deviceson front and rear of mannequin in Unit 1.
Figure 22. Gas temperature (room) versus thermal sensor activation for C model PASS deviceson front and rear of mannequin in Unit 1.
0
50
100
150
200
250
300
0 100 200 300 400 500 600
Temperature - 230 cm (90.6 in) above floor (at ceiling)
Temperature - 110 cm (43.3 in) above floor
Temperature - 80 cm (31.5 in) above floor
PASS A Front
PASS A Rear
Tem
pe
ratu
re,
o C
PA
SS
Dev
iceS
ign
al(arb
itraryvo
lts)
Time, s
0
50
100
150
200
250
300
0 100 200 300 400 500 600
Temperature - front of mannequin
Temperature - rear of mannequin
PASS C Front
PASS C Rear
Tem
pera
ture
,oC
PA
SS
Device
Sig
nal
(arbitraryvo
lts)
Time, s
25
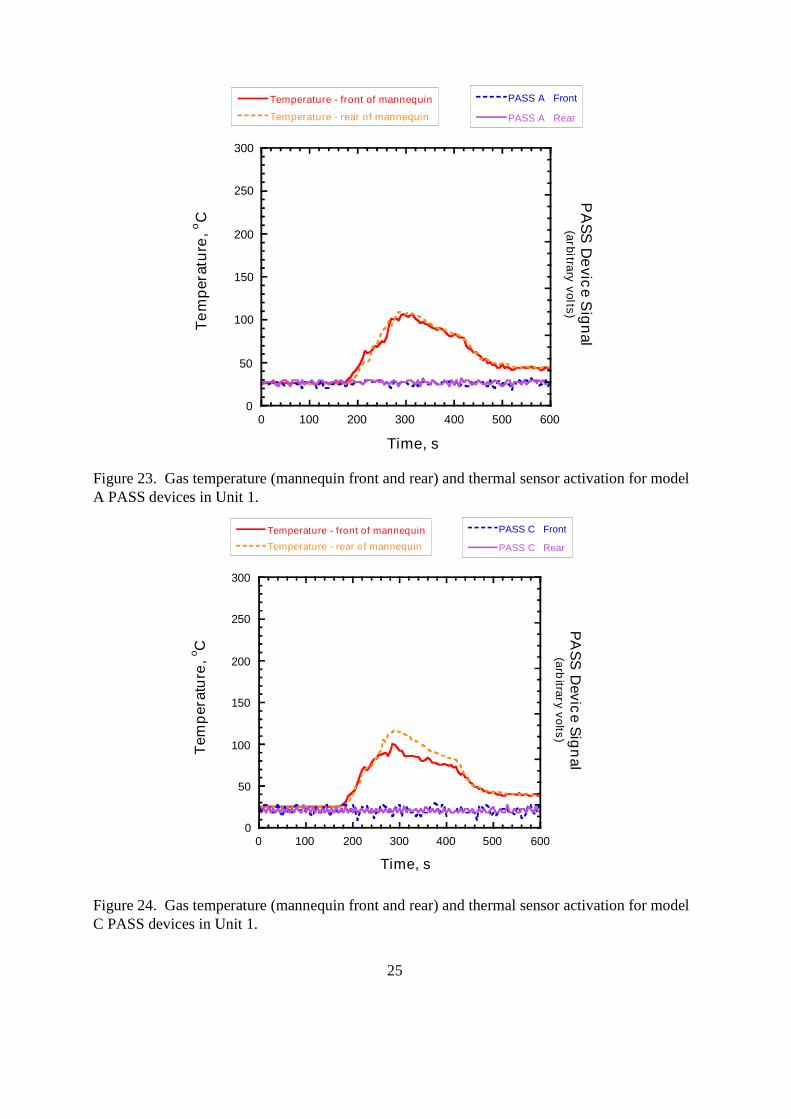
Figure 23. Gas temperature (mannequin front and rear) and thermal sensor activation for modelA PASS devices in Unit 1.
Figure 24. Gas temperature (mannequin front and rear) and thermal sensor activation for modelC PASS devices in Unit 1.
0
50
100
150
200
250
300
0 100 200 300 400 500 600
Temperature - front of mannequin
Temperature - rear of mannequin
PASS A Front
PASS A Rear
Te
mp
erat
ure
,oC
PA
SS
De
vice
Sig
nal
(arbitraryvolts)
Time, s
0
50
100
150
200
250
300
0 100 200 300 400 500 600
Temperature - front of mannequin
Temperature - rear of mannequin
PASS C Front
PASS C Rear
Tem
per
atu
re,o C
PA
SS
Devic
eS
ign
al(arb
itraryvolts)
Time, s
26
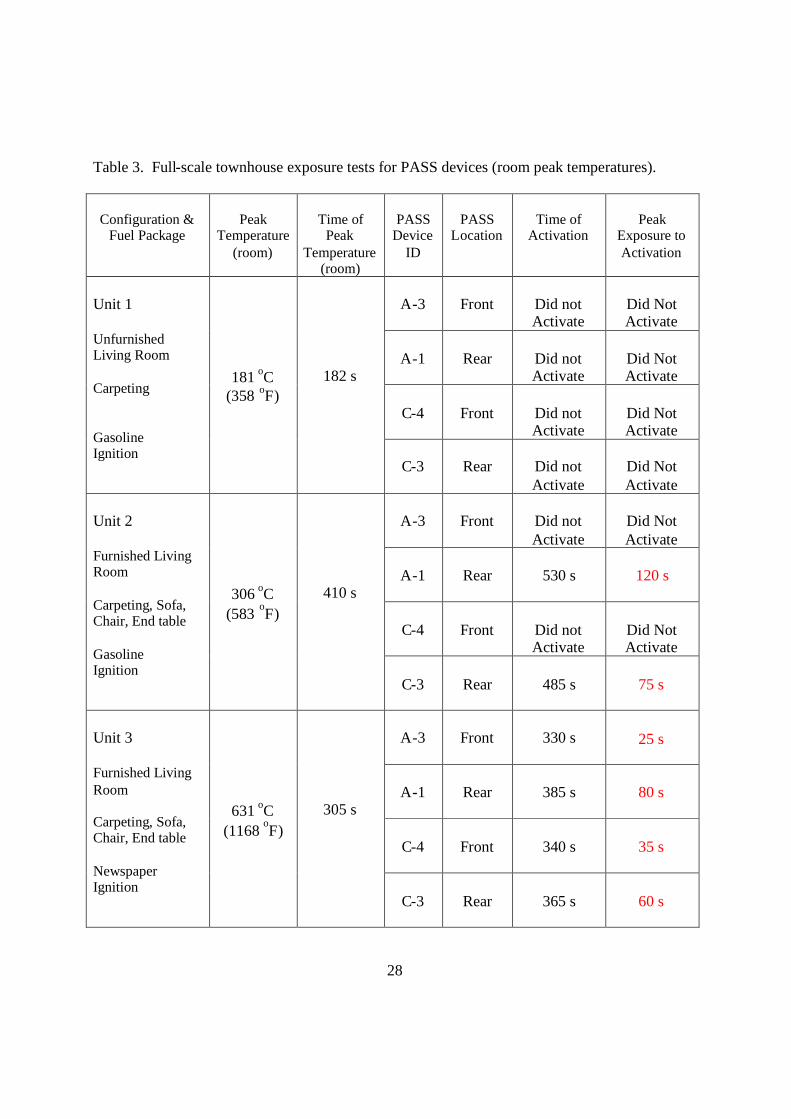
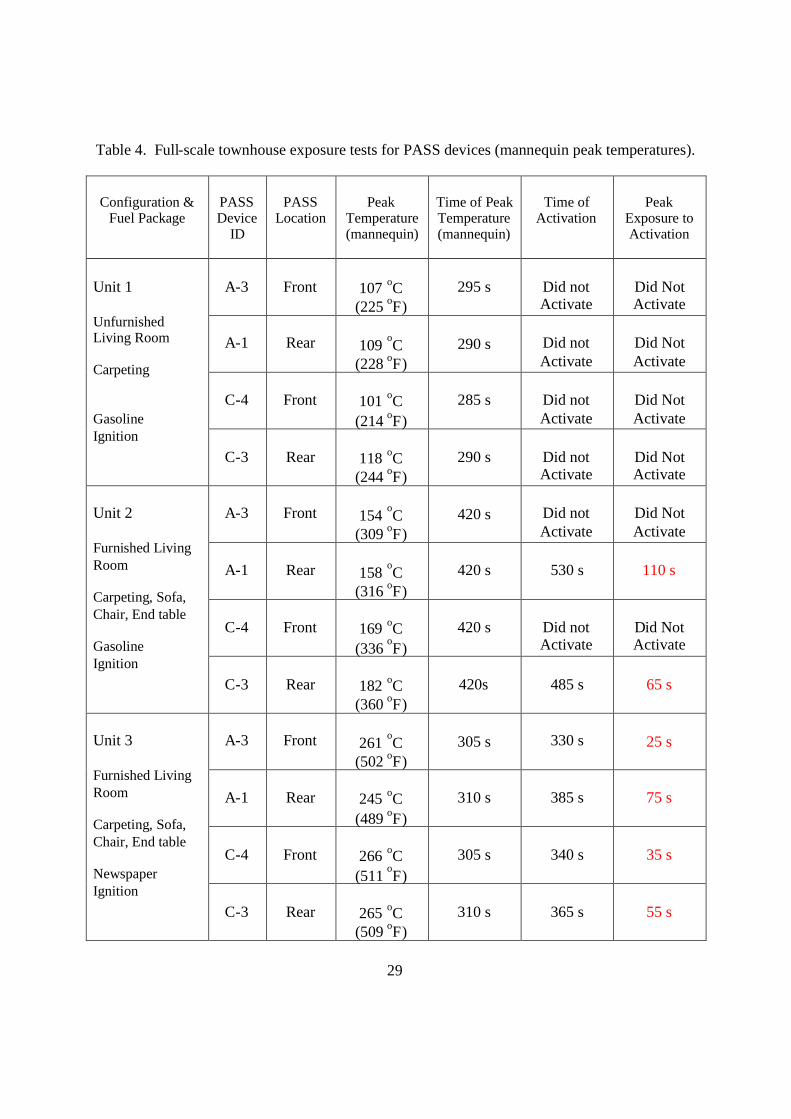
The 110 cm thermocouple was 2 cm (1 in) above the left shoulder and the thermocouple at 80 cmwas 15 cm (6 in) below the PASS devices. PASS devices were positioned on the front and rearof the mannequin. The thermal environment of this burn did not cause any of the four PASSdevices, front or rear to activate during this test (Figure 21 and 22). The peak temperature(room), time of peak at which the peak temperature (room) occurred, and the alarm activationtime are tabulated in Table 3. In a similar manner the analog signal from the thermal sensor andthe temperatures for front and rear of the mannequin near each PASS device are plotted in bothFigures 23 and 24. The peak temperature (mannequin front and rear), time of peak at which thepeak temperature (front and rear) occurred, and the alarm activation time are tabulated inTable 4.
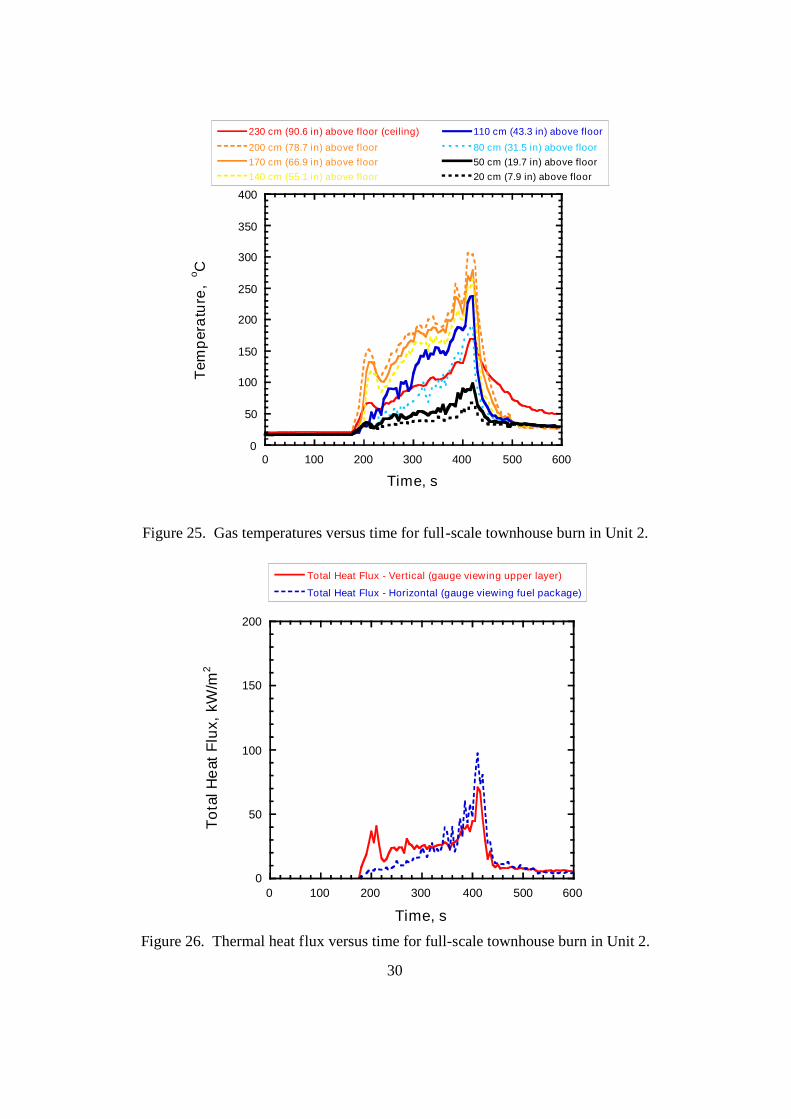
Gas temperatures, thermal sensor activation, and thermal heat fluxes for the full-scale testin Unit 2 are plotted in Figures 25 - 30. For Unit 2, a thermocouple array from floor to ceilingwas 10 cm to the left of the mannequin’s left shoulder and had thermocouples located atapproximately 30 cm (12 in) intervals. The left shoulder of the turn-out gear on the mannequinwas 108 cm (42.5 in) above the floor and the centerline of the PASS devices was 95 cm (37.4 in)above the floor. Peak temperature (room) for the fire in Unit 2 was 306 oC ( 583 oF) at 200 cm(78.7 in) above the floor and was recorded at approximately 410 s (Figure 25). The total heatflux peaked at 97 kW/m2 and 70 kW/m2 for the horizontal and vertical gauges, respectively(Figure 26). The peak heat flux was much greater in Unit 2 than for Unit 1, however, the peak inUnit 2 is observed later as the additional fuel, including the sofa and chair, become involved inthe fire. Early in the burn at about 210 s, the vertical heat flux reaches a level of 40 kW/m2
which is similar in magnitude to the peak heat flux in Unit 1. This would be consistent witheach of the fires in Unit 1 and 2 being initiated with 1 L (0.26 gal) of gasoline. However, itshould be noted that in Unit 1, the horizontal heat flux reached about 30 kW/m2 while in Unit 2 itwas the vertical component of heat flux which reached 40 kW/m2.
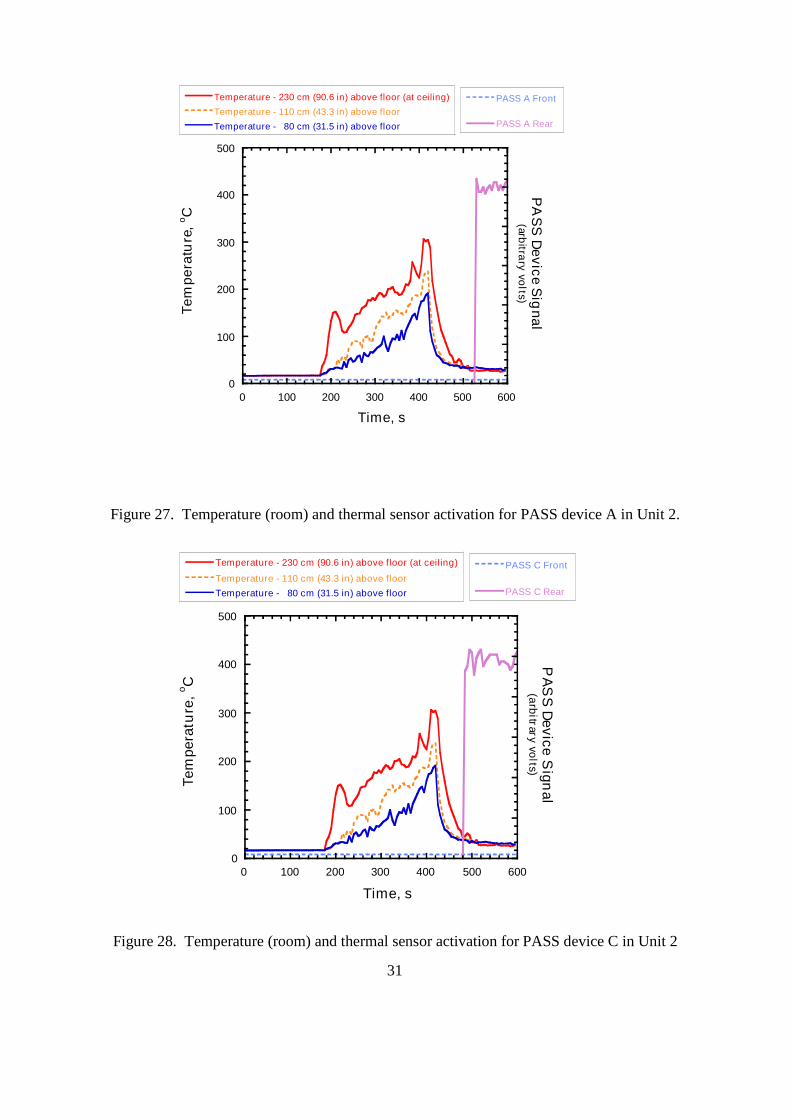
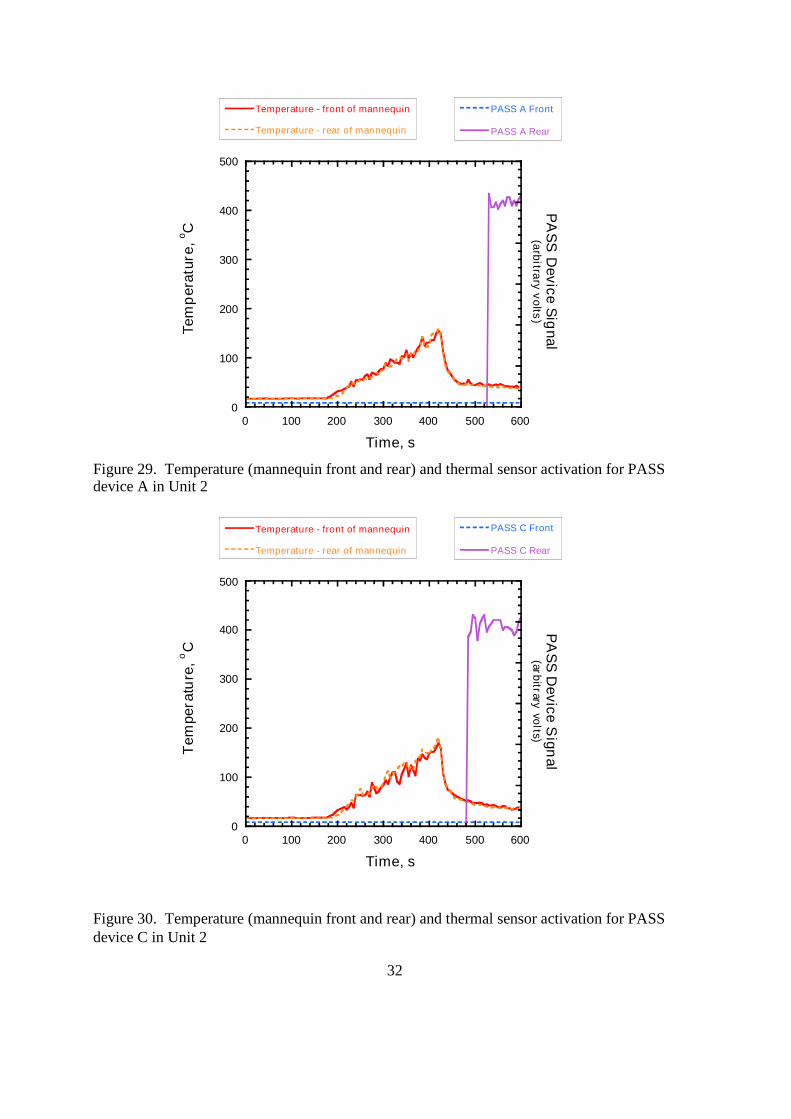
The analog signal from the thermal sensor and the temperatures for 200 cm (78.7 in),110 cm (43.3 in), and 80 cm (31.5 in) above the floor are plotted in both Figures 27 and 28.The 200 cm thermocouple tracked gas temperatures 30 cm (12 in) below the ceiling. The110 cm thermocouple was 2 cm (1 in) above the left shoulder and the thermocouple at 80 cm was15 cm (6 in) below the PASS devices. PASS devices were positioned on the front and rear ofthe mannequin. The peak temperature (room) of 306 oC (583 oF) was reached at 410 s and onlythe rear mounted PASS devices activated during the fire in Unit 2. Model A-1 activated at 530 s(Figure 27) and Model C-3 alarmed at 485 s (Figure 28). The time between peak exposure(room) and thermal sensor activation was 120 s and 75 s for A-1 and C-3, respectively. In asimilar manner the analog signal from the thermal sensor and the temperatures for front and rearof the mannequin near each PASS device are plotted in both Figures 29 and 30. The peaktemperature (mannequin front and rear), time of peak at which the peak temperature (front andrear) occurred, and the alarm activation time are tabulated in Table 4.
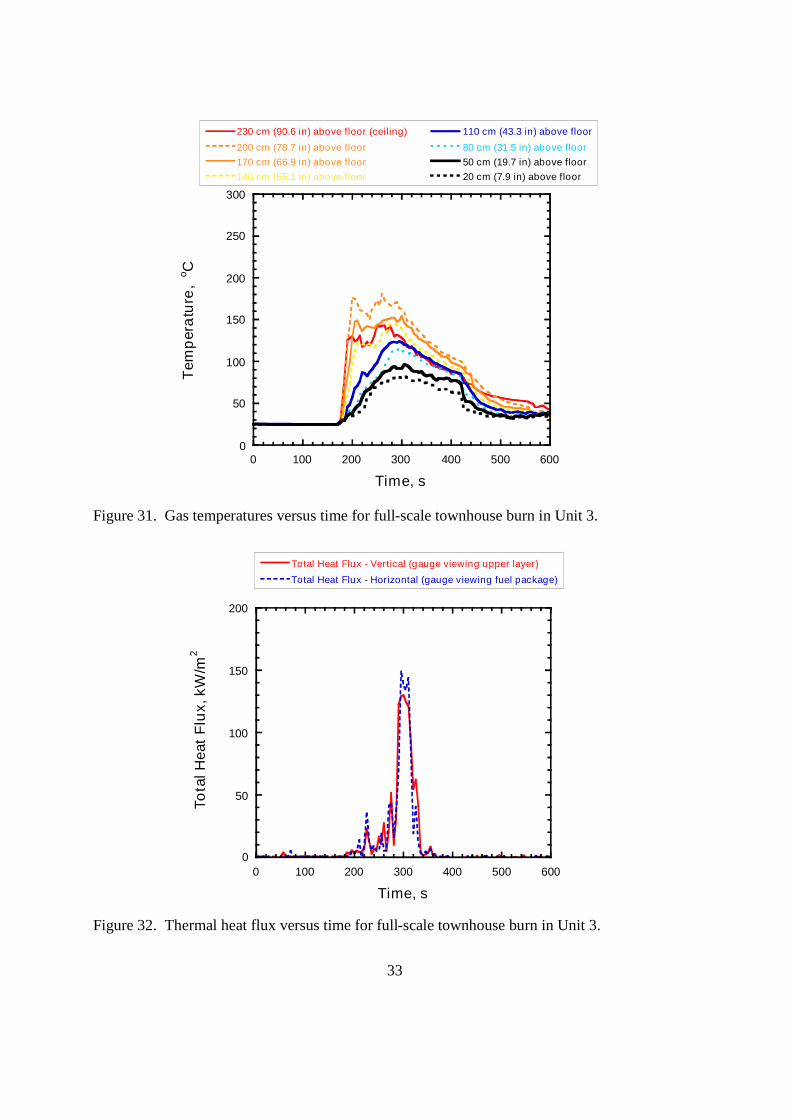
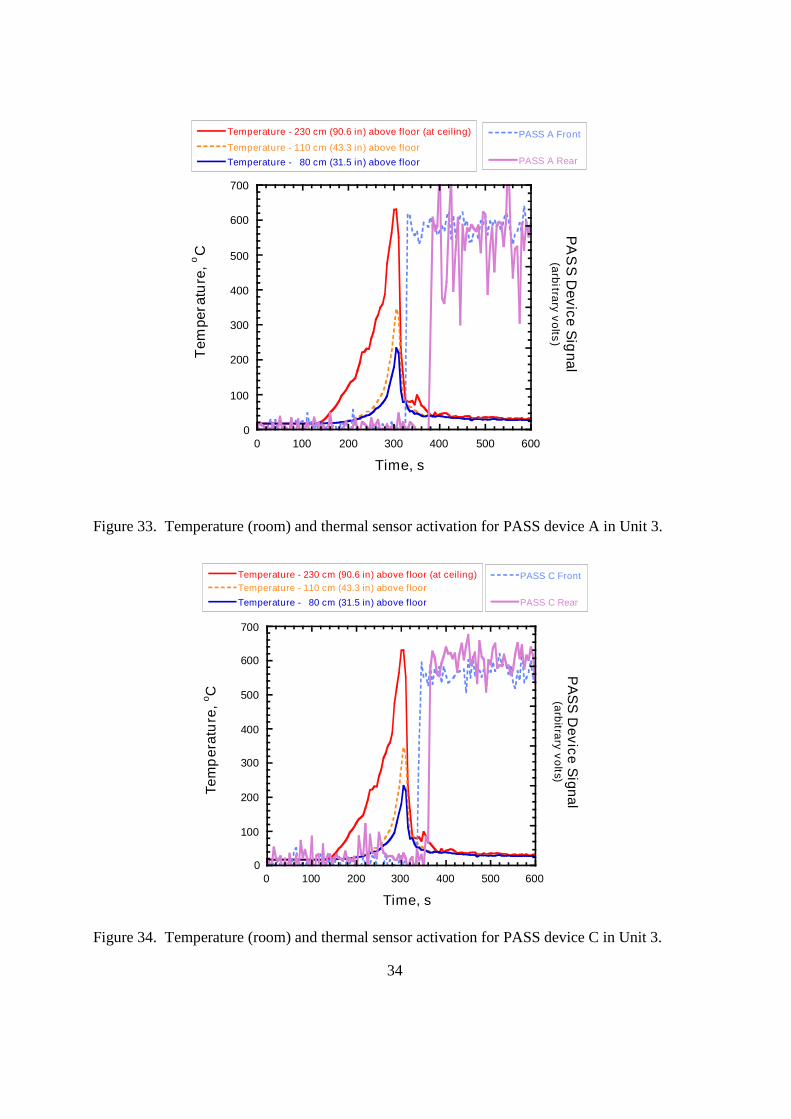
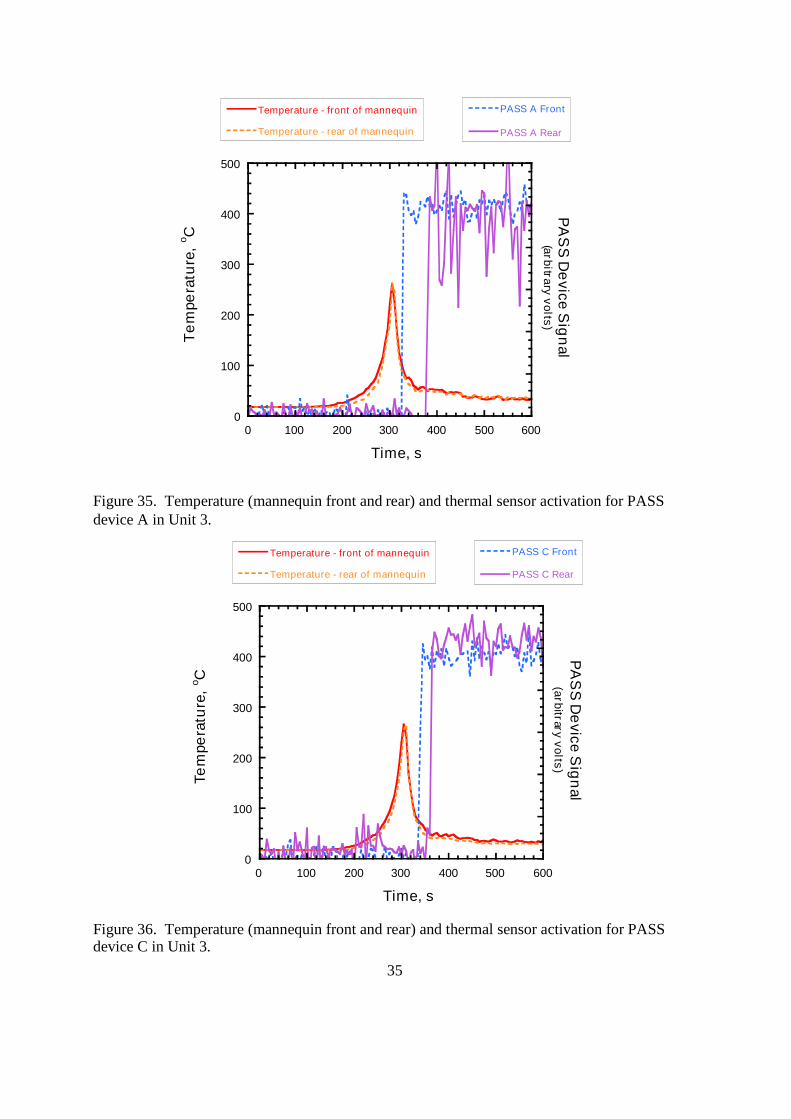
Gas temperatures, thermal sensor activation, and thermal heat fluxes for the full-scale testin Unit 3 are plotted in Figures 31 - 36. For Unit 3, a thermocouple array from floor to ceilingwas 10 cm to the left of the mannequin’s left shoulder and had thermocouples located atapproximately 30 cm (12 in) intervals. The left shoulder of the turn-out gear on the mannequinwas 108 cm (42.5 in) above the floor and the centerline of the PASS devices was 95 cm (37.4 in)above the floor. Peak temperature for the fire in Unit 3 was 631 oC (1168 oF) at 200 cm(78.7 in) above the floor and was recorded at approximately 305 s (Figure 31). The total heat
27
flux peaked at 150 kW/m2 and 130 kW/m2 for the horizontal and vertical gauges, respectively(Figure 32). The peak heat flux was much greater in Unit 3 than for Unit 1 or 2. The early rapidrise in heat flux that was observed in Unit 1 and 2 is missing in Unit 3, but Unit 3 was initiatedby igniting a crumpled newspaper, not the gasoline as in Unit 1 and 2.
The analog signal from the thermal sensor and the temperatures for 200 cm (78.7 in),110 cm (43.3 in), and 80 cm (31.5 in) above the floor are plotted in both Figures 33 and 34.The 200 cm thermocouple tracked gas temperatures 30 cm (12 in) below the ceiling. The110 cm thermocouple was 2 cm (1 in) above the left shoulder and the thermocouple at 80 cm was15 cm (6 in) below the PASS devices. PASS devices were positioned on the front and rear ofthe mannequin. The peak temperature (room) of 631 oC (1168 oF) was reached at 305 s and thethermal sensors for all four of the PASS devices activated. Two Model A PASS devices weremounted on the mannequin, A-3 on the front and A-1 on the rear. The thermal sensors activatedat 330 s and 385 s for the front and rear, respectively (Figure 33). Two Model C PASS deviceswere also mounted on the mannequin, one on the front and one on the rear. While the frontmounted C-4 PASS activated at 340 s, the C-3 device on the rear of the mannequin activated at365 s (Figure 34). The times between peak exposure (room) and thermal sensor activation forthe front of the mannequin were 25 s and 35 s for A-3 and C-4, respectively. The times betweenpeak exposure (room) to activation for the rear of the mannequin were significantly longer at80 s and 60 s for A-1 and C-3, respectively. In a similar manner the analog signal from thethermal sensor and the temperatures for front and rear of the mannequin near each PASS deviceare plotted in both Figures 35 and 36. The peak temperature (mannequin front and rear), timeof peak at which the peak temperature (front and rear) occurred, and the alarm activation timeare tabulated in Table 4.
D. Uncertainty AnalysisThere are different components of uncertainty in the temperatures, total heat flux, and
time to activate data reported here. Uncertainties are grouped into two categories according tothe method used to estimate them. Type A uncertainties are evaluated by statistical methods, andType B are evaluated by other means [9]. Type B analysis of systematic uncertainties involvesestimating the upper ( + a) and lower ( - a) limits for the quantity in question such that theprobability that the value would be in the interval ( ± a) is essentially 100 percent. Afterestimating uncertainties by either Type A or B analysis, the uncertainties are combined inquadrature to yield the combined standard uncertainty. Multiplying the combined standarduncertainty by a coverage factor of two results in the total expanded uncertainty that correspondsto a 95 percent confidence interval (2F).
Components of uncertainty are tabulated in Tables 5 and 6. Some of these components,such as the zero and calibration elements, are derived from instrument specifications. Othercomponents, such as soot deposition or radiative cooling/heating include past experience withthermophoretic deposition on cool surfaces and thermocouples in high temperature fuel richenvironments. The uncertainty in the air temperature measurements includes radiative cooling inthe each of the tests series, but also includes radiative heating for thermocouple located in thelower layer of the full-scale tests. This resulted in an estimate of -23 % to +12 % totalexpanded uncertainty for the lab tests and a slightly larger estimate of –32 % to +15 % for the
28
Table 3. Full-scale townhouse exposure tests for PASS devices (room peak temperatures).
Configuration &Fuel Package
PeakTemperature
(room)
Time ofPeak
Temperature(room)
PASSDevice
ID
PASSLocation
Time ofActivation
PeakExposure toActivation
A-3 Front Did notActivate
Did NotActivate
A-1 Rear Did notActivate
Did NotActivate
C-4 Front Did notActivate
Did NotActivate
Unit 1
UnfurnishedLiving Room
Carpeting
GasolineIgnition
181 oC(358 oF)
182 s
C-3 Rear Did notActivate
Did NotActivate
A-3 Front Did notActivate
Did NotActivate
A-1 Rear 530 s 120 s
C-4 Front Did notActivate
Did NotActivate
Unit 2
Furnished LivingRoom
Carpeting, Sofa,Chair, End table
GasolineIgnition
306 oC(583 oF)
410 s
C-3 Rear 485 s 75 s
A-3 Front 330 s 25 s
A-1 Rear 385 s 80 s
C-4 Front 340 s 35 s
Unit 3
Furnished LivingRoom
Carpeting, Sofa,Chair, End table
NewspaperIgnition
631 oC(1168 oF)
305 s
C-3 Rear 365 s 60 s
29
Table 4. Full-scale townhouse exposure tests for PASS devices (mannequin peak temperatures).
Configuration &Fuel Package
PASSDevice
ID
PASSLocation
PeakTemperature(mannequin)
Time of PeakTemperature(mannequin)
Time ofActivation
PeakExposure toActivation
A-3 Front 107 oC(225 oF)
295 s Did notActivate
Did NotActivate
A-1 Rear 109 oC(228 oF)
290 s Did notActivate
Did NotActivate
C-4 Front 101 oC(214 oF)
285 s Did notActivate
Did NotActivate
Unit 1
UnfurnishedLiving Room
Carpeting
GasolineIgnition
C-3 Rear 118 oC(244 oF)
290 s Did notActivate
Did NotActivate
A-3 Front 154 oC(309 oF)
420 s Did notActivate
Did NotActivate
A-1 Rear 158 oC(316 oF)
420 s 530 s 110 s
C-4 Front 169 oC(336 oF)
420 s Did notActivate
Did NotActivate
Unit 2
Furnished LivingRoom
Carpeting, Sofa,Chair, End table
GasolineIgnition
C-3 Rear 182 oC(360 oF)
420s 485 s 65 s
A-3 Front 261 oC(502 oF)
305 s 330 s 25 s
A-1 Rear 245 oC(489 oF)
310 s 385 s 75 s
C-4 Front 266 oC(511 oF)
305 s 340 s 35 s
Unit 3
Furnished LivingRoom
Carpeting, Sofa,Chair, End table
NewspaperIgnition
C-3 Rear 265 oC(509 oF)
310 s 365 s 55 s
30
Figure 25. Gas temperatures versus time for full-scale townhouse burn in Unit 2.
Figure 26. Thermal heat flux versus time for full-scale townhouse burn in Unit 2.
0
50
100
150
200
250
300
350
400
0 100 200 300 400 500 600
Pinal County Test 1
230 cm (90.6 in) above floor (ceiling)
200 cm (78.7 in) above floor170 cm (66.9 in) above floor140 cm (55.1 in) above floor
110 cm (43.3 in) above floor
80 cm (31.5 in) above floor50 cm (19.7 in) above floor20 cm (7.9 in) above floor
Tem
per
atu
re,
o C
Time, s
0
50
100
150
200
0 100 200 300 400 500 600
Total Heat Flux - Vertical (gauge viewing upper layer)
Total Heat Flux - Horizontal (gauge viewing fuel package)
To
talH
eat
Flu
x,kW
/m2
Time, s
31
Figure 27. Temperature (room) and thermal sensor activation for PASS device A in Unit 2.
Figure 28. Temperature (room) and thermal sensor activation for PASS device C in Unit 2
0
100
200
300
400
500
0 100 200 300 400 500 600
Temperature - 230 cm (90.6 in) above floor (at ceiling)
Temperature - 110 cm (43.3 in) above floor
Temperature - 80 cm (31.5 in) above floor
PASS A Front
PASS A Rear
Tem
pera
ture
,o C
PA
SS
Device
Sig
nal(arb
itrary
volts)
Time, s
0
100
200
300
400
500
0 100 200 300 400 500 600
Temperature - 230 cm (90.6 in) above floor (at ceiling)
Temperature - 110 cm (43.3 in) above floor
Temperature - 80 cm (31.5 in) above floor
PASS C Front
PASS C Rear
Tem
pera
ture
,o C
PA
SS
Device
Sign
al(arbitrary
volts)
Time, s
32
Figure 29. Temperature (mannequin front and rear) and thermal sensor activation for PASSdevice A in Unit 2
Figure 30. Temperature (mannequin front and rear) and thermal sensor activation for PASSdevice C in Unit 2
0
100
200
300
400
500
0 100 200 300 400 500 600
Temperature - front of mannequin
Temperature - rear of mannequin
PASS A Front
PASS A Rear
Tem
per
atur
e,o C
PA
SS
Device
Sig
nal(arbitrary
volts)
Time, s
0
100
200
300
400
500
0 100 200 300 400 500 600
Temperature - front of mannequin
Temperature - rear of mannequin
PASS C Front
PASS C Rear
Tem
pera
ture
,oC
PA
SS
Device
Sign
al(arbitrary
volts)
Time, s
33
Figure 31. Gas temperatures versus time for full-scale townhouse burn in Unit 3.
Figure 32. Thermal heat flux versus time for full-scale townhouse burn in Unit 3.
0
50
100
150
200
250
300
0 100 200 300 400 500 600
Pinal County Test 1
230 cm (90.6 in) above floor (ceiling)
200 cm (78.7 in) above floor170 cm (66.9 in) above floor140 cm (55.1 in) above floor
110 cm (43.3 in) above floor
80 cm (31.5 in) above floor50 cm (19.7 in) above floor20 cm (7.9 in) above floor
Tem
per
atu
re,
o C
Time, s
0
50
100
150
200
0 100 200 300 400 500 600
Total Heat Flux - Vertical (gauge viewing upper layer)
Total Heat Flux - Horizontal (gauge viewing fuel package)
Tota
lHea
tF
lux,
kW/m
2
Time, s
34
Figure 33. Temperature (room) and thermal sensor activation for PASS device A in Unit 3.
Figure 34. Temperature (room) and thermal sensor activation for PASS device C in Unit 3.
0
100
200
300
400
500
600
700
0 100 200 300 400 500 600
Temperature - 230 cm (90.6 in) above floor (at ceiling)
Temperature - 110 cm (43.3 in) above floor
Temperature - 80 cm (31.5 in) above floor
PASS A Front
PASS A Rear
Tem
pera
ture
,oC
PA
SS
Device
Sig
nal(arbitrary
volts)
Time, s
0
100
200
300
400
500
600
700
0 100 200 300 400 500 600
Temperature - 230 cm (90.6 in) above floor (at ceiling)Temperature - 110 cm (43.3 in) above floor
Temperature - 80 cm (31.5 in) above floor
PASS C Front
PASS C Rear
Tem
per
atu
re,o C
PA
SS
Device
Signal
(arb
itrary
vo
lts)
Time, s
35
Figure 35. Temperature (mannequin front and rear) and thermal sensor activation for PASSdevice A in Unit 3.
Figure 36. Temperature (mannequin front and rear) and thermal sensor activation for PASSdevice C in Unit 3.
0
100
200
300
400
500
0 100 200 300 400 500 600
Temperature - front of mannequin
Temperature - rear of mannequin
PASS A Front
PASS A Rear
Te
mpe
ratu
re,
o C
PA
SS
De
viceS
ign
al(arbitrary
volts)
Time, s
0
100
200
300
400
500
0 100 200 300 400 500 600
Temperature - front of mannequin
Temperature - rear of mannequin
PASS C Front
PASS C Rear
Tem
pera
ture
,o C
PA
SS
De
viceS
ign
al(arbitrary
volts)
Time, s
36
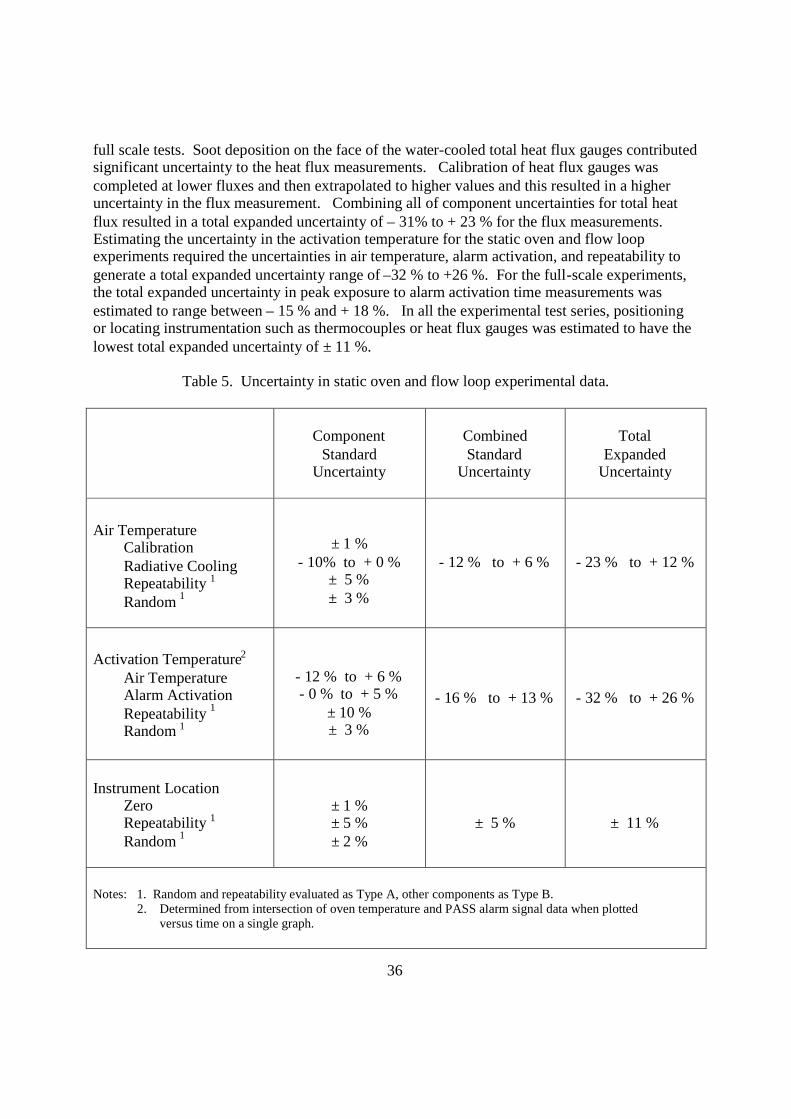
full scale tests. Soot deposition on the face of the water-cooled total heat flux gauges contributedsignificant uncertainty to the heat flux measurements. Calibration of heat flux gauges wascompleted at lower fluxes and then extrapolated to higher values and this resulted in a higheruncertainty in the flux measurement. Combining all of component uncertainties for total heatflux resulted in a total expanded uncertainty of – 31% to + 23 % for the flux measurements.Estimating the uncertainty in the activation temperature for the static oven and flow loopexperiments required the uncertainties in air temperature, alarm activation, and repeatability togenerate a total expanded uncertainty range of –32 % to +26 %. For the full-scale experiments,the total expanded uncertainty in peak exposure to alarm activation time measurements wasestimated to range between – 15 % and + 18 %. In all the experimental test series, positioningor locating instrumentation such as thermocouples or heat flux gauges was estimated to have thelowest total expanded uncertainty of ± 11 %.
Table 5. Uncertainty in static oven and flow loop experimental data.
ComponentStandard
Uncertainty
CombinedStandard
Uncertainty
TotalExpanded
Uncertainty
Air TemperatureCalibrationRadiative CoolingRepeatability 1
Random 1
± 1 %- 10% to + 0 %
± 5 %± 3 %
- 12 % to + 6 % - 23 % to + 12 %
Activation Temperature2
Air TemperatureAlarm ActivationRepeatability 1
Random 1
- 12 % to + 6 %- 0 % to + 5 %
± 10 %± 3 %
- 16 % to + 13 % - 32 % to + 26 %
Instrument LocationZeroRepeatability 1
Random 1
± 1 %± 5 %± 2 %
± 5 % ± 11 %
Notes: 1. Random and repeatability evaluated as Type A, other components as Type B.2. Determined from intersection of oven temperature and PASS alarm signal data when plotted
versus time on a single graph.
37
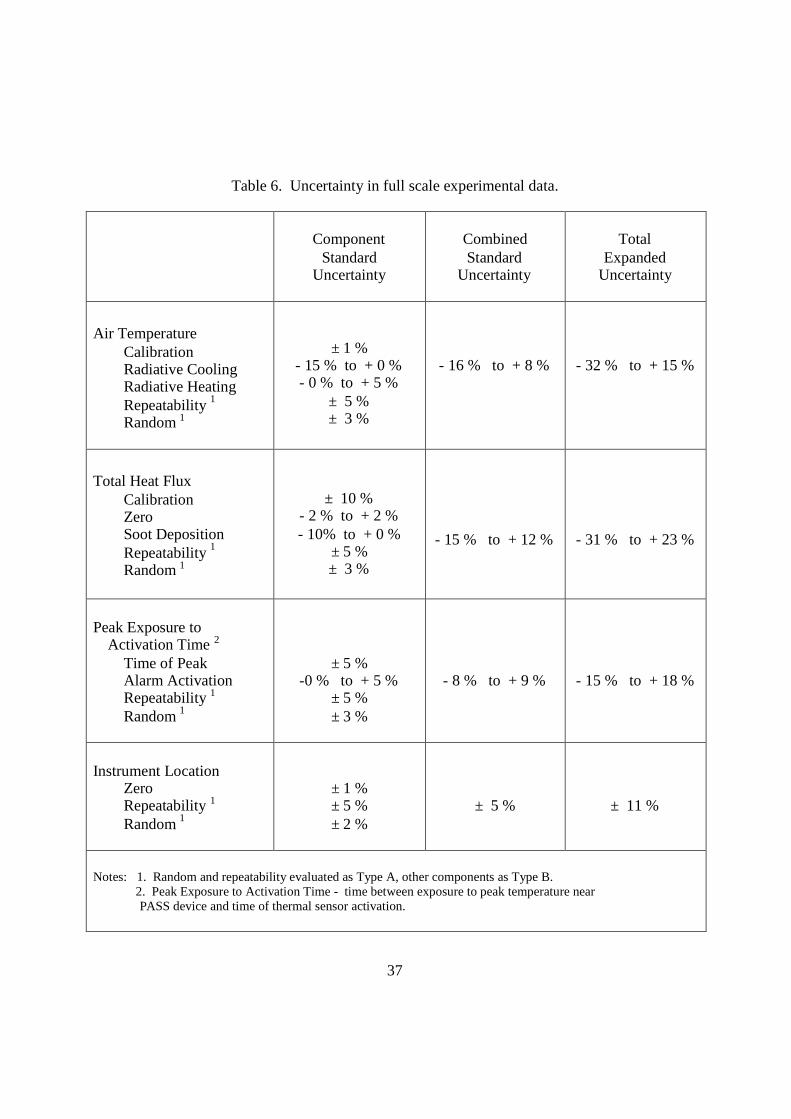
Table 6. Uncertainty in full scale experimental data.
ComponentStandard
Uncertainty
CombinedStandard
Uncertainty
TotalExpanded
Uncertainty
Air TemperatureCalibrationRadiative CoolingRadiative HeatingRepeatability 1
Random 1
± 1 %- 15 % to + 0 %- 0 % to + 5 %
± 5 %± 3 %
- 16 % to + 8 % - 32 % to + 15 %
Total Heat FluxCalibrationZeroSoot DepositionRepeatability 1
Random 1
± 10 %- 2 % to + 2 %- 10% to + 0 %
± 5 %± 3 %
- 15 % to + 12 % - 31 % to + 23 %
Peak Exposure toActivation Time 2
Time of PeakAlarm ActivationRepeatability 1
Random 1
± 5 %-0 % to + 5 %
± 5 %± 3 %
- 8 % to + 9 % - 15 % to + 18 %
Instrument LocationZeroRepeatability 1
Random 1
± 1 %± 5 %± 2 %
± 5 % ± 11 %
Notes: 1. Random and repeatability evaluated as Type A, other components as Type B.2. Peak Exposure to Activation Time - time between exposure to peak temperature nearPASS device and time of thermal sensor activation.
38
V. Discussion
A. Thermal Exposure Sensor ActivationThis study has examined the performance of thermal exposure sensor equipped PASS
devices to the different thermal environments that fire fighters experience on the fire ground.The static oven tests were designed to simulate fire fighter activity is a layer of stagnant hotgases. The flow loop exposures were intended to reproduce a fire fighter’s motion through hotgases or the movement of hot combustion gases around a stationary fire fighter. And, the full-scale fire tests exposed the PASS instrumented mannequin to typical fire conditions. For each ofthese scenarios, the gas temperature and alarm activation was observed for each PASS device.
Static Oven and Flow Loop Test SeriesThis limited set of temperature versus alarm activation data demonstrates average alarm
temperatures of between 87 oC (189 oF) and 110 oC (230 oF) for all the PASS devices (Table 1).This series of tests reveals that different models can respond differently to static smokeconditions. Model B PASS devices displayed the lowest average activation temperatures whileModel C revealed the highest average activation temperatures. Alarm activation repeatabilityappears good for Model A and B. Model C unit C-3 exhibited a wider range of alarm activationtemperatures than any other PASS tested. Activation temperature is influenced by many factorsincluding, but not limited to sensor type, sensor position, and how the temperature is processedby the circuitry of the PASS device. This limited data set does not demonstrate which factor orfactors are responsible for generating the range of activation temperatures. There aresignificant uncertainties (Table 5) associated with the measurements and the range of totalexpanded uncertainties is larger than the range of temperatures measured.
The smaller series of flow loop tests produced much lower activation temperatures thanobserved in the static oven tests. This would be consistent with the heated air flow being able totransfer thermal energy to the PASS device more effectively than the static oven. The flow loopexperiments generated wider range of activation temperatures than for the static oven tests. Thethermal exposure sensors exhibited average alarm temperatures from 54 oC (129 oF), 72 oC(162 oF), to 102 oC (216 oF) for Models A, B, and C, respectively. Model A activated over anarrower range than Models B and C. On average, Model A alarmed at a much lowertemperature than Model B or C. Even though this is a limited data set, the activationtemperatures indicate that the thermal sensors respond differently to moving or flowing smokethan to static or quiescent smoke. Would the lower response temperatures display by Model Aprovide additional warning to fire fighters or would the lower activation temperatures generateunwanted false alarms?
Comparing the static oven and the flow loop alarm temperatures suggests that the thermalsensor utilized by Model A is more sensitive to the convective component of heat transferassociated with the flow loop. Model B also appears to respond to the convective component ofheat transfer, but to a lesser degree than Model A. Model C activated at similar temperatures forboth the static oven and the flow loop tests.
While each PASS device experienced similar exposures to the thermal environment ofthe static oven or flow loop series, additional experiments would be necessary to map out theentire temperature versus alarm response curve as a function of time. For example, this
39
experimental data set would not have captured an alarm activation resulting from a 60 minuteexposure to 50 oC (122 oF) environment. In a similar fashion, it might be useful to expose eachPASS device to much higher temperatures, such as 400 oC (752 oF) for short durations.However, the high temperature/short durations would probably cause irreversible damage to thePASS device. The high temperature endurance of the thermal exposure sensors, in terms of thetotal duration or number of trips into high temperature conditions, would also be usefulinformation in determining when PASS devices should be replaced.
Full-Scale Mannequin Experimental SeriesThe response of the PASS devices during the townhouse burns initially appears to be
inconsistent. In the Unit 1 fire test, none of the thermal sensors activated during the burn. InUnit 2, the rear PASS devices, A-1 and C3, both alarmed but the front PASS devices, A-3 andC-4, did not alarm. In the Unit 3, both front PASS devices alarm before the rear PASS devicesalarm. However, with more detailed examination of the gas temperatures and total heat fluxes,the thermal sensor activations are relatively consistent. Each of the fires in Unit 1 and Unit 2was initiated by igniting gasoline, so both fire developed quickly, but the fuel in Unit 1 waslimited to carpeting, no furniture. The fire in Unit 1 started quickly, but after consuming thegasoline, the fire began to decrease in its intensity. Initially the gasoline fueled fire generatedsignificant levels of thermal radiation to help pyrolyze additional fuel, but as the gasoline wasexpended, the carpeting continued to burn, but the line of flames was distributed over a widerflame front and this would have reduced the radiation feedback to the fuel. The reducedfeedback would have caused the fire to decrease in it intensity. The fire in Unit 2 also startedquickly, but there was additional furniture in the living room. Consequently, the temperaturedata show the same initial development and actually begin to decline. But as the fire spreads toadditional items, the intensity of the fire increases until the fire begins to approach flashover andsuppression was initiated. The fire in Unit 3 was slower to develop initially because it wasignited with crumpled newspaper rather than gasoline. The crumpled newspaper was positionedon the sofa and may have caused the fire to spread more quickly across the sofa and chair. Thegasoline was spilled in the center of the carpet and the fire at least in the initial stages, was agreater distance from the additional fuel items. The higher temperatures and heat fluxesobserved in Unit 3 suggest that more of the fuel package became involved in the early stages ofthe fire than in Unit 2. As a result of more of the furnishings becoming involved, the intensityof the fire in Unit 3 fire increased until the fire approached flashover and water suppression wasinitiated.
As one would expect, the intensity of the fire in Unit 3 produced the highest gastemperatures and the highest thermal heat fluxes while Unit 1 reported the lowest temperaturesand heat fluxes. It would be consistent to find that the fire in Unit 3 activated all of the thermalsensors, front and rear of the mannequin, while none of the thermal sensors activated in Unit 1.This indicates that the temperatures/fluxes were sufficient in Unit 3, and not sufficient to causeactivation in Unit 1. In Unit 2, the fire produced temperatures and fluxes in between thoseobserved in Unit 1 (lower than Unit 2) and Unit 3 (higher than Unit 2). Consequently, it shouldnot be a surprise that only two out of the four thermal sensor equipped PASS devices alarmed inUnit 2. It is curious that it was not the two PASS devices on the front of the mannequin whichfaced the burning fuel package. It was the two PASS devices on the rear of the mannequin thatactivated. Since the PASS devices on the front and rear of the mannequin would experience the
40
radiation from the hot upper layer, one might expect that the additional thermal flux from theburning fuel package that only the PASS devices facing the fire would experience would causethe front PASS devices to activate first. However, the rear-mounted devices activated first andthose PASS devices would have been shielded by the body of the mannequin from the radiationof the burning fuel. But, the activation of the rear thermal sensors demonstrates that the rear ofthe mannequin may have experienced some additional energy that did not impact the PASSdevices on the front. One possibility is that as the hot layer moved across the ceiling and struckthe rear wall of the townhouse, some portions of the hot layer may have recirculated or moveddown the wall and towards the rear of the mannequin. If this “reflected jet” of hot upper layergases was sufficiently strong, it may have convected additional thermal energy to the rear of themannequin. The mannequin would have shielded the front mounted devices from this reflectedstream of hot gases. This would suggest that the energy convected by the reflected stream to therear devices was greater than the radiative energy received by the front PASS devices.Modeling this set of experiments using computer fire models such as fire Dynamic Simulator[10] could provide additional insight about the recirculation the hot combustion gases around themannequin.
While the activation of the rear mounted PASS devices in Unit 2 may suggest that theradiation from the burning fuel package was not sufficient to activate the thermal sensors on thefront of the mannequin, the heat flux reached much higher levels in Unit 3 and the combinationof gas temperatures did activate all four of the thermal sensor equipped PASS devices in Unit 3.But, the two front mounted devices activated much more quickly than the rear mounted devicesand this would be consistent with radiative heat flux playing a role in the activation. There werealso significant delays between the activation of the front PASS devices and the rear PASSdevices. The time between peak temperature and thermal sensor activation was tabulated forboth peak room temperature and peak temperature near each PASS device. It did not appear tomake much difference whether the time was calculated from the peak room temperature or thepeak mannequin temperature. The peak exposure to alarm activation time was significantlylonger, 65 s to 120 s, for the mannequin in Unit 2 as compared to Unit 3 which had a range of25 s to 80 s. The longer exposure to activation time in Unit 2 would be consistent with a lessintense fire development while the shorter times in Unit 3 would reflect the more intensetemperature and heat flux environment. The full-scale townhouse burns demonstrate thatthermal radiation can significantly affect the activation of the thermal exposure sensor, butclearly illustrate that conduction, convection and radiation can work in different combinations tocause a thermal sensor to alarm.
Since a fire fighter may be exposed to relatively low temperature environments such asthe fire in Unit 1, it is important that a standard testing protocol include a component thatsimulates the exposure of the thermal sensor to a relative low temperature, less than 70 oC(158 oF), for a relatively long period of time, up 30 minutes. When the static oven activationtemperatures are compared to the flow loop temperatures, it is clear that the testing protocol alsoneeds to include a component with the hot gases moving across the fire fighter. The importanceof moving or recirculating gases was also observed in the activation of the rear mounted PASSdevices in Unit 2. The full-scale results illustrate the role that thermal radiation can play inthermal sensor activation and the standard protocol should also include exposure to thermalradiation. Although limited, the static oven, flow loop, and full-scale test data, all indicate that
41
a thermal sensor must be characterized under conductive, convective, and radiative modes ofheat transfer.
This limited data set also raises some additional issues associated with thermal sensors inPASS devices. Each thermal sensor is designed to activate according to a temperature responsecurve. The higher the temperature, the quicker the thermal sensor is designed to activate. But,in the full-scale townhouse tests, there was between 25 s and 120 s delay between peak exposureand sensor activation. If a fire fighter had delayed their retreat until the thermal sensor hadactivated, up to 2 minutes, serious injury could have occurred. If the thermal sensor in PASSdevices is intended to warn the fire fighter of a possibly hazardous thermal environment, thePASS device must provide this warning quickly, not 60 s or 90 s later. A thermal sensor can bedesigned to activate in response to a range of parameters. Sensors can activate when a specifictemperature is exceeded. This type of sensor might be set to alarm when a temperature greaterthan 100 oC (212 oF) is experienced. The sampling frequency of a sensor can also impact howquickly it alarms. If a sensor only looks at the temperature every 30 s, the temperature mayexceed the set point for up to 30 s before the alarm is activated. A temperature specific sensormight alarm at the sudden rise in temperature, but a prolonged exposure to temperatures justbelow the set point, say 2 hours at 98 oC (209 oF) might not trigger an alarm. A thermal sensorcan also be designed to activate when the sensor has experienced a certain amount of energy.This type of sensor would accumulate or integrate the energy and when sufficient energy hadbeen collected, it would alarm. An integrating type sensor would alarm whether that energyarrived in a few seconds or over an hour, but the process of accumulating the energy could slowhow fast the alarm is activated. A sensor can also be designed to alarm at a certain rate oftemperature increase. A rate of rise sensor would activate when the temperature is increasingfaster than a specific rate. For instance, if alarm set point was 50 oC (90 oF) per second, atemperature that increased from 100 oC (212 oF) to 200 oC (392 oF) in less than a second wouldtrigger an alarm. Different fire conditions would cause each of these different sensor designs toalarm. A rate of rise sensor would not alarm under the thermal conditions, relatively lowtemperatures over a period of time, that occurred in Unit 1. A temperature specific or integratingsensor may not respond quickly enough to warn of the hazardous conditions, rapidly risingtemperature, in Unit 2 or 3. A thermal sensor may have to incorporate the ability to alarm tomultiple conditions, rapid temperature rise over a short period of time as well as lowertemperatures over a prolonged period of time. The full-scale townhouse data clearly suggeststhat the thermal sensors mounted on the front and rear of the mannequin did not providesufficient warning to allow safe retreat from the fire conditions. These PASS thermal sensorsmay provide information on the integrated or total exposure to thermal conditions which couldbe used by the incident commander to reassign the affected fire fighters to rehab. But, thislimited data indicates that fire fighters should not rely on current thermal sensors to provideadequate warning of short-term exposures to the hazards of high thermal radiation or hightemperature environments.
A second issue that the full-scale data highlights is the position or location of the thermalsensor on the fire fighter. In the Unit 3 tests, the body of the mannequin shielded the rear-mounted PASS devices from the thermal radiation of the burning fuel package. In Unit 2, thebody of mannequin may have shielded the front mounted PASS devices from the recirculationzone that may have occurred behind the mannequin. If a single thermal sensor is utilized,neither the front or rear location will adequately address the issue of the sensor being shielded by
42
the body of the fire fighter. Either multiple point sensing, front and rear, or another location onthe fire fighter may needed to be considered. Multiple point sensing would monitor thetemperature at different locations and would alarm if the set point temperature is exceeded oneither front or rear location. Mounting the thermal sensor on the shoulder or on the helmet mayprovide a compromise that minimizes the ability of the body to shield the thermal sensor. Frontor rear mounted thermal sensors do not appear to provide optimum coverage and alternativesneed to be investigated.
B. Standard Test ProtocolThe thermal exposure sensor response data collected by this study demonstrates that
current sensors respond differently to different fire conditions. Thermal exposures can be forshort periods at high temperatures or for prolonged periods at lower temperatures. For both ofthese exposures, acute and prolonged, thermal exposure sensors are expected to provide adequatewarning of hazardous thermal environments. A well-designed testing protocol mustcharacterize the thermal sensor performance when immersed in stagnant hot gases, enveloped bymoving combustion products, and experiencing intense thermal radiation. The testing protocolshould at a minimum include components to collect response versus temperature data for thermalsensors encountering the following fire scenarios:
A) Quiescent hot gases for temperature ranging from 150 oC (300 oF) to 300 oC (572 oF),for prolonged and acute exposures respectively; recommend using static oven toevaluate this condition,
B) Flowing or moving hot gases for temperature ranging from 125 oC (260 oF) to 250 oC(482 oF) for prolonged and acute exposures respectively; with gas velocity rangingfrom 0.22 m/s (0.5 mph) to 2.24 m/s (5 mph); recommend employing a flow loop that
allows for variable temperature and velocity.
C) High thermal flux / pre-flashover conditions with total heat fluxes from 2.5 kW/m2 to30 kW/m2 for prolonged and acute exposures respectively; recommend either electricresistance radiant panel or gas fired radiant panel.
While the test protocol needs to include these scenarios, the protocol should not be usedto limit the characterization of thermal sensor performance to only these three scenarios. Forexample, it is important that a temperature response curve describe the thermal sensorperformance over a wider range of temperatures from 25 oC (77 oF) to 600 oC (1112 oF).
As the standard testing protocol is developed, it must also address whether the thermalsensor is designed to provide warning of an imminent hazard, such as rapid increase intemperature just before flashover, or designed to alarm after a more prolonged exposure torelatively lower temperatures. If the alarm is intended to provide time to retreat safely from animminent hazard, then the alarm activation must occur almost instantaneously when the sensorexperiences either the imminent hazard or the conditions leading to an imminent hazard. Thetime delay must be on the order of seconds, not minutes. If the alarm is expected to warn of an
43
exposure over an extended period of time, then the time between exposure and alarm can besubstantially longer.
A draft protocol for Thermal Exposure Sensor is described in Appendix A. It includes sectionsthat address A) Design Requirements, B) Performance Requirements, and C) Test Methods.The draft protocol incorporates
1) Exposure temperatures and durations for each of the above three scenarios,2) Tests on fully assembled, ready for service, PASS devices,3) Pre-test conditioning of specimens,4) Testing of multiple units of the same model of PASS device,5) Specific velocities for moving gases,6) Non-destructive testing at low temperatures,7) Destructive testing at high temperatures,8) Data to be recorded during each test,9) Interpretation of results.
It is critically important that input from the fire service, the PASS manufacturers, testinglaboratories, and fire research institutions be included in the development of the standard testingprotocol. The fire service will provide insight into the conditions and thermal environments thatfire fighters experience. Manufacturers will continue to incorporate new technologies to provideimproved instrumentation for fire fighter safety. Fire testing laboratories will make sure that theperformance can be adequately characterized. Research institutions will help ensure a scientificfoundation for the design and help identify new technology for future devices.
VI. Conclusions
The limited set of temperature versus thermal sensor activation data indicates that sensorsrespond differently under static, flowing, and radiation intense conditions. The full-scale datademonstrate that current thermal sensing/PASS implementations are unlikely to provide a firefighter with sufficient warning of an acute thermal hazard. Current PASS devices may provideinformation to fire fighters about their longer term exposure to thermal conditions, but there is asignificant delay of 25 s to 120 s before the fire fighter receives this alarm or information.
This limited series of experiments demonstrates the need to develop a standard testingprotocol to insure that all PASS devices provide adequate protection for fire fighters. Thistesting protocol must evaluate the performance of thermal sensors under a range of fireenvironments that fire fighters may realistically encounter on a routine basis. The fire service,equipment manufacturers, and fire research and fire testing laboratories must be included in thedevelopment of a standard testing protocol.
The overall goal of this work is to improve the safety and effectiveness of fire fighters.To accomplish this goal, the fire service must be able to incorporate state-of-the-art technologyinto all of its equipment. But, in order for the fire service to integrate new technology safely, itmust be able to understand the performance and the limitations of this new technology.

44
VII. Acknowledgements
This project was funded by the US Fire Administration, Federal Emergency ManagementAgency with Mr. William Troup served as project officer. Mr. Jack Lee and Mr. Roy McLaneexpertly conducted both static oven and flow loop experiments. Mr. Robert Vettori and Mr. JayMcElroy did an excellent job of field instrumentation and mannequin setup.
VIII. References
1. Karter, M.J., Jr., “Patterns of Firefighter Fireground Injuries,” Quincy, MA: NationalFire Protection Association, Fire Analysis and Research Division, Nov. 2003.
2. Fahy, R. and Leblanc, P., “On-Duty Deaths Firefighter Fatalities 2002,” National FireProtection Association Journal, Vol. 97, No. 4, pp 56-63, July/August 2003.
3. “Provisional Report for On-Duty Firefighter Fatalities in the United States Date Range01/01/2003 to 12/31/2003 ,” Emittsburg, MD, US Fire Administation, updated Feb. 2004.
4. “Fire Fighter Deaths in Structural Collapses, 1979-1988.” Quincy, MA: National FireProtection Association, Fire Analysis and Research Division, Aug. 1989.
5. “Fire Ground Fatalities As A Result of Structural Collapse, 1983-1992.” Quincy, MA:National Fire Protection Association, Fire Analysis and Research Division, Aug. 1993.
6. Brassell, L.D. and Evans, D.D., Trends in Firefighter Fatalities Due to StructuralCollapse, 1979-2002. NISTIR 7069. Gaithersburg, MD: National Institute of Standardsand Technology, Nov. 2003.
7. Standard on Personal Alert Safety Systems (PASS), 1998 Edition, Quincy, MA: NationalFire Protection Association, August 1998.
8. Fleming, R. P., “Theory of Automatic Sprinkler Performance.” Fire ProtectionHandbook, Eighteenth Edition, Section 6/Chapter 8, Quincy, MA: National FireProtection Association, pp 6-113 – 6-123, 1997.
9. Taylor, B. N. and C. E. Kuyatt, Guidelines For Evaluating and Expressing theUncertainty of NIST Measurement Results. National Institute of Standards andTechnology (U.S.) NIST TN 1297; September, 20 p. 1994.
10. McGrattan, Kevin B.; Baum, Howard R.; Rehm, Ronald G.; Hamins, Anthony;Forney, Glenn P.; “Fire Dynamics Simulator – Technical Reference Guide,”National Institute of Standards and Technology, Gaithersburg, MD, NISTIR6467, January 2000.

45
IX. Other Resources
United States Fire Administration Website - http://www.usfa.fema.gov/

46

47
Building and Fire Research Laboratory Website - http://www.bfrl/nist.gov
48
Appendix A.
Draft Performance Standard for Thermal Exposure Sensors for Personal Alert Safety Systems(PASS).
Section A - DESIGN REQUIREMENTS
A.x Thermal Exposure Sensing Design Requirements for PASS.A.x.1 PASS shall incorporate thermal sensing that shall detect high thermal environment near theperson on whom the PASS is deployed and cause the activation of the sequence that leads to thesounding of the alarm signal when high thermal environment is detected for the specified time.A.x.2 PASS shall sound the alarm signal specified in A.4.3 when the PASS does not sense thethermal environment for 10 seconds, +2/-0 seconds.A.x.3 PASS Thermal sensing shall function regardless of the angle of deployment of the PASS.A.x.4 PASS shall be designed so that any failure of the thermal sensing function shall cause thePASS to sound the alarm signal, specified in x.x.x, within 10 seconds, +2/-0 seconds, of suchfailure. The PASS manufacturer shall submit a failure modes analysis to the certificationorganization for verification of this requirement.
Section B - PERFORMANCE REQUIREMENTS
B.xx Thermal Exposure Sensor Test.B.xx.1PASS shall be tested for ability to sense the thermal environment as specified in Section C.xx,Thermal Sensor Tests, and shall function as follows:(a) PASS shall emit the operational signal, as specified in A.x.x.(b) Signals shall be evaluated for proper functioning as specified in Section x.x(c) The alarm signal shall sound and continue to sound, as specified in A.x.x.(d) Signals shall meet the sound pressure levels as specified Section B.x(e) Nothing shall fall off the PASS, and the PASS shall not fall from its mounted position.(f) At least two separate and distinct manual actions shall be required to change themode selection device from alarm to sensing in order to silence the alarm as specifiedin A.x.x.(g) The data logging functions specified in A.x.x shall operate properly.(h) The transmitter within the PASS shall remain functional after completion of this testmethod.(i) The data logging functions specified in A.x.x shall operate properly.
49
Section C - TEST METHODS
C.x Thermal Sensor Test.C.x.1 Application. This test method shall apply to all PASS.
C.x.2 Samples.C.x.2.1 Samples shall be complete PASS.C.x.2.2 Samples shall be conditioned as specified in C.x.x.
C.x.3 Specimens.C.x.3.1 Specimens for testing shall be complete PASS.C.x.3.2 A minimum of three specimens shall be tested.
C.x.4 Procedure.C.x.4.1 Each specimen shall be subjected to a series of three thermal sensing testsidentified as C.x.5, Test Procedure 1 for static environment, C.x.6, Test Procedure 2 for flowenvironment, and C.x.7 Test Procedure 3 for radiation flux.C.x.4.2 The same three specimens shall be used for all three test series. Each specimen testedshall be complete with power supply.C.x.4.3 The test chamber or cabinet shall be capable of maintaining the required conditionsspecified in C.x.5, C.x.6, and C.x.7 throughout the envelope of air surrounding the specimenbeing tested, and these conditions shall be continuously monitored.C.x.4.4Following each test, the specimen shall be allowed to stabilize at ambient conditions priorto proceeding to the next test.
C.x.5 Test Procedure 1 – Static Environment.C.x.5.1 Specimens shall be removed following the specified conditioning, and testing shall beginwithin 30 seconds of removal from conditioning.C.x.5.2 Specimens shall be placed in an electric resistance oven that has been stabilized at 150°C(120°F) +5/-0°F).C.x.5.3 Specimens shall remain in oven until thermal sensor activates alarm.C.x.5.4 PASS Device shall not alarm before 10 minutes, but shall alarm before 15 minutes ofexposure .C.x.5.5 Failure of the alarm to activate within the specified time period shall constitute a failure.C.x.5.6 This cycle shall be repeated twice for a total of three exposures.C.x.5.7 Specimens shall be removed following the specified conditioning, and testing shall beginwithin 30 seconds of removal from conditioning.C.x.5.8 Specimens shall be placed in an electric resistance oven that has been stabilized at 300°C(120°F) +5/-0°F).C.x.5.9 Specimens shall remain in oven until thermal sensor activates alarm.C.x.5.10 PASS Device shall not alarm before 5 seconds, but shall alarm before 15 seconds ofexposure.C.x.5.11 Failure of the alarm to activate within the specified time period shall constitute afailure.

50
C.x.5.12 This cycle shall be repeated twice for a total of three exposures.
C.x.6 Test Procedure 2 – Flow Environment.C.x.6.1 Specimens shall be removed following the specified conditioning, and testing shall beginwithin 30 seconds of removal from conditioning.C.x.6.2 Specimens shall be placed in a heated flow loop that has been stabilized at 125°C(250°F) +5/-0°F) and a flow velocity of 0.22 m/s.C.x.6.3 Specimens shall remain in oven until thermal sensor activates alarm.C.x.6.4 PASS Device shall not alarm before 15 minutes, but shall alarm before 20 minutes ofexposure .C.x.6.5 Failure of the alarm to activate within the specified time period shall constitute a failure.C.x.6.6 This cycle shall be repeated twice for a total of three exposures.C.x.6.7 Specimens shall be removed following the specified conditioning, and testing shall beginwithin 30 seconds of removal from conditioning.C.x.6.8 Specimens shall be placed in a heated flow loop that has been stabilized at 250°C(480°F) +5/-0°F) with a flow velocity of 1 m/s .C.x.6.9Specimens shall remain in oven until thermal sensor activates alarm.PASS Device shall not alarm before 5 seconds, but shall alarm before 15 seconds of exposure.C.x.6.10 Failure of the alarm to activate within the specified time period shall constitute afailure.C.x.6.11This cycle shall be repeated twice for a total of three exposures.
C.x.7 Test Procedure 3 – Radiation Flux.C.x.7.1 Specimens shall be removed following the specified conditioning, and testing shall beginwithin 30 seconds of removal from conditioning.C.x.7.2 Specimens shall be placed in a thermal flux field that has been stabilized at 2.5 w/m2.C.x.7.3 Specimens shall remain in oven until thermal sensor activates alarm.C.x.7.4 PASS Device shall not alarm before 10 minutes, but shall alarm before 15 minutes ofexposure .C.x.7.5 Failure of the alarm to activate within the specified time period shall constitute a failure.C.x.7.6 This cycle shall be repeated twice for a total of three exposures.C.x.7.7 Specimens shall be removed following the specified conditioning, and testing shall beginwithin 30 seconds of removal from conditioning.C.x.7.8 Specimens shall be placed in a thermal flux field that has been stabilized at 30 w/m2 .C.x.7.9 Specimens shall remain in oven until thermal sensor activates alarm.PASS Device shall not alarm before 5 seconds, but shall alarm before 15 seconds of exposure.C.x.7.10 Failure of the alarm to activate within the specified time period shall constitute afailure.C.x.7.11 This cycle shall be repeated twice for a total of three exposures.
C.x.8.1 The functioning of the specimens shall be recorded and reported.
C.x.9 Interpretation.C.x.9.1 Pass or fail performance shall be determined for each specimen.C.x.9.2 One or more specimens failing this test shall constitute failing performance.

![Acoustic Properties of Maternal Emotional Speech Poster.pdf1. Introduction Parental vocalized emotions alert children to stop or change their behavior [1]. Excessive exposure specifically](https://static.documents.pub/doc/80x56/5ff448716606d2102c1179bf/acoustic-properties-of-maternal-emotional-posterpdf-1-introduction-parental-vocalized.jpg)


