Performance Study VMware, Inc 1 Performance of Virtualized SQL Server– Based VMware vCenter Database VMware vSphere 4.1 VMware vSphere™ is a sound platform on which to virtualize SQL Server databases. One overlooked database to consider for virtualization is the VMware vCenter™ database. Experiments discussed in this paper show the impact on performance of a SQL Server–based vCenter database when virtualized on VMware vSphere 4.1. Load generators, which model real world workload activity on the database, consisted of various SQL stored procedures that access and modify the performance data stored in the database. The execution time of these stored procedures was measured in virtual and native environments. The results of the experiments show that: The most resource-intensive operations of a SQL Server–based vCenter database perform at a level comparable to that of native. A SQL Server–based vCenter database managing a vSphere virtual environment—which consists of any number of clusters, hosts and virtual machines—can be virtualized on vSphere. SQL databases, in general, perform at a near-native level when virtualized on vSphere 4.1.
VMware vSphere™ is a sound platform on which to virtualize SQL Server databases. One overlooked database to consider for virtualization is the VMware vCenter™ database. Experiments discussed in this paper show the impact on performance of a SQL Server–based vCenter database when virtualized on VMware vSphere 4.1. Load generators, which model real world workload activity on the database, consisted of various SQL stored procedures that access and modify the performance data stored in the database. The execution time of these stored procedures was measured in virtual and native environments. The results of the experiments show that:
The most resource-intensive operations of a SQL Server–based vCenter database perform at a level comparable to that of native.
A SQL Server–based vCenter database managing a vSphere virtual environment—which consists of any number of clusters, hosts and virtual machines—can be virtualized on vSphere.
SQL databases, in general, perform at a near-native level when virtualized on vSphere 4.1.
Performance of Virtualized SQL Server–Based VMware vCenter Database
9 About the Author ...................................................................................................................................................................... 17
Performance of Virtualized SQL Server–Based VMware vCenter Database
VMware, Inc 3
1 Introduction vSphere has proven to be an effective virtualization platform for building a private cloud to run enterprise applications such as SQL Server. Previous studies have shown that SQL Server can be virtualized successfully on vSphere, achieving excellent performance and scalability. SQL server has become one of the most commonly virtualized applications in datacenters.
As shown in previous studies [1] [2], resource-intensive SQL databases can be virtualized on vSphere successfully. Virtualized SQL Server databases perform at a near-native level. Hence, one would expect even a vCenter database implemented using SQL Server to perform well when virtualized on vSphere. A study was conducted in the VMware® performance engineering lab to validate this assumption. The study compared the performance of resource-intensive SQL operations of vCenter database in virtual and native environments. The results of this study are discussed in this paper. The paper also provides a deeper analysis of CPU and I/O profiles of a few of the operations that were considered for the study.
2 Workload Description VMware vCenter Server, the management component of vSphere, uses a database to store and organize information related to vSphere-based virtual environments. The database can be implemented on SQL Server, Oracle, or DB2. The data in the vCenter database can be classified into the following categories:
Inventory—Includes the configurations of hosts and virtual machines, virtual machine and resource inventory, and user permissions and roles.
Alarms, events, and tasks—Alarms are notifications that are triggered in response to selected events and conditions, and states of objects in the inventory. Tasks are system activities that do not complete immediately.
Performance statistics—Includes performance and resource utilization statistics of the objects (datacenters, clusters, hosts, VMs, resource pools) in the vSphere environment.
vCenter collects performance-related statistics from the vSphere environment and inserts them into the database regularly. Depending on the stats level set in vCenter, performance statistics can compose a major portion of the data stored in the database. As the inserted data gets older, vCenter aggregates them at different granularities (5 minutes to 30 minutes, 30 minutes to 2 hours, and 2 hours to 24 hours). The aged data that is aggregated to the next level is then deleted by purge operations. All these operations are implemented as stored procedures. vCenter schedules these stored procedures to run at regular intervals.
For the experiments discussed in the paper, a vCenter database was created on Microsoft SQL server 2008. A large inventory of objects was created in the database. The exact number of objects is shown in table 1.
Table 1. Number of hosts and virtual machines in the test database
Iventory 8500 Hosts 500 VMs 8000
For this inventory, the database was populated with level 4 performance statistics. Details of various levels of stats are shown in table 2.
Table 2. Number of time intervals for various stat levels
Stats Interval From To Total time intervals
5 minutes June 03, 2010 June 05, 2010 563 30 minutes May 27, 2010 June 02, 2010 336 2 hour April 29, 2010 May 26, 2010 336 24 hour June 04, 2009 April 28, 2010 330
Performance of Virtualized SQL Server–Based VMware vCenter Database
VMware, Inc 4
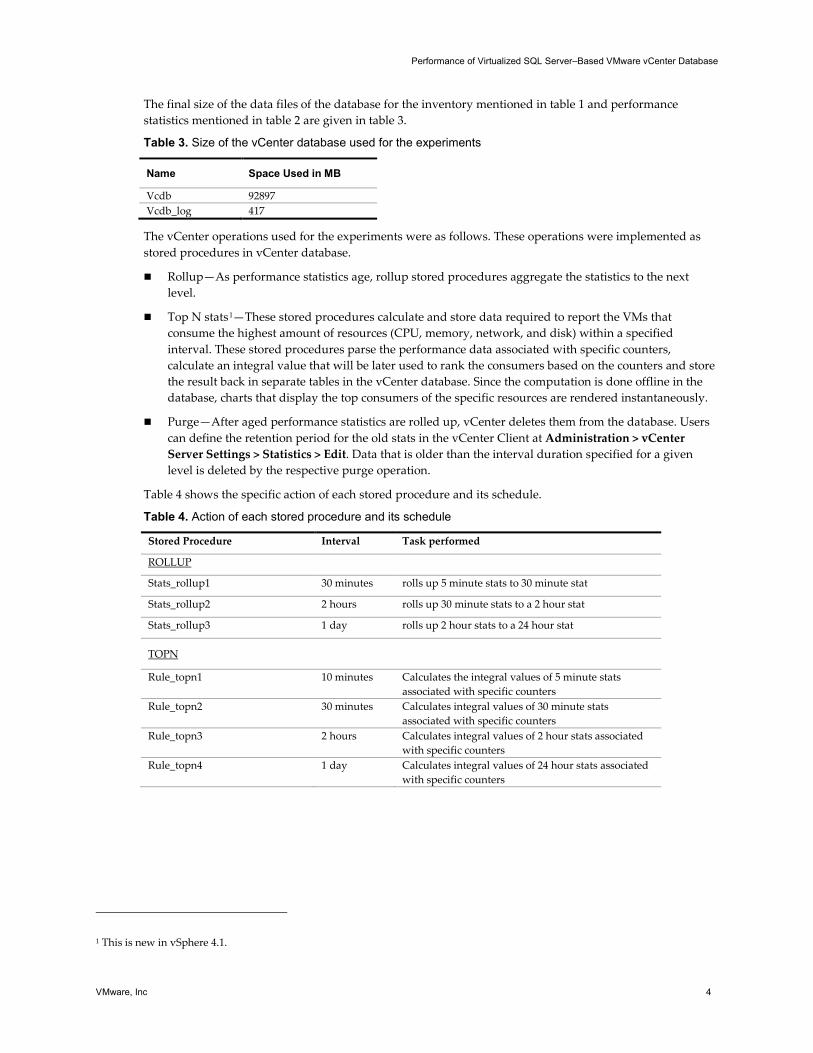
The final size of the data files of the database for the inventory mentioned in table 1 and performance statistics mentioned in table 2 are given in table 3.
Table 3. Size of the vCenter database used for the experiments
Name Space Used in MB
Vcdb 92897 Vcdb_log 417
The vCenter operations used for the experiments were as follows. These operations were implemented as stored procedures in vCenter database.
Rollup—As performance statistics age, rollup stored procedures aggregate the statistics to the next level.
Top N stats1
Purge—After aged performance statistics are rolled up, vCenter deletes them from the database. Users can define the retention period for the old stats in the vCenter Client at Administration > vCenter Server Settings > Statistics > Edit. Data that is older than the interval duration specified for a given level is deleted by the respective purge operation.
—These stored procedures calculate and store data required to report the VMs that consume the highest amount of resources (CPU, memory, network, and disk) within a specified interval. These stored procedures parse the performance data associated with specific counters, calculate an integral value that will be later used to rank the consumers based on the counters and store the result back in separate tables in the vCenter database. Since the computation is done offline in the database, charts that display the top consumers of the specific resources are rendered instantaneously.
Table 4 shows the specific action of each stored procedure and its schedule.
Table 4. Action of each stored procedure and its schedule
Stored Procedure Interval Task performed
ROLLUP
Stats_rollup1 30 minutes rolls up 5 minute stats to 30 minute stat
Stats_rollup2 2 hours rolls up 30 minute stats to a 2 hour stat
Stats_rollup3 1 day rolls up 2 hour stats to a 24 hour stat
TOPN
Rule_topn1 10 minutes Calculates the integral values of 5 minute stats associated with specific counters
Rule_topn2 30 minutes Calculates integral values of 30 minute stats associated with specific counters
Rule_topn3 2 hours Calculates integral values of 2 hour stats associated with specific counters
Rule_topn4 1 day Calculates integral values of 24 hour stats associated with specific counters
1 This is new in vSphere 4.1.
Performance of Virtualized SQL Server–Based VMware vCenter Database
VMware, Inc 5
PURGE
Purge_stat1 30 minutes Purges 5 minute stats that are older than the retention period specified in vCenter Server Settings
Purge_stat2 2 hours Purges 30 minute stats that are older than the retention period specified in vCenter Server Settings
Purge_stat3 1 day Purges 2 and 24 hour stats that are older than the retention period specified in vCenter Server Settings
The default retention period for different performance statistics is shown in table 5.
Table 5. Default retention period for performance stats
Statistics category
Saved For
5 minutes 1 days 30 minutes 1 week 2 hours 1 month 1 day 1 year
3 Experimental Setup The test environment used for virtual and native tests was similar. Figure 1 shows the test bed used for the experiment.
Figure 1. Experimental setup
The hardware and software details of the experimental setup are provided in tables 6 and 7.
Performance of Virtualized SQL Server–Based VMware vCenter Database
VMware, Inc 6
Table 6. Hardware and software configuration
Component Native Server Virtual Server
Hypervisor VMware vSphere 4.1
Memory 8GB
8GB
Processors 2
2
Operating System Windows Server 2008 R2 Enterprise x64 Windows Server 2008 R2 Enterprise x64
Database SQL Server 2008 R2 Enterprise x64 SQL Server 2008 R2 Enterprise x64
OS Disk Size (OS) 50GB 50GB
Fibre Channel HBA One dual port QLogic QLA2432 adapter One PVSCSI adapter
HBA Driver Qlogic STOR miniport driver version 9.1.8.25 VMware paravirtual SCSI driver
File System NTFS for data, index, temp and log files NTFS (guest) for data, index, temp and log files
Virtual Disk format VMFS for OS disk RDM for other disks which had data, index, temp and log files of vCenter database
Table 7. Details of server and storage hardware, test application
Component Native Server
Server HP ProLiant DL380 G6
Processors Intel Xeon x5570 @ 2.93GHz
Memory 48GB
Storage Array EMC CLARiiON CX3-40
Test Application vCenter Database 4.1
Performance of Virtualized SQL Server–Based VMware vCenter Database
VMware, Inc 7
4 Testing Methodology For native tests, the Windows OS was restricted to use only 8GB of memory using the bcdedit tool2
[3]
. Apart from the system drive that contained the operating system and application-related binaries, 3 additional logical drives created on a SAN were assigned to the server—one for data (100GB), one for temp (10GB) and one for log (10GB). These logical drives were formatted with the NTFS file system with a cluster size of 64KB as recommended by Microsoft in “Disk Partition Alignment Best Practices for SQL Server .” A vCenter database was created on SQL server 2008 R2 using the SQL server scripts provided in the vCenter installation package, which were found in <DVD-drive>:/vpx/dbschema.
Using a script developed internally for performance testing, the database was populated with the inventory of objects as listed in table 1 and a full year’s worth of level 4 performance statistics. This newly created database represented a large vSphere environment; enabling level 4 stats meant collecting all metrics supported by vCenter for the large inventory of objects.
As part of the vCenter database creation, stored procedures implementing various vCenter operations such as stats rollups, purges, and topN stat calculations were installed. Normally these stored procedures would be scheduled to run automatically as SQL jobs. However, to have a controlled environment to run the tests, the jobs were turned OFF.
Separate PowerShell scripts were written to invoke the stored procedures manually and measure their execution time. These scripts were executed on a separate native client machine running Windows Server 2008 enterprise x86 edition.
The same physical host used in the native tests was also used for the virtual tests. vSphere 4.1 was installed in the host. A single VM was created with 2 vCPUs and 8GB of memory. All the required software (mentioned in table 3) was installed in the VM. The same 3 LUNs (containing data, index, and log files of vCenter and the temp database) used in native tests were exposed to the VM as virtual disks using RDM. The .mdf and .ldf files used previously for native tests were attached to the SQL server running in the VM to create a vCenter database in the VM.
As done in the case of native, the PowerShell scripts were used to invoke the stored procedures manually against the vCenter database in the VM. Their execution time was recorded.
Execution time of each category of stored procedures was used as the metric to compare performance of vCenter database in both the VM and the native system.
2 The command we used was bcdedit /set {GUID} removememory 40960.
Performance of Virtualized SQL Server–Based VMware vCenter Database
VMware, Inc 8
5 Performance Results
5.1 Rollup Stats Rollup stored procedures took the shortest amount of time to execute among all the stored procedures considered for the tests. Figure 2 compares the execution time of all 3 rollup stored procedures in a VM with that in a native system.
Figure 2. Execution time of rollup stored procedures (lower is better)
As seen in figure 2, the execution time of rollup stored procedures in the VM was unexpectedly better than that in the native system. Further investigation revealed that the performance of data reads from SQL tables was found to be slower in native than that in the virtual environment. See the appendix for more details on the I/O behavior in the native environment.
5.2 Calculation of TopN Stats Figure 3 compares the execution time of stored procedures for calculating topN stats in the VM with that in native. As seen in the graph, the execution time of this category of stored procedures in the VM was within ±5% of that in native.
0
10
20
30
40
50
60
rollup1 rollup2 rollup3
Com
plet
ion
Tim
e in
Sec
onds
Rollup Operations
VM Native
Performance of Virtualized SQL Server–Based VMware vCenter Database
VMware, Inc 9
Figure 3. Execution time of TopN stored procedures (lower is better)
The longest running TopN stored procedure, topN2, was further analyzed. Figures 4 and 5 compare the CPU utilization and I/O performance of the topN2 stored procedure in virtual and native environments.
The topN2 stored procedure is characterized by an I/O phase (recognized by the low CPU utilization in figure 4 and a high reads/sec in figure 5) and a compute phase (recognized by the spike in CPU utilization in figure 5). Figure 4 indicates that the virtual environment consumed an insignificant amount of extra CPU cycles during the topN2 operation.
Figure 4. Host processor utilization during TopN2 operation
The I/O phase of the topN2 query is dominated by reads from tables in the vCenter database. Figure 5 compares data read performance in the I/O phase of the topN2 stored procedure when executing in the VM with that in the native. The total number of reads and the latency of reads were almost identical in virtual and native environments.
0
90
180
270
360
450
topn1 topn2 topn3 topn4
Com
plet
ion
Tim
e in
Sec
onds
Top N stats Calculation
VM Native
0
50
100
150
200
% P
roce
ssor
Util
izat
ion
Time Interval (5-seconds)
Native vSphere 4.1
Performance of Virtualized SQL Server–Based VMware vCenter Database
VMware, Inc 10
Figure 5. Performance of read operations from SQL tables during TopN2 operation
Note: In the native case there was a spike in latency (100+ milliseconds) towards the end of the I/O phase. To make the latency graph readable, this spike has been clipped in figure 5.
Other topN stored procedures showed similar characteristics in virtual and native environments.
5.3 Purge Stats Figure 6 compares the execution time of purge2 and purge3 stored procedures3
in virtual and native environments. The execution time of purge2 and purge3 stored procedures was 7-9% slower in native compared to that in vSphere 4.1. To understand the performance difference, the longest running purge stored procedure, Purge3, was further analyzed.
3 Purge1 operation was not considered to generate a load on the database because an inconsistent run time with the artificial data was used for the experiments. In real situations, performance behavior of the purge1 stored procedure is expected to be similar to that of the other purge stored procedures.
0
200
400
600
800
1000
1200
1400
Dat
a R
eads
/sec
Time Interval (5-seconds)
Native vSphere 4.1
0
2
4
6
8
10
12
Dat
a re
ad la
tenc
y (in
ms)
Time Interval (5-seconds)
Native vSphere 4.1
Performance of Virtualized SQL Server–Based VMware vCenter Database
VMware, Inc 11
Figure 6. Execution time of Purge stored procedures (lower is better)
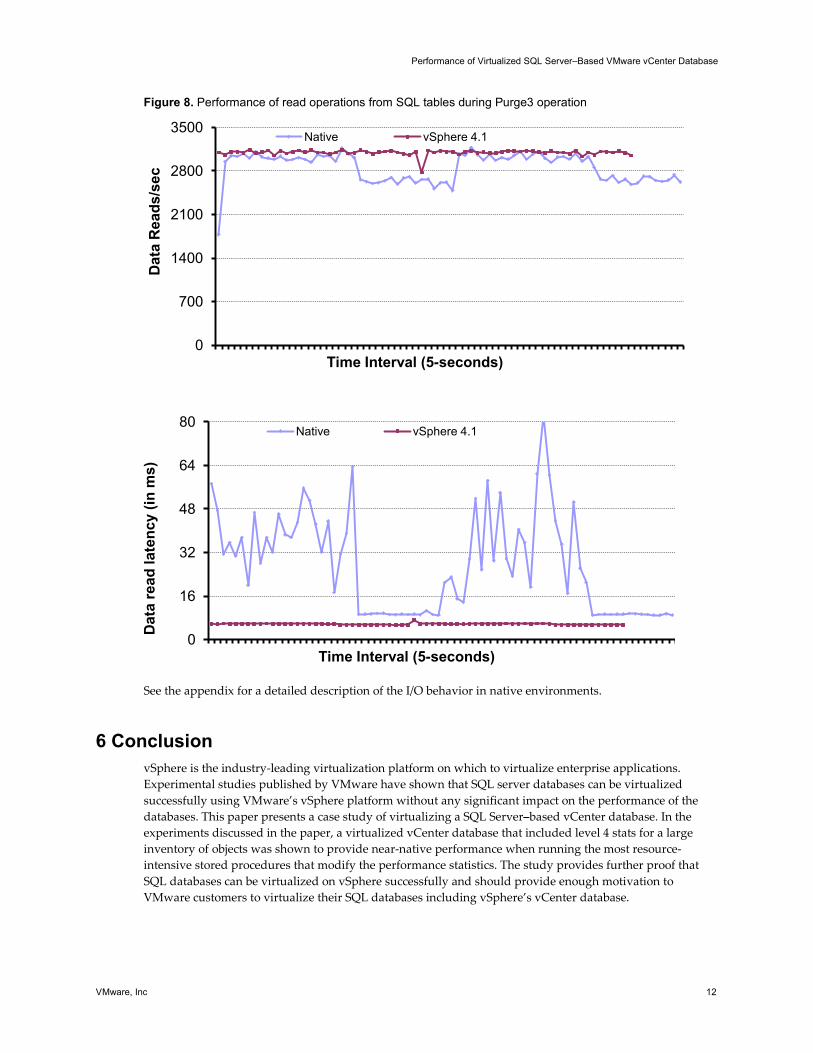
Figure 7 shows the host processor utilization when the purge3 stored procedure was executed in native and virtual environments. As seen in the figure, host processor utilization in the VM was 10-13% higher than that in native most of the time. But there were 2 intervals during the test run in native when host processor utilization dropped from its steady state value. It was noticed that the drop in processor utilization corresponded with a drop in I/O reads per second from SQL tables (shown in figure 8). This behavior was not seen in the virtual environment.
Figure 7. Host processor utilization during Purge3 operation
Figure 8 shows the performance native and virtual storage stack when purge3 stored procedure was executed. As seen in the figure, the performance of data reads from SQL tables was found to be slower in native (as measured in perfmon) than in the virtual environment (as measured by virtual disk latency in esxtop). It is unclear as to why the I/O read latency in native was so high and fluctuating throughout the duration of the purge3 operation.
0
100
200
300
400
500
purge2 purge3
Com
plet
ion
Tim
e in
Sec
onds
Purge Operations
VM Native
0
50
100
150
200
% P
roce
ssor
Util
izat
ion
Time Interval (5-seconds)
Native vSphere 4.1
Performance of Virtualized SQL Server–Based VMware vCenter Database
VMware, Inc 12
Figure 8. Performance of read operations from SQL tables during Purge3 operation
See the appendix for a detailed description of the I/O behavior in native environments.
6 Conclusion vSphere is the industry-leading virtualization platform on which to virtualize enterprise applications. Experimental studies published by VMware have shown that SQL server databases can be virtualized successfully using VMware’s vSphere platform without any significant impact on the performance of the databases. This paper presents a case study of virtualizing a SQL Server–based vCenter database. In the experiments discussed in the paper, a virtualized vCenter database that included level 4 stats for a large inventory of objects was shown to provide near-native performance when running the most resource-intensive stored procedures that modify the performance statistics. The study provides further proof that SQL databases can be virtualized on vSphere successfully and should provide enough motivation to VMware customers to virtualize their SQL databases including vSphere’s vCenter database.
0
700
1400
2100
2800
3500
Dat
a R
eads
/sec
Time Interval (5-seconds)
Native vSphere 4.1
0
16
32
48
64
80
Dat
a re
ad la
tenc
y (in
ms)
Time Interval (5-seconds)
Native vSphere 4.1
Performance of Virtualized SQL Server–Based VMware vCenter Database
VMware, Inc 13
7 Appendix
7.1 I/O Access Profile of Purge2 Operation As mentioned in the performance results section, I/O performance of read operations was slower in a native system when compared to that in a VM. To study this further, separate experiments were conducted with Iometer using an access profile that was similar to the one seen during purge2 operation. To obtain the I/O access profile of purge2 stored procedure, vscsiStats [4] was run in the vSphere host to collect 20 samples while the purge2 operation ran in the VM. These samples were collected at equal intervals spread through the entire purge operation. Figures 9 through 11 show the I/O access profile of purge2 operation.
Figure 9. Outstanding I/Os (reads) during purge2 operation
vscsiStats provides the number of outstanding I/Os during any given interval. The number of outstanding I/Os (OIOs) is classified into different bins as shown by the x-axis in figure 9. During the purge2 operations, the number of outstanding I/Os was between 32 and 64 all the time.
0
400
800
1200
1600
2000
1 2 4 6 812 16 20 24 28 32 64
vSCSI Samples
Freq
uenc
y
Outstanding IOs (reads)
1600-2000
1200-1600
800-1200
400-800
0-400
Performance of Virtualized SQL Server–Based VMware vCenter Database
VMware, Inc 14
Figure 10. Randomness of data access during purge2 operation
vcscsiStats also provides the seek distance (in terms of the number of logical blocks) between each access. A random data access pattern is characterized by a seek distance of 500,000 or more blocks between each consecutive disk access. As shown in figure 10, data reads during purge2 operation were very random.
Figure 11. I/O access size of purge2 operation
0
400
800
1200
1600
2000
-500
000
-500
00-5
000
-500 -64
-16 -6 -2 0 2 6
16 64
500
5000
5000
0
5000
00
vSCSI Samples
Freq
uenc
y
Seek Distance (sectors)
1600-2000
1200-1600
800-1200
400-800
0-400
0
100
200
300
400
500
600
512
2048
4096
8192
1638
4
4915
2
6553
6
1310
72
5242
88
vSCSI Samples
Freq
uenc
y
I/O Size (bytes)
500-600
400-500
300-400
200-300
100-200
0-100
Performance of Virtualized SQL Server–Based VMware vCenter Database
VMware, Inc 15
The block size of I/O access during purge2 operation was also captured from vcscsiStats. Figure 11 shows the block size of I/O access. As seen in the graph, the size of I/O requests varied during the purge2 operation. The I/O size was predominantly between 16KB and 64KB with few requests being 8KB and between 128KB and 256KB. A block size of 48KB was chosen for the Iometer access profile.
7.2 Experimental Methodology A separate 100GB LUN was created on the RAID group that hosted the LUN containing data and index files of VCDB. This LUN was exposed to both the native and virtual environment (as RDM) used in the earlier experiments. A 48KB, 100% random and 100% read access profile was created in Iometer to simulate the I/O load of a purge2 operation. The number of outstanding I/Os was set to 324
7.3 Results
.
Figure 12 compares the number of I/O operations per second and latency of the I/O operations in a VM to that in a native system. The graphs include performance metrics measured at various layers using different tools. In the native case, the I/O performance was measured in the storage array using Navisphere Analyzer [5], and in the operating system using perfmon and Iometer. In the VM, I/O performance was measured in the storage array using Navisphere Analyzer, in vSphere using esxtop, and in the operating system using perfmon and Iometer.
Figure 12. I/O performance as measured in different layers of storage stack
4 The default device queue depth in a vSphere host is 32. I/O requests will be queued in vSphere host if the number of OIOs to an external logical device (LUN) exceeds 32. To avoid any queuing-related anomaly in the test results, the number of outstanding I/Os was set to 32.
0
400
800
1200
1600
Navi Analyzer Esxtop Perfmon Iometer
I/O p
er s
econ
d
Performance Measurement Layers
Native ESX
Performance of Virtualized SQL Server–Based VMware vCenter Database
VMware, Inc 16
As shown in the top graph in figure 12, the number of I/O operations per second was higher in the VM than in the native system. All the tools used to measure the performance recorded this consistently. However, latency of an I/O operation was lower in native as measured by Navisphere Analyzer compared to that in the VM. But the latency increased by as much as 3.2ms when measured with perfmon in the native system. In the VM, I/O latency as measured with perfmon was very similar to that measured with Navisphere Analyzer.
The additional latency incurred by an I/O operation in the native setup used for the experiments is not clearly understood. This additional latency is believed to have slowed down the I/O read operation which could have led to vCenter stored procedures taking a longer time in the native environment.
0
5
10
15
20
25
Navi Analyzer Esxtop Perfmon Iometer
IO L
aten
cy in
ms
Performance Measurement Layers
Native ESX
Performance of Virtualized SQL Server–Based VMware vCenter Database
VMware, Inc 17
8 References [1] Performance and Scalability of Microsoft SQL Server on VMware vSphere 4 http://www.vmware.com/resources/techresources/10033
[2] SQL Server Workload Consolidation http://www.vmware.com/resources/techresources/1081
[3] Disk Partition Alignment Best Practices for SQL Server http://msdn.microsoft.com/en-us/library/dd758814(SQL.100).aspx
[4] Using vscsiStats for Storage Performance Analysis http://communities.vmware.com/docs/DOC-10095
[5] EMC Navisphere Analyzer Version 6.28.21 Release Notes http://www.emc.com/microsites/clariion-support/pdf/300-007-073.pdf
9 About the Author Chethan Kumar is a senior member of the Performance Engineering group at VMware. His primary focus is performance analysis of database applications on vSphere and performance of the storage stack in vSphere. He has authored several technical papers that have been published in research conferences and in the VMware technical community. He is also a regular contributor to VMware’s performance blog VROOM! and is a presenter at VMworld and other technical conferences.
10 Acknowledgements The author would like to thank Adarsh Jagadeeshwaran and Ravi Soundararajan from the Performance Engineering group for their help in configuring the workload for the experiments. He would also like to thank all the members of the Outbound Performance Engineering team at VMware for their valuable feedback on the paper.
If you have comments about this documentation, submit your feedback to: [email protected]
VMware, Inc. 3401 Hillview Ave., Palo Alto, CA 94304 www.vmware.com