Performance optimisation of the push-belt CVT by variator slip control B. Bonsen*, T.W.G.L. Klaassen, R.J. Pulles, S.W.H. Simons, M. Steinbuch and P.A. Veenhuizen Department of Mechanical Engineering, Technische Universiteit Eindhoven, P.O. Box 513, 5600 MB Eindhoven, The Netherlands E-mail: [email protected]E-mail: [email protected]E-mail: [email protected]E-mail: [email protected]E-mail: [email protected]E-mail: [email protected]*Corresponding author Abstract: Continuously variable transmissions (CVTs) are applied in an increasing number of vehicles. Large ratio coverage allows for reduced engine speeds, which adds to both highway driving comfort and reduced fuel consumption. It becomes increasingly important to further improve the performance in terms of efficiency, robustness and torque capacity of the CVT. This paper describes the possibilities of improving the CVT by minimising variator clamping forces. This is accomplished by using slip control technology. This technique allows for the best possible transmission efficiency, combined with improved robustness for slip damage. This paper first describes the relation between variator slip and functional transmission properties. The conditions for optimum performance regarding efficiency and robustness are identified. This leads to the development of a variator slip controller. The remaining sections describe experimental results on two test rigs and in a production vehicle. The paper concludes with an outlook into further developments. Keywords: control; CVT; efficiency; robustness; slip. Reference to this paper should be made as follows: Bonsen, B., Klaassen, T.W.G.L., Pulles, R.J., Simons, S.W.H., Steinbuch, M. and Veenhuizen, P.A. (2005) ‘Performance optimisation of the push-belt CVT by variator slip control’, Int. J. Vehicle Design, Vol. 39, No. 3, pp.232–256. Biographical notes: Bram Bonsen studied Mechanical Engineering at the University of Twente. He obtained his Masters degree in the Mechanical Automation Group of Prof.dr.ir. J.B. Jonker on a modal reduction method for non-linear finite element methods. He worked two years for Cap Gemini Ernst & Young as a SAP business consultant. Within the department of Control Systems Technology of the Eindhoven University of Technology, he is working on his PhD thesis on modelling and control of slip in the continuously variable transmission (CVT). Tim Klaassen received his MSc degree in Mechanical Engineering from Eindhoven University of Technology, The Netherlands, in March 2002. During his MSc project he studied the motion control of industrial printers Int. J. Vehicle Design, Vol. 39, No. 3, 2005 232 Copyright # 2005 Inderscience Enterprises Ltd.
Transcript
Performance optimisation of the push-belt CVTby variator slip control
B. Bonsen*, T.W.G.L. Klaassen,R.J. Pulles, S.W.H. Simons, M. Steinbuch andP.A. Veenhuizen
Abstract: Continuously variable transmissions (CVTs) are applied in anincreasing number of vehicles. Large ratio coverage allows for reducedengine speeds, which adds to both highway driving comfort and reducedfuel consumption. It becomes increasingly important to further improve theperformance in terms of efficiency, robustness and torque capacity of theCVT. This paper describes the possibilities of improving the CVT byminimising variator clamping forces. This is accomplished by using slipcontrol technology. This technique allows for the best possible transmissionefficiency, combined with improved robustness for slip damage.
This paper first describes the relation between variator slip and functionaltransmission properties. The conditions for optimum performanceregarding efficiency and robustness are identified.
This leads to the development of a variator slip controller. The remainingsections describe experimental results on two test rigs and in a productionvehicle. The paper concludes with an outlook into further developments.
Reference to this paper should be made as follows: Bonsen, B.,Klaassen, T.W.G.L., Pulles, R.J., Simons, S.W.H., Steinbuch, M. andVeenhuizen, P.A. (2005) `Performance optimisation of the push-belt CVTby variator slip control', Int. J. Vehicle Design, Vol. 39, No. 3, pp.232±256.
Biographical notes: Bram Bonsen studied Mechanical Engineering at theUniversity of Twente. He obtained his Masters degree in the MechanicalAutomation Group of Prof.dr.ir. J.B. Jonker on a modal reduction methodfor non-linear finite element methods. He worked two years for Cap GeminiErnst & Young as a SAP business consultant. Within the department ofControl Systems Technology of the Eindhoven University of Technology,he is working on his PhD thesis on modelling and control of slip in thecontinuously variable transmission (CVT).
Tim Klaassen received his MSc degree in Mechanical Engineering fromEindhoven University of Technology, The Netherlands, in March 2002.During his MSc project he studied the motion control of industrial printers
Int. J. Vehicle Design, Vol. 39, No. 3, 2005232
Copyright # 2005 Inderscience Enterprises Ltd.
at Stork Digital Imaging. In April 2002 he started his PhD project atEindhoven University of Technology. In this project he is working on themodelling and control of an electromechanically actuated metal V-belt CVT.
Rob Pulles received his MSc degree in Mechanical Engineering fromEindhoven University of Technology (TU/e), Eindhoven, The Netherlands,in October 2004. During his MSc project he designed and implemented aslip control strategy for a Continuously Variable Transmission. After thathe worked as a visiting scientist at Eindhoven University of Technology inorder to implement this slip control strategy in a production car (NissanPrimera). He now works for the company Drive Train Innovations (DTI)on the identification and control of an Automatic Manual Transmission.
Sjoerd Simons is currently carrying out his MSc project in the MechanicalEngineering Department of the Eindhoven University of Technology (TU/e), Eindhoven, The Netherlands. In his MSc project he has implemented aslip control strategy in a production car (Nissan Primera) and furthermorehe is optimising the slip control strategy for transient operating modes ofthe Continuously Variable Transmission.
Maarten Steinbuch received the MSc and PhD degrees in MechanicalEngineering from Delft University of Technology in 1984 and 1989respectively. From 1987±1999 he was with Philips Electronics. Since 1999 hehas been full professor and head of the Control Systems Technology groupwithin the Mechanical Engineering Department, Eindhoven University ofTechnology. His research interests are modelling and control of automotivepower trains and motion systems. He was an associate editor of the IEEETransactions on Control Systems Technology, IFAC Control EngineeringPractice and IEEE Control Systems Magazine. He is currently editor-at-largeof The European Journal of Control.
Bram Veenhuizen received his MSc degree in Experimental Physics fromthe Free University of Amsterdam in 1984 and his PhD from the Universityof Amsterdam in 1988. After employment by SKF (1988±1995) and vanDoorne's Transmissie (1995±2002) he joined the Eindhoven University ofTechnology. Here he is responsible for research on automotive powertrains, focusing on V-belt type Continuously Variable Transmissions andAdvanced (hybrid) power trains. His professional interest is in automotivedrive train systems and the implementation of academic research in theautomotive industrial environment.
1 Introduction
Continuously variable transmissions (CVTs) are increasingly used in automotiveapplications. They have an advantage over normal automatic transmissions, due totheir very large ratio coverage and absence of comfort issues related to shifting eventsas they occur in automatic transmissions. This enables the engine to operate at moreeconomic operating points. Despite these advantages, V-belt type CVTs still haverather large potential in transmission efficiency. Also torque capacity (currently atabout 350Nm) needs expansion.
The main reason for the low efficiency of modern production CVTs is the highclamping forces in the variator necessary to transfer engine torque. To prevent beltslip at all times, the clamping forces in modern production CVTs are usually much
Performance optimisation of the push-belt CVT by variator slip control 233
higher (typically 30% or more) than needed for normal operation. Higher clampingforces result in additional losses in both the hydraulic and the mechanical system.This is due to increased pump losses and friction losses because of the extramechanical load that is applied on all variator parts. Excess clamping forces alsoreduce the endurance life of the V-belt type element, since the net pulling force in thiselement is larger than strictly necessary for the transfer of engine power. Also thecontact pressure between V-belt and sheaves is higher than strictly necessary, leadingto increased wear. This excess loading leads to heavier components, therebycompromising power density.
Reducing clamping forces, therefore, leads to improvements in various designareas: increase in transmission efficiency, increased torque capacity, reducedmaximum hydraulic pressure and improved power density (Micklem et al., 1996).Preventing slip damage however, is still an important prerequisite for any clampingforce control, although recent studies indicate that extended slipping between beltand pulley is allowed under certain conditions (van Drogen and van der Laan, 2004).
This paper is subdivided in five major sections:
* Section 2 describes the relationship between variator slip and its functionalproperties, like torque and slip losses and effective friction coefficient.
* Section 3 shows the derivation of a generic simplified model of variator slipdynamics. Some basic insights regarding slip control will be developed here.
* Section 4 describes slip control implementation on a test rig, containing only avariator and two motors for driving and braking, respectively.
* Section 5 shows results obtained with slip control on a dyno, comprising a fulldrive train with commercially available CVT. Efficiency improvement will beshown in this section.
* Section 6 reports on the experience obtained with variator slip controllerimplemented in a production vehicle. Some imperfections of the implemented slipcontroller will be identified.
2 Variator slip and functional properties
This section describes results from an experimental study into the efficiency of thepush-belt variator and its capability to transfer torque. The relationship between beltslip and these functional properties was a particular subject of study.
2.1 Variator losses
Contrary to form closed transmission components like gears, the variator not onlyloses power by torque loss, but slip loss also occurs. Although slip loss is generallymuch smaller than torque loss in a V-belt variator, it cannot be neglected, since sliploss tends to increase when over-clamping is reduced. In the following two sectionsthe methods by which these losses were analysed will be described.
B. Bonsen et al.234
2.1.1 Variator torque loss
Variator torque loss may be defined by:
Tloss � Tp ÿ rs0Ts; �1�with rs0 defined as the speed ratio rs � !s=!p at zero variator output load. Here !p
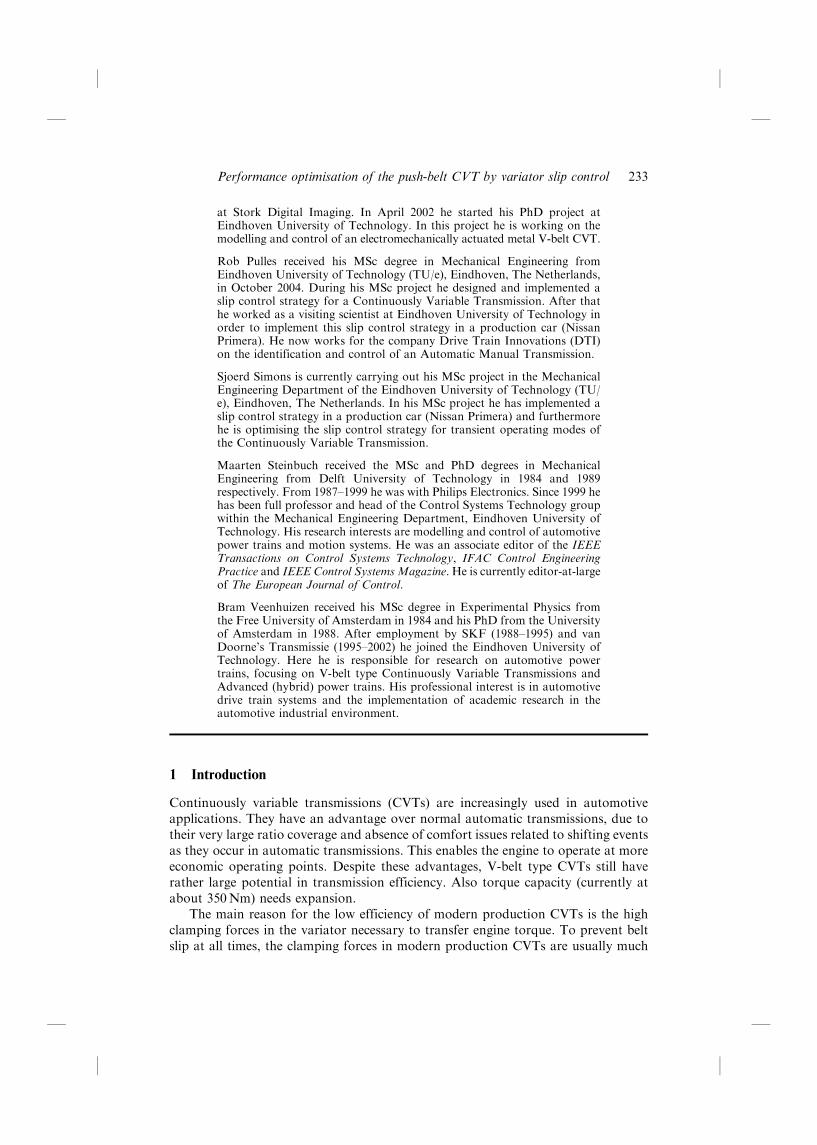
and !s denote the angular speed of the primary and secondary variator shaft,respectively and Tp and Ts represent primary and secondary torque, respectively.This relationship is identical to the one used for gears, except for the assertion thatthe speed ratio should be evaluated at zero load, so as to make sure that slip lossesare excluded from Tloss. Here it is implicitly assumed that the belt running radii donot change when torque is changed. Measurements of Tloss have been carried out ona variator test rig. During the measurements, variator ratio, clamping force and inputtorque were varied. Typical results for three different ratios at a constant secondaryclamping force of 8 kN are given in Figure 1. These measurements show that Tloss isindependent from input torque at constant clamping force, which is in line withliterature data (Ide, 1999).
Figure 1 Typical results of Tloss measurements at three different ratios at secondary clampingforce of 8 kN and 225 rad/sec input speed
2.1.2 Variator slip loss
Variator slip loss may be defined as follows:
!loss � !p ÿ !s
rs0: �2�
A relative slip number can be defined by:
� � !loss
!p� 1ÿ rs
rs0: �3�
For the common case where positive power flows from primary to secondary shaft,the variator efficiency can now be derived:
Performance optimisation of the push-belt CVT by variator slip control 235
� � 1ÿ Tloss
Tp
� �1ÿ !loss
!p
� �: �4�
Neglecting torque loss, the relation between secondary clamping force Fs and inputtorque Tp can be represented by (Vroemen, 2001):
�eff �� � � Tp cos�
2FsRp; �5�
where Rp denotes the belt running radius on the primary sheave and � denotes thepulley wedge angle. This effective friction coefficient or traction coefficient is knownto depend weakly on ratio, clamping force and shaft speeds, but depends strongly onthe amount of slip. Figure 2 shows how �eff and variator efficiency � depend on slipat fixed ratio and clamping force Fs. The safety factor can be defined by
Sf��� � �eff max=�eff���; �6�where �eff max represents the maximum value of �eff that is obtained for all positivevalues of �. A high safety factor indicates that the clamping force is much larger thannecessary to transfer the input torque. A high value for Sf is associated with very lowslip and also low values for �eff, as can be concluded from Equation (6). As can beseen in Figure 2, the maximum efficiency is attained at, or very close to, the slip valuewhere the traction curve suddenly changes slope. This is the slip value where �eff isvery close to �eff max and slip has a low value. This leads to the conclusion that inorder to obtain the best possible transmission efficiency, slip must be controlled veryclose to Sf � 1. In contrast, in production CVTs, the over-clamping factor Sf rarelyexceeds 3 to 5 under part load conditions. Close inspection of Figure 2 indicates thatin overdrive at Sf � 1, the efficiency reaches 94%, whereas at Sf � 3, the efficiencycomes down to 82%.
Figure 2 Efficiency � and effective friction coefficient �eff vs slip � measured at input speed of300 rad/sec for variator ratios low (0.43), medium (1) and overdrive (2.25). The slipvalues at which variator efficiency reaches its maximum are indicated
B. Bonsen et al.236
Regarding robustness for shock loads, if Sf > 1 the transferable torque will increasewhen the amount of slip is suddenly increased, for instance by driving over a bump inthe road. For this no control action is needed. If, however, this slip increase occurswhen Sf � 1, slip will increase without limit, possibly leading to severe variatordamage. This can only be prevented if a quick control action is taken, by which theclamping force is increased to fit the required torque level. It must be noted here thatlimited excursions into the macro-slip area may be allowed for the push-belt variator,as indicated in van Drogen and van der Laan (2004).
In the following sections approaches to slip control are presented, which allow thevariator to be operated at Sf � 1 while guaranteeing robustness for shock loads.
3 Modelling slip dynamics
For controller development, the torque generated on both shafts of the variator canconveniently described on the basis of Equation (5):
Tp;s � 2Fs� �� �Rp;s
cos�: �7�
Note that by using this description, torque losses are neglected. Although this limitsmodel accuracy, the effect of torque loss is assumed to be small and not significantfor the description of the variator dynamics. It is also assumed that speed ratiochanges due to the axial motion of the variator sheaves are much smaller than thoseassociated with slip. This assumption may impose limitations on the control strategyderived below, for those cases where fast ratio changes occur. This assumption allowsthe contribution of _rs0 to _� to be neglected. The slip dynamics can now be derivedusing Equation (3) and Rs � !p=!s, resulting in
_� � ÿ _rsrs0
�8�
_rs � _!s !p ÿ !s _!p
!2p
: �9�
The dynamics of the variator as shown in Figure 3 can now be described by
_!p � Te ÿ Tp
Je�10�
_!s � Ts ÿ Td
Js: �11�
Substituting Equations (7), (10) and (11) into Equation (9) leads to:
_� � 1
!pÿ 2FsRs� �� �
cos �� �Jsrs0 �Td
Jsrs0
� �� 1ÿ �� �
!pÿ 2FsRsrg� �� �
cos �� �Je � Te
Je
� �: �12�
Performance optimisation of the push-belt CVT by variator slip control 237
Figure 3 CVT dynamics
This equation is non-linear in � and will be linearised around different operatingpoints. With the linearised model, a state space representation will be derived(Klaassen et al., 2004). Firstly, the effective friction coefficient is taken piecewiselinear as indicated in Figure 4. The sections of the curve where the traction isincreasing with increasing slip is the so-called microslip area, since this only occurs atvery small values for slip. These are Sections II and III in Figure 4. The part of thetraction curve where the traction is almost constant or slightly decreasing with slip,shown as Sections I and IV in Figure 4, is called the macro-slip area. Indicating thedifferent regions with index i, the traction coefficient can be represented by:
� �� � � k1;i� � k2;i: �13�
Figure 4 Traction coefficient measured at 300 rad/s (dots), compared to the model anddivided into four sections, representing the piecewise linear approximation(line segments)
Defining the state space as x � � and u � �Fs Te Td�T the system can be linearisedaround a certain operating point x � �0, resulting in the linear system:
_x � Ax� Bu; �14�
B. Bonsen et al.238
where x � xÿ x0 and u � uÿ u0. The linearised matrices A and B can now bederived (assuming �0 � 1 and neglecting higher order terms):
A � ÿ2Rs0F0k1i0!p0Jt0 cos�
with Jt0 � rs00Je� 1
Jsrs00
� �ÿ1; �15�
and
B � 1
!p0
ÿ2Rs0� �0� �Jt0 cos�
1
Je
1
Jsrs00
2666666664
3777777775
T
: �16�
The derived linearised system will be used for controller design. The system matrix Aindicates that stability requires k1i0 to be positive. This is only the case in the micro-slipregion, which is the main reason for its common use in production CVTs. A controlaction is needed in order to stabilise the system in the macro-slip region. The modelhas three inputs, but only the clamping force Fs can be controlled on implementation.In a vehicle application, the input torque Te is controlled by the driver via the throttlepedal and the output torque Td is determined by road conditions. Therefore theymust be regarded as disturbances acting on the system. An example of a controllerwill be given later in Section 4.
In order to control slip, it must be measured accurately. Measuring slip on similarforce closed components like wet plate clutches can be carried out easily, by measuringthe speed difference of the in- and outgoing shafts. For a pushbelt variator, rs0 mustalso be known, as can be seen from Equation (3). This quantity rs0 is not directlyavailable when the variator is loaded. If the variator geometry is assumed not tochange when the torque is varied, rs0 may be estimated from a measurement of theposition of a moveable sheave. The geometric ratio rg, reconstructed from a lineardisplacement sensor is correlated to rs0 for all relevant operating conditions. Sinceeven small offsets in slip due to temperature changes or elastic deformations due toclamping force variation will cause severe control errors, all these effects must betaken into account in the calibration phase. Later sections will give additional detailon the measurement methods employed. It is important to mention a slip detectiontechnique for a V-belt variator as it was reported in (Faust et al., 2002). In thistechnique the response of the variator in- and output speeds is detected when acylinder pressure is excited with a sinusoidal excitation. This method has theimportant advantage that it does not rely on very accurate measurements, but on asignal that is directly proportional to slip. However, it must be expected that themethod is not sensitive to changes in slip in the macro-slip region.
4 Slip control implementation on a test rig
The first attempt for slip control was carried out on the test rig shown in Figure 5 andschematically represented in Figure 6 This test facility comprises two identicalasynchronous electric motors with the following specification: Maximum power:
Performance optimisation of the push-belt CVT by variator slip control 239
78 kW, maximum torque: 298Nm and maximum speed: 525 rad/sec. The pressures inthe hydraulic cylinders of the variator could be controlled independently. The beltslip measurement system comprises three elements, two rotary encoders on both theinput and output shaft, and a linear encoder on the secondary pulley position.
Figure 5 Test setup as used in the experiments
Figure 6 Layout of the test setup
Table 1 Measurement equipment for angular speeds and sheave position
Measurement Sensor Resolution
Sec. pulley position Heidenhain ST3078 1�m
Angular velocity Heidenhain ERN 1381 1/2048 rad
Torques HBM T20WN 200Nm 0.2Nm
B. Bonsen et al.240
This system is accurate enough to detect 0.1% slip, at normal operating speeds. Asixth order polynomial is used to approximate rs0 as a function of the secondarypulley position as measured with the linear encoder. These measurements areperformed by quasi- statically changing the ratio from low ratio to overdrive ratioand back at 5 kN secondary clamping force with zero output torque. A least squaresmethod is used to fit the polynomial through the measured data. The oil sumptemperature is controlled at 80�C. In this setup, the effect of elastic pulleydeformation was found to be small enough to allow it to be ignored.
For the measurement of the pulley position contact is needed between the sensorand the rotating pulley. The environment in the transmission causes problems withcontact-free methods and limits the space available to the sensor equipment. Thepulley position is measured at the outer rim of the pulley, therefore the position ofthe pulley has to be adjusted for elastic deformation of the pulley itself. This isaccomplished by carrying out the calibration process at different clamping force levels.The accuracy that can be achieved with this system is 0.1% with !p � 50 rad/sec andbetter for higher values of !p.
4.1 Controller design
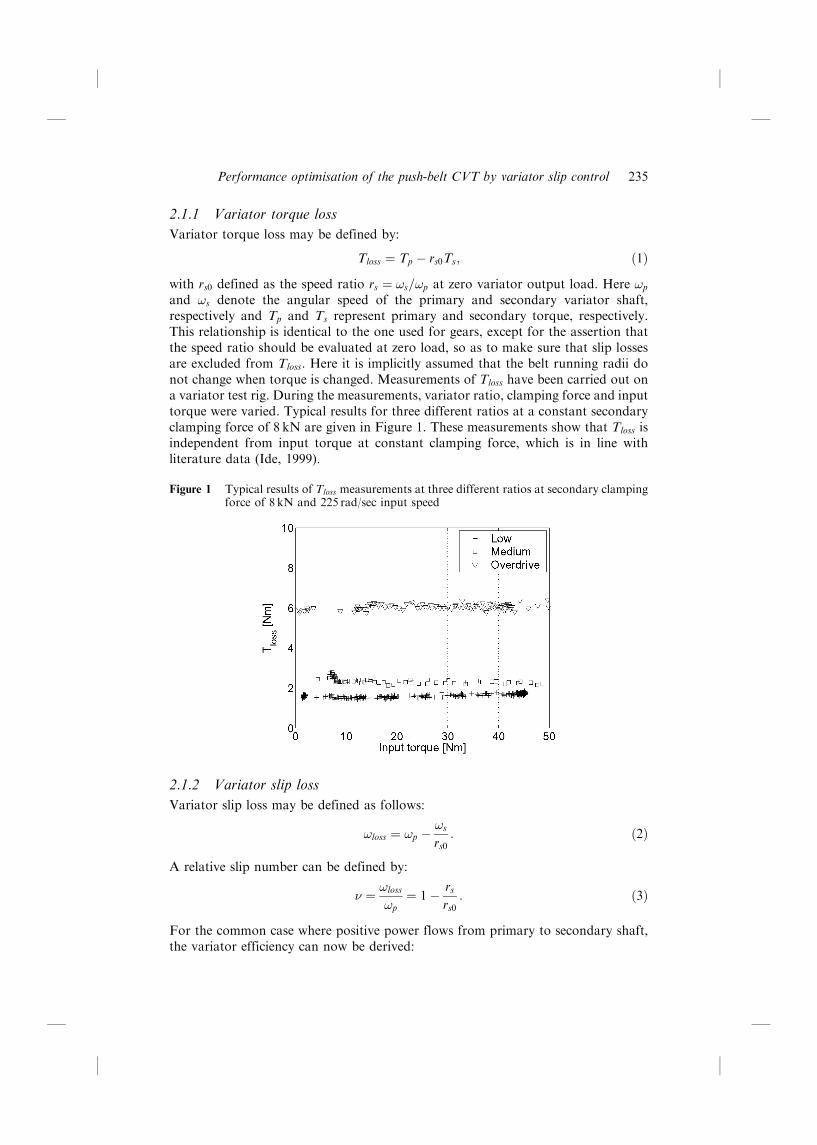
The control system consists of three independent controllers, angular speed control,ratio control and slip control. The control scheme is presented in Figure 7. Thenon-linear function N uses the measured output from plant P to calculate slip andgeometric ratio for the feedback loop. In plant P F and �F are transformed to aprimary and secondary pressure, which is, in turn, used in the hydraulic actuationsystem of the variator. This transformation takes both centrifugal forces in the oil aswell as a spring force into account, if a spring is present.
Figure 7 Control approach
The controllers are designed independently although there are some interactions. Theinfluence of the various controllers is examined below.
Performance optimisation of the push-belt CVT by variator slip control 241
4.1.1 Angular speed control
Angular speed is controlled using the motor torque input signal. PI control is used tocontrol the motor speed. The integral term is used to eliminate steady-state errors.The proportional feedback is used to make the system asymptotically stable.
The following control law is used for speed control:
Te � Pv � Ivs
� �!ref ÿ !p
ÿ �: �17�
4.1.2 Ratio control
The ratio of the variator depends on the balance of the primary and secondaryclamping force. If the primary and secondary clamping force are in balance, the ratiois constant. If an extra clamping force is applied to either the primary or secondarypulley, the variator will shift. It is not recommended to decrease the clamping force atone side, because this will increase the slip in the variator and, therefore, the influenceon the slip controller would be destabilising. Because the balance will shift,depending on the operating point of the variator, a certain interaction will still exist.Because the equilibrium of forces in the belt changes for different levels of slip in themicro-slip area and only slightly in the macro-slip area, the influence of the slipcontrol on the ratio control will be small in the macro-slip area. The followingcontrol law is used for ratio control:
�F � Pr � Irs
� �rref ÿ rgÿ �
: �18�
The shifting process in the variator exhibits a lot of damping, therefore no separatedamping term is needed. Because the damping is high, the maximum bandwidth thatcan be reached is about 1Hz. The integral term is used to establish the balance in acertain operating point, since the primary and secondary clamping force are almostnever equal to each other in the variator. In the future a feed-forward controller canbe used to compensate for the balancing problem.
4.1.3 Slip control
Slip in the system is controlled using the clamping force level. Other options are tocontrol the input torques or the ratio to maintain a certain slip level. Controlling slipby the input torques is not a feasible solution, because the drive line side of thevariator is not controllable in an automotive application. When the slip is controlledusing the geometric ratio the system would be too slow, because of the slownessinvolved with shifting the variator. Also the control range of the ratio is limited. Thiscould cause very high amounts of slip when the system has reached its limit.
For operating points where k1i is zero or negative, i.e. the macro-slip area, thecontroller has to stabilise the system without destabilising the system in the othersituations. The purpose of the slip controller is to operate the variator in the optimaloperating point, which is a slip level depending on the ratio the variator is in. Therange is between 1 and 3% slip. Since the application of this system is mainly inautomotive applications, it is assumed that the road load torque Td is notcontrollable.
B. Bonsen et al.242
The clamping force level is controlled by controlling the pressure in the hydrauliccylinders. At the same time the ratio is controlled by controlling the differencebetween the primary and secondary clamping force. To minimise the effect of the slipcontrol on the ratio controller and vice versa, the slip controller gives the minimumclamping force needed and the ratio controller the clamping force difference. Fromthese values the primary and secondary clamping forces and, therefore, the pressurescan be derived.
: �19�The function �c��� is shown for two values of �ref in Figure 8, together with theoriginal traction curve, �eff ���. The system will be stable if the traction curve iscontinually increasing for all increasing values of � for which j � j > j �ref j is true. Asis shown in Figure 8 this is possible with the proposed feedback controller for valuesof P� > 0. For values of � for which j � j <� j �ref j, Equation (19) ensures that aminimum clamping force level Fmin will be applied.
Figure 8 Traction curve and the feedback strategy at �ref � 0% and at �ref � 2%
4.1.4 Process analysis
The sensitivity of the controlled system was measured by adding bandlimited noise tothe controller output signal. By estimating the transfer function of the noise to theplant input signal an estimate for the sensitivity is obtained. The plant characteristics
can be deduced from the sensitivity function with P � 1ÿ S
SC. The measured
sensitivity of the system for the clamping force control is given for 0.5% slip inFigure 9. The ratio of the CVT was near overdrive �rs � 2�. The primary speed was50 rad/sec. The sensitivity for 0.5% slip is low for very low frequencies and has a dipat 1.5Hz.
Performance optimisation of the push-belt CVT by variator slip control 243
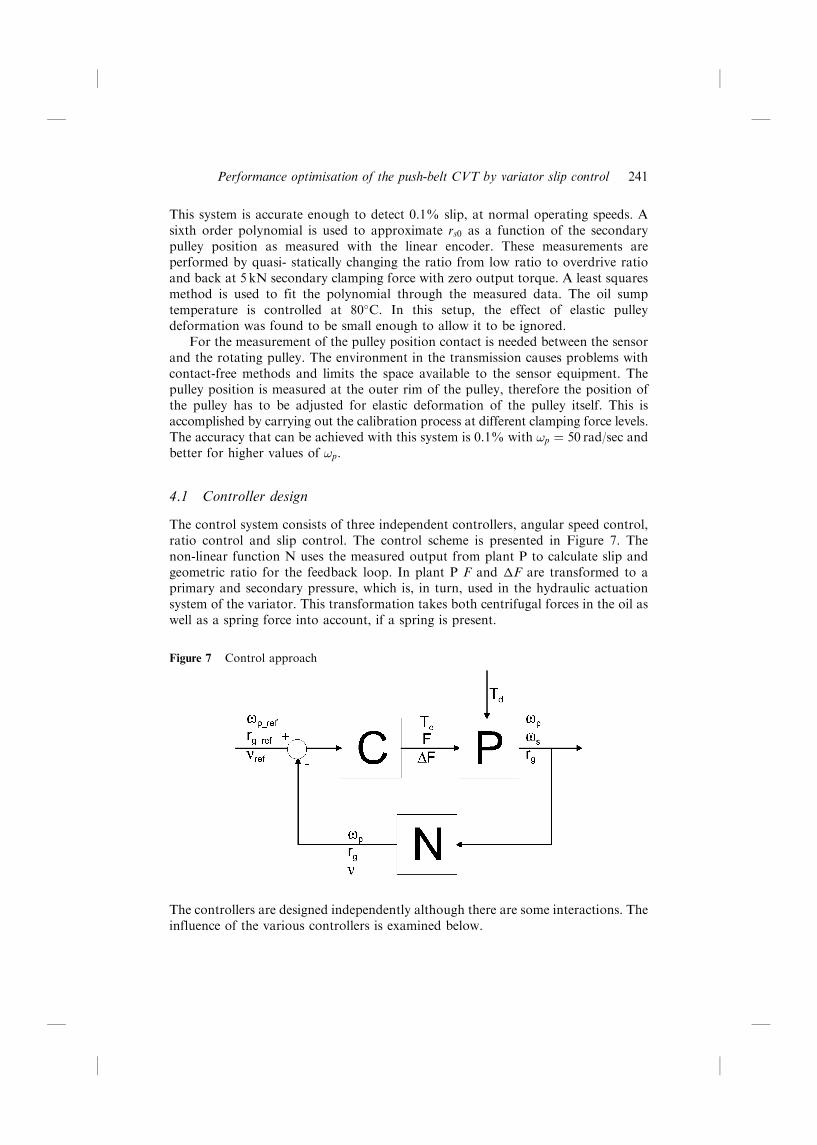
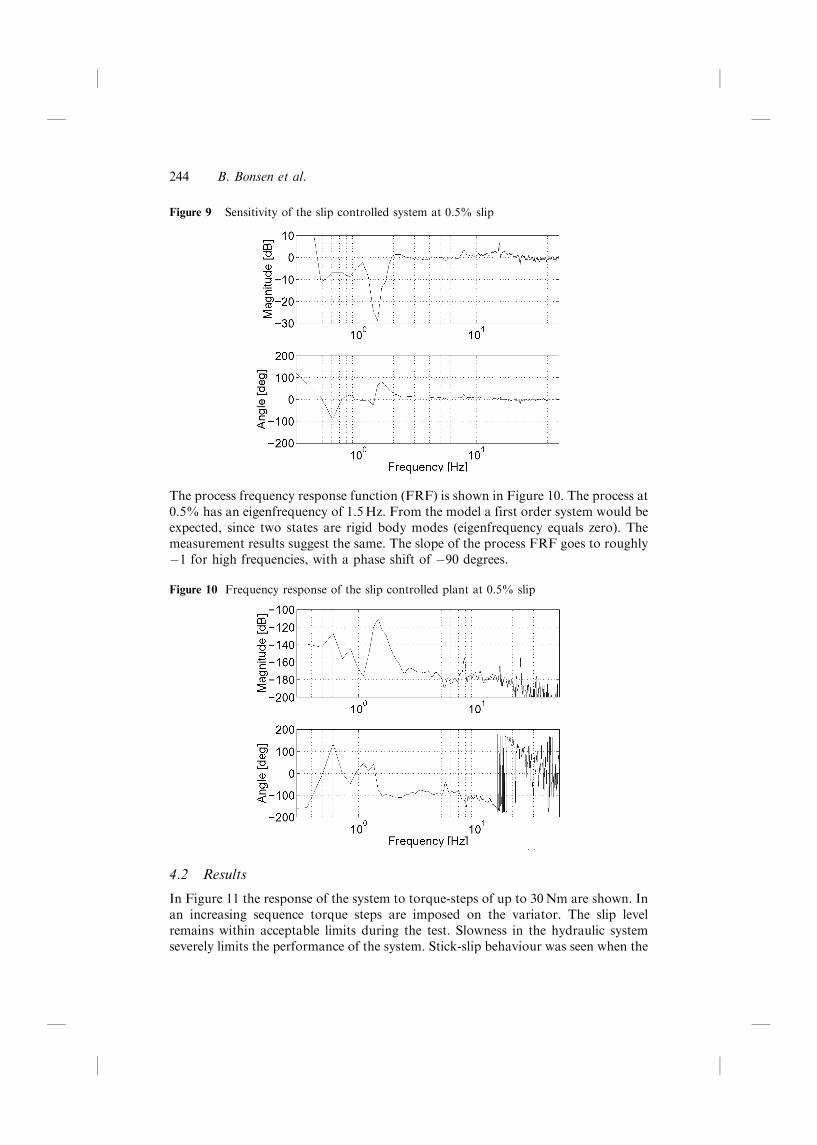
Figure 9 Sensitivity of the slip controlled system at 0.5% slip
The process frequency response function (FRF) is shown in Figure 10. The process at0.5% has an eigenfrequency of 1.5Hz. From the model a first order system would beexpected, since two states are rigid body modes (eigenfrequency equals zero). Themeasurement results suggest the same. The slope of the process FRF goes to roughlyÿ1 for high frequencies, with a phase shift of ÿ90 degrees.
Figure 10 Frequency response of the slip controlled plant at 0.5% slip
4.2 Results
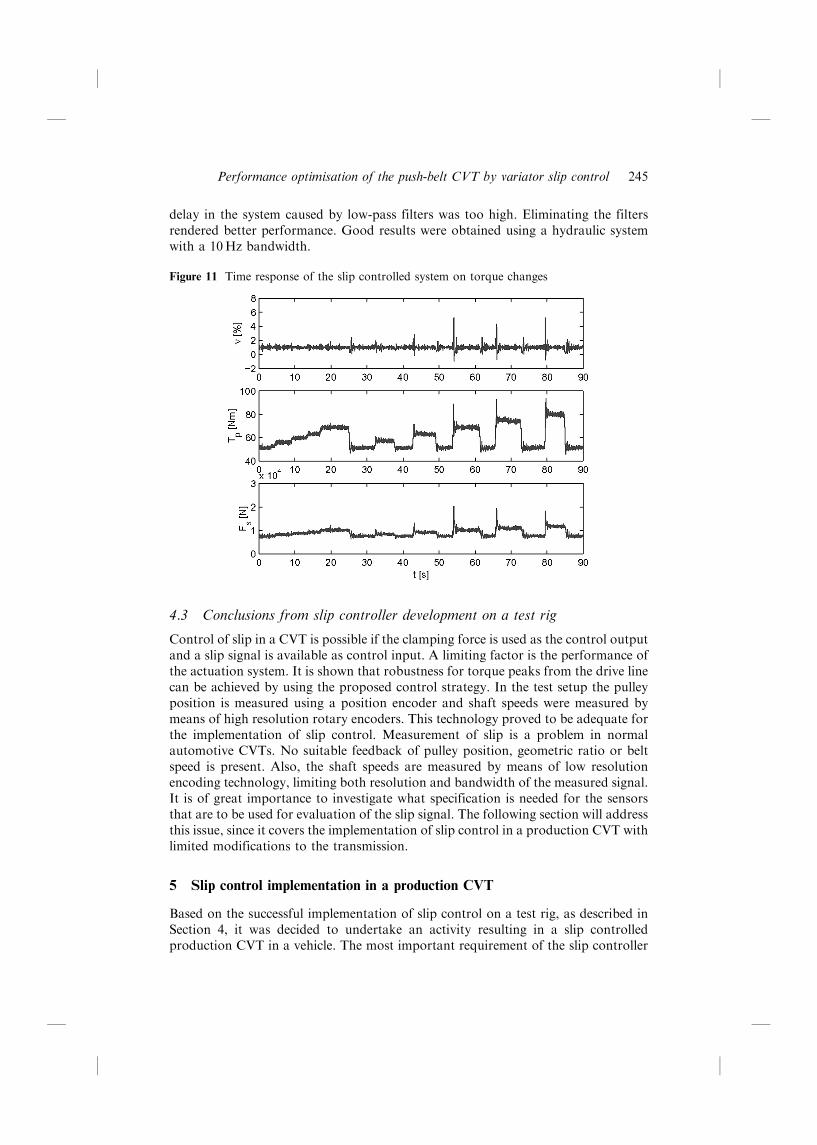
In Figure 11 the response of the system to torque-steps of up to 30Nm are shown. Inan increasing sequence torque steps are imposed on the variator. The slip levelremains within acceptable limits during the test. Slowness in the hydraulic systemseverely limits the performance of the system. Stick-slip behaviour was seen when the
B. Bonsen et al.244
delay in the system caused by low-pass filters was too high. Eliminating the filtersrendered better performance. Good results were obtained using a hydraulic systemwith a 10Hz bandwidth.
Figure 11 Time response of the slip controlled system on torque changes
4.3 Conclusions from slip controller development on a test rig
Control of slip in a CVT is possible if the clamping force is used as the control outputand a slip signal is available as control input. A limiting factor is the performance ofthe actuation system. It is shown that robustness for torque peaks from the drive linecan be achieved by using the proposed control strategy. In the test setup the pulleyposition is measured using a position encoder and shaft speeds were measured bymeans of high resolution rotary encoders. This technology proved to be adequate forthe implementation of slip control. Measurement of slip is a problem in normalautomotive CVTs. No suitable feedback of pulley position, geometric ratio or beltspeed is present. Also, the shaft speeds are measured by means of low resolutionencoding technology, limiting both resolution and bandwidth of the measured signal.It is of great importance to investigate what specification is needed for the sensorsthat are to be used for evaluation of the slip signal. The following section will addressthis issue, since it covers the implementation of slip control in a production CVT withlimited modifications to the transmission.
5 Slip control implementation in a production CVT
Based on the successful implementation of slip control on a test rig, as described inSection 4, it was decided to undertake an activity resulting in a slip controlledproduction CVT in a vehicle. The most important requirement of the slip controller
Performance optimisation of the push-belt CVT by variator slip control 245
is that it has the ability to attenuate the load disturbances caused by torque peaks inthe drive line. An additional problem in the controller design process is that the slipdynamics change for different values of ratio and angular speed. The system thatcontrols the clamping force will be shown to have somewhat lower bandwidth ascompared to the case described in Section 4. A robust gain-scheduled controller istherefore desirable, which can adapt the control parameters, depending on ratio andspeed. To meet all requirements, a synthesis method for robust PI(D)-controllerswith optimal load disturbance response is used (Panagopoulos et al., 2002). Thedesigned slip controller is simulated and subsequently tested on a test rig.
5.1 Modelling actuation system dynamics
The clamping force in the Jatco CK2 is applied using hydraulic pressure cylindersattached to the movable pulleys (Abo et al., 1998). The oil pressure in the cylinders isregulated by a complex electro-hydraulic actuation system that is controlled by aPWM-based solenoid. The duty cycle of the PWM-signal determines the oil pressurethat provides the clamping force, or the line pressure. The line pressure in the CK2 islimited between 0.66 and 4.2MPa, between these values the pressure variespractically linear with the duty cycle. Modelling this electro-hydraulic system is acomplex and time-consuming task, therefore the system's dynamic response isdetermined using Frequency Response Function (FRF) measurements. A goodestimation of the system's response will then be used in the controller design process.For the FRF-measurements, the duty cycle of the solenoid is taken as the input andthe line pressure as the output. The measurements were performed at differentpressures, ratios and engine speeds. All measurements showed practically identicalsystem responses, only with slightly different gains for low frequencies, but smallenough to be neglected. Figure 12 shows the result of one of the FRF-measurements.
Figure 12 Measured and estimated FRF of the line pressure circuit in the Jatco CK2
B. Bonsen et al.246
The system is estimated with a third order low-pass filter with a cut-off frequency of6Hz, which is also plotted in the figure. The frequency of the PWM signal is 50Hz,this causes a peak in the FRF. Because the bandwidth of the system is much lowerthan 50Hz it is not taken into account in the estimation.
5.2 Slip controller design
5.2.1 The control design problem
With the linearised model of the slip dynamics as described in Section 3 and theestimated transfer function of the actuation system a slip controller can be designed.Using Equations (15) and (16) the variables that influence the slip dynamics the mostcan be found. There is a large difference in the system response between the micro- andmacro-slip region. For slip control design, attention is mainly focused on the macro-slipregion. In this region, ratio and primary speed have the greatest influence on thedynamics. A gain scheduled controller is designed by linearising the slip dynamics ina number of operating points and by calculating the controller parameters for eachoperating point. As mentioned above, the slip controller requires good loaddisturbance attenuation and must be robust to deal with model uncertainties. Forthis purpose a gain-scheduling PID-controller was proposed. However, due to thelarge amount of measurement noise in automotive applications the derivative termcannot be used. Therefore a gain-scheduling PI-controller is proposed, as shown inFigure 13. As can be seen, the gain is scheduled based on primary speed, ratio andslip. Slip is used to determine whether the system is in the micro- or macro-slipregion. The setpoint also varies with the ratio, since the maximum traction coefficientis reached for different slip values, depending on the ratio, as can be seen in Figure 2.
Figure 13 Proposed gain scheduling PI slip controller
5.2.2 Robust PI-controller synthesis method
To design controller parameters easily for multiple operating points, while meetingboth design requirements, a synthesis method for robust PI(D)-controllers withoptimal load disturbance response is used (Panagopoulos et al., 2002). The method isbased on a constrained optimisation problem that maximises the integral gain of thePI(D)-controller while making sure that the maximum sensitivity is less than aspecified value. Using the maximum sensitivity as the main design parameter, a
Performance optimisation of the push-belt CVT by variator slip control 247
trade-off can be made between load disturbance response and robustness withrespect to model uncertainties. The resulting controller parameters of thisoptimisation process can be obtained graphically for a PI-controller. It produces aseries of ellipses in the controller parameter space, called the k-ki plane, for differentfrequencies of the system. These ellipses represent a boundary for the sensitivityconstraint, and together they form a boundary surface in the k-ki plane. Choosingcombinations of k and ki below this surface ensures a stable and robust closed loopsystem. For optimal load disturbance attenuation, the maximum value of the integralgain is determined from the figure. The proportional gain is then determinedgraphically. Figure 14 shows a typical result of the synthesis method. Using this synthesismethod for different ratios in the micro- and macro-slip region, the gain-schedulingscheme presented in Table 2 is obtained.
Figure 14 Example of the sensitivity constraint in k-ki plane
Table 2 Controller parameters for various operating points
Micro-slip region Macro-slip region
Ratio P-gain I-gain P-gain (@100 rad/s) I-gain (@100 rad/s)
0.43 1.7 30 0.435 1.61
1 1.9 53 0.294 1.087
2.25 3.6 110 0.21 0.772
The differences between the micro- and macro-slip region mentioned above, result invery different values for the controller parameters. This is because the systemdynamics drastically change at the transition from the micro to the macro-slip region.The system matrix A in Equation (14) almost becomes zero in the macro-slip region.This means that a part of the system dynamics disappears, resulting in importantchanges in the systems gain.
B. Bonsen et al.248
Another reason is that in the macro-slip region the gain becomes scalable by theprimary speed. This can be seen in Equation (16), considering the fact that systemmatrix A is practically zero. Therefore the gains in Table 2 for the macro-slip regionare scaled by the primary speed (in rad/sec) in the controller. Based on ratio, slip,and primary speed, the proper controller parameters are used. Between theoperating points shown in Table 1 interpolation will be used. To ensure the stabilityof the controller between these operating points, several measures were taken. In themicro-slip region load disturbance response is not very important since slip will notcause any damage in this region. However, many model uncertainties are present,because the slip dynamics depend on many variables in this region. Therefore amaximum sensitivity of 1.2 is chosen in the controller synthesis method, which isrelatively low. In the macro-slip region a maximum sensitivity of 1.8 is chosen. Thisis much higher since there are fewer model uncertainties in this region and a goodload disturbance response is required. Additionally the worst-case values of thecontroller parameters were taken to ensure stability for every operating point.
5.2.3 Controller implementation
In order to successfully implement the controller described in the previous section, anintegral anti-windup is added. This is necessary because the output of the controlleris limited between the minimum and maximum pressure level of the CK2. To preventslip caused by the engine torque Te a feed forward term is added based on Equation(7), which calculates the minimal clamping force to transmit the given engine torque.The engine torque is estimated using the engine speed and the throttle valve position.This feed forward is needed because the bandwidth of the slip controller is notsufficient to compensate for the fast dynamics of a combustion engine. With theseadditions the slip controller is ready for implementation.
5.3 Results
5.3.1 Test setup
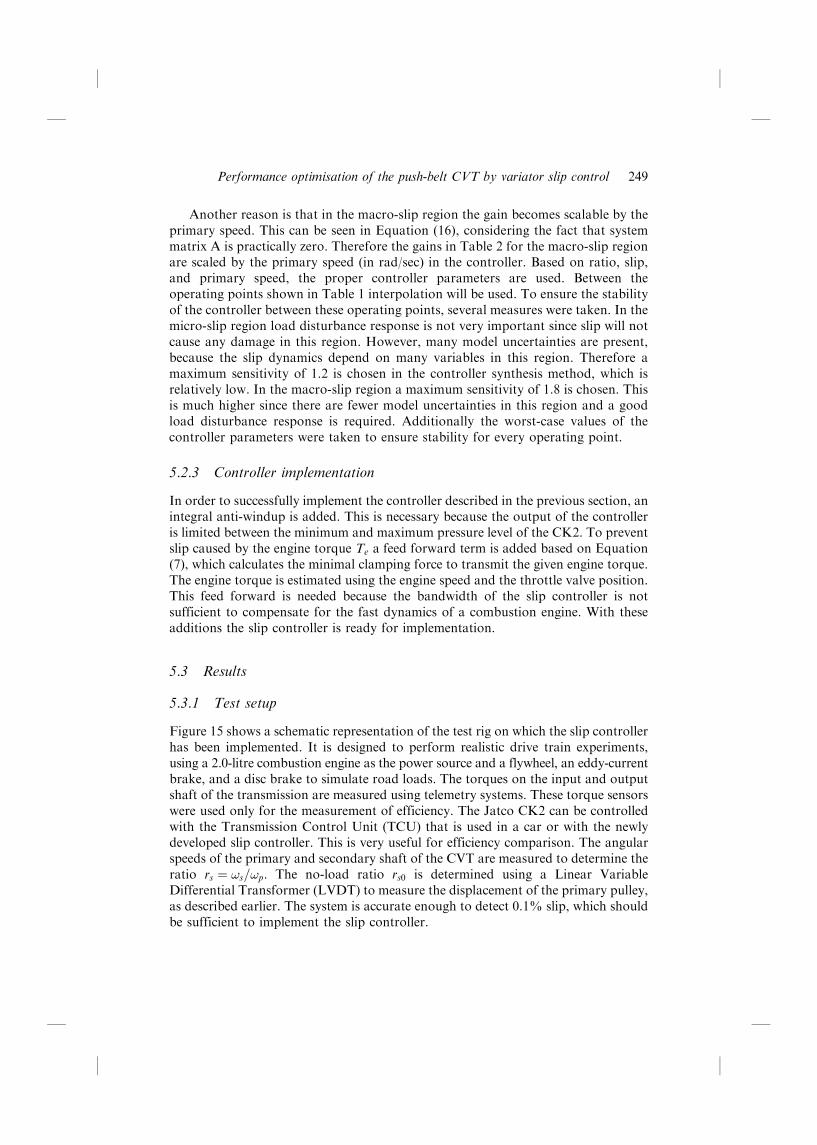
Figure 15 shows a schematic representation of the test rig on which the slip controllerhas been implemented. It is designed to perform realistic drive train experiments,using a 2.0-litre combustion engine as the power source and a flywheel, an eddy-currentbrake, and a disc brake to simulate road loads. The torques on the input and outputshaft of the transmission are measured using telemetry systems. These torque sensorswere used only for the measurement of efficiency. The Jatco CK2 can be controlledwith the Transmission Control Unit (TCU) that is used in a car or with the newlydeveloped slip controller. This is very useful for efficiency comparison. The angularspeeds of the primary and secondary shaft of the CVT are measured to determine theratio rs � !s=!p. The no-load ratio rs0 is determined using a Linear VariableDifferential Transformer (LVDT) to measure the displacement of the primary pulley,as described earlier. The system is accurate enough to detect 0.1% slip, which shouldbe sufficient to implement the slip controller.
Performance optimisation of the push-belt CVT by variator slip control 249
Figure 15 Test rig layout
5.3.2 Efficiency measurements
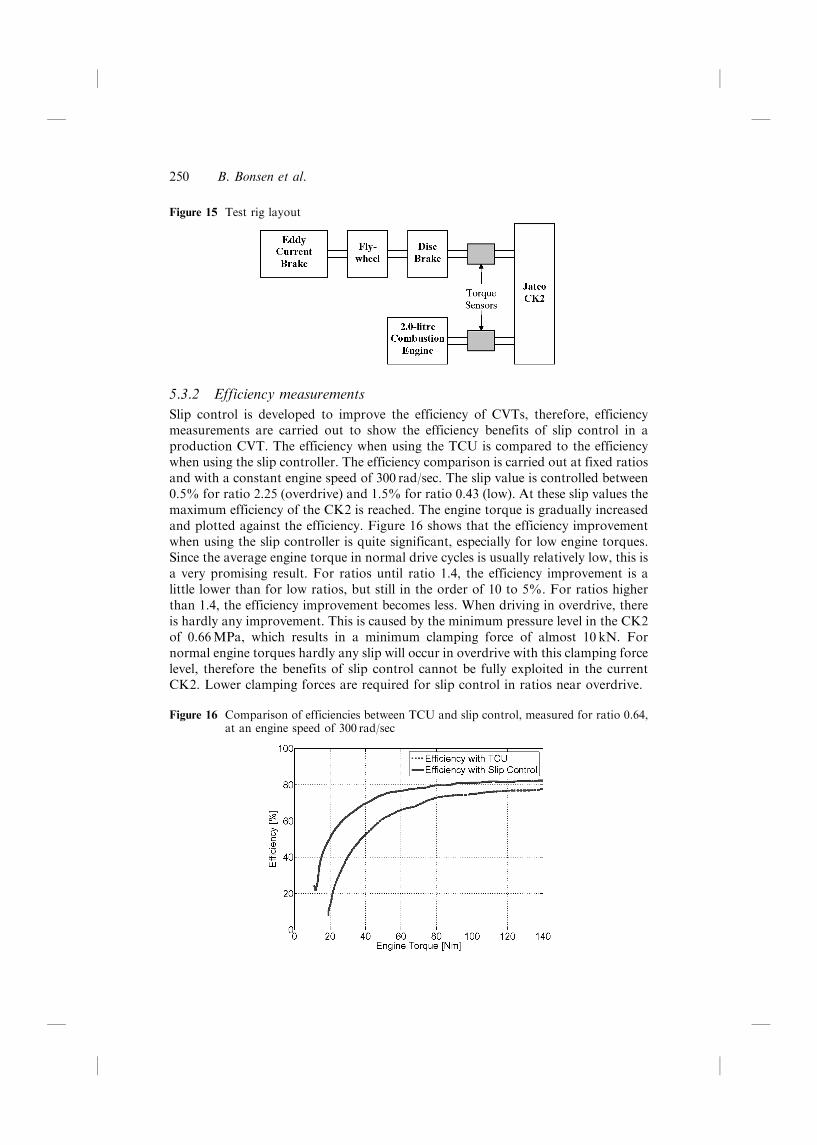
Slip control is developed to improve the efficiency of CVTs, therefore, efficiencymeasurements are carried out to show the efficiency benefits of slip control in aproduction CVT. The efficiency when using the TCU is compared to the efficiencywhen using the slip controller. The efficiency comparison is carried out at fixed ratiosand with a constant engine speed of 300 rad/sec. The slip value is controlled between0.5% for ratio 2.25 (overdrive) and 1.5% for ratio 0.43 (low). At these slip values themaximum efficiency of the CK2 is reached. The engine torque is gradually increasedand plotted against the efficiency. Figure 16 shows that the efficiency improvementwhen using the slip controller is quite significant, especially for low engine torques.Since the average engine torque in normal drive cycles is usually relatively low, this isa very promising result. For ratios until ratio 1.4, the efficiency improvement is alittle lower than for low ratios, but still in the order of 10 to 5%. For ratios higherthan 1.4, the efficiency improvement becomes less. When driving in overdrive, thereis hardly any improvement. This is caused by the minimum pressure level in the CK2of 0.66MPa, which results in a minimum clamping force of almost 10 kN. Fornormal engine torques hardly any slip will occur in overdrive with this clamping forcelevel, therefore the benefits of slip control cannot be fully exploited in the currentCK2. Lower clamping forces are required for slip control in ratios near overdrive.
Figure 16 Comparison of efficiencies between TCU and slip control, measured for ratio 0.64,at an engine speed of 300 rad/sec
B. Bonsen et al.250
5.3.3 Load disturbance measurements
The previous section shows that slip control significantly increases the efficiency of aCVT. This was to be expected, based on previous studies. The next step is to performexperiments where torque peaks are introduced in the driveline, thus testing theperformance of the slip controller with load disturbances. Also interesting in thesetests are the amounts of slip that occur using slip control and whether this damagesthe belt and pulleys. Experiments were performed at fixed ratios and with a fixedengine speed of 200 rad/sec. The slip was controlled at the same values that were usedfor the efficiency measurements. The eddy-current brake provided a constant torquehigh enough to reach a slip value at the transition between the micro and macro-slipregion. Torque peaks were then introduced by suddenly engaging the disc brake.Limitations in the disk brake actuation system restricted the rise time of these torquepeaks, however. Figure 17 shows the result of one of these measurements. The figureshows that the torque peaks cause belt slip, which was expected at the transition ofthe micro- and macro region. But instead of reaching destructive levels, the slip isquickly reduced to non-destructive levels because of the control action.
Figure 17 Slip controller performance with torque peaks acting on the driveline, measured forratio 0.43 (low), at an engine speed of 200 rad/sec
The slip controller is able to deal with torque peaks of up to 1000Nm in the driveshaft, although this causes the slip level to peak above 5% for short periods of time.Visual inspection however, showed that the belt was not damaged after such tests.This would mean that short peaks in slip do not cause belt damage. Additional testsshould be performed to investigate if this is true for all operating points of the CVT.These tests should also include faster disturbances in torque, as they may from roadirregularities. Another important aspect that should be considered is the long-termeffect of slip control with respect to belt damage. If necessary, the bandwidth of thecontroller could be increased to get better load disturbance response, resulting inlower peak values of the belt slip. This can be achieved by improving the gainscheduling scheme with more operating points and using higher maximumsensitivities. If this is not sufficient, an alternative actuation system with a higherbandwidth should be used.
Performance optimisation of the push-belt CVT by variator slip control 251
5.4 Conclusion from slip control implementation in a production CVT
The developed slip controller shows efficiency improvements of the Jatco CK2 of upto 30% at low engine torques. Even larger improvements are expected if lowerclamping forces could be applied, which makes it possible to use the benefits of slipcontrol for higher ratios and even lower engine torques. This should be considered infuture CVT research and design. Using the slip controller it is possible to operate aCVT with minimal clamping forces, while preventing damage to the belt and pulleys.Relatively high slip levels (5±15%), which were present for short periods of timeduring the tests, did not lead to damage to the system. The slip controller is able toattenuate load disturbances of up to 1000Nm in the drive shaft and perhaps evenmore. This is true for the current test conditions, but more research is necessary toinvestigate the long-term effect of using slip control in a wide range of operatingpoints with respect to belt damage.
6 Slip control implementation in a production vehicle
From the experiments on the test rigs it became clear that slip control has greatpotential for both efficiency and robustness improvement of production CVTs. Inorder to perform more realistic experiments, especially with regard to the variatorsrobustness and fuel consumption, the slip controller is implemented in a productionvehicle. The car that is used is a Nissan Primera 2.5i with CK-Kai (very similar toCK2) as presented in Figure 18. It provides a maximum engine torque of 250Nm anddelivers a maximum power of 115 kW. The slip control strategy was identical to theone that was developed on the dyno, as reported in Section 5.
Figure 18 Test vehicle
6.1 System description and requirements
The slip controller was implemented with a dSPACE Autobox. In order to be able tocompare the slip control strategy with the conventional clamping force strategy, aswitch-box was installed. The clamping force was controlled by the slip controller,whereas ratio and torque converter lock-up were controlled by the original TCU.The slip controller was tested on a test track with many different drivers and someresults will be presented below.
B. Bonsen et al.252
6.2 Test track results
The vehicle was tested on the Bosch proving grounds in Boxberg, Germany. Over 50persons drove the car over a handling course to test the slip controller. These testsshowed that under normal driving conditions the slip controller worked perfectly.When driving in a more aggressive way however, the slip controller was not alwaysable to attenuate slip peaks fast enough. This resulted eventually in wear of the beltand pulleys. Figures 19 and 20 show the two major problems that occurred duringthe test drive.
* Closing of the torque converter caused relatively large slip peaks and vibrationsin the drive line. Because the slip controller increases the clamping force withincreasing slip, these slip peaks did not cause damage to the belt and pulleys.The vibrations in the drive line, however, cause a very uncomfortable drivingexperience. Figure 19 shows an example of such a measurement. Opening andclosing of the torque converter cause an important change in the dynamics of thedrive train. This effect should be taken into account for further development.
* Large slip peaks occurred often with fast variator shifts. This is because the slipcontroller was designed for quasi-stationary shifting behaviour (see Section 3).With aggressive driving this assumption becomes invalid since large and fastdownshifts occur with fast variations of the throttle pedal position. Shifting of thevariator can trigger belt slip, as can be seen in Figure 20. Shifting dynamicsshould, therefore, be taken into account for future slip control development.This is especially interesting due to the observation reported in Ide et al. (1996),where it is found that shifting dynamics is enhanced when the variator slips.
Figure 19 Slip peak due to torque converter lockup
Performance optimisation of the push-belt CVT by variator slip control 253
Figure 20 Slip peak associated with a fast downshift
7 Conclusions and recommendations
* Push belt variator slip control is a feasible technology. Stabilisation of slip in themacro-slip regime proved possible.
* Slip control is needed when the best transmission performance in terms ofefficiency and power density are to be obtained.
* Lowering of the belt clamping force to very low values is a prerequisite in order toobtain efficiency improvements under low torque conditions.
* Slip control development requires a good understanding of the functionalproperties of the push belt variator.
* Presentation of slip control in a production vehicle with only minor modifications,proves the viability of this technology also for industrial application.
* Control problems that were identified during test driving, could be attributedto shortcomings in control logic, due to insufficient modelling detail.
* Although slip control showed good functionality in a production vehicle,additional hardware modifications for good performance under more demandingconditions may be necessary.
* Future research must focus on: reduction of clamping forces under low loadconditions, while maintaining a fast hydraulic response; improvement of actuatordynamics; improved slip measurement technology; included shift dynamics in slipdynamics modelling.
B. Bonsen et al.254
Acknowledgements
The authors would like to acknowledge the support obtained from Jatco Japan byproviding test transmissions, spare parts and technical information.
References
Abo, K., Kobayashi, M. and Kurosawa, M. (1998) `Development of a metal belt-drive CVTincorporating a torque converter for use with 2-liter class engines', SAE InternationalCongress and Exposition, Detroit, MI, February 23±26.
Faust, H., Homm, M. and Bitzer, F. (2002) `Wirkungsgradoptimiertes cvtanpresssystem',7. LuK Kolloquium 2002, pp.61±73.
Ide, T. (1999) `Effect of power losses of metal V-belt CVT components on the fuel economy',CVT '99, Eindhoven, The Netherlands.
Ide, T., Uchiyama, H. and Kataoka, R. (1996) `Experimental investigation on shift-speedcharacteristics of a metal V-belt CVT', JSAE No. 9636330.
Klaassen, T.W.G.L., Bonsen, B., van de Meerakker, K.G.O., Steinbuch, M., Veenhuizen, P.A.and Veldpaus, F.E. (2004) `Nonlinear stabilization of slip in a continuously variabletransmission', CCA 2004.
Micklem, J.D., Longmore, D.K. and Burroughs, C.R. (1996) `The magnitude of the losses inthe steel pushing v-belt continuously variable transmission', Proc. Instn Mech Engrs,Part D: Journal of Automobile Engineering, IMechE.
Panagopoulos, H., AÊ stroÈ m, K.J. and HaÈ gglund, T. (2002) `Design of PID controllers based onconstrained optimization', IEE Proc.-Control Theory Appl., Vol. 149, No. 1, January2002.
van Drogen, M. and van der Laan, M. (2004) `Determination of variator robustness undermacro slip conditions for a push belt CVT', SAE World Congress 2004.
Vroemen, B.G. (2001) `Component control for the zero inertia powertrain', PhD thesis,Eindhoven University of Technology.
Nomenclature
I Integral control factor
Je Engine side or primary inertia
Js Vehicle side or secondary inertia
Jt Effective system inertia
Te Engine or drive torque
Tp, Ts Primary, secondary variator torque
Td (Vehicle) drag torque
Tloss Torque loss
Fmin Minimum clamping force
Fs Secondary clamping force
P Proportional control factor
Rp, Rs Primary, secondary belt running radius
Performance optimisation of the push-belt CVT by variator slip control 255
Sf Over-clamping or safety factor
k1, k2 Linear fit coefficients of ����rg Geometric ratio