23
Performance Schema for MySQL Troubleshooting Sveta Smirnova Senior Principal Technical Support Engineer January, 31, 2015
| Date post: | 17-Jul-2015 |
| Category: |
Software |
| Upload: | sveta-smirnova |
| View: | 96 times |
| Download: | 1 times |

Performance Schema for MySQL Troubleshooting
Sveta SmirnovaSenior Principal Technical Support Engineer
January, 31, 2015

OverviewWhat is inside?
• MySQL 5.6I 52 tablesI 554 instrumentsI 31 variables
• MySQL 5.7I 76 tablesI 893 instrumentsI 40 variables
OverviewWhat can you troubleshoot?
• Internal server’s bottlenecks, caused by locks,mutexes, IO
• Less optimal statements• Most expensive operations• Connection issues• Memory usage• Replication failures• More
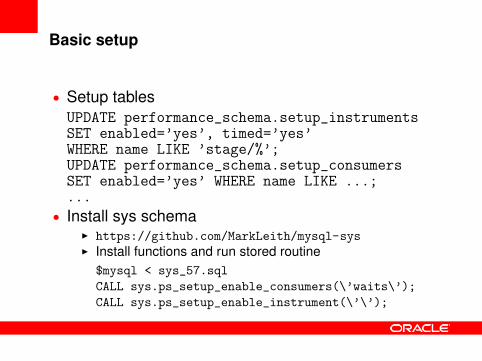
Basic setup
• Setup tablesUPDATE performance_schema.setup_instrumentsSET enabled=’yes’, timed=’yes’WHERE name LIKE ’stage/%’;UPDATE performance_schema.setup_consumersSET enabled=’yes’ WHERE name LIKE ...;...
• Install sys schemaI https://github.com/MarkLeith/mysql-sysI Install functions and run stored routine
$mysql < sys_57.sql
CALL sys.ps_setup_enable_consumers(\’waits\’);
CALL sys.ps_setup_enable_instrument(\’\’);
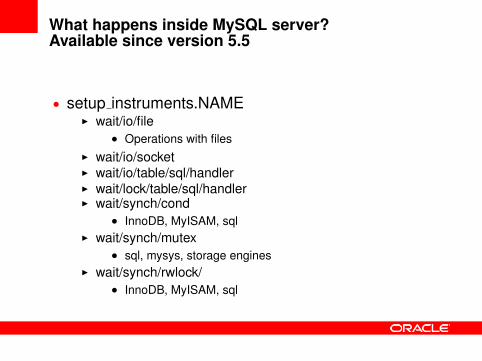
What happens inside MySQL server?Available since version 5.5
• setup instruments.NAMEI wait/io/file
• Operations with filesI wait/io/socketI wait/io/table/sql/handlerI wait/lock/table/sql/handlerI wait/synch/cond
• InnoDB, MyISAM, sqlI wait/synch/mutex
• sql, mysys, storage enginesI wait/synch/rwlock/
• InnoDB, MyISAM, sql

What happens inside MySQL server?Usage example
mysql> ALTER TABLE sbtest ADD KEY(c,pad);...
• Run some load in parallel client• Check Performance Schema using third connectionmysql> SELECT EVENT_NAME, COUNT_STAR,-> AVG_TIMER_WAIT FROM performance_schema.-> events_waits_summary_global_by_event_name-> WHERE count_star>0-> ORDER BY avg_timer_wait DESC, count_star DESC\G
<See next slide>

What happens inside MySQL server?Usage example, page 2
********************** 4. row **********************
EVENT_NAME: wait/io/file/innodb/innodb_temp_file
COUNT_STAR: 3196
AVG_TIMER_WAIT: 13644966830
********************** 5. row **********************
EVENT_NAME: wait/io/file/innodb/innodb_data_file
COUNT_STAR: 32694
AVG_TIMER_WAIT: 2927208612
********************** 6. row **********************
EVENT_NAME: wait/io/file/sql/FRM
COUNT_STAR: 153
AVG_TIMER_WAIT: 751453606
********************** 7. row **********************
EVENT_NAME: wait/synch/rwlock/innodb/index_tree_rw_lock
COUNT_STAR: 1369436
AVG_TIMER_WAIT: 83586370

What happens inside MySQL server?Usage example, page 3
mysql> SELECT file, count_write cw,-> total_written tw-> FROM sys.io_global_by_file_by_bytes-> WHERE count_write>0 ORDER BY count_write DESC;+---------------------------------+-----+---------+| file | cw | tw |+---------------------------------+-----+---------+| @@datadir/sbtest/sbtest.ibd |16830|479.53MiB|| @@datadir/ibdata1 |4072 |372.44MiB|| @@datadir/Innodb Merge Temp File| 1595| 1.56GiB |...
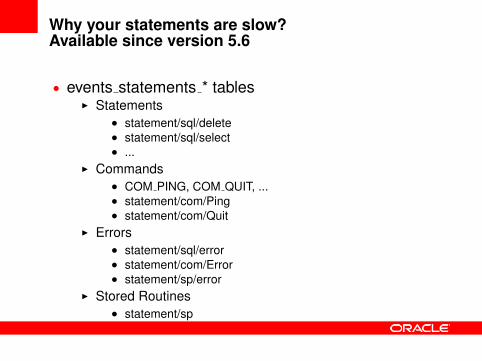
Why your statements are slow?Available since version 5.6
• events statements * tablesI Statements
• statement/sql/delete• statement/sql/select• ...
I Commands• COM PING, COM QUIT, ...• statement/com/Ping• statement/com/Quit
I Errors• statement/sql/error• statement/com/Error• statement/sp/error
I Stored Routines• statement/sp
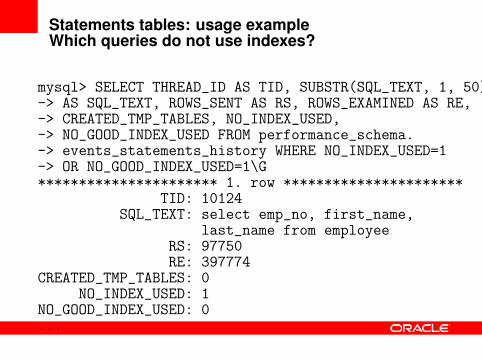
Statements tables: usage exampleWhich queries do not use indexes?
mysql> SELECT THREAD_ID AS TID, SUBSTR(SQL_TEXT, 1, 50)-> AS SQL_TEXT, ROWS_SENT AS RS, ROWS_EXAMINED AS RE,-> CREATED_TMP_TABLES, NO_INDEX_USED,-> NO_GOOD_INDEX_USED FROM performance_schema.-> events_statements_history WHERE NO_INDEX_USED=1-> OR NO_GOOD_INDEX_USED=1\G********************** 1. row **********************
TID: 10124SQL_TEXT: select emp_no, first_name,
last_name from employeeRS: 97750RE: 397774
CREATED_TMP_TABLES: 0NO_INDEX_USED: 1
NO_GOOD_INDEX_USED: 0...
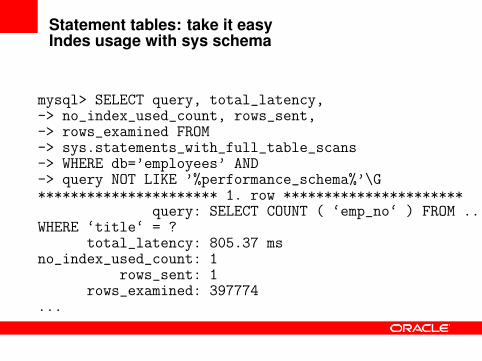
Statement tables: take it easyIndes usage with sys schema
mysql> SELECT query, total_latency,-> no_index_used_count, rows_sent,-> rows_examined FROM-> sys.statements_with_full_table_scans-> WHERE db=’employees’ AND-> query NOT LIKE ’%performance_schema%’\G********************** 1. row **********************
query: SELECT COUNT ( ‘emp_no‘ ) FROM ... ‘emp_no‘ )WHERE ‘title‘ = ?
total_latency: 805.37 msno_index_used_count: 1
rows_sent: 1rows_examined: 397774
...

Statement tablesWhat else is worth attention?
• Field namesI CREATED TMP DISK TABLESI CREATED TMP TABLESI SELECT FULL JOINI SELECT RANGE CHECKI SELECT SCANI SORT MERGE PASSESI SORT SCAN
• Views in sys schemaI statement analysisI statements with runtimes in 95th percentileI statements with temp tablesI statements with sortingI statements with full table scansI statements with errors or warnings

Which operations are most expensive?Available since version 5.6
• events stages * tables• Same information which you see in table
INFORMATION SCHEMA.PROCESSLIST or SHOWPROCESSLIST output
I initI executingI Opening tablesI ...
• Replacement for SHOW PROFILE• Only server-level• No information from storage engine in this table!

events stages * tables: usage exampleWhich states took critically long time?
mysql> SELECT eshl.event_name, sql_text,-> eshl.timer_wait/1000000000000 wait_s-> FROM performance_schema.events_stages_history_long-> eshl JOIN performance_schema.-> events_statements_history_long esthl ON-> (eshl.nesting_event_id = esthl.event_id)-> WHERE eshl.timer_wait > 1*10000000000\G********************** 1. row **********************event_name: stage/sql/Sending data
sql_text: select count(emp_no) from employeesjoin salariesusing(emp_no) where hire_date = from_date
wait_s: 0.81701 row in set (0.00 sec)

events stages * tablesWhat else is worth attention?
• Everything, related to temporary tablesI EVENT NAME LIKE ’stage/sql/%tmp%’
• Everything, related to locksI EVENT NAME LIKE ’stage/sql/%lock%’
• Everything in state ”Waiting for”I EVENT NAME LIKE ’stage/%/Waiting for%’
• Frequently met issues (based on MySQL SupportTeam experience)
I EVENT NAME=’stage/sql/end’I EVENT NAME=’stage/sql/freeing items’I EVENT NAME=’stage/sql/Sending data’I EVENT NAME=’stage/sql/cleaning up’I EVENT NAME=’stage/sql/closing tables’
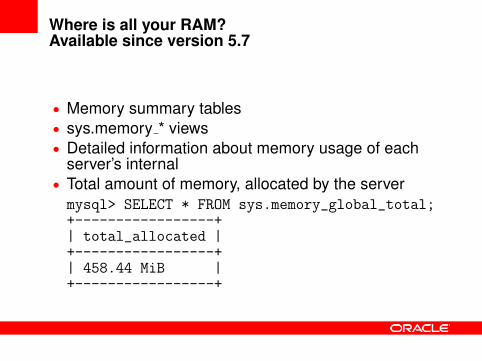
Where is all your RAM?Available since version 5.7
• Memory summary tables• sys.memory * views• Detailed information about memory usage of each
server’s internal• Total amount of memory, allocated by the servermysql> SELECT * FROM sys.memory_global_total;+-----------------+| total_allocated |+-----------------+| 458.44 MiB |+-----------------+

Memory summary tablesUsage example
mysql> SELECT thread_id, user, current_avg_alloc, current_allocated-> FROM sys.memory_by_thread_by_current_bytes-> WHERE thread_id IN 145, 146)\G********************** 1. row **********************
thread_id: 145user: sql/slave_io
current_allocated: 1.04 GiBcurrent_avg_alloc: 2.64 KiB********************** 2. row **********************
thread_id: 146user: sql/slave_sql
current_allocated: 1.79 MiBcurrent_avg_alloc: 72 bytes2 rows in set (0.11 sec)

Memory summary tablesWhat else is worth attention?
• Tables in Performance SchemaI memory summary global by event nameI memory summary by account by event nameI memory summary by host by event nameI memory summary by thread by event nameI memory summary by user by event name
• Views in sys schemaI memory global totalI memory by thread by current bytesI memory by host by current bytesI memory by user by current bytesI memory global by current allocated
What did I miss?You can do even more!
• MDL locks instrumentation• host cache table and all information you need to
troubleshoot connection issues• Replication tables: you don’t need to parse SHOW
TABLE STATUS output in your scripts anymore• Hundreds of instruments• How to tune Performance schema

References
• http://marcalff.blogspot.ru
• https://github.com/MarkLeith/mysql-sys
• http://dimitrik.free.fr/blog/
• http://dev.mysql.com/doc/refman/5.7/en/performance-schema.html
• https://blogs.oracle.com/svetasmirnova/tags/performance_schema
• http://www.slideshare.net/SvetaSmirnova/performance-schema-for-mysql-troubleshooting

Thank you

?

The preceding is intended to outline our general productdirection. It is intended for information purposes only, andmay not be incorporated into any contract. It is not acommitment to deliver any material, code, or functionality,and should not be relied upon in making purchasingdecisions. The development, release, and timing of anyfeatures or functionality described for Oracle’s productsremains at the sole discretion of Oracle.


