47
Performance Tuning best pracitces and performance monitoring with Zabbix Andrew Nelson Senior Linux Consultant May 28, 2015 NLUUG Conf, Utrecht, Netherlands

Performance Tuning best pracitces
and performance monitoring with
ZabbixAndrew NelsonSenior Linux Consultant
May 28, 2015NLUUG Conf, Utrecht, Netherlands

RED HAT | Andrew Nelson2/47
Overview
● Introduction
● Performance tuning is Science!
● A little Law and some things to monitor
● Let's find peak performance
● Conclusion
● Source code availability● Test environment information

RED HAT | Andrew Nelson3/47
$ whoami
● Andrew Nelson
● Senior Linux Consultant with Red Hat North America
● Active in the Zabbix community for approximately 10 years
● Known as “nelsonab” in forums and IRC
● Author of the Zabbix APIRuby library zbxapi

Performance Tuningand SCIENCE!

RED HAT | Andrew Nelson5/47
Performance tuning and the Scientific Method
● Performance tuning is similar to the Scientific method● Define the problem● State a hypothesis● Prepare experiments to test the hypothesis● Analyze the results● Generate a conclusion

RED HAT | Andrew Nelson6/47
Understanding the problem
● Performance tuning often involves a multitude of components
● Identifying problem areas is often challenging
● Poorly defined problems can be worse than no problem at all
These are not (necessarily) the solutions you want.
RED HAT | Andrew Nelson7/47
Understanding the problem
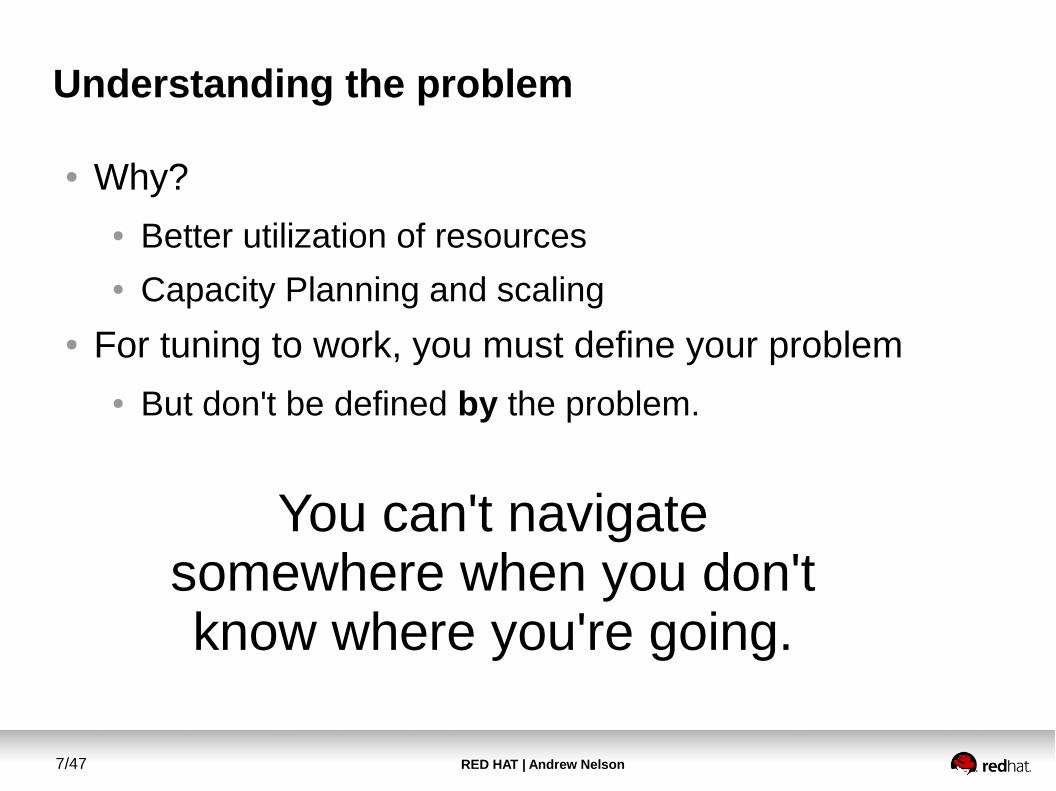
● Why?● Better utilization of resources● Capacity Planning and scaling
● For tuning to work, you must define your problem● But don't be defined by the problem.
You can't navigate somewhere when you don't know where you're going.

RED HAT | Andrew Nelson8/47
Defining the problem
● Often best when phrased as a declaration with a reference
● Poor Examples● “The disks are too slow”● “It takes too long to log in”● “It's Broken!”
● Good Examples● “Writes for files ranging in size from X to Y must take less than
N seconds to write.”● “Customer Login's must take no longer than .5 seconds”● “The computer monitor is dark and does not wake up when
moving the mouse”

RED HAT | Andrew Nelson9/47
Define your tests
● Define your tests and ensure they are repeatable● Poor Example (manually run tests)
1 $ time cp one /test_dir
2 $ time cp two /test_dir
● Good Example (automated tests with parsable output)$ run_test.sh
Subsystem A write tests
Run Size Time (seconds)
1 100KB 0.05
2 500KB 0.24
3 1MB 0.47

RED HAT | Andrew Nelson10/47
Define your tests
● A good test is comprised to two main components
a)It is representative of the problem
b)It has easy to collate and process output.● Be aware of external factors
● Department A owns application B which is used by group C but managed by department D.
● Department D may feel that application B is too difficult to support and may not lend much assistance placing department A in a difficult position.

RED HAT | Andrew Nelson11/47
Perform your tests
● Once the tests have been agreed upon get a set of baseline data
● Log all performance tuning changes and annotate all tests with the changes made
● If the data is diverging from the goal, stop and look closer
● Was the goal appropriate?● Where the tests appropriate?● Were the optimizations appropriate?● Are there any external factors impacting the effort?

RED HAT | Andrew Nelson12/47
Perform your tests and DOCUMENT!
● When the goal is reached, stop● Is there a need to go on?● Was the goal reasonable?● Were the tests appropriate?● Were there any external issues not accounted for or
foreseen?
● DOCUMENT DOCUMENT DOCUMENT
If someone ran a test on a server, but did not log it, did it really happen?

RED HAT | Andrew Nelson13/47
When testing, don't forget to...
DOCUMENT!

RED HAT | Andrew Nelson14/47
Story time!
● Client was migrating from Unix running on x86 to RHEL5 running on x86
● Client claimed the middleware stack they were using was “slower” on RHEL
● Some of the problems encountered● Problem was not clearly defined
● There were some external challenges observed
● Tests were not representative and mildly consistent● End goal/performance metric “evolved” over time● Physical CPU clock speed was approximately 10%
slower on newer systems

RED HAT | Andrew Nelson15/47
More Story time!
● Client was migrating an application from zOS to RHEL 6 with GFS2
● Things were “slow” but there was no consistent quantification of “slow”.
● Raw testing showed GFS2 to be far superior to NFS, but Developers claimed NFS was faster.
● Eventually GFS2 was migrated to faster storage, developers became more educated about performance and overall things are improved.
● Developers are learning to quantify the need for something before asking for it.

A little Law and some things to monitor

RED HAT | Andrew Nelson17/47
Little's Law
● L=λh● L = Queue length● h = Time to service a request● λ=arrival rate
● Networking provides some good examples of Little's Law in action.
● MTU (Maximum Transmission Unit) and Speed can be analogous to lambda.
● The Bandwidth Delay Product (BDP) is akin to L, Queue length

RED HAT | Andrew Nelson18/47
Little's Law
● BDP is defined as: Bandwidth * End_To_End_Delay (or latency)
● Example● 1GB/s Link with 2.24ms Round Trip Time (RTT)● 1Gb/s * 2.24ms = 0.27MB● Thus, a buffer of at least 0.27MB is required to buffer all
of the data on the wire.
RED HAT | Andrew Nelson19/47
Little's Law
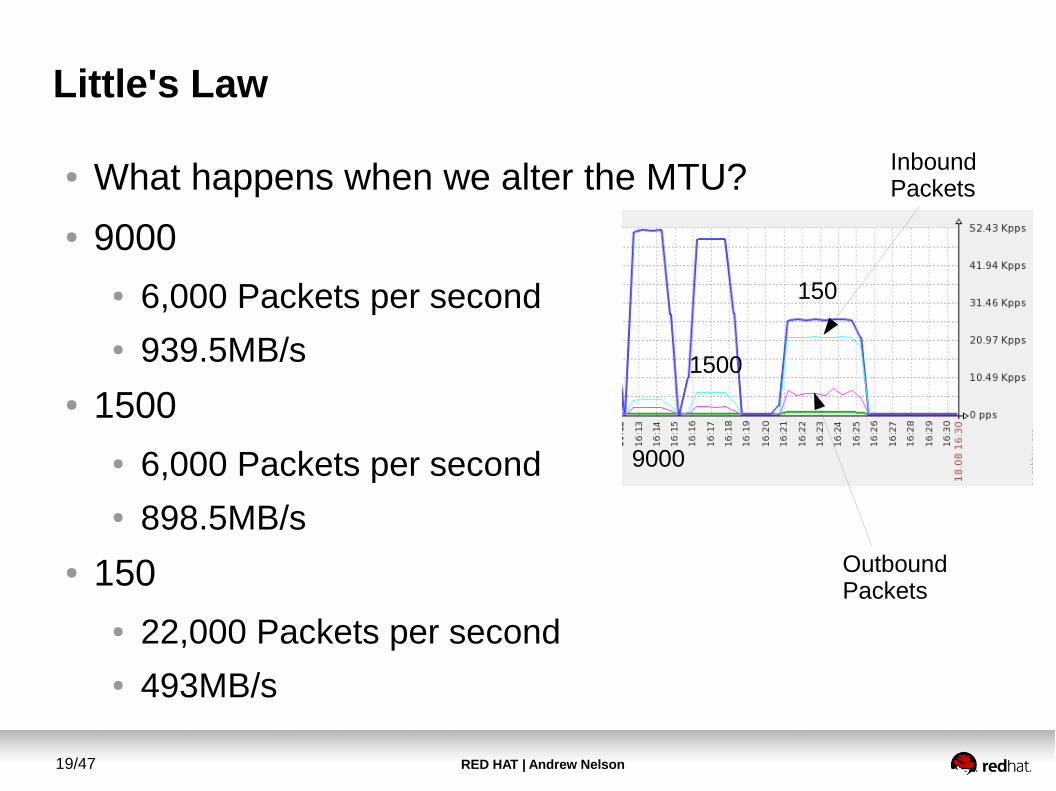
● What happens when we alter the MTU?
● 9000● 6,000 Packets per second● 939.5MB/s
● 1500● 6,000 Packets per second● 898.5MB/s
● 150● 22,000 Packets per second● 493MB/s
9000
1500
150
Outbound Packets
InboundPackets

RED HAT | Andrew Nelson20/47
Little's law in action.
● There are numerous ways to utilize Little's law in monitoring.
● IO requests in flight for disks● Network buffer status● Network packets per second.● Processor load● Time to service a request
RED HAT | Andrew Nelson21/47
Little's law in action.
● Apache is the foundation for many enterprise and SAS products, so how can we monitor it's performance in Zabbix?
● Normal approaches involved parsing log files, or parsing the status page
● The normal ways don't tend to work well with Zabbix, however we can use a script to parse the logs in realtime from Zabbix and use a file socket for data output.

RED HAT | Andrew Nelson22/47
Little's law in action.
● Two pieces are involved in pumping data from Apache into Zabbix.
● First we build a running counter via a log pipe to a script# YYYYMMDD-HHMMSS Path BytesReceived BytesSent TimeSpent MicrosecondsSpent
LogFormat "%{%Y%m%d-%H%M%S}t %U %I %O %T %D" zabbix-log
CustomLog "|$/var/lib/zabbix/apache-log.rb >>var/lib/zabbix/errors" zabbix-log
● This creates a file socket:$ cat /var/lib/zabbix/apache-data-out
Count Received Sent total_time total_microsedonds
4150693 573701315 9831930078 0 335509340

RED HAT | Andrew Nelson23/47
Little's law in action.
● Next we push that data via a client side script using Zabbix_sender$ crontab -e
*/1 * * * * /var/lib/zabbix/zabbix_sender.sh
● And import the template

Let's see if we can find the peak performance with Zabbix

RED HAT | Andrew Nelson25/47
The test environment
Storage Server
Physical System(desktop)
Infiniband
GigE
Router/Firewall100Mbit
Hypervisor 1(Terry)
Hypervisor 2(Sherri)
Zabbix Server NOTE: See last slides for more details

RED HAT | Andrew Nelson26/47
What are we looking for
● It is normal to be somewhat unsure initially, investigative testing will help shape this.
● Some form of saturation will be reached, hopefully on the server.
● Saturation will take one or both of the following forms● Increased time to service
● Request queues (or buffers) are full, meaning overall increased time to service the queue
● Failure to service● Queue is full and the request will not be serviced. The server
will issue an error, or the client will time out.

RED HAT | Andrew Nelson27/47
Finding Peak Performance, initial test
● Tests were run from system “Desktop”
● Apache reports 800 connections per second.
● Processor load is light.
Test Window

RED HAT | Andrew Nelson28/47
Finding Peak Performance, initial test
● Network shows a plateau, but not saturation on the client.
● Plateau is smooth in appearance
● Neither of the two cores appears very busy.
Test Window

RED HAT | Andrew Nelson29/47
Finding Peak Performance, initial test
● Apache server seems to report that it responds faster with more connections
● Zabbix web tests show increased latency
Test Window

RED HAT | Andrew Nelson30/47
Finding Peak Performance, initial test
● The actual data from Jmeter● Appearance of smooth steps and plateau

RED HAT | Andrew Nelson31/47
Finding Peak Performance, Initial analysis
● Reduced response latency may be due to processor cache.
● Connections are repetitive potential leading to greater cache efficiency.
● Network appears to be the bottleneck.● During tests some Zabbix checks were timing out to the
test server and other systems behind the firewall/router● Router showed very high CPU utilization.
● Jmeter does not show many connection errors.● Network layer is throttling connections

RED HAT | Andrew Nelson32/47
Finding Peak Performance, Initial analysis
● More testing needed● Tests need to come from a system on the same VLAN
and switch as the server and not traverse the router.● A wise man once said:
I need a little more Cowbell (aka testing)

RED HAT | Andrew Nelson33/47
Finding Peak Performance, second test
● Testing from another VM with full 1Gb links to test server
● Based on concurrent connections count, it seems an upper limit has again been found.
● Graph is not smooth at plateau
● CPU exhibits greater load, but overall still low
Test Window

RED HAT | Andrew Nelson34/47
Finding Peak Performance, second test
● Network no longer appears to be the bottleneck
● Rough “saw-tooth” plateau noted
● CPU Utilization follows picture of load, but it would seem there is still CPU capacity left.
Test Window

RED HAT | Andrew Nelson35/47
Finding Peak Performance, second test
● Apache again appears to respond faster under load than when idle
● Reduced latency shows smooth appearance
● Zabbix tests do not show any change in Apache performance. The router is back to “normal” load.
Test Window
RED HAT | Andrew Nelson36/47
Finding Peak Performance, second test
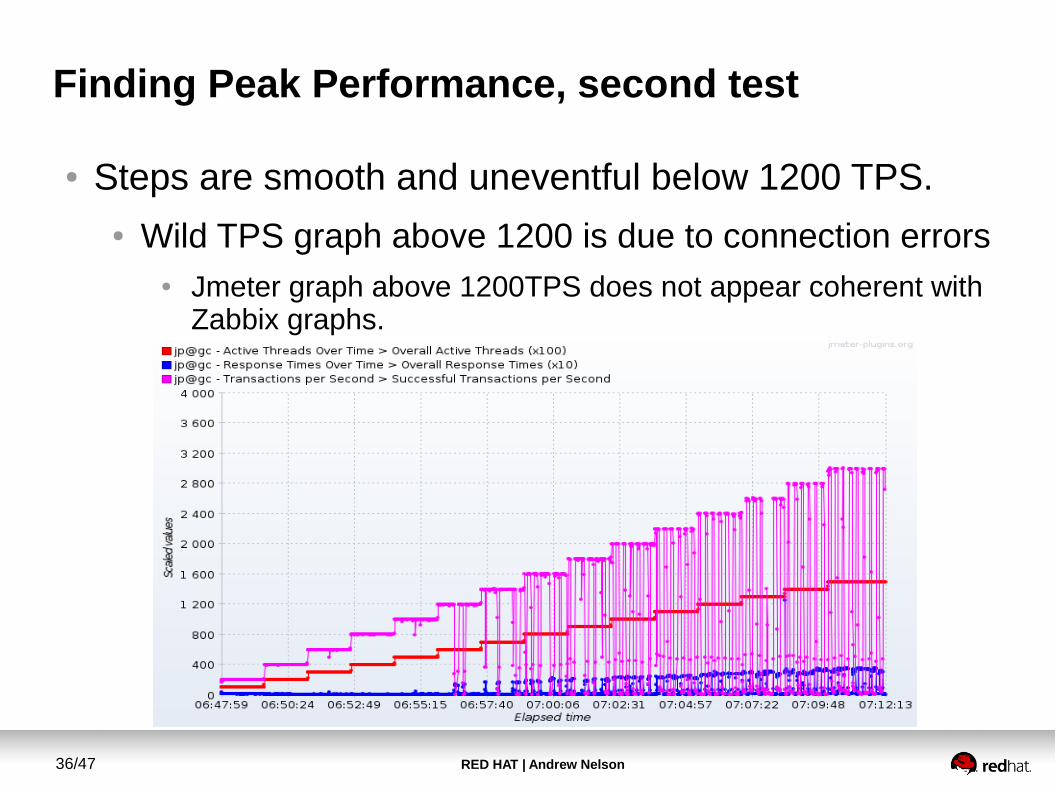
● Steps are smooth and uneventful below 1200 TPS.● Wild TPS graph above 1200 is due to connection errors
● Jmeter graph above 1200TPS does not appear coherent with Zabbix graphs.

RED HAT | Andrew Nelson37/47
Finding Peak Performance, Second analysis
● It would appear reduced response latency is likely due to to processor cache as noted before.
● Increased rate of repetitiveness reduced latency further.● Network did not appear to be the bottleneck
● Connection errors were noted in Jmeter tests as would be expected for a saturated server.
● Based on Jmeter and Zabbix data peak performance for this server with the test web page is about 1,200 pages per second
● What if we couldn't max out performance, are there other ways to find it?

Conclusion

RED HAT | Andrew Nelson39/47
One more story...
● Host was a member of a 16 node GFS2 Cluster
● Java containers were running on the host which pre-allocated memory.
● vm.swappiness was set to 0
● OS had about 200MB of memory available for itself and appeared to spend 100% of one core's time in IO wait.

RED HAT | Andrew Nelson40/47
One more story...

RED HAT | Andrew Nelson41/47
One more story...

RED HAT | Andrew Nelson42/47
Conclusion
● Clearly define the problem
● Understand what the tests are before testing
● It is possible to use similar techniques to tuning for long term monitoring
● Sometimes the results you get are not what you expected.
● Software developers are bad at exposing performance metrics for use by external software.
● DOCUMENT, DOCUMENT, DOCUMENT!
RED HAT | Andrew Nelson43/47
Questions
Fragenjautājumi
質問pytania
vragen
kysymykset
питаннявопросы
spørgsmål domande
preguntas
otázky

RED HAT | Andrew Nelson44/47
Source Code
● Scripts and template used are available on GitHub● https://github.com/red-tux/zbx-apache
RED HAT | Andrew Nelson45/47
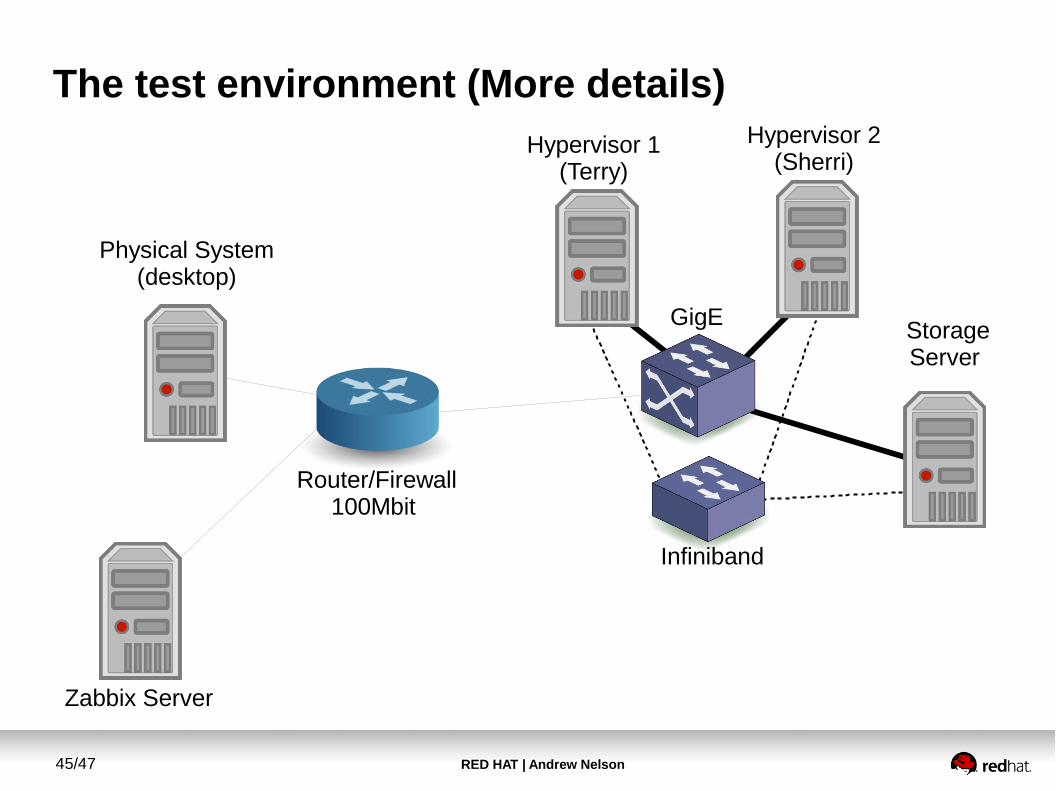
The test environment (More details)
Storage Server
Physical System(desktop)
Infiniband
GigE
Router/Firewall100Mbit
Hypervisor 1(Terry)
Hypervisor 2(Sherri)
Zabbix Server

RED HAT | Andrew Nelson46/47
The test environment (More details)
● Hypervisors are Red Hat Virtualization 3.3 (RHEV)● Guests are RHEL6
● Test server is configured with 2GB of RAM and 2 CPU cores
● Storage for guests is via iSCSI over Infiniband
● Switch and Firewall are small Enterprise grade Juniper equipment.
● Main Router/Firewall has 100Mbit interfaces● All networks are VLANed● Hypervisors are LACP bonded to the internal network

RED HAT | Andrew Nelson47/47
The test environment (More details)
● Test page is a simple “Hello world” with a small embedded graphic. Two connections equals one page load.
● Apache was configured to use the aforementioned logging script
● JMeter was used to generate the client test loads
● Zabbix was configured perform a web test as well to track response times from the Zabbix server.


