16
Performance tuning: Huge Pages in Linux By Riyaj Shamsudeen
| Date post: | 06-Mar-2018 |
| Category: |
Documents |
| Upload: | duongthien |
| View: | 225 times |
| Download: | 1 times |

Performance tuning: Huge Pages in Linux
ByRiyaj Shamsudeen

3
Who am I?
16 years using Oracle products Over 15 years as Oracle DBA Certified DBA versions 7.0,7.3,8,8i &9i Specializes in performance tuning, Internals and E-business suite Currently working for The Pythian Group www.pythian.com OakTable member Email: rshamsud at gmail.com Blog : orainternals.wordpress.com

4
Disclaimer
These slides and materials represent the work and opinions of the author and do not constitute official positions of my current or past employer or any other organization. This material has been peer reviewed, but author assume no responsibility whatsoever for the test cases.
If you corrupt your databases by running my scripts, you are solely responsible for that.
This material should not should not be reproduced or used without the authors' written permission.

RMOUG 2008 : Riyaj Shamsudeen
Problem description
Database was intermittently freezing and business was severely affected.
This is a central database and client had already worked with vendor support and problem was still unresolved.
Symptom: High Kernel mode CPU usage intermittently in a 4 CPU dual core, hyper threading enabled Linux server.

RMOUG 2008 : Riyaj Shamsudeen
CPU usage07:20:01 AM CPU %user %nice %system %iowait %idle
07:30:01 AM all 4.85 0.00 77.40 4.18 13.58
07:40:01 AM all 16.44 0.00 2.11 22.21 59.24
07:50:01 AM all 23.15 0.00 2.00 21.53 53.32
08:00:01 AM all 30.16 0.00 2.55 15.87 51.41
08:10:01 AM all 32.86 0.00 3.08 13.77 50.29
08:20:01 AM all 27.94 0.00 2.07 12.00 58.00
08:32:50 AM all 25.97 0.00 25.42 10.73 37.88
08:40:02 AM all 16.40 0.00 69.21 4.11 10.29
08:50:01 AM all 35.82 0.00 2.10 12.76 49.32
09:00:01 AM all 35.46 0.00 1.86 9.46 53.22
09:10:01 AM all 31.86 0.00 2.71 14.12 51.31
09:20:01 AM all 26.97 0.00 2.19 8.14 62.70
09:30:02 AM all 29.56 0.00 3.02 16.00 51.41
09:40:01 AM all 29.32 0.00 2.62 13.43 54.62
09:50:01 AM all 21.57 0.00 2.23 10.32 65.88
10:00:01 AM all 16.93 0.00 3.59 14.55 64.92
10:10:01 AM all 11.07 0.00 71.88 8.21 8.84
10:20:01 AM all 46.08 0.00 6.35 21.03 26.54
10:30:01 AM all 43.66 0.00 3.34 13.80 39.20
10:41:54 AM all 38.15 0.00 17.54 11.68 32.63
10:50:01 AM all 16.05 0.00 66.59 5.38 11.98
11:00:01 AM all 39.81 0.00 2.99 12.36 44.85

RMOUG 2008 : Riyaj Shamsudeen
CPU usage
07:4
0
07:5
0
08:0
0
08:1
0
08:2
0
08:3
2
08:4
0
08:5
0
09:0
0
09:1
0
09:2
0
09:3
0
09:4
0
09:5
0
10:0
0
10:1
0
10:2
0
0
10
20
30
40
50
60
70
80
%SYS CPU usage
CPU usage spikes in kernelmode intermittently

RMOUG 2008 : Riyaj Shamsudeen
Tools?
Client was using few tools, but none of the tools were helpful in this case.
Well problem is that those tools are averaging out over a longer period of time and doesn't show any issues.
We decided to look at all statistics at 8:40AM and 10:10AM
RMOUG 2008 : Riyaj Shamsudeen
Sar -r
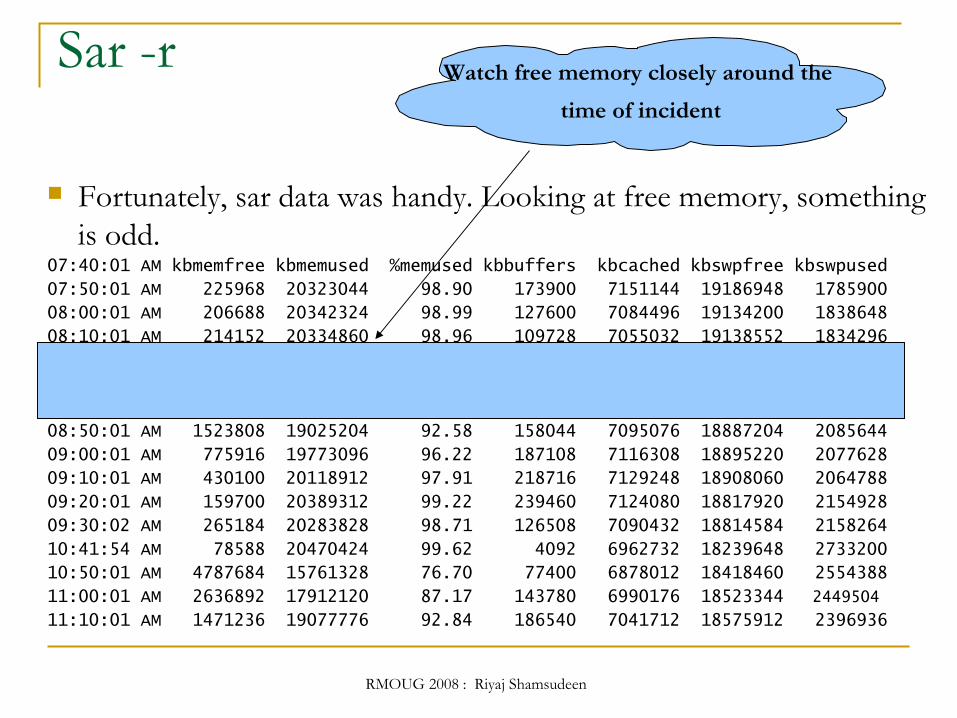
Fortunately, sar data was handy. Looking at free memory, something is odd.
07:40:01 AM kbmemfree kbmemused %memused kbbuffers kbcached kbswpfree kbswpused
07:50:01 AM 225968 20323044 98.90 173900 7151144 19186948 1785900
08:00:01 AM 206688 20342324 98.99 127600 7084496 19134200 1838648
08:10:01 AM 214152 20334860 98.96 109728 7055032 19138552 1834296
08:20:01 AM 209920 20339092 98.98 21268 7056184 19139548 1833300
08:32:50 AM 86176 20462836 99.58 8240 7040608 19018136 1954712
08:40:02 AM 1157520 19391492 94.37 79096 7012752 18753272 2219576
08:50:01 AM 1523808 19025204 92.58 158044 7095076 18887204 2085644
09:00:01 AM 775916 19773096 96.22 187108 7116308 18895220 2077628
09:10:01 AM 430100 20118912 97.91 218716 7129248 18908060 2064788
09:20:01 AM 159700 20389312 99.22 239460 7124080 18817920 2154928
09:30:02 AM 265184 20283828 98.71 126508 7090432 18814584 2158264
10:41:54 AM 78588 20470424 99.62 4092 6962732 18239648 2733200
10:50:01 AM 4787684 15761328 76.70 77400 6878012 18418460 2554388
11:00:01 AM 2636892 17912120 87.17 143780 6990176 18523344 2449504
11:10:01 AM 1471236 19077776 92.84 186540 7041712 18575912 2396936
Watch free memory closely around the time of incident

RMOUG 2008 : Riyaj Shamsudeen
Data analysis
It is evident that free memory dropped to a smaller value. Then, free memory went up by couple of Mbs. We can derive two things:
Enormous memory pressure at 8:32 Memory was released back at 8:40
Of course, there is paging and swapping going on. But, can that be justify high CPU usage in kernel mode? What about database freeze?

RMOUG 2008 : Riyaj Shamsudeen
Memory breakup!
Server has 20GB of memory. SGA uses approximately 10GB. Database uses direct I/O and so
UNIX buffer usage must be minimal. PGA target is 2GB and maximum ever allocated is 800MB. No other application running in that database. Connection count is 500. So, where is remaining 9GB is used? Client argument is that there shouldn't be any paging or
swapping.

RMOUG 2008 : Riyaj Shamsudeen
Memory breakup!
cat /proc/meminfo
MemTotal: 20549012 kB
MemFree: 236668 kB
Buffers: 77800 kB
Cached: 7189572 kB
SwapCached: 108332 kB
Active: 9738788 kB
Inactive: 55376 kB
HighTotal: 0 kB
HighFree: 0 kB
LowTotal: 20549012 kB
LowFree: 236668 kB
SwapTotal: 20972848 kB
SwapFree: 18600172 kB
Dirty: 556 kB
Writeback: 0 kB
Mapped: 9672544 kB
Slab: 162968 kB
CommitLimit: 31247352 kB
Committed_AS: 42142384 kB
PageTables: 5007924 kB
VmallocTotal: 536870911 kB
VmallocUsed: 275316 kB
VmallocChunk: 536595383 kB
HugePages_Total: 0
HugePages_Free: 0
Hugepagesize: 2048 kB
5GB allocated for PageTablesalone!
RMOUG 2008 : Riyaj Shamsudeen
Memory breakup!
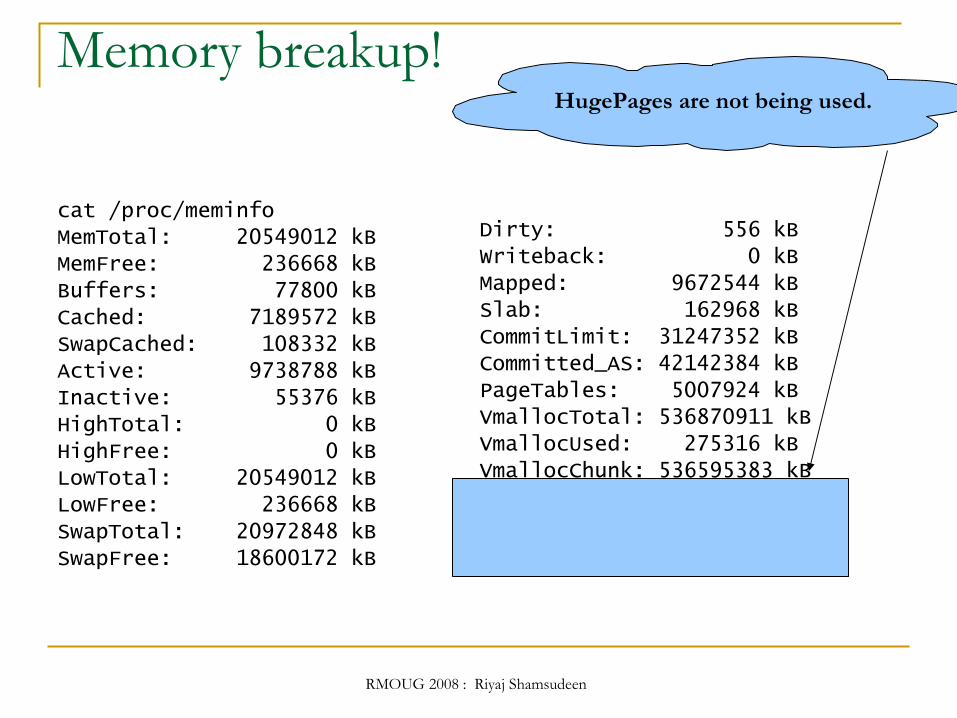
cat /proc/meminfo
MemTotal: 20549012 kB
MemFree: 236668 kB
Buffers: 77800 kB
Cached: 7189572 kB
SwapCached: 108332 kB
Active: 9738788 kB
Inactive: 55376 kB
HighTotal: 0 kB
HighFree: 0 kB
LowTotal: 20549012 kB
LowFree: 236668 kB
SwapTotal: 20972848 kB
SwapFree: 18600172 kB
Dirty: 556 kB
Writeback: 0 kB
Mapped: 9672544 kB
Slab: 162968 kB
CommitLimit: 31247352 kB
Committed_AS: 42142384 kB
PageTables: 5007924 kB
VmallocTotal: 536870911 kB
VmallocUsed: 275316 kB
VmallocChunk: 536595383 kB
HugePages_Total: 0
HugePages_Free: 0
Hugepagesize: 2048 kB
HugePages are not being used.

RMOUG 2008 : Riyaj Shamsudeen
Page size
OS page size is 4KB. 20GB /4KB is 5.2 million OS pages. SGA is part of these 5.2 million OS pages. Just like any other memory page, SGA buffers also can be paged
out. If there is a free memory need, then kscand/kswapd scans 5.2
million OS pages looking to free memory. That's why we had all CPUs used by kernel trying to free memory
during memory starvation.

RMOUG 2008 : Riyaj Shamsudeen
Solution
Fix is easy enough. We need to reduce pagetables size and reduce pages needed to be
scanned by kscand/kswapd. Enter hugepages. We setup SGA to use hugepages. SGA using hugepages is locked
in memory and not page dout. Pagetables size went down to 200MB or so. Database performance was within acceptable level.

16
References
Oracle support site. Metalink.oracle.com. Various documents Internal’s guru Steve Adam’s websitewww.ixora.com.au Jonathan Lewis’ websitewww.jlcomp.daemon.co.uk Julian Dyke’s websitewww.julian-dyke.com ‘Oracle8i Internal Services for Waits, Latches, Locks, and Memory’ by Steve Adams Tom Kyte’s websiteAsktom.oracle.com Blog: http://orainternals.wordpress.com


